METHODS published: 22 March 2018 doi: 10.3389/fenvs.2018.00014 Frontiers in Environmental Science | www.frontiersin.org 1 March 2018 | Volume 6 | Article 14 Edited by: José Manuel Mirás-Avalos, Universidade de Santiago de Compostela, Spain Reviewed by: Sven Marhan, University of Hohenheim, Germany Claudio Lovisolo, Università degli Studi di Torino, Italy *Correspondence: Dominika Kundel dominika.kundel@fibl.org † These two authors share first authorship. Specialty section: This article was submitted to Agroecology and Land Use Systems, a section of the journal Frontiers in Environmental Science Received: 14 December 2017 Accepted: 08 March 2018 Published: 22 March 2018 Citation: Kundel D, Meyer S, Birkhofer H, Fliessbach A, Mäder P, Scheu S, van Kleunen M and Birkhofer K (2018) Design and Manual to Construct Rainout-Shelters for Climate Change Experiments in Agroecosystems. Front. Environ. Sci. 6:14. doi: 10.3389/fenvs.2018.00014 Design and Manual to Construct Rainout-Shelters for Climate Change Experiments in Agroecosystems Dominika Kundel 1,2 * † , Svenja Meyer 3† , Herbert Birkhofer 4 , Andreas Fliessbach 1 , Paul Mäder 1 , Stefan Scheu 3 , Mark van Kleunen 2,5 and Klaus Birkhofer 6 1 Soil Sciences Department, Research Institute of Organic Agriculture (FiBL), Frick, Switzerland, 2 Department of Biology, University of Konstanz, Konstanz, Germany, 3 Animal Ecology, J.F. Blumenbach Institute for Zoology and Anthropology, University of Göttingen, Göttingen, Germany, 4 Product Development and Machine Elements, Faculty of Mechanical and Process Engineering, Darmstadt University of Technology, Darmstadt, Germany, 5 Zhejiang Provincial Key Laboratory of Plant Evolutionary Ecology and Conservation, Taizhou University, Taizhou, China, 6 Department of Ecology, Brandenburg University of Technology, Cottbus, Germany Climate change models predict reduced summer precipitations for most European countries, including more frequent and extreme summer droughts. Rainout-shelters which intercept part of the natural precipitation provide an effective tool to investigate effects of different precipitation levels on biodiversity and ecosystem functioning. In this study, we evaluate and describe in detail a fixed-location rainout-shelter (2.5 × 2.5 m) with partial interception of natural rainfall. We provide a complete parts list, a construction manual and detailed CAD drawings allowing to rebuild and use these shelters for rainfall manipulation studies. In addition, we describe a rainout-shelter control treatment giving the possibility to quantify and account for potential shelter artifacts. To test the rainout-shelters, we established the following three treatments each in eight winter wheat plots of the agricultural long-term farming system comparison trial DOK in Therwil (Switzerland): (1) A rainout-shelter with 65% interception of rainfall, (2) a rainout-shelter control without interception of rainfall, and (3) an ambient control. The rainout-shelter effectively excluded 64.9% of the ambient rainfall, which is very close to the a priori calculated exclusion of 65.1%. In comparison to the ambient control plots, gravimetric soil moisture decreased under the rainout-shelter by a maximum of 11.1 percentage points. Air temperature under the rainout-shelter differed little from the ambient control (−0.55 ◦ C in 1.2 m height and +0.19 ◦ C in 0.1 m height), whereas soil temperatures were slightly higher in periods of high ambient temperature (+1.02 ◦ C), but remained basically unaffected in periods of low ambient temperature (+0.14 ◦ C). A maximum edge effect of 0.75 m defined a sampling area of 1 × 1 m under the rainout-shelter. The rainout-shelters presented here, proved to sustain under heavy weather and they were well-suited to be used in agricultural fields where management operations require the removal of the rainout-shelters for management operations. Overall, the results confirmed the good performance of the presented rainout-shelters regarding rainout-shelter artifacts, predictable rain exclusion, and feasibility for experimental studies in agricultural fields. Keywords: rainout-shelter design, summer drought, climate change, precipitation, wheat, CAD drawings
Transcript
METHODSpublished: 22 March 2018
doi: 10.3389/fenvs.2018.00014
Frontiers in Environmental Science | www.frontiersin.org 1 March 2018 | Volume 6 | Article 14
Kundel et al. Rainout-Shelter Manual for Agricultural Fields
INTRODUCTION
Climate change models predict a future increase in temperatureand altered precipitation regimes for Central Europe (Russoet al., 2013; Spinoni et al., 2015; EEA, 2017) as well as ona global scale (IPCC, 2014). For Switzerland, average annualprecipitation is predicted to decrease by 21–28% by theend of the century, accompanied by more frequent droughtevents in summer (CH2011, 2011). Temperature and wateravailability are key drivers of ecosystem functioning and effectsof these changing conditions are expected on biotic andabiotic system components (Porporato et al., 2004). Effects ofaltered precipitation are primarily documented from forest andgrassland ecosystems (Blankinship et al., 2011), with far fewerstudies from agroecosystems (Wu et al., 2011; Beier et al., 2012).Models for agricultural systems predict an increased risk ofcrop yield loss due to higher seasonal variation in precipitationand more frequent water shortages during the growing season(Olesen and Bindi, 2002; Falloon and Betts, 2010; Trnka et al.,2011; EEA, 2017). In order to understand how climate changeaffects biotic and abiotic components in agroecosystems, itis crucial to simulate such precipitation regimes under fieldconditions.
Field studies that experimentally alter rainfall primarily userainout-shelters to exclude ambient precipitation from a pre-defined experimental area. One group of shelter types providesa complete or almost complete exclusion of precipitation bypermanently closed roofs (Svejcar et al., 1999; Fay et al., 2000;Poll et al., 2013; Prechsl et al., 2015) or by roofs that are closingautomatically during rain events (Mikkelsen et al., 2008; Parraet al., 2012). Roofs that only close during rain events minimizeunintended shelter effects on the microclimate, as they are onlyclosed for short periods of time (closed for <5% of daytime,Mikkelsen et al., 2008). Yet, these roofs do not operate duringstrong wind, which often coincides with rainfall events andtherefore do not exclude 100% of precipitation. The need fora motor and an electricity source for each roof makes thisrainout-shelter type very costly for experimental designs withreplicated sites and time consuming in terms of maintenance.Fixed rainout-shelters with permanently closed roofs, on theother hand, are often suitable for long-term studies. However,a complete exclusion of precipitation by a permanent roofinevitably has effects on the microclimate, such as alterationsof air temperature and photosynthetic active radiation (PAR)(Beier et al., 2012). Further, in long-term studies, complete roofsnecessarily need extra irrigation systems, otherwise they do notreflect realistic conditions under climate change as predicted forthe next 50–100 years in most regions of Europe.
Major problems of permanent roofs relevant for biota andecosystem processes include in particular passive warming(Svejcar et al., 1999; Fay et al., 2000; Vogel et al., 2013)and reduced PAR (Svejcar et al., 1999; Vogel et al., 2013).Reduced air circulation under complete exclusion roofs maylower the vapor-pressure deficit (VPD) and thereby reduceevapotranspiration, which in turn lowers the water demandof plants. The combination of complete exclusion roofs withirrigation systems that recirculate the intercepted rain water
back onto the plots allows for flexible control of the amount ofexcluded precipitation (Svejcar et al., 1999; Fay et al., 2003; Castroet al., 2010), but holds the risk of changes in water chemistry(Beier et al., 2012). Again, such systems cannot be installedwithout access to electricity. Side-effects due to reduced aircirculation and changes in water chemistry are limited by usingroofs that only partially exclude rain (Yahdjian and Sala, 2002;Gimbel et al., 2015; Canarini et al., 2016). These roofs can furtherbe designed to exclude pre-defined amounts of precipitation(e.g., according to predicted climate scenarios) during long-term experiments (Yahdjian and Sala, 2002). These authors usedV-shaped acrylic bands (Figure 1C), which function as gullies tolead the water away and can have varying spacing in between toexclude pre-defined amounts of rain while minimizing effects onother environmental variables.
Here, we propose a revised design of the rainout-sheltersby Yahdjian and Sala (2002) for the use in arable cropfields. We inspected potential side-effects of our design andprovide a parts list, a construction manual and detailedCAD drawings (computer aided design) to allow constructionof such rainout-shelters. The type of acrylic glass used forour rainout-shelters is highly UV-transparent, which is a majorimprovement over previously used shelter designs. We testedthe effect of these rainout-shelters on basic abiotic conditionsin cereal fields in an agricultural long-term experiment inSwitzerland (DOK Trial, Mäder et al., 2002). To disentangleintended effects of the manipulated precipitation regimefrom unintended artifacts of the rainout-shelters, we furtherestablished two sets of control plots. Besides undisturbed plotsthat received ambient precipitation, we installed a replicated setof rainout-shelters that were identical to our original rainout-shelters, but allowed all natural precipitation to reach thearea under the rainout-shelter (V-bands were turned over tobecome 3-bands). The partial reduction of rainfall simulated byour rainout-shelters reflects predictions of future precipitationchanges during the crop growing season in Central Europe(Russo et al., 2013; Spinoni et al., 2015; EEA, 2017). Our rainout-shelters are suitable for studies in a wide range of ecosystems,including agricultural systems, as they are both stable enough toendure extreme weather events in open land and are removableto allow for management activities. It is further possible to adaptthe amount of excluded rainfall according to the needs of astudy by adjusting the distance between the V-bands. In thismanuscript, we provide a detailed description and evaluation ofthe proposed rainout-shelter design and discuss the performanceof rainout-shelters considering intended and unintended effectson microclimate, soil moisture and edge effects.
MATERIALS AND METHODS
Site Description and Design of DroughtManipulation ExperimentWe established rainout-shelters in the “DOK” farming systemtrial (bioDynamic, bioOrganic, Konventionell, Mäder et al.,2002). The DOK trial has been established in 1978 by theSwiss Federal Research Station for Agroecology and Agriculture
Frontiers in Environmental Science | www.frontiersin.org 2 March 2018 | Volume 6 | Article 14
Kundel et al. Rainout-Shelter Manual for Agricultural Fields
FIGURE 1 | (A) A metal frame (2.5 × 2.5m) serves as the basic rainout-shelter construction, the shelter is anchored in the soil using drive-in sleeves; (B) acrylic glass
bands are fixed to the steel frame by specially designed holders; (C) the metal frame supports V-shaped clear acrylic glass bands in which rainfall is collected; (D) rain
gutter holder consist of pipe clamp, adapter plate, and gutter bracket (view from the rear); (E) a T-pipe connector with adaptor piece holds the drain pipe in place;
(F) the final rainout-shelter with partial rainfall interception and precipitation collection.
(Zürich-Reckenholz, Switzerland) and the Research Instituteof Organic Agriculture (Frick, Switzerland) to compare theproduction levels of arable crops under different organic andconventional farming systems (Fliessbach et al., 2007). The trialsite is located in the Leimen valley near Basel, Switzerland(47◦30′09.3′′N 7◦32′21.5′′E, 300 a.s.l.) and has a slope of 3–5% in S-N-direction. Mean annual temperature at the siteis 9.5◦C and mean annual precipitation is 785mm. The soil(15% clay, 70% silt, 15% sand, Fliessbach et al., 2007) at thesite is a haplic luvisol on deposits of alluvial loess (Mäderet al., 2002). Soils in plots where the roofs were installedcontained on average 11.9mg organic carbon per gram ofsoil.
The rainout-shelter design we present here was developedin the ERA-Net Biodiversa project “SOILCLIM” (http://www.biodiversa.org/976). The main aim of SOILCLIM is to investigatelinks between soil biodiversity and ecosystem functioning alongnatural and simulated precipitation gradients and different soilorganic matter (SOM) levels.
We established three treatments in four replicated winterwheat (Triticum aestivum L. cv. “Wiwa”) plots (5 × 20m) oftwo farming systems, resulting in 24 subplots. As the aim of thecurrent study was to evaluate the general performance of therainout-shelter, we did not differentiate between the two farmingsystems but treated the plots of the two systems as independentreplicates (n= 8 plots).
The three treatments were (i) a precipitation reductiontreatment with rainout-shelters (R) (ii) a rainout-shelter controltreatment with a modified rainout-shelter that allowed forambient precipitation levels to assess rainout-shelter artifacts
(RC) and (iii) an untreated ambient control without anyrainout-shelter (C). Treatments were established in a row,both at the near and the far end of each plot. In order toprevent mutual interference of rainout-shelter and rainout-shelter control treatments, these were never located side byside (Supplementary Figure 1). Instead, rainout-shelter andrainout-shelter control treatments were always located next tothe ambient control treatment or had no adjacent treatment.Positions of treatments were randomized across the eight plotswithin these limitations, whereas every treatment combinationoccurred twice across the DOK trial. We maintained a distancebetween treatments as well as between treatments and field edgesof at least 0.5m. To avoid potential confounding edge effectssuch as lateral inflow of precipitation on our measurements,we determined all abiotic conditions only in the center of eachplot (1.5 × 1m). Approximately 2 month after rainout-shelterestablishment, we quantified this edge effect by measuringgradients in soil humidity (see section Data Collection fordetails).
GS 2458, Evonik Perfomances Materials GmbH, Darmstadt,Germany). Each band had a length of 2,500mm, an innerflange leg length of 96mm, an angle of 90◦ and a thickness of3mm. According to Equation 1, 12 acrylic bands should exclude65% of the ambient precipitation. The amount of interceptedprecipitation can easily be adjusted by changing the number of
Frontiers in Environmental Science | www.frontiersin.org 3 March 2018 | Volume 6 | Article 14
Kundel et al. Rainout-Shelter Manual for Agricultural Fields
bands (see also Yahdjian and Sala, 2002).
Intercepted precipitation [%] =N ∗Width of band
Shelter width∗ 100% (1)
Equation (1): Amount of precipitation intercepted (%) bynumber of bands (N). For the current design: N = number ofbands (here 12), width of the bands: 135.8mm, shelter width:2,500mm.
In order to alter natural light conditions as little as possible,we chose a roof band material that is as permeable for the fullrange of PAR and transparent for most wavelengths of UV-a and-b radiation (Transmission: 380–780 nm ≥90%, 315 nm ≥80%),but is still resistant against weathering and possible damageunder field conditions [for details see http://www.plexiglas.de/sites/lists/PM/DocumentsAP/222-6-PLEXIGLAS-GS-UV-durchlaessig-de.pdf (in German)]. The acrylic bands were fixedto the steel frame by custom-made holders (Figure 1B) on thefront steel pipe and an additional central parallel steel pipe(Figure 1C). The rainout-shelters have a maximum height of1.7m and a minimum height of 1.2m, resulting in an inclineof 13◦, which guarantees water run-off, but the incline canbe adjusted if required. The horizontal roof parts rest on foursupporting steel pipes anchored in the soil using commerciallyavailable metal drive-in sleeves (Figure 1A). This constructionallows to temporarily remove the rainout-shelter duringmanagement actions without much effort. Shelters were locatedwith the lower side facing west, as this is the prevailing winddirection at the study site. Water that was collected by the acrylicbands was channeled via rain gutters (Figures 1D,E) at the lowerside of the steel frame into 310 L rain barrels (Figure 1F). Thisprevented a reflux of water onto the experimental plot underthe roof and allowed to measure the amount of interceptedprecipitation.
As mentioned above, we established a rainout-shelter controltreatment that was identical to the rainout-shelter except thatthe 12 V-shaped acrylic glass bands were turned over allowingthe precipitation to fall onto the plot under the rainout-sheltercontrol. This treatment made it possible to quantify potentialartifacts. More details on the parts and the assembly of therainout-shelters are given in Supplementary Tables 1, 2. A blank-free cutting plan for the pipes, the distances between band holdersand details on the adaptor plates for the rain-gutter brackets, theholders for the acrylic glass bands and the clamping claws areshown in Supplementary Figures 7–12. One rainout-shelter as wepresent it in this study costs 730e (630e for a control shelter).
Data CollectionTo assess the actual percentage of precipitation interceptedby the rainout-shelters, we used the precipitation datafrom a close-by weather station in Therwil, Switzerland(http://www.bodenmessnetz.ch/messwerte/datenabfrage)as well as data from the on-field meteorological station(Campbell-CR1000) and regularly measured the amountof intercepted precipitation in the rain barrels. We thensubtracted the average amount of precipitation collectedin the rain barrels from the amount of rain that fell on
the ambient control plot (6.25 m2) to calculate the actualpercentage of precipitation that was intercepted by therainout-shelters.
From April to June 2017 we took weekly measurementsat three randomly chosen locations within the center of all24 subplots to assess volumetric soil water content in 0–6 cmdepth (in approx. 75 cm3 soil) using a handheld Time DomainReflectometry (TDR)-device (ML-2x ThetaProbe, Delta-T). Eachmonth, we sampled soil in the center of all experimental plots(0–20 cm depth), oven-dried the soil sample to constant weight,and calculated the soil water content (% water, based on g H2O/gdry weight). In May 2017, we assessed the extent of lateralwater movement (“edge effect”) under the rainout-shelter andthe rainout-shelter control in a subset of 2 plots, each alongtransects from north to south and from west to east (see alsoYahdjian and Sala, 2002). Along each transect, we measuredthe volumetric water content using the TDR device in 0–6 cmdepth in triplicates at 13 measurement positions (25 cm apartfrom each other, see Supplementary Figure 2). For each transect,rainout-shelter type and plot, we performed a one-way ANOVAto assess the effect of the measurement position (distance fromshelter edge) on the soil water content, followed by a Tukey’shonestly significance post-hoc test. We confirmed the fit of themodels by visual inspection of the residual plots, which didnot reveal any obvious deviations from homoscedasticity ornormality.
We assessed possible shelter effects on the microclimateusing iButtons temperature loggers (DS1922L/T/E/S; accuracy:0.0625◦C, 1 record/h) by constantly measuring air temperatureat a height of 0.1m in the center of the respective subplots(total N = 3 subplots, each one iButton in a rainout-sheltertreatment, a rainout-shelter control treatment and an ambientcontrol treatment), and 1.2m (total N = 6 subplots, eachone iButton per treatment in 2 plots) as well as on soiltemperature at 0.1m depth (total N = 6 subplots, each oneiButton per treatment, 2 plots). For each of the three temperaturedatasets, we calculated a daily mean temperature to determinethe day with the highest and lowest temperature, respectively.We then averaged the individual hourly temperature readingsof the highest temperature day, the respective previous andfollowing day for each of the three treatments to calculatemean differences and standard deviations between rainout-shelter treatments and ambient control plots. We used thisinformation to describe potential shelter artifacts under thetwo most extreme environmental scenarios. In the sameway, we also proceeded with the lowest temperature day.In cases the lowest/highest day was the first/last day of therecording period, we used the two following or preceding days,respectively.
We harvested aboveground biomass of the wheat plants 4, 8,and 13 weeks after rainout-shelter establishment from subplots(20× 50 cm, 2 wheat rows), each subplot located in the core areaof the experimental plots.
The analysis of all data and drawing of all figures (excludingthe CAD drawings) were done using R (R Core Team, 2016)and the package ggplot2 (Wickham, 2009). CAD drawings werecreated with Siemens NX.
Frontiers in Environmental Science | www.frontiersin.org 4 March 2018 | Volume 6 | Article 14
Kundel et al. Rainout-Shelter Manual for Agricultural Fields
RESULTS
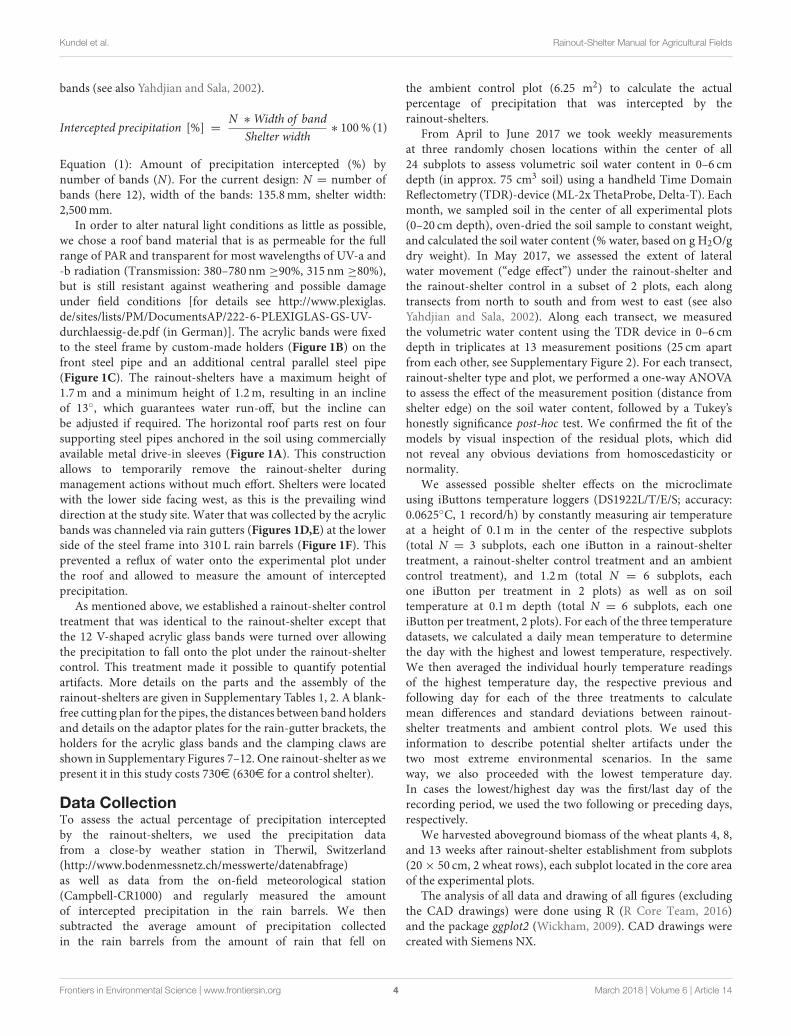
Precipitation Interception, Soil Moisture,and Edge EffectIn total, precipitation under the rainout-shelters was 70.6mm(19th of April to 06th of June 2017) corresponding to aprecipitation reduction of 64.9% as compared to the ambientprecipitation (201.1mm) at the study site. This observed valueis almost identical to the expected precipitation exclusion valuesbased on a priori calculations for a shelter with 12 bands(−65.2%, Equation 1). In the week prior to rainout-shelterestablishment (baseline assessment; T0), all treatment plots hadcomparable soil water contents [ambient control (C): 29.37 ±
1.07% (Mean±SD), rainout-shelter control (RC): 28.87± 1.21%,rainout-shelter (R): 29.10 ± 1.27%; Figure 2A]. There was littleprecipitation between T0 and the first assessment (T1; 21.2mmin 36 days, Figure 2C). Soil water content under both sheltertypes therefore differed only slightly from the ambient controlplots [R: −4.0 percentage points (pp) ± 1.54 pp, n = 8, RC:−1.98 pp ± 1.50 pp, n = 8] at T1 (35 days after rainout-shelter establishment). The amount of precipitation increasedbetween T1 and the second assessment (T2; 121.6mm in 27days; Figure 2C) and we recorded more pronounced differencesin the soil water content between the rainout-shelter treatmentplots and the ambient control plots (R: −11.06 pp ± 0.71 pp, n= 8). In contrast, the soil water content in the rainout-sheltercontrol treatment plots was only weakly lower as compared to theambient control plot (RC: −2.66 pp ± 1.27 pp, n = 8). BetweenT2 and the third assessment (T3), precipitation was low again(75.6mm in 35 days; Figure 2C), and differences between the tworainout-shelters and ambient control decreased (R: −4.68 pp ±
1.65 pp, RC:−2.24 pp± 1.39 pp).Data from weekly soil moisture measurements as determined
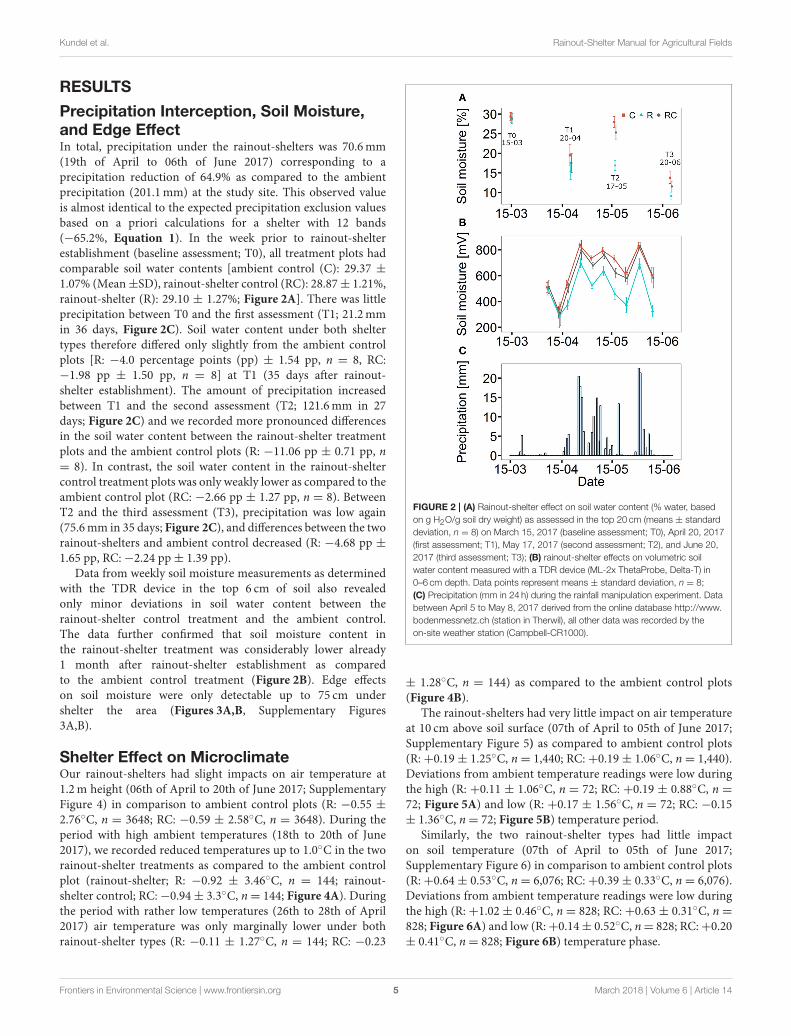
with the TDR device in the top 6 cm of soil also revealedonly minor deviations in soil water content between therainout-shelter control treatment and the ambient control.The data further confirmed that soil moisture content inthe rainout-shelter treatment was considerably lower already1 month after rainout-shelter establishment as comparedto the ambient control treatment (Figure 2B). Edge effectson soil moisture were only detectable up to 75 cm undershelter the area (Figures 3A,B, Supplementary Figures3A,B).
Shelter Effect on MicroclimateOur rainout-shelters had slight impacts on air temperature at1.2m height (06th of April to 20th of June 2017; SupplementaryFigure 4) in comparison to ambient control plots (R: −0.55 ±
2.76◦C, n = 3648; RC: −0.59 ± 2.58◦C, n = 3648). During theperiod with high ambient temperatures (18th to 20th of June2017), we recorded reduced temperatures up to 1.0◦C in the tworainout-shelter treatments as compared to the ambient controlplot (rainout-shelter; R: −0.92 ± 3.46◦C, n = 144; rainout-shelter control; RC:−0.94± 3.3◦C, n= 144; Figure 4A). Duringthe period with rather low temperatures (26th to 28th of April2017) air temperature was only marginally lower under bothrainout-shelter types (R: −0.11 ± 1.27◦C, n = 144; RC: −0.23
FIGURE 2 | (A) Rainout-shelter effect on soil water content (% water, based
on g H2O/g soil dry weight) as assessed in the top 20 cm (means ± standard
deviation, n = 8) on March 15, 2017 (baseline assessment; T0), April 20, 2017
(first assessment; T1), May 17, 2017 (second assessment; T2), and June 20,
2017 (third assessment; T3); (B) rainout-shelter effects on volumetric soil
water content measured with a TDR device (ML-2x ThetaProbe, Delta-T) in
0–6 cm depth. Data points represent means ± standard deviation, n = 8;
(C) Precipitation (mm in 24 h) during the rainfall manipulation experiment. Data
between April 5 to May 8, 2017 derived from the online database http://www.
bodenmessnetz.ch (station in Therwil), all other data was recorded by the
on-site weather station (Campbell-CR1000).
± 1.28◦C, n = 144) as compared to the ambient control plots(Figure 4B).
The rainout-shelters had very little impact on air temperatureat 10 cm above soil surface (07th of April to 05th of June 2017;Supplementary Figure 5) as compared to ambient control plots(R: +0.19 ± 1.25◦C, n = 1,440; RC: +0.19 ± 1.06◦C, n = 1,440).Deviations from ambient temperature readings were low duringthe high (R: +0.11 ± 1.06◦C, n = 72; RC: +0.19 ± 0.88◦C, n =
72; Figure 5A) and low (R: +0.17 ± 1.56◦C, n = 72; RC: −0.15± 1.36◦C, n= 72; Figure 5B) temperature period.
Similarly, the two rainout-shelter types had little impacton soil temperature (07th of April to 05th of June 2017;Supplementary Figure 6) in comparison to ambient control plots(R: +0.64 ± 0.53◦C, n = 6,076; RC: +0.39 ± 0.33◦C, n = 6,076).Deviations from ambient temperature readings were low duringthe high (R: +1.02 ± 0.46◦C, n = 828; RC: +0.63 ± 0.31◦C, n =
828; Figure 6A) and low (R:+0.14± 0.52◦C, n= 828; RC:+0.20± 0.41◦C, n= 828; Figure 6B) temperature phase.
Frontiers in Environmental Science | www.frontiersin.org 5 March 2018 | Volume 6 | Article 14
Kundel et al. Rainout-Shelter Manual for Agricultural Fields
FIGURE 3 | (A) Assessment of the soil water content under the rainout-shelter
(R) and the rainout-shelter control (RC) using a handheld TDR device (ML-2x
ThetaProbe, Delta-T) in the top 6 cm of soil. Data points represent means ±
standard deviation, n = 3. We measured along transects located (A)
North–South and (B) West-East in two of the eight experimental plots (Plot 2,
see also Supplementary Figure 3) on May 15, 2017. Data was analyzed by a
one-way ANOVA followed by a Tukey’s honestly significance post-hoc test.
Means within treatments not sharing the same letter are significantly different
(Tukey HSD, P < 0.05). Rainout-shelters were located with the lower side
facing west as this is the prevailing wind direction at the study site.
Shelter Effect on Shoot BiomassProductionShoot biomass production was not significantly affected by therain exclusion treatment, neither 4, 8, or 13 weeks after rainout-shelter establishment (data not shown).
DISCUSSION
Previous designs of rainout-shelters revealed severalmethodological challenges. Rainout-shelters should allow fora predictable alteration of the precipitation amount, minimize
FIGURE 4 | Air temperature (◦C) as measured in 1.2m height using iButton
temperature loggers under the rainout-shelter (R), the rainout-shelter control
treatment (RC), and the ambient control plots (C). Data points represent hourly
temperature measurements (means ± standard deviation) of two plots and 3
days during (A) a high temperature phase (June 18–20, 2017) and (B) a low
temperature phase (April 26–28, 2017).
FIGURE 5 | Surface temperature (◦C) as measured in 0.1m height using
iButton temperature loggers under the rainout-shelter (R), the rainout-shelter
control treatment (RC), and the ambient control plots (C). Data points
represent hourly temperature measurements (means ± standard deviation) of
one plots and 3 days during (A) a high temperature phase (May 28–30, 2017)
and (B) a low temperature phase (April 18–20, 2017).
artifacts on microclimatic conditions under the shelter, allowfor replication across larger spatial scales and be stable enoughto persist under field conditions. The rainout-shelter designdescribed here fulfils all these requirements.
Roof PerformanceThe rainout-shelters effectively excluded 64.9% of the ambientprecipitation, very close to the a priori calculated rain exclusionof 65.2%. A precise prediction of the amount of excludedwater depending on the number of acrylic bands in the shelter
Frontiers in Environmental Science | www.frontiersin.org 6 March 2018 | Volume 6 | Article 14
Kundel et al. Rainout-Shelter Manual for Agricultural Fields
FIGURE 6 | Soil temperature (◦C) as measured in 10 cm depth using iButton
temperature loggers under the rainout-shelter (R), the rainout-shelter control
treatment (RC), and the ambient control plots (C). Data points represent hourly
temperature measurements (means ± standard deviation) of two plots and 3
days during (A) a high temperature phase (June 18–20, 2017) and (B) a low
temperature phase (June 6–8, 2017).
construction is thereby possible and provides a crucial tool forthe planning of field experiments.
In addition to measurements of rain drainage and naturalprecipitation levels, soil water content is an important parameterfor the evaluation of the performance of rainout-shelters. Soilwater content was very similar in the rainout-shelter controland the ambient control treatment during the whole samplingcampaign, and lowest in the rainout-shelter treatment for mostof the study period. After an initial phase with similar soilwater content in each of the three treatments, soil water contentwas constantly lower under the rainout-shelter as comparedto the ambient control and the rainout-shelter control plots.The soil water content in the experimental treatments startedto differ after the first heavy rain events supporting results ofprevious studies (Mikkelsen et al., 2008; Vogel et al., 2013).Although the early summer 2017 was characterized by severalshort drought-like periods, the developed rainout-shelters stillresulted in differences in soil water content, making the designalso suitable for regions with drier climatic conditions.
The spatial extent of an edge effect defines the size of thesuitable sampling area under a rainout-shelter. However, onlyfew studies determined edge effects by measurements in thefield (Yahdjian and Sala, 2002; Beier et al., 2004). In this study,the maximum edge effect was 0.75m beyond the edges of the2.5 × 2.5m roof area, resulting in a 1.00 × 1.00m core areareceiving full treatment effect and thereby being available formeasurements. The assessment of edge effects was conductedafter a period of rain events, so that the edge effect of 0.75mcan be considered as the maximum edge effect. The chosendimensions of the rainout-shelters (2.5× 2.5× 1.2–1.7m), whichmainly determine the size of the edge effect, result in a reasonablebalance between available sampling area, handling and materialcosts.
The performance of the rainout-shelter material in terms ofstability and practicability was excellent. The construction wasnot damaged by heavy hail storms or rain events as well astemperatures below 0 and above 30◦C, and the UV transparentbands did not show any signs of weathering over the study period.The plastic rain gutters slightly deformed during hot summerdays and should be replaced by metal rain gutters, especiallyat field sites with higher maximum temperatures. The specificrequirements of field studies in agricultural areas, i.e., the need toremove the shelters for management activities, were successfullymet by our removable rainout-shelter construction (note that atleast four people are needed to move the rainout-shelter). Theworkload for maintenance was limited to the drainage of thewater barrels which took place every 1 to 2 weeks, dependingon precipitation events. This limited workload for maintenanceallows managing several replicated rainout-shelters even if in usefor longer periods of time.
MicroclimateRainout-shelters may cause lower air temperature due to theinterception of radiation (Yahdjian and Sala, 2002), on the onehand, on the other hand a greenhouse effect, enhanced byreduced air flow under shelters, may cause higher temperature(Svejcar et al., 1999; Vogel et al., 2013). Both artifacts may biasthe results of rainout-shelter experiments.
In this study, air temperature at 1.2 and 0.1m height aboveground was little affected by the rainout-shelter, especially duringperiods of low ambient temperature. This suggests that thespacing of the acrylic bands allowed sufficient airflow to preventgreenhouse effects under the rainout-shelters. A setup with moreacrylic bands and subsequently a narrower spacing betweenbands, however, may have stronger impact on the temperatureregimes. The facilitation of air movement is especially crucialin systems with high and dense plant growth such as cerealcrops. In the current study, winter wheat plants in their finalgrowth stages almost reached the height of the rainout-shelter,but temperature measurements still did not indicate greenhouseeffects (Figure 4A). However, differences in air temperaturesof up to 1◦C during periods of high ambient temperatureconfirm the need of a rainout-shelter control treatment. Our datashowed virtually identical temperature under the two rainout-shelter types (Figures 4, 5, Supplementary Figures 4, 5), therebysupporting the suitability of a rainout-shelter control, especiallyunder constantly warm conditions.
Soil temperature was slightly higher under the rainout-shelteras compared to the ambient control, but only during periodsof high ambient temperature and differences to the control plotwere more pronounced under the rainout-shelter than underthe rainout-shelter control (Figure 6). This might be caused bylower soil moisture under the rainout-shelter and consequentlylower total water content that buffer heating of the soil by solarradiation. Accordingly, the soil temperature was highest in therainout-shelter treatment in which soil moisture contents werelowest and only slightly increased in the rainout-shelter controltreatment which had intermediate soil moisture contents. Thisartifact cannot be avoided, because lower soil moisture is the goalof the rainout-shelter.
Frontiers in Environmental Science | www.frontiersin.org 7 March 2018 | Volume 6 | Article 14
Kundel et al. Rainout-Shelter Manual for Agricultural Fields
The interception of radiation was minimized by the useof highly UV-permeable acrylic glass bands as roof material(transmission at 315 nm ≥80, transmission 380–780 nm ≥90%).The use of this material guaranteed natural PAR levels under therainout shelters.
Plant PerformanceThe production of above-ground biomass was not significantlyaffected by the exclusion of rain, neither 4, 8, or 13 weeksafter rainout-shelter establishment.We suspect that the exclusionlevel we selected was not sufficient to dry out the soil withinthe relatively short duration of our experiment. In order toreduce soil moisture also at lower depths, it seems necessaryto extend the duration of the experiment and/or increasethe amount of excluded rainfall. It is notable that in annualcrop fields longer exclusion periods are almost not possibleduring the growing season (tillering to harvest is only a fewmonths) and that a more complete exclusion of rainfall oversuch periods is unrealistic according to all climate changescenarios.
CONCLUSION
The rainout-shelter design presented here is well-suited forexperimental manipulations of precipitation in open landecosystems and agricultural fields in particular. Microclimaticconditions under the rainout-shelter were largely unaffectedand the intended alteration of precipitation levels followedour a-priori calculations. Slightly lower under-shelter airtemperatures during high ambient temperature phases were theonly unintended artifacts we measured. These artifacts werereflected by the rainout-shelter control treatment allowing toaccount for them. Soil moisture differences between the differenttreatments established after the first rain events and remainedpresent throughout the experiment. Animated 3-D drawingsof the rainout-shelter design (note that the PDF reader needsto be able to show animated PDFs), detailed descriptions ofshelter construction, manuals for their setup and a list ofmaterial allow future users to apply the developed design intheir studies. With this study, the authors hope to promotethe use of rainout-shelters to simulate and investigate climatechange effects on agricultural systems, which is crucial giventhe risk of crop yield losses under altered future precipitationregimes.
AUTHOR CONTRIBUTIONS
DK has been involved in the conception of the rainout-sheltersand their set-up, was in charge of the field study, has collectedand analyzed the data and has written the manuscript. SMhas been involved in the rainout-shelter set-up, has collectedand analyzed the data and has written the manuscript. HBhas designed and constructed all major parts of the rainout-shelters, was in charge of the setup manual, the final decisionof materials and suppliers and the CAD drawings. AF has beeninvolved in the conception of the rainout-shelters and the studydesign, and has commented on the manuscript. PM contributedto the conception of the rainout-shelters, was involved in thedevelopment and conductance of the field study in the DOK trialand commented on the manuscript. SS has contributed to therainout-shelter design and commented on the manuscript. MvKhas contributed to the sampling design and statistical analyses,provided the iButtons and commented on the manuscript. KBhas developed the idea for rainout-shelter experiments in theframework of this project, has reviewed the existing literatureon rainout-shelter experiments and has contributed to designdecisions and identification of suitable materials and suppliers.He has contributed to the manuscript.
ACKNOWLEDGMENTS
We thank S. Grau, M. Sauter, F. Perrochet, and J. Meier fortheir help with field work and M. Tichy at Bröking-PlasticGmbH & Co. KG for the detailed advice on acrylic glassoptions. We further acknowledge support by the Open AccessPublication Funds of the Göttingen University. We also thankthe two referees for their constructive input. This researchwas funded through the 2015–2016 BiodivERsA COFUNDcall for research proposals, with the national funders EstonianResearch Council (ETAG), German Research Foundation (DFG),Ministry of Economy and Competitiveness (MINECO), TheSwedish Research Council (Formas), and Swiss National ScienceFoundation (SNSF).
SUPPLEMENTARY MATERIAL
The Supplementary Material for this article can be foundonline at: https://www.frontiersin.org/articles/10.3389/fenvs.2018.00014/full#supplementary-material
REFERENCES
Beier, C., Beierkuhnlein, C., Wohlgemuth, T., Penuelas, J., Emmett, B.,Körner, C., et al. (2012). Precipitation manipulation experiments –challenges and recommendations for the future. Ecol. Lett. 15, 899–911.doi: 10.1111/j.1461-0248.2012.01793.x
Beier, C., Emmett, B., Gundersen, P., Tietema, A., Estiarte, M., Gordon, C.,et al. (2004). Novel approaches to study climate change effects on terrestrialecosystems in the field: drought and passive nighttime warming. Ecosystems 7,583–597. doi: 10.1007/s10021-004-0178-8
Blankinship, J. C., Niklaus, P. A., and Hungate, B. A. (2011). A meta-analysis of responses of soil biota to global change. Oecologia 165, 553–565.doi: 10.1007/s00442-011-1909-0
Canarini, A., Carrillo, Y., Mariotte, P., Ingram, L., and Dijkstra, F. A.(2016). Soil microbial community resistance to drought and links to Cstabilization in an Australian grassland. Soil Biol. Biochem. 103, 171–180.doi: 10.1016/j.soilbio.2016.08.024
Castro, H. F., Classen, A. T., Austin, E. E., Norby, R. J., and Schadt, C. W. (2010).Soil microbial community responses to multiple experimental climate changedrivers. Appl. Environ. Microbiol. 76, 999–1007. doi: 10.1128/AEM.02874-09
Kundel et al. Rainout-Shelter Manual for Agricultural Fields
importance of an integrated approach. Sci. Total Environ. 408, 5667–5687.doi: 10.1016/j.scitotenv.2009.05.002
Fay, P. A., Carlisle, J. D., Knapp, A. K., Blair, J. M., and Collins, S. L. (2000).Altering rainfall timing and quantity in a mesic grassland ecosystem: designand performance of rainfall manipulation shelters. Ecosystems 3, 308–319.doi: 10.1007/s100210000028
Fay, P. A., Carlisle, J. D., Knapp, A. K., Blair, J. M., and Collins, S. L. (2003).Productivity responses to altered rainfall patterns in a C4-dominated grassland.Ecosyst. Ecol. 137, 245–251. doi: 10.1007/s00442-003-1331-3
Fliessbach, A., Oberholzer, H. R., Gunst, L., and Mäder, P. (2007). Soilorganic matter and biological soil quality indicators after 21 years oforganic and conventional farming. Agric. Ecosyst. Environ. 118, 273–284.doi: 10.1016/j.agee.2006.05.022
Gimbel, K. F., Felsmann, K., Baudis, M., Puhlmann, H., Gessler, A.,Bruelheide, H., et al. (2015). Drought in forest understory ecosystems –a novel rainfall reduction experiment. Biogeosciences 12, 961–975.doi: 10.5194/bg-12-961-2015
IPCC (2014). Climate Change 2014: Synthesis Report. Contribution of Working
Groups I, II and III to the Fifth Assessment Report of theIntergovernmental Panel
on Climate Change. Geneva: IPCC.Mäder, P., Fliessbach, A., Dubois, D., Gunst, L., Fried, P., and Niggli, U. (2002).
Soil fertility and biodiversity in organic farming. Science 296, 1694–1697.doi: 10.1126/science.1071148
Mikkelsen, T. N., Beier, C., Jonasson, S., Holmstrup, M., Schmidt, I. K., Pilegaard,K., et al. (2008). Experimental design of multifactor climate change experimentswith elevated CO2, warming and drought: the CLIMAITE project. Funct. Ecol.22, 185–195. doi: 10.1111/j.1365-2435.2007.01362.x
Olesen, J. E., and Bindi, M. (2002). consequences of climate change for europeanagricultural productivity, land use and policy. Eur. J. Agron. 16, 239–262.doi: 10.1016/S1161-0301(02)00004-7
Parra, A., Ramírez, D. A., Resco, V., Velasco, Á., and Moreno, J. M. (2012).Modifying rainfall patterns in a mediterranean shrubland: system design,plant responses and experimental burning. Int. J. Biometeorol. 56, 1033–1043.doi: 10.1007/s00484-011-0517-3
Poll, C., Marhan, S., Back, F., Niklaus, P. A., and Kandeler, E. (2013). Field-scale manipulation of soil temperature and precipitation change soil CO2 fluxin a temperate agricultural ecosystem. Agric. Ecosyst. Environ. 165, 88–97.doi: 10.1016/j.agee.2012.12.012
Porporato, A., Daly, E., and Rodriguez-Iturbe, I. (2004). Soil water balanceand ecosystem response to climate change. Am. Nat. 164, 625–632.doi: 10.2307/3473173
Prechsl, U. E., Burri, S., Gilgen, A. K., Kahmen, A., and Buchmann, N. (2015). Noshift to a deeper water uptake depth in response to summer drought of two
lowland and sub-alpine C3-grasslands in Switzerland. Oecologia 177, 97–111.doi: 10.1007/s00442-014-3092-6
R Core Team (2016). R: A Language and Environment for Statistical Computing.Vienna. Available online at: https://www.r-project.org/
Russo, S., Dosio, A., Sterl, A., Barbosa, P., and Vogt, J. (2013). Projection ofoccurrence of extreme dry-wet years and seasons in Europe with stationary andnonstationary standardized precipitation indices. J. Geophys. Res. Atmos. 118,7628–7639. doi: 10.1002/jgrd.50571
Spinoni, J., Naumann, G., and Vogt, J. (2015). Spatial patterns of Europeandroughts under a moderate emission scenario. Adv. Sci. Res. 12, 179–186.doi: 10.5194/asr-12-179-2015
Svejcar, T., Angell, R., and Miller, R. (1999). Fixed location rain sheltersfor studying precipitation effects on rangelands. J. Arid Environ. 42,187–193.
Trnka, M., Oelsen, J. E., Kersebaum, K. C., Skjelvag, A. O., Eitzinger, J.,Seguin, B., et al. (2011). Agroclimatic conditions in europe under climatechange. Glob. Chang. Biol. 17, 2298–2318. doi: 10.1111/j.1365-2486.2011.02396.x
Vogel, A., Fester, T., Eisenhauer, N., Scherer-Lorenzen, M., Schmid, B., Weisser,W. W., et al. (2013). Separating drought effects from roof artifacts onecosystem processes in a grassland drought experiment. PLoS ONE 8:e70997.doi: 10.1371/journal.pone.0070997
Wickham, H. (2009). ggplot2: Elegant Graphics for Data Analysis. New York, NY:Springer-Verlag.
Wu, Z., Dijkstra, P., Koch, G. W., Penuelas, J., and Hungate, B. A. (2011).Responses of terrestrial ecosystems to temperature and precipitation change:a meta-analysis of experimental manipulation. Glob. Chang. Biol. 17, 927–942.doi: 10.1111/j.1365-2486.2010.02302.x
Yahdjian, L., and Sala, O. E. (2002). A rainout shelter design forintercepting different amounts of rainfall. Oecologia 133, 95–101.doi: 10.1007/s00442-002-1024-3
Conflict of Interest Statement: The authors declare that the research wasconducted in the absence of any commercial or financial relationships that couldbe construed as a potential conflict of interest.


![Sulfidic Anion Concentrations on Early Earth• [Sulfite]>1 uM for shallow ponds • Lower bound (neglects rainout, drainage ratio) Ranjan et al., (2018), Astrobiology, 18, 8 varying](https://static.documents.pub/doc/80x56/5fc7509e74f10f1b3c469563/sulidic-anion-concentrations-on-early-earth-a-sulite1-um-for-shallow.jpg)


