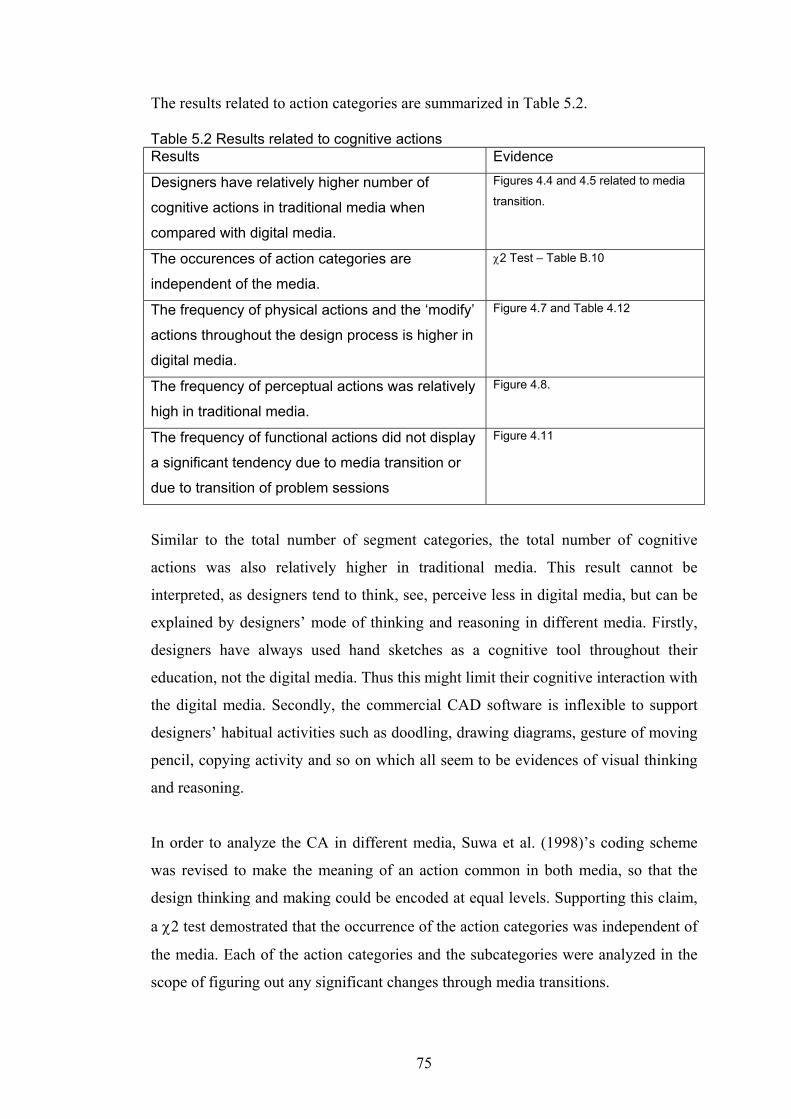
DESIGNERS’ COGNITION IN TRADITIONAL VERSUS DIGITAL MEDIA DURING THE CONCEPTUAL DESIGN A THESIS SUBMITTED TO THE DEPARTMENT OF INTERIOR ARCHITECTURE AND ENVIRONMENTAL DESIGN AND THE INSTITUTE OF FINE ARTS OF BİLKENT UNIVERSITY IN PARTIAL FULFILLMENT OF THE REQUIREMENTS FOR THE DEGREE OF MASTER OF FINE ARTS By Zafer Bilda May, 2001
Transcript
DESIGNERS’ COGNITIONIN TRADITIONAL VERSUS DIGITAL MEDIA
DURING THE CONCEPTUAL DESIGN
A THESISSUBMITTED TO THE DEPARTMENT OF
INTERIOR ARCHITECTURE AND ENVIRONMENTALDESIGN AND THE INSTITUTE OF FINE ARTS
OF BİLKENT UNIVERSITYIN PARTIAL FULFILLMENT OF THE REQUIREMENTS
FOR THE DEGREE OFMASTER OF FINE ARTS
ByZafer BildaMay, 2001
ii
I certify that I have read this thesis and that in my opinion it is fullyadequate, in scope and in quality, as a thesis for the degree of Masterof Fine Arts.
_______________________________________________
Assoc. Prof. Dr. Halime Demirkan (Principal Advisor)
I certify that I have read this thesis and that in my opinion it is fullyadequate, in scope and in quality, as a thesis for the degree of Masterof Fine Arts.
__________________________________
Prof. Dr. Mustafa Pultar
I certify that I have read this thesis and that in my opinion it is fullyadequate, in scope and in quality, as a thesis for the degree of Masterof Fine Arts.
Tabl 4.6. Sequence of the Experiment....................................................................... 48
Table 4.7. An Example of a Verbal Protocol.......................................................... 51
Table 4.8. The Encoded Categories.......................................................................... 52
Table 4.9 Dependency of segmentation categories on subjects’ performances in CAD and HAND media.................................................................... 55
Table 4.10. Examples from designers’ strategies...................................................... 57
Table 4.11. Most common type segment subcategories............................................ 57
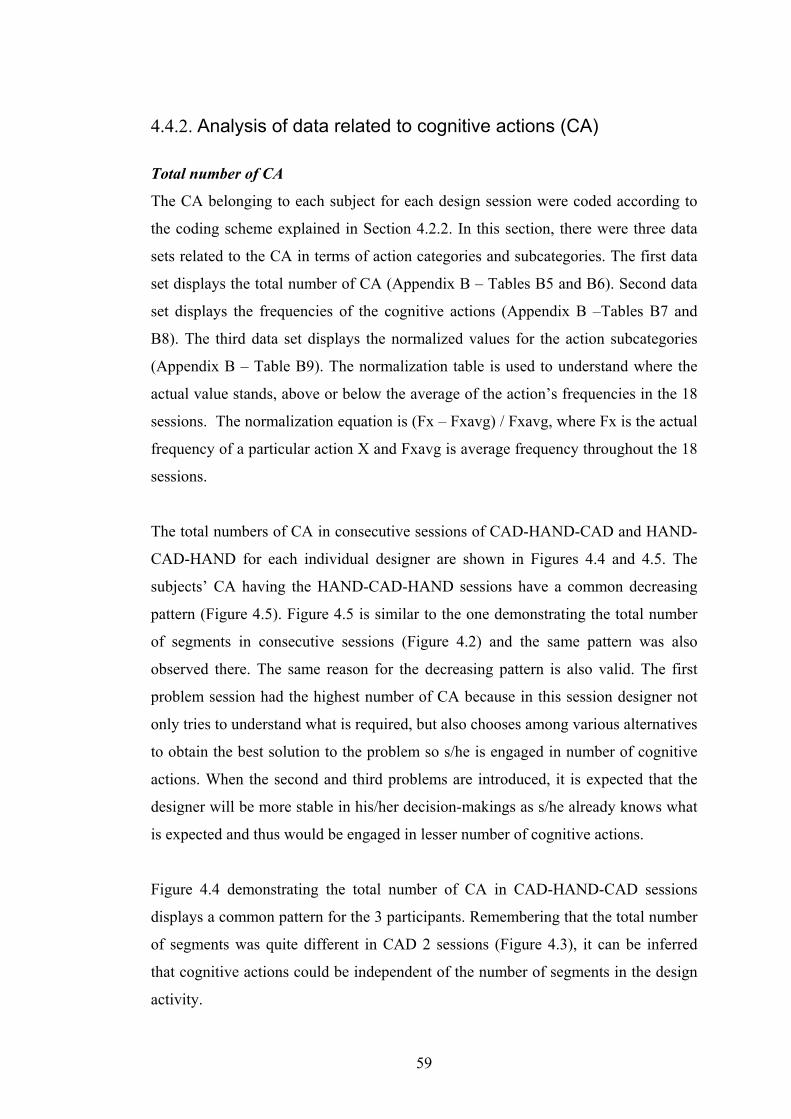
Table 4.12. Draw and Modify actions in CAD versus HAND media...................... 63
ix
LIST OF FIGURES
Figure 4.1. Design Brief………………………………………………………… 49
Figure 4.2. Total number of segments in HAND-CAD-HAND sessions................. 54
Figure 4.3. Total number of segments in CAD-HAND-CAD sessions.....................54
Figure 4.4. Total number of designers’ CA in CAD-HAND-CAD sessions.............60
Figure 4.5. Total number of designers’ CA in HAND-CAD-HAND sessions..........60
Figure 4.6 Distribution of four action categories in the first sessions....................... 61
Figure 4.7 Frequency of physical actions (a) CAD-HAND-CAD sessions. (b) HAND-CAD-HAND sessions................................................. 62
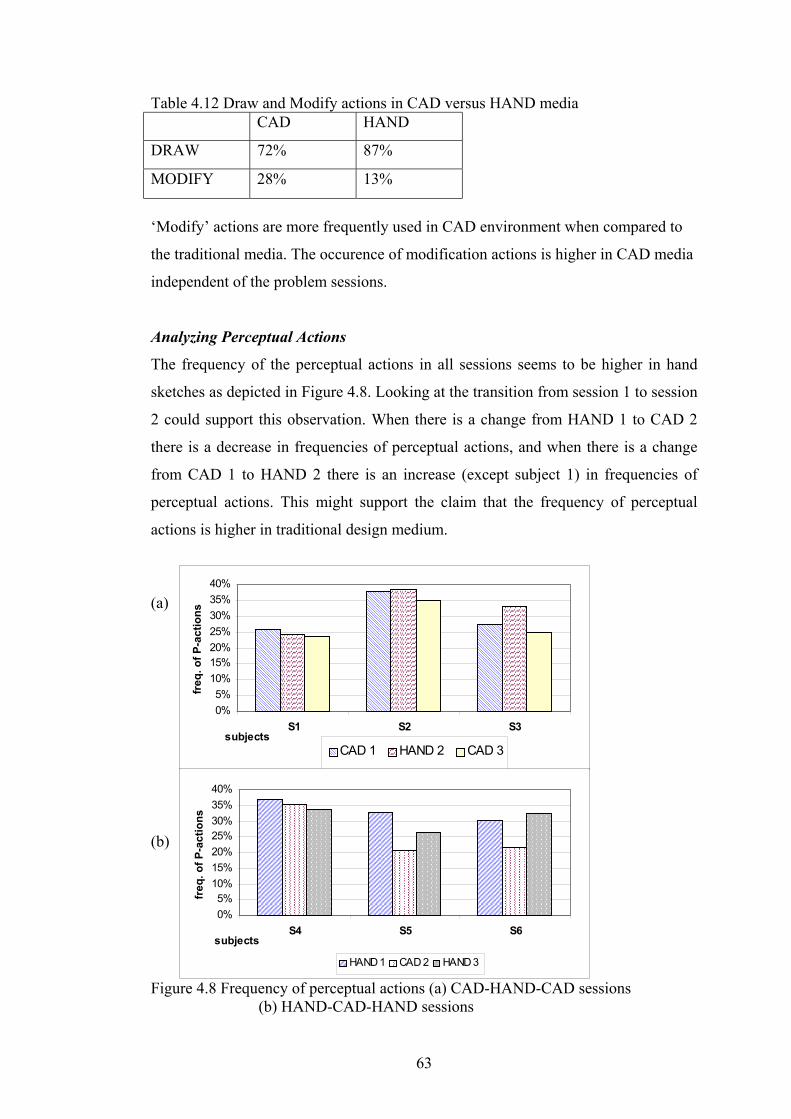
Figure 4.8 Frequency of perceptual actions (a) CAD-HAND-CAD sessions (b) HAND-CAD-HAND sessions.................................................. 63
Figure 4.9 Normalized values for perceptual actions related to ‘relations’ subcategory through 3 sessions for six subjects................................... 64
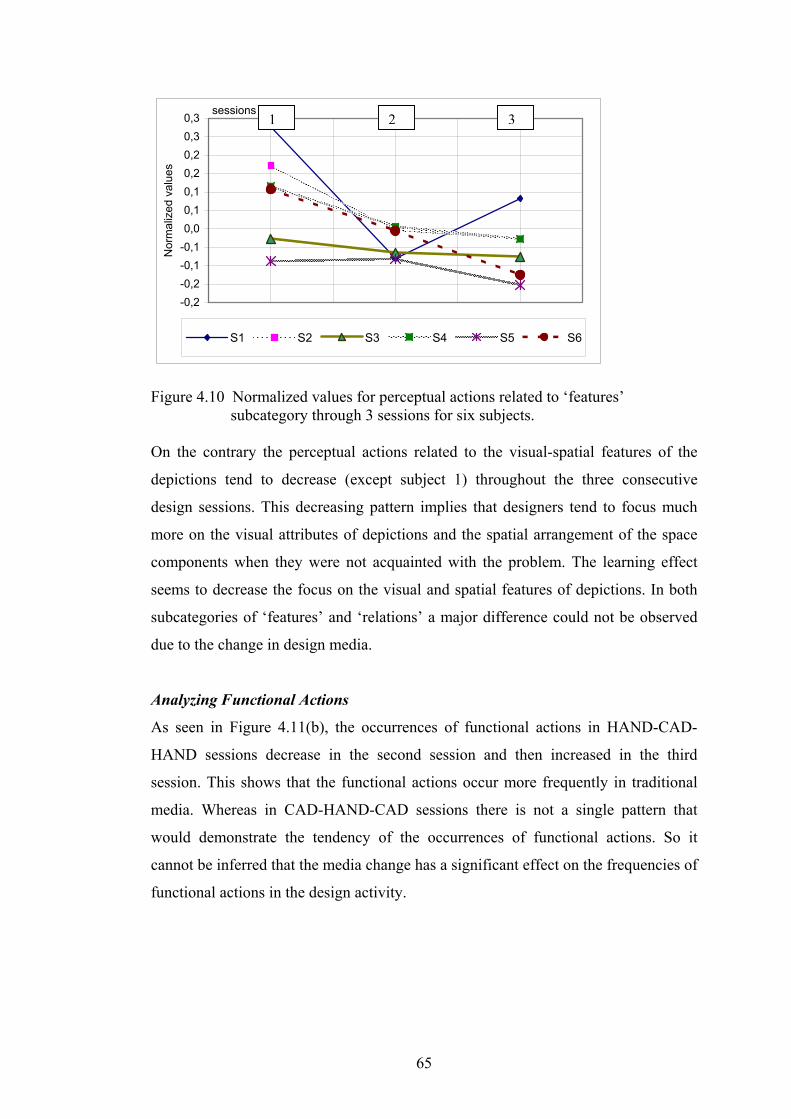
Figure 4.10 Normalized values for perceptual actions related to ‘features’ subcategory through 3 sessions for six subjects.................................... 65
Figure 4.11 Frequency of functional actions (a) CAD-HAND-CAD sessions (b) HAND-CAD-HAND sessions.................................................. 66
1
1. INTRODUCTION
Design could be defined as a goal-directed and a knowledge-based problem solving
process. While scientists and engineers focus on discovering a rule, architects are
said to be concerned with achieving the desired result (Lawson, 1990). As
architectural design is ‘solution-focused’, architects tend to first generate a potential
solution, then evaluate it (Hitchcock, 1992) and reinterpret it (depending on
designer’s knowledge, experience and conjecture ability) to reach an alternative
solution and the cycle goes on like that. For designers, analysis and understanding of
the problem seems to be integrated in generating a solution (Lawson, 1990).
1.1. Background The attempts to understand ‘how designers design’ first started with introspective
methods and then the ‘protocol analysis technique’ (Newell and Simon, 1972) was
used. The question of ‘how designers think’ was not seperable from the former
question, and many aspects of both questions were explored by using the design
protocols (Eastman, 1970; Akin, 1986; Schon, 1987, Goldschmidt, 1991;1994). The
analysis of design protocols formalized the intuitive aspects of design and has been
the basis of design cognition studies, revealing important insights on design problem
solving and sketching in the architectural context. Protocol analysis research has
mostly focused on the use and role of sketches in the early conceptual design. The
importance of free-hand sketches in the design activity is stressed in that they act as
an essential medium for designers’ dialectic process (Goldschmidt, 1991; Schon and
Wiggins, 1992). Sketches finally are claimed to be external representations as an
evidence to externalized thinking (Do et al., 2000) and a cognitive tool developed to
facilitate memory and thinking (Tversky, 1999).
1.2. Scope of the Thesis Most of the studies based on design protocols have used free-hand sketches as a
medium to analyze the design activity. Also, digital sketching studies could be
supported by design protocols. There is little research comparing the traditional
2
versus digital media using design protocols. The reason is that sketching has always
been the medium of thought processes, and designers seldom use computers in
conceptual design. Attempts to compute the design process and integrating a
knowledge base into computer-aided architectural design (CAAD) have been the
focus of most design researchers (Coyne et al., 1990; Carrara and Kalay, 1994a), but
recent studies focus on the use of digital media throughout the entire design process
in architectural design education (Madrazo, 1999; Marx, 2000; Bermudez and King,
2000). Yet, the cognitive processes of designers in both media should be analyzed, to
explore the effects of media transition and different media interactions of designers.
This could establish a framework to propose ways to integrate computers as a
medium into conceptual design. The importance of design cognition research for
CAAD research is undoubtedly important in that its results could be a foundation for
generation of new CAAD tools based human designing behaviors (Tang and Gero,
2000).
The present thesis introduces a content-oriented coding method based on the
cognitive characteristics of designers, adopted from the coding scheme proposed by
Suwa et al. (1998) in order to inspect the design behavior in traditional versus digital
media. Starting with Suwa and Tversky (1997) recent protocol analysis methods
have used restrospective reporting (Suwa et al., 1998; Kavakli et al., 1999; Suwa et
al., 2000) and a method that employs both segmentation and encoded categories of
cognitive actions. The coding scheme used in the emprical research of the present
study is similar to Suwa et al. (1998) with some revisions developed to be utilized in
both traditional and digital media.
The aim of the present emprical research was to gain an insight on designers’
cognitive processes while sketching in digital versus traditional media. An
experiment was conducted in three phases which included, the training period, sketch
design sessions in traditional (free-hand-sketches) and digital (CAD-sketch) media
and finally the retrospective reporting task following the design sessions. Six
participants who were graduate interior designers were divided into two groups to
have the media transition sessions in a different order, so that the effects of utilizing
different media could be observed clearly.
3
The hypotheses of the emprical research was that there would be differences in the
total number of the segments and the occurence of specific cognitive actions
involved in different media sessions. These two data category (segments and
cognitive actions) were expected to also vary by the learning process of designers.
1.3. Structure of the Thesis The first chapter starts with a short brief of models of design process, and transition
to the contemporary approach where design is claimed to be a thought process and
conceptual design is the focus. In conceptual design designer is said to be engaged in
activities of searching, representing and reasoning (Akin, 1986). As searching and
reasoning are cognitive processes and directly interact with both external and internal
representations, the chapter emphasizes both the representations and the cognitive
aspect of the design activity. Thus, the first section deals with the issue of cognitive
mechanisms in design and the second section concentrates on external and internal
representations in the design context which are named as sketching and mental
imagery. Design literature has emphasized the interaction of these two tools in the
conceptual design phase; ‘are they together or seperable ?’ and ‘how do they interact
?’ are still the questions asked within the current research.
Conceiving some of the mechanisms and tools in conceptual design, it was
concluded that the visual representations in design process do not only aim to
provide depictions or images but also define a symbolic and a conceptual space.
Then the ‘medium’ could be the basis for appropriate space domain. The medium of
design activity has to be emphasized, and different types of representational media
should be analyzed to make a comparative study as the topic of the thesis proposes.
Chapter two classifies the medium of design activity according to two
representational media which are sketches (traditional media) and 3D CAD
environment (digital media). Its first section summarizes the roles of sketches in the
design activity emphasizing the studies that analyze sketches as a cognitive tool. The
second section starts with implications of the use of digital media in architectural
education, continues with an overview of CAAD research in the recent years and
finally concludes that CAAD should be used as a design medium. After gaining a
4
broader perspective on the two media, and the third section emphasizes studies that
compare traditional and digital media. As the representational media said to affect
both design thinking and making, the explained comparative studies helped
structuring a framework to analyze the design activity in both media.
The third chapter introduces the emprical study to analyze designers’ cognitive
actions in traditional versus digital media. For analyzing the design activity, design
cognition research has employed the protocol analysis technique. Thus the first
section begins with previous protocol analysis methods, discusses the two different
protocol approaches and finally ends up with the recent research. The recent research
by Suwa et al. (1998) constituted a basis for the coding scheme of the experimental
study which employs the segmentation and encoding of the action categories. The
design of the experiment is discussed together with examples of how the method was
applied. Results are presented in terms of the two components of the method, namely
analysis of segmentation categories and analysis of action categories. The discussion
part first presents the profiles of the participants which was a variable affecting the
encoding of design processes. Then the significant effects in use of the media
features (like 3D view) were discussed and finally a comparison with the related
work was introduced.
The conclusion chapter summarizes the results which were significant as an
implication for media comparison. It also presents a proposal on tools to integrate
digital media to making it a more appropriate medium for conceptual design. The
analysis of a design medium using both digital media and mental imagery as tools, is
proposed as a further study.
5
Design activity in conceptual design has been explored in design literature with
various approaches such as: a problem solving process (Newell and Simon, 1972),
reflection in action (Schon, 1987), a cognitive task (Akin, 1986), and a knowledge-
based activity (Coyne et al, 1990). Design problems have been referred to as
‘wicked’ or ‘ill-structured’ problems (Simon, 1973; Rittel and Webber, 1973) in
design literature (cited in Hitchcock, 1989). Thus, early attempts to model the design,
have focused on a specific component of the design process and an analysis-
synthesis-evaluation cycle. But the problem solving tools of design could not be the
same as those used in scientific methods.In order to deal with the ill structure of
design, Simon (1973), (cited in Hitchcock, 1989) decomposed design goals into sub
goals, and claimed that the designer found partial solutions to each subgoal. He
pointed out that neglecting the interrelations among subgoals would result in failure
in understanding the design decisions throughout the entire process. Similarly Akin
(1986), broke down the design activity into its constituent parts and found that
analysis was a part of all phases of design and synthesis was found very early in the
process, which was the conceptual design phase. Akin (1986)’s conceptual design
model basically employs three activities which are; searching, representing and
reasoning. Akin (1986) defines a representation as a physical intuition and a
significant part of design synthesis. Representation activity plays an important role as
a design problem and could be represented in either the graphic domain (externally)
or imagery domain (internally). Designers are dependent on representations for their
design activity and both internal and external representations are linked to the
thought processes.
A representation can be defined as “something that stands for something else…some
sort of model of the thing (or things) it represents” (p. 262 in Palmer, 1978, cited in
Johnson, 1998). Architects depend on representations for the design, communication
and criticism of architecture. Bermudez has stated two reasons for this:
2. DESIGN ACTIVITY DURING CONCEPTUAL DESIGN
6
First architectural designs cannot be developed and tested in full scale for obvious economic and practical problems. Second, the human mind has clear limitations in generating, sustaining and transmitting credible simulations of architecture without external recordings. By using representations to articulate and communicate architectural actions and thought, architects not only give solution to these problems but also create a language without which no architectural work would be conceivable (Schon, 1983). In other words, architectural representations are not just working tools but the very universe of discourse (that is verbal, symbolic and conceptual space) wherein architectural work must unfold (1995).
Designers use physical or digital (external) representations of designs for the real
world, and also representations exist internal to a person’s mind. In order to
understand the role of representations in the conceptual phase of design and other
mental activities, both external and internal representations should be considered, as
well as how they are used and how they related to each other (Johnson, 1998).
Internal representations have been discussed in cognitive psychology but have only
been recently explored in design literature. However, studies of external
representations (design drawings) have become the interest of cognitive scientists,
artificial intelligence and design studies researchers because of the cognitive
processes involved in use of these pictorial representations.
If representations are so essential in design, both the media and the techniques that
are in use of representations directly affect the design making and design thinking.
So design thinking becomes an issue that should be explored. One of the main
researchers in the field, Lawson (1990) has stated that: “Design involves a highly
organized mental process capable of manipulating many kinds of information,
blending them all into a coherent set of ideas and finally generating some realization
of those ideas” (6). Here Lawson (1990) saw the design as a mental process. He
suggested “…to explore what goes on in designer’s mind becomes vital, and this
leads into the realm of cognitive psychology, the study of problem solving and
creativity, in short ‘thought’ itself” (94).
7
Cognition was defined by Arnheim (1969) as ‘all mental operations involved in the
receiving, storing, and processing of information: sensory perception, memory,
thinking and learning’ (13). The cognitive mechanisms in design problem solving
were analyzed by Akin (1978) in order to examine the components of architectural
design model. Based on the problem-oriented approach of Newell and Simon (1972),
Akin (1978) divided the conceptual design into two, namely the pre-sketching and
sketching stages, and modeled the design activity in each stage according to
information processing levels and mechanisms. This study was one of the first
attempts to build up a theoretical framework on cognitive mechanisms of design
process and to analyze major aspects of design behavior using the protocol analysis
technique.
Considering design as a cognitive process, one should examine representations of
design in the designer’s mind, how they are stored and recalled. Akin (1986) has
defined two basic modes that account for all representations that were the verbal-
conceptual and visual modes. Verbal-conceptual refers to all schemata that make up
a representation and that have single specific visual equivalents. Conversely, a
specific view of a specific thing would provide a single visual entity, which
corresponds to visual mode. However the visual mode would have many conceptual-
verbal schemata that associate with the visual entity. So Akin (1986) has claimed that
the same cognitive mechanisms deal with both modes.
The visual mode improves the recognition of novel solutions by providing a new
dimension for the problem domain (Akin, 1986). Akin’s (1986) definition of visual
mode might actually be based on Arnheim’s (1969) definition of visual perception.
Arnheim (1969) took perception to be thinking (or cognition) itself, including the
actions such as active exploration, selection, simplification, abstraction, analysis and
synthesis, correction, comparison, problem solving as well as combining. The
research on design cognition implies that these actions are the essential cognitive
actions in dealing with design representations. Then the design activity must be
2.1. Cognitive Aspect of Design Activity
8
employing visual perception as a combination of cognitive actions, as Arnheim
(1969) concluded, “visual perception is visual thinking”. Thus the statement ‘design
is visual thinking’ must be the basis for the view in design literature. The reflection
of Arnheim’s (1969) visual thinking might be traced in the recent research where
visual reasoning is defined by Gero (1999) as follows: “In the conceptual design
phase, two types of knowledge are said to be interconnected; conceptual knowledge
and perceptually-based knowledge. Visual reasoning is the cognitive process that
links these two types of knowledge” (vii). It might be reasonable to infer that a
designer’s interaction with sketches in a ‘visual reasoning’ mode or in the state of
‘visual thinking’ would provide evidence about the nature of design activity from a
cognitive aspect.
Schon’s study (1987) had significant implications for designers’ interaction with
sketches and for defining the design activity from a cognitive aspect, which helped to
build the research field of design cognition. Schon (1987) described the design
activity as a reflection-in-action process that is thinking back on what has been done
in order to discover what contributed to an unexpected outcome. The actions in the
process might be inventing procedures to solve the problem, making errors, making
further corrective inventions as in a trial and error process. Considering conceptual
design as an experiment pertaining to three levels, exploration, move testing and
hypothesis testing, the designer’s primary interest is said to be ‘changing the
situation’. Schon (1987) described the conceptual design in a sketching medium as:
The drawing reveals qualities and relations unimagined beforehand that moves can function as experiments. The pace of action can be varied at will, designer can slow down to think about what he is doing…No move is irreversible. The designer can try, look and by shifting to another sheet of paper try again. As a consequence he can perform learning sequences in which he corrects his errors and takes account of previously unexpected results of his moves (76).
So designing might take the form of reflective conversation with the situation.
Designer is said to discover a whole new idea in situation’s back talk, then
implications for further moves are generated. Schon (1987) finalized this idea by
considering the global designing experiment as a reflective conversation with the
situation. The reflection-in-action approach has been frequently utilized by design
researchers (Doorst and Dijkhuis, 1995; Suwa and Tversky, 1997) as a basis to
interpret the design activity .
9
Design representations are said to be external or internal. External and internal
representations are interpreted as sketching and mental imagery in the design
context. Internal representations are the mental images or ‘the essence of cognition’
(Goldschmidt, 1997). External representations could be physical representations
including the digital representations and the 3D models but are expressed usually in
drawings which could be two dimensional or three dimensional depictions, diagrams,
graphs, notations. External representations also reflect the internal representations
although they are not identical (Goldschmidt, 1999).
2.2.1. Mental Imagery in the Design Context Mental images defined by Arnheim (1969) meant to be faithful replicas of the
physical objects they replace. These faithful replications are so called eidetic images
referring to a kind of photographic memory (Arnheim, 1969). He stated that:
"Thinking, in particular, can deal with objects and events only if they are available to
the mind in some fashion. In direct perception, they can be seen, sometimes handled,
otherwise they are represented indirectly by what is remembered and known about
them" (98). After Arnheim (1969) had treated mental images as a tool for thinking,
Mc Kim (1972) postulated that the mental imagery was a component of visual
thinking. Then Sommer (1978) pointed to flexibility and nonmaterial character of
mental images (referring to them as ‘the mind’s eye’) and their ability to allow
unusual transforms as the specific advantages of imagery in design thinking (cited in
Athavankar, 1997).
According to Kosslyn (1999), mental imagery refers to two phenomena which
usually occur together: “First, imagery is a perception-like experience in the absence
of sensory input. For vision, this experience is described as ‘seeing with the mind’s
eye’. Second, it is a mental representation, which corresponds to a brain state similar
to that, which arises during perception in the same modality (visual, auditory, etc).
2.2. External and Internal Representations (Sketching and
Imagery)
10
Imagery can occur in multiple sensory modalities; one can hear with mind’s ear, ‘feel
with mind’s hands’ and so forth” (83).
Imagery is more often referred to within the context of sketching as Goldschmidt
(1991) defined interactive imagery as a mode of reasoning in the early creative
phase. In designing, an entity is generated that does not really exist and therefore, no
image of it can be evoked in the mind. It is reasonable to say that the designer, who
is guided by design objectives, recalls from the memory the candidate shapes and
forms that, might prove relevant to the task at hand. This is defined as visual analogy
by Goldschmidt (1995b). Goldschmidt (1995b) also emphasized the nature of visual
displays in the imagery that they already represent form and composition pictorially,
as required in the design process. She explored how designers make use of visual
displays of imagery to help themselves to restructure and solve design problems. She
postulated that “the sketching gives rise to interactive imagery, also enhances
reasoning of visual analogies and the two operations go hand in hand” (57). Though
even most designers personally experience mental images during problem solving,
the literature on design research does not offer insights into the creative use of
imagery in design, but only indirectly refers to the role of imagery in the early
creative phase in design (Athavankar, 1997). The manipulative transformations of
shapes and forms that originate in imagery are said to be carried out both mentally
and through external representations, usually in the form of fast sketches on paper or
on a computer screen.
Similar to Goldschmidt’s (1995b) work, Athavankar (1997) figured out the
importance of understanding how imagery and sketching interact as well as work
independently in problem solving. Designers consider sketching a fundamental
process of design and inseparable from the thinking process, whereas Athavankar
(1997) asked: "Is sketching an inseparable part of thinking in the act of a design? Or
has it acquired this status because of the way the designers are trained and
subsequently practice design? In other words, can we design without sketching?" (28)
11
2.2.2. Sketching or Imagery
Athavankar (1997) further conducted an experiment questioning if sketching is an
integral part of the act of designing. The subject was required to design a product in
his imagery (with an eye mask on) by depriving the subject’s access to sketching and
the feedback it provides. The subject’s concurrent verbalization during the imagery
design process, revealed that the subject evolved the shape of the object in his mental
images, manipulated it, evaluated alternative modifications, and added details and
color as well. The designer creates a kind of virtual model in his/her imagery and
play with it. He concluded that sketching is not the only thinking tool available for
problem solving and imagery in design, because of its depictive qualities, can
potentially be a substitute for sketching.
Imagery is said to play an important role in sketching and design thinking, that
emergence of new ways of seeing images occurs in imagery and this reinterpretation
is considered to be a creative process (Purcell and Gero, 1998). But the
reinterpretation of images in imagery was found to have some limitations (Chambers
and Reisberg, 1985, cited in Verstijnen et al, 1998). Then sketching is needed if the
operations cannot be done within mental imagery alone, or if the operations are much
easier to perform externally (Vertijnen et al, 1998).
Chandrasekaran (1999) stated that mental images are rather weak in comparison with
external representations (including sketches, diagrams and 3D models) in their ability
to support perception of new objects, but are reasonably good at extraction of new
perceptual relations. Furthermore he stated that issues such as ‘how mental imagery
is experienced and used by a human being’ and ‘what kind of internal mechanisms
are involved in using mental imagery’ are controversial. However, he figured out that
mental images have information-providing and reasoning-directing roles when used
with external diagrams during design.
Anderson and Helstrup (1993) also aimed at comparing sketching versus imagery as
media for design and found no difference between using imagery or drawing as
support for generating patterns of good correspondence (qtd in Kokotovich and
12
Purcell, 2000). Further they concluded that, there was no difference in the creative
patterns generated either by using a drawing or by mental imagery in developing
forms. But this is in conflict with the most commonly stated view in design literature
that sketching is an aid to the creative design process. Kokotovich and Purcell (2000)
explained that the reason for this negative outcome could be that, the participants in
Anderson and Helstrup’s (1993) experiment were non-designers and had no training
in using a drawing to increase the creativity in output. They verified this evidence by
an experiment concluding that drawing increased the designers’ creative output, on
the other hand non-designers’ performance did not change (Kokotovich and Purcell,
2000).
In conclusion, the most recent research (Kokotovich and Purcell, 2000) does not
focus on sketching versus imagery but on sketching and imagery hand in hand,
suggesting that “important creative activity occurs when forms that have been
produced can be mentally manipulated, and drawing acts as a way of externalizing
the results of these manipulations” (447).
This overview of sketching and mental imagery, their significance and the discussion
on their interaction in the design process provides some cues about visual design
thinking. In order to extend the understanding of visual thinking one has to gain an
insight on the role of external visual displays that are representations in design.
Considering visual representations in the design process does not only aim to provide
depictions or images but also defines a symbolic and a conceptual space, the
‘medium’ is the basis for appropriate space domain. The medium of design activity
should be emphasized, and different types of representational media should be
analyzed to make a comparative study as the topic of this thesis proposes.
13
3. MEDIUM OF DESIGN ACTIVITY
During conceptual design, an architect engages in various tasks, such as concept
formation, form making, testing functional capacity, and exploring structural and
construction possibilities. A similar characteristic in all the activities of the design
process is the use of a number of different types of drawings. The architect moves
along these activities producing various representations, namely sketches, drawings
and models. In the early conceptual stage of the design process, an architect uses
unstructured forms of pictorial representations. These include abstract diagrams, such
as functional diagrams or sketch plans, together with less abstract and more realistic
visual representations such as perspectives. As the design develops other more
structured forms of pictorial representation, such as plans or sections, become a part
of the process (Purcell and Gero, 1998). Despite the various identifications of
depiction types for different levels of design, "sketching" is used as a general term to
cover all the drawings and diagrams or pictorial representations of the conceptual
design phase in the architectural context. Such representations are functional during
the design process for concentrating on the design problem, and producing alternate
solutions.
Designers utilize various types of media for sketching activities during the
conceptual design phase. Diagrams are defined to be an essential part of conceptual
design (Do et al, 2000), which are "drawings that use geometric elements to
abstractly represent natural and artificial phenomena such as sound and light;
building components such as walls and windows; and human behavior such as sight
and circulation, as well as territorial boundaries of spaces" (483). Thus sketches are
defined as representations of the spatial arrangements of physical elements (Do et al,
2000).
14
3.1. The Role of Sketches Sketching has a relatively short history as Goldschmidt (1999) describes:
“ We detect its origins to the late 15th century, an age of innovative developments in arts and sciences, supported by inventions and novel technologies. One of the most important inventions of the renaissance was moveable type printing, leading to the establishing of printing presses first in Rome (in 1467) and later elsewhere in Italy and throughout Europe (Ames-Lewis, 1981). The rapidly developing book printing trade paved the way for a growing paper industry, since the demand could no longer be met by hand-made paper. It did not take long before, artists and designers started to consume paper for the purpose of making drawings. Since paper of good quality became affordable and readily obtainable, artists availed themselves, for the first time, of the luxury of making study drawings, better known as sketches. The desire to experiment, to revise and look for alternatives which the activity of free-hand rapid sketching supported, was of course in perfect harmony with the innovative spirit of Renaissance. Therefore, the assimilation of sketching into artistic and design practices was quick to occur. Most appropriately, the incomplete, partial, rapidly hand drawn images on paper that we refer to as study sketches, were called “pensieri” (Olszweski, 1981), meaning ‘thoughts’ in contemporary Italian. Sketches were then, and still are today, an aid to thinking and, we maintain, under certain circumstances their making is thinking itself (173).
Sketches being an integral part of design activity, store the design solutions relieving
the memory of the designer from extra load, and also seem to be essential for
recognizing conflicts and possibilities (Akin, 1978). Therefore, design research
literature has examined extensively the early stages (conceptual phase) of design
process and the role of sketching. Schon (1987) suggested that designers construct a
‘virtual world’ through drawing, where it represents the characteristics of spatial
relations: “…virtual world (mind) is a constructed representation of the real world
practice. Designer’s ability to construct and manipulate virtual worlds is a crucial
component of his ability not only to perform artistically but to experiment
rigorously” (77).
An architect’s sketchpad was given as an example of ‘a virtual world on which all
professions are dependent’. The externalization of representations in the form of
sketches is described here as “designers’ drawing and talking of their moves in
spatial action language leaving traces that represent the forms of buildings on the
site” (75). According to Schon (1987) “virtual worlds provide contexts for
experiments where designers could externalize, suspend or control some of their
everyday impediments to rigorous reflection-in-action” (77). This action should be a
15
creative exploration since Goldschmidt (1994) found that architects tend to derive
initial ideas from mere doodles. The doodling activity explored as a particular result
in her work might be an example referring to what Schon (1987) described as a
virtual world.
Based on Schon’s (1987) reflection in action, Schon and Wiggins (1992) further
stated that an architect first put ideas on paper, then inspect and revise (redraw,
reconceive, reexamine) them and this cycle goes on like a dialogue. This postulation
has become a basis to explain how externalization of design cognition proceeds.
Likewise, many design researchers are still revising this explanation (Goldschmidt,
1994, 1999; Suwa and Tversky 1997; Purcell and Gero, 1998; Suwa et al., 1998;
Tversky, 1999). They emphasize sketching as a cognitive tool, and that the sketching
activity goes on like a dialogue. Again considering the sketches as cognitive tools,
Oxman (1995) defined sketches as being behavioral responses to visual-mental
processes, which can be observed and interpreted: “The sketch is seen as the basis of
a visual and mental transaction between the designer and the representation. It is
these transactions with the external representation which illuminate the visual-mental
processes of designers” (93).
A technique that has been used to find out more about the role of sketches and ‘how
designers design’ is the analysis of designers’ protocols, named as ‘protocol analysis’
(Newell and Simon, 1972) in design literature. The protocol analysis method will be
discussed later in detail, but in this section, studies that have used the design
protocols to reveal ‘how designers design’ and ‘the sketches roles in design’ will be
discussed.
Earliest studies using the design protocols in architectural design were notably those
of Akin (1978; 1986). Using design protocols, a specific approach to the role of
sketching in design was brought by Schon and Wiggins (1992). They suggested that
sketching presents a visual display, which can be perceived in different ways, in
other words a sketch, could be re-interpreted. They decomposed the sketching
activity into sequences of ‘seeing-moving-seeing’ with also the unintended
consequences of moves. Their study was quite similar to Goldschmidt’s (1991)
approach.
16
Goldschmidt (1991) pointed out the role that sketching plays within the design
process and the cognitive processes that might support the process. She decomposed
the sketching activity into ‘moves’ and ‘arguments’. The ‘moves’ could be
summarized in three types as active sketching, reading off a sketch (that is thinking
about the sketch or deriving information from it) and reasoning without the
involvement of sketching. ‘Arguments’ are defined to be within moves and could be
two types as ‘seeing as’ and ‘seeing that’. ‘Seeing as’ involves the designer in seeing
the figural properties of a sketch, re-interpreting the depictions, and the relations
among them, or discovering a new way of seeing them (called as emergence also).
‘Seeing that’ comprises non-figural statements about a design, no emergence, no
reinterpreting is involved. Analyzing the design protocols, Goldschmidt (1991)
concluded that ‘seeing as’ arguments were made while sketching, ‘seeing that ‘
arguments were made both while sketching and examining a sketch. In a sketching
activity ‘seeing as’ and ‘seeing that’ episodes are said to be linked together in a
dialectic process.
Goel (1995) defined freehand sketches to be very loose, not well structured and
ambiguous. Although these properties sound undesirable as a property of visual
representations, they allow sketches to play a significant role in design processes.
Ambiguity of sketches may encourage designers to interpret elements of their
sketches in one meaning at one time and then in another afterwards (Goel, 1995).
Goel (1995) analyzed sketch drawings in a problem-solving phase and observed
three stages during design process, which are preliminary stage (where there are
fragments of ideas) followed by refinement and detailing stages. Through these
stages drawing moves from unstructured sketches to more precise and explicit drawn
sketches. He stated that designers do not generate several independent ideas and
choose between them, but generate a single idea/fragment and develop it through
transformations. He identified two types of transformations in the drawings. There
are lateral transformations where there is movement from one idea to a different idea
and vertical transformations where one idea is transformed into a more detailed form.
Usually lateral transformations occur in the preliminary design phases while vertical
transformations occur during the refinement, detailed and precise drawings.
17
Goldschmidt (1991, 1994) and Goel (1995) addressed sketches as external
representations allowing reflective conversation, in their studies on protocols of
design sessions with special emphasis given to the role of sketching within the
overall design process. Regarding to the analysis of the design activity and the role of
sketches, Suwa and Tversky (1997) collected protocols of design sessions from
advanced students and architects. Their aim was to examine what information
architects think of and read off from their own freehand sketches. Suwa et al. (1998)
explored how sketches could be a good medium for a reflective conversation. Using
the design protocols they have found that visual/spatial features in sketches serve as
visual cues for designers to access non-visual information. Kavakli et al. (1999) used
a similar analysis to focus on differences in visual reasoning between a novice and an
expert architectural designer during the conceptual design process. Using the same
method, Suwa et al. (2000) explored the designer’s unexpected discoveries of
visual/spatial features of sketched elements. Regarding these recent studies, it has
become clear that sketching and cognition are closely coupled and the common view
that ‘cognitive processes and structures are reflected in sketching structure’ is also
supported by Scrivener et al. (2000).
A recent study by Do et al (2000) summarizes the roles of sketches in design
including most of the implications of the design protocol studies so far. These roles
are: Generating concepts, externalizing and visualizing problems, facilitating
problem solving and creative effort representing real world artifacts that can be
manipulated and reasoned with, and revising and refining ideas (Do et al., 2000).
Most of the studies based on design protocols have used free-hand sketches as a
medium to analyze the design activity. On the other hand, digital sketching studies
could also be supported by design protocols. In order to address this issue, one has to
gain a broader understanding of traditional (free-hand sketches) and digital (CAD
environments) media and then make a comparison between them.
18
3.2. Use of Digital Media
Computers are now ubiquitous in schools of architecture. The efforts to integrate
computers in design could best be possible first in educational practice. Thus,
research on digital sketching was usually based in educational environments such
that Jacobs (1991) revealed many aspects of a 3D CAD environment in the
educational practice as follows:
As a component of the design curriculum, education in 3D modeling reinforces the development of fundamental design skills. The CAD model effectively allows students to integrate qualitative and quantitative thinking. Three-dimensional conceptual abilities are strengthened. The structure of CAD requires a more deliberate design process. CAD emphasizes the precise ordering and transformation of design material and raises explicit issues of form and order. In allowing the designer to view the evolving project dynamically, CAD stimulates the imagination. At first the mechanics of monitor and mouse seem cumbersome, but hand-eye coordination develops as the CAD image becomes more familiar (18).
Marx (2000) also favored the 3D digital design in architectural education for the
following reasons; (i) all elements are editable, changes in design can be inspected
easily and interactively in a 3D environment, (ii) designer could predict the quality of
his/her efforts, clients are appealed by the realistic images, (iii) digital design more
closely matches the aspirations of student designers.
The modes of visual representation and sorts of interaction between designer and
computer vary in various stages of design. In general, ‘how computers should be
used as a design medium’ is discussed. Schmitt (1999) states:
A medium is more than a tool or method. It is an interactive counterpart, not necessarily an intelligent being, but something that has knowledge and capabilities to offer in the area we are interested in. A computer-aided architectural design environment, equipped with the necessary components and in cooperation with a competent designer, can achieve the status of a design medium (91).
Schmitt (1999) also argued that computer-aided architectural design (CAAD) should
not only serve as a drafting tool or as an electronic pencil but architects should take
the advantage of simulation and communication technology during the design
process. It would be reasonable to have an overview on the issues related to the
CAAD research.
19
3.2.1. An Overview of Computer-Aided Architectural Design
(CAAD) While designing one utilizes bodies of knowledge and certain operational tools.
Computer provides a single medium both for representing knowledge and for
carrying out the operations of design. Developments in design knowledge and design
tools are expected to lead to direct links between the "knowledge-based" and
"computer-aided" design systems (Coyne et al.,1990).
In architecture, different building types have fundamentally different design rules
and different performance conditions. So the knowledge that characterizes and
defines them makes the development of CAD for architecture difficult (Eastman,
1994). The first goal of CAAD research is to gain insights into the design process
and human cognition; the second one is finding methods to improve the design
process or its results. Knowledge-based systems (KBS) and artificial intelligence
(AI) offer solutions to these issues (Schmitt and Oechslin, 1992).
Research on CAAD also aims to find out how computers may help in the conceptual
phase of design process. A number of approaches have been developed like the
and Maver, 1994), the SEED system (Flemming, 1994) or a knowledge based
computational support for architectural design (Carrara and Kalay, 1994a). There are
also attempts to verify the contribution of three-dimensional (3D) virtual models to
conceptual stage of design. Zampi and Morgan (1995) has stated that the solid
modeling programs that enable the architect to use "building blocks" as objects, and
realist color renderings of the objects might be helpful for the conceptual design
process. Engeli and Kurmann’s (1996) virtual design tool named Sculptor also
supports the conceptual phase of design by featuring positive and negative volumes
in 3D modeling.
There are different ideas on the use of computer in conceptual design, but most
studies have consensus on one point that CAD modeling could be valuable at any
project development stage. Jacobs (1991) has observed that visual analysis is
particularly enhanced by the use of CAD model in design, such that a greater variety
of non-orthogonal relationships could be more easily examined and the full picture of
20
the project is constructed in the mind with minimal reinforcement. Although one’s
understanding of the project would be internal, CAD model is said to offer a more
continuous and better perspective to examine the model (Jacobs, 1991).
Visual representations of architectural design achieved through the new technology
of CAD not only stand for communication, but also for exploring the cognitive
aspects of architecture (Koutamanis, 1993). Koutamanis also stated that the future of
design representations seem to offer comprehensive and realistic impressions by
virtual reality simulations. On the contrary, Carrara and Kalay (1994b) stated that
current CAD software offer compact, efficient, a more precise and systematic mode
of design, but they lack the cognitive aspects of architectural design, so future CAAD
systems have to find computational means that support learning, creativity and
judgment. Mitchell (1994) has a similar approach, defining paradigms that a CAAD
should support; problem solving, knowledge-based activity and a social activity.
Richens (1994) opposed those ideas by stating that one needs to work with visual
world of diagrams and drawings, solids and spaces but not on their significance and
purpose. Regarding that Richens (1994) is on the technical side, CAAD researchers
in architectural context seem to agree on the idea that the CAD systems improve
image understanding, but the provided photo-realism and rendered images are not
pivotal to design or communication of an architectural project as designers are used
to work with abstractions (wire-frame models) (Coyne et al., 1994).
The goal of CAAD has been the creation of a numerical model prior to the
production of a physical prototype. In other words CAAD gained acceptance as a
term referring to automated drafting and displaying aesthetics with computer
graphics (Ohira, 1995). However, considering CAAD as a powerful graphics and
non-graphics database, and the designer as an information generator and a
coordinator, CAAD should be used as a design medium beyond its capabilities of
drafting (Schmitt, 1999).
21
3.2.2. Sketching in the Digital Medium (3D CAD Environment)
Marx (2000) describes digital design as a process in which design decisions are made
‘on screen’ rather than with sketch paper, through all stages of the design process.
Digital design proceeds in three dimensions like assembling a model so that one can
study a design from many more points of view (than is possible by traditional views)
because it is easy to create multiple renderings from many viewpoints or to make any
changes and generate alternatives. So digital design does not represent the traditional
approach where plan, section and elevation are primary, with three-dimensional
representations coming last as an afterthought. (Seebohm and Van Wyk, 2000).
Digital sketching may seem different as a process, but has a common aim with the
hand sketches, which is to make representations that are for conceiving and
communicating in the conceptual design. This aim is possible when the use of digital
design is not only limited with presentation purposes. Digital design employs three-
dimensional (3D) spatial analysis and photo realistic rendering opportunities even in
the conceptual phase of design. As Madrazo (1999) states, the visual representations
can be used for better understanding of the form, thus as a support for conceptual
design as design is claimed to be visual thinking.
Considering the designer’s cognitive activities during the design process, Johnson
(1998) emphasizes designer’s interaction with visual representations. He has selected
digital media to explore and compiled guidelines for CAD representations. The
guidelines propose that representations should let the designer do much work in
graphical format (like hand-sketch), there should be architectural elements, these
elements should have the corresponding characteristics, representations should be
nestable, refinable and so on. Johnson (1998) states that “steps have already been
taken, and ironically some of the best examples are cheap house-modeling software
marketed to help non-architects design their dream house” (22).
22
3.3. Comparing Traditional versus Digital Media
Hypotheses comparing the characteristics of design media agree that traditional
representations are far more fluid and appropriate than digital media for initial and
fast development of ideas, and the stimulation of imagination. Whereas, digital
media are stronger for design development as they demand higher levels of
geometrical definition and abstraction, coordination of details and as digital design
allows easy visualization (multiple viewpoints), manipulation, storing of models and
images with rendering simulations (Bermudez and King, 2000). Still CAD is said to
unfulfill its potential in architecture and is not used in the early conceptual phases of
design. According to Richens (1994) the primary qualities of a conceptual CAD
system should be simplicity, informality and readiness-to-hand, and the software
should have qualities that engage hand and imagination, and that promote
exploration and discovery.
Verstijnen et al. (1998) have examined ‘combining’ and ‘restructuring’ in sketches as
a creative process, and have evaluated 3D CAD programs on these issues. Neither of
these components of the creative process, restructuring and combining, were found to
be supported well in current 3D CAD programs and it was concluded that they are
not helpful as tools for idea generation sketching in the early creative phases of the
design process.
Elsas and Vergeest (1998) have argued that CAD systems are blamed for not
supporting creativity. They refer to the literature where sketching and movement of
the hand play an important role during creative processes. A favored aspect of
sketching in design literature is that, not only can the designer quickly put an idea on
paper but these actions also enable him to generate new ideas. Whereas, Elsas and
Vergeest (1998) state that CAD systems were never designed for such tasks, instead
they aimed to: “improve the quality of conceptual design, allowing for faster
generation of design alternatives, providing a platform for better communication and
for evaluating design alternatives and avoiding the costly errors”. That’s why these
systems are called computer-aided conceptual design (CACD), in the industrial
design context. The use of digital media might vary in different design disciplines
23
(i.e. interior, graphical or industrial design), there could be many variables
contributing to the results in such comparative studies. So each study in this area
should be examined in its disciplinary context.
Such an experimental study was conducted by the author comparing the traditional
versus digital design medium in interior design education (Bilda et al., 2000). The
research question aroused from the thought that the digital medium might be a tool
for sketching as an alternative to traditional media in conceptual phase of design
process in interior design education. The digital medium provides a continuous and
interactive visualization of the designed artifact so that design thoughts and decisions
might be implemented in this medium. The hypothesis was that the digital sketching
leads novice designers to satisfy more functional criteria when compared to paper-
pencil medium.
The study confirmed that interactive 3D visualization of design in CAD environment
helped the novice designers to satisfy functional criteria better in the sketching
process. It was observed that there was a significant difference between two media
performances and the digital medium led to a better functional solution. Yet, the
hypothesis was true for a small group of students and there may have been
uncontrolled factors contributing to the lower marks in hand sketch problems. These
factors might include the voluntary character of this application, which made the
digital design medium more attractive for the students, since the traditional medium
was widely used throughout their design education. As a conclusion, it was observed
that the digital design medium for sketching was beneficial in two aspects: the novice
designers might interactively experience the functional quality of the environment in
3D during interior space planning; and the students were encouraged to deal with
interior issues and details such as color, atmosphere, furniture in the conceptual
design phase.
There is a recent study comparing visual thinking using computer and conventional
media in the conceptual phase (Won, 2001), which has a target quite close to the aim
of this thesis. Won’s major question is: “When designers use the computer as the
sketching media in the stage of concept generation, will cognition and visual thinking
24
be the same as when using conventional media? What kind of differences will there
be? And finally will there be a performance difference?” (320)
Won (2001) used three kinds of coding schemes to analyze the design activity in
different media. The first one is S-I-D (Seeing-imaging-drawing), which decomposes
visual thinking. The second one is SA-ST (seeing as and seeing that). The third one
is T-D (total-detail). The coding used in the study enables only a macroscopic view
of the design activity. The conclusions drawn are the following:
1- Designer’s cognitive behavior is simpler in conventional media and more
complex in computer media,
2- Intensive visualization and immediate feedback in computer media is said to
influence the designer to generate imaging in his/her mind more frequently
compared to conventional media.
The second conclusion gives evidence that the designer’s cognition or visual
thinking is different in digital media as it is inferred by Bilda et al. (2000).
Another comparative study was conducted by Goel (1995). He compared protocols
of design sessions where expert graphic designers solved a problem either via
sketching or using a computer based drawing system. His hypothesis was that, ‘in
contrast to traditional medium (sketching), the computer drawing medium is
nondense and unambiguous and should make lateral transformations (see section 3.1)
difficult’. The setting of the experiment proposes that if the designer introduces a
goal in the design process and if this corresponds to an alternative solution then there
exist ‘variation of drawings’, the frequency of this variable is measure of density.
The other variable is reinterpretation, which is defined as a change in the meaning
associated to a drawing, and the frequency of it is referred to as the measure of
ambiguity. Comparisons between computer based design sessions and the sketching
sessions revealed that there were significantly higher numbers of variations and
reinterpretations in the sketching sessions that were associated with larger numbers
of lateral transformations. In conclusion hand-sketches are said to be denser and
more ambiguous which corresponds to more complex cognitive activity.
There is a conflict between Goel (1995)’s conclusion and Won’s (2001) statement
that cognitive behavior is more complex in digital media. Actually Goel (1995)
25
compares the two media activities in terms of idea generation and reinterpretation.
On the other hand Won (2001) analyzes the design process mostly in terms of
perceptual features like ‘seeing as’ and ‘seeing that’. Won does not decompose the
design process into sub goals but into ‘moves’. Another difference was that Won’s
subjects were industrial designers while Goel chose graphic designers. The 3D nature
of the object design might be supported better in computer environment by 3D
visualization while graphic design, which proceeds in 2D, might not essentially need
it.
26
4. Analyzing Designers’ Cognitive Actions in
Traditional versus Digital Media.
The aim of the present study is to compare the design activities and designers’
cognitive actions in traditional (hand sketch) versus digital media (CAD
environment) during conceptual design. The focus of the study is on gaining insight
on design processes in different media. This is achieved by analyzing designers’
interaction with the protocol analysis technique and a coding scheme in terms of their
problem solving strategies/goals and their cognitive actions.
In order to analyze the design activities and designers’ actions from a cognitive
aspect, the protocol analysis method of Suwa et al. (1998) was used. A revised
version of Suwa et al. (1998)’s coding scheme was used to encode the cognitive
actions in the interior space planning activities.
As the study employs the protocol analysis method, a broader understanding of this
method is essential. Thus, the recent studies using the protocol analysis and the
coding scheme by Suwa et al. (1998) are explained below and the coding scheme
used in this study is explained in detail. The design of the experiment, which was
conducted in three phases, is also discussed.
4.1. Protocol Analysis Method as a Tool for Coding Designer’s Cognitive Actions 4.1.1. Protocol Analysis Methods: Sketching activity was explored in chapter 3, within the scope of design cognition.
Research related to design, deals with computational models, concentrating on
developing systematic approaches and methods for design, as well as studies of
design cognition focusing upon the study of design processes in order to model the
cognitive processes and the structures of knowledge. The early attempts to
investigate the mental processes from which the sketching behaviour originates were
27
the introspective way of analysis. Many artists and designers had studied their own
creative processes and had introduced a great deal of ideas about the how, what and
why of sketching. Introspective methods formed in 19th century are said to be the
basis for the scientific revolution that led to the study of mental processes in
psychology (Verstijnen et al., 1998). The validity of the introspection method was
questioned because of the wide variety and lack of systematicity in self reports. A
better method was codifiying the behaviours of designers under observation, using
the primitive processes and the sequential patterns they create (Akin, 1986), which
was actually named the protocol analysis method.
Protocol analysis is a technique first used by Newell (1968) in studying information
processing sytems. A protocol is defined as the recorded behaviour of the problem
solver, usually in the form of sketches, notes, video or audio recordings (Akin,
1986). Difficulties with the technique immediately springs to mind. Many
researchers have argued the controversial aspects of the method. Akin (1986)
summarizes these controversial aspects of using protocol analysis in experimental
work as follows;
1. Since subjects are asked to verbalize their behaviours during protocol experiments, there is room for erroneous introspection.
2. Due to the extent of the analysis required to interpret the data and the quantity of the data itself, only small numbers of subjects can be used in each experiment. This is contrary to good experimental practice.
3. The thought process, being much faster than motor behavior, cannot be fully reflected through the motor responses of subjects.
4. There are usually gaps or periods of silence found in most protocols, which obviously does not correspond to lack of cognitive activity (181).
Akin (1986) considered the first two objections as misinterpretations of the protocol
analysis process in that:
Verbalizations are not introspections but are statements from which the current knowledge state of the designer is induced. The small size of the samples used is greatly offset by the thousands of observations found in the protocol of each subject, and conclusions are generalizations about the behaviors of each problem solver rather than the consistency observed between many individuals (181).
The last two objections are comprimised by the techniques discovered in recent
research such as video-recording of the process and retrospective reporting. Akin’s
(1986) method of work on protocol analysis was later referred to as concurrent
protocol approach.
28
Two types of protocol approaches that had been developed in design research are
named as ‘concurrent’ and ‘retrospective’. In order to obtain concurrent protocols,
the subjects are required to design and verbalize their thoughts simultaneously, while
in retrospective protocols subjects are asked to design first and then retrospectively
report what they do with or without the videotaped design process as a visual aid.
Concurrent protocols, also called “think aloud method”, reveal the details of
sequences of information processes reflecting the designer’s short term memory
(STM); retrospective protocols reveal information preserved partially in STM and
partially stored in long term memory (LTM) (Gero and Tang, 2001). As the data
retrieved from LTM might have details omitted or might be generated by reasoning
rather than recall, videotapes of the design sessions are used as cues during
retrospective reporting to assist in the recall of design activity.
The workshop on ‘Analyzing Design Activity’ (The Delft Protocols Workshop
conducted in the Faculty of Industrial Design Engineering at Delft University of
Technology in 1994), was an important reference work, to compare the diverse
approaches to protocol analysis. An international and a distinguished group of design
researchers analyzed the video-recorded sessions of an individual’s and a group’s
design activity. So there were quite different analysis approaches, which figured out
the strengths and weaknesses of the design inquiry techniques and validated the
protocol analysis as a research technique. Two studies from that workshop, are
especially important for the scope of this chapter which is exploring the protocol
analysis method and studies that build up a basis for the recent research (Suwa and
Tversky, 1997; Suwa et al., 1998, 2000). The first study by Akin and Lin (1995)
explored the importance and influence of nonverbal thought on the design process,
which had become a fundamental aspect of the recent protocol studies. The second
study by Dorst and Dijkhuis (1995) built up a theoretical framework that design
methodology offers for empirical research, which was adopted by recent protocol
studies as a protocol analysis approach.
Akin and Lin (1995) classified the data in design protocols in two forms: verbal-
conceptual and visual-graphic. Design protocol studies both have the audio-recorded
verbalizations and record of drawings in a systematic way. So the medium of
29
designer’s work was said to be through two modalities, speech and graphics. Akin
and Lin explain the difficulty of this approach: “…neither the verbal (transcriptions)
nor the visual (drawings) data alone can explain the design process adequately.
Looking at this data, we are never sure if the designer is doing purely visual or
conceptual processing” (213).
In order to overcome these problems they categorized all activities into a six set of
protocols which were namely; drawing, talking, writing, thinking, examining, and
listening. They observed the designer performing the task at hand using one or more
of these activity modes (activity based model of design process). In this model
talking became a mean through which the other activities could be better understood.
This activity based model was said to be not only comprehensive (on behaviour of
subjects) but also a better representation of the design process. As a method of
analysing the design activity, they tried to correlate the design decisions with the
activity based design modes. They had found a correlation between the triple mode
(Examining-Drawing-Thinking) and novel design decisions. At the end, they gained
cues about the analysis of concurrent protocols that is: “Primary evidence should be
collected from data gained by monitoring the designer’s behaviours and produced
sketches, rather than verbalizations and the transcriptions should only be used as a
secondary source or road maps to the former” (236).
Protocol studies revise the definitions of design activities in order to analyze the
design process. The study by Dorst and Dijkhuis (1995) describes two paradigms in
that sense: ‘design as a rational problem solving process’ and ‘design as a process of
reflection in action’. The two paradigms could be interpreted as ‘process-oriented’
versus ‘content-oriented’ approaches to protocol analysis. The former approach
focuses on describing design processes as rational problem solving where problem-
states, operators, plans, goals and strategies are involved. On the other hand, the
content oriented approach based on Schon’s (1987) reflection in action model, deals
with what designers see, attend to, think of and retrieve from memory while
designing (Suwa et al., 1998).
30
4.1.1.1. Concurrent versus Retrospective Protocols Recent research on protocol analysis does not employ the think aloud protocol
method based on Lloyd et al. (1995)’s suggestion that talking aloud concurrently
might interfere with participant’s perception during the sketching activity. Their
study explored the elicitation of design thinking and the problem of talking while
designing. Lloyd et al. (1995) stated that: “Architecture is a medium of thought
which is very powerful and that in the same way, as say, mathematics and music are
media of thinking, we have our medium of thinking and the difficulty with it of
course is, like music, that is a medium that’s extremely difficult to talk about” (239).
They have searched the aspects of design thinking that are not effectively revealed by
concurrent verbalization and additionally, verbalization was found to be affecting the
design task in an experimental situation. They conclude that many types of enquiry
such as interviews, retrospective reports, concurrent reports and introspection had to
contribute to an empirical understanding of the design process. Referring to this
research, recent protocol analysis studies have used video recording of the design
process with retrospective report of the designer (Suwa and Tversky, 1997; Suwa et
al., 1998 ; Kavakli et al., 1999; Suwa et al., 2000).
The most recent research by Gero and Tang (2001) compares the concurrent and
retrospective reporting in protocol analysis method for a process-oriented aspect of
design. They used what Lloyd et al. (1995) suggested a combination of several
enquiries:
In order to have both concurrent and retrospective protocols from a single design session, we used four phases: warm-up exercises, think aloud while designing, retrospection and final interview. Two warm-up exercises were used to accustom the subject to the methodology. During the think aloud phase the subject designed and generated a concurrent protocol at the same time. In the retrospective phase, he generated a retrospective protocol with the aid of the videotape of his designing (286).
Although Lloyd et al. (1995) proposed that the concurrent protocols cause
incompleteness in revealing the design process, Gero and Tang (2001) conclude that
in terms of process-oriented aspects of designing concurrent protocols have the same
abilities as retrospective reports.
31
4.1.1.2. Recent research Recent protocol analysis methods have employed both segmentation and encoding. A
framework was formed by Gero and McNeill (1997) by considering designer’s
activity as a sequence of actions or micro-starategies. A representation of the
designer’s actions was formed by identifying similar actions and creating a list of
repertoire used during design episode. The source of the repertoire was the protocol
where the protocol is segmented, a coding scheme was developed and the segments
were categorized. Here the approach to protocol analysis is said to differ in the
addition of model-based codings and the design-dependent set of codes. The method
in Gero and McNeill’s (1997) work focused on designer’s actions and intentions. The
protocol is divided into segments according to changes in designer’s intentions. The
study is said to be a process-oriented approach to protocol analysis.
A similar approach to protocol analysis in the architectural context was introduced
by Suwa and Tversky (1997). They chose a retrospective protocol method since their
goal was to focus on the cognitive content of the design process. They examined how
designers cognitively interact with their own sketches by devising a general taxonmy
for the contents of designer’s cognitive processes as a coding scheme. The
classification of the contents was based on visual and non-visual information. They
have described the visual information content as “depicted elements and their
perceptuals features” and “spatial relations”. Non-visual information was classified
into “functional thoughts” and “knowledge”. The significance of the classification
was that the dependencies between the different information categories could be
examined. Suwa et al. (1998) related an example with the infromation categories:
...an architect’s attention to a spatial relation between two regions in a sketch is based on the inspection of the physical depiction of each region, which belongs to ‘depicted elements and their perceptual features’. When an architect thinks about the circulation of people from one region to another, which belongs to ‘functional thoughts’, it occurs to his/her mind by being suggested bt the appearance of a spatial relation between the two regions in the sketch. We believe that dependncies of this sort between cognitive actions are the key to understanding the ways which designers cognitively interact with their own sketches (462).
The study by Suwa and Tversky (1997) formulated four major information categories
(local or global relations), functional relations (interactions among spaces-things-
32
people) and background knowledge (knowledge retrieval from past similar cases).
Verbal protocols (as retrospective reports) of designers were coded as evidence to
each subclass of above categories. Then the encoded protocol was divided into
segments and they defined a segment as “one coherent statement about a single
item/space/topic”.
Goldschmidt (1991) has decomposed the design process into small units as ‘design
moves’ and ‘arguments’. A design move was defined as ‘an act of reasoning which
presents a coherent proposition pertaining to an entity that is being designed’, and
arguments as ‘the smallest sensible statements which go into the making of a move’.
Considering Goldschmidt’s (1991) definition, Suwa and Tversky (1997) have
proposed that a change in the designer’s intention or the contents of his/her thoughts
or his/her actions should flag the start of a new segment. Next they analyzed the
conceptual dependency among segments. This is again similar to Goldschmidt’s
(1995) system of analyzing design process in terms of relationships created by the
links among ‘design moves’ which she called linkography. This notion helped in
comprehending the structure of design reasoning. Suwa and Tversky (1997) called
each block of interrelated segments ‘a dependency chunk’ and the segments standing
alone as ‘isolated segments’. So a dependency chunk was defined as ‘a sequence of
conceptually interrelated design thoughts, each of which was evoked in relation to
preceeding thoughts in the chunk’. Another important definition was for a ‘focus-
shift’ segment. This corresponds to a case where the designer’s focus of attention
departed from the preceeding thoughts and moved to another item/space/topic.
Analyzing the design process according to the above criteria, Suwa and Tversky
(1997) concluded that the design process consisted of smaller cycles of focus shifts
and continuing thoughts on related topics. They examined statistical relations
between the segment types and the information categories characteristic of them. The
examination implies that ‘sketches serve as a perceptual interface through which one
can discover non-visual functional relations underlying the visual features.
Following the previous study, Suwa et al. (1998) devised a new scheme for coding
designer’s cognitive actions from video/audio design protocols. In that scheme
design actions were made definable in a systematic way using the scheme and a
33
designer’s cognitive behaviours were represented as structured primitive actions. The
basis for the coding scheme was Suwa and Tversky’s (1997) concept of information
categories. The basic method of the scheme had two aspects: segmentation and
action categories. The segmentation they refer to is identical to the one mentioned in
the previous study by Suwa and Tversky (1997). Actually the methods of
segmentation in recent research are similar to Goldschmidt's (1991) definition, while
the relationship between one segment and the encoding code are different. The
difference between two studies is explained as follows:
In the Gero and McNeill (1997) paper, one encoding code corresponds to one segment, so the length of segments is related to the subcategory. In contrast, in Suwa et al.’s (1998) paper, there might be more than one code in one segment, so the subcategory does not affect the segments while designers' intentions do. Moreover, the bases of segmentations are different in the two coding schemes. The coding schemes proposed by Gero and McNeill (1997) are principally based on the transcripts, while the schemes proposed by Suwa et al. (1998) are essentially based on the designer's actions in the video (Gero and Tang, 2001)
For each segment Suwa et al. (1998) coded cognitive actions of designers into the
four categories which are physical, perceptual, functional and conceptual (Appendix
A). The first category, called the physical actions are the ones relevant to paper such
as making depictions, diagrams, symbols on paper (D-actions). The other physical
ones are related to motion of pencil or hands (M-actions) and actions of looking to
previous depictions (L-actions).
The second category, called the perceptual actions (P-actions) are concerned with
designer’s attention to visual and spatial features of elements on sketches. This action
category has three subclasses. The first one is visual features (shape, size, texture),
the second one is spatial relations among elements (adjacency, alignment,
intersection) and the third class deals with organizations and comparisons among
more than one element (grouping, similarity, contrast). Further, P-actions are said to
be dependent on physical actions.
The third category, functional actions refers to consideration of non-visual
information. First subclass is related to the interaction between space-artefact-people
(views, lighting, circulation). An example is given in Suwa et al.(1998):
34
...when a designer thinks of a function of an artefact in terms of how people use it, s/he is addressing the issue of interaction between people and the artefact in the practical sense. The circulation of people in a spatial configuration is the issue of interaction between people and the space in the behavioral sense. The view from one place to another in a space is the issue of interaction between people and the space in the visionary sense (461).
The functional actions category also considers ‘the psychological or psychophysical
reactions of people when they interact with designed artefacts’ as a second subclass
such that: “The designer may consider that a curvilinear pathway might give visitors
a sense of ‘fascination’ or ‘expectation’ more effectively than just a straight path in
the middle of the floor plan, and thus people are more easily and naturally attracted
to small corners along the pathway” (462). Regarding this example for the two
subclasses, the flow of people within the shop would be coded as the first subclass of
functional action, and the sense of ‘fascination’ or ‘expectation’ as the second class
(Suwa et al., 1998).
The fourth category, that is conceptual actions refers to cognitive actions that are not
directly suggested by physical depictions or visuo-spatial features of elements such
as setting up goals (G-action), retrieving knowledge from past similar cases (K-
actions) and evaluation of P-actions or F-actions (E-actions).
The macroscopic analyses in Suwa et al. (1998) were based on two questions: “Do
actions belonging to particular cognitive levels dominate in particular design phases
in the process? If so what levels of actions are dominant in what phases? Do actions
belonging to a particular level tend to occur in correlation with those belonging to
another level?” (472). Regarding these questions they have analyzed the occurences
of each type of actions in the design process and correlation of different types of
actions. These analyses provided insights into the roles of sketches in design process.
More than these insights, the research by Suwa et al. (1998) is significant for the
present thesis for making designers’ cognitive acitons definable in a systematic way
using the vocabulary of the mentioned coding scheme. This system is said to have a
potential to provide the basis for microscopic analyses of how particular types of
actions contribute to the formation of key design ideas (Suwa et al., 1998).
35
4.2. The Coding Scheme The protocol analysis method used in the present study employs a coding scheme,
which is basically like Suwa et al. (1998)’s scheme. In order to describe the
procedure to analyze the protocols of the participants, the protocol has to be
separated into smaller segments according to a rule, which is called segmentation.
Suwa and Tversky (1997) and Suwa et al. (1998) in their studies have used a similar
technique for segmentation, considering the designer’s intentions by regarding their
contents of his thoughts. When the intention was stated as change, a new segment
would start. So a single segment might consist of one sentence or many. Then, for
each segment Suwa et al. (1998) coded the cognitive actions of designers into four
action categories. These two procedures make up the basic method of protocol
analysis, used in this study. The basic method of the scheme has two phases: (i)
Segmentation, (ii) Action categories.
4.2.1. Segmentation
In Suwa et al. (1998)’ study, the design problem was the design of a museum by
using free hand sketches. The architect was free to set up his goals himself, and to
decide on functions, structure, and form. In the present study however, the design
problem has many constraints in order to direct the designer into a problem-solving
process. The set up of the design problem, and the specification sheet limits the
design process into achieving some goals by the designer. So it is reasonable to
divide the design process into units according to the goals that designers most attend
in common. After each design session and protocol, a simple model of design
process in each session is documented by noting down the goals achieved. These
documented drafts help to form seven categories by figuring out the most common
goals and intentions. The segmentation in this study thus employs segments that
reflect the designer’s intentions in terms of their goals and subgoals in the specific
design problem.
The segmentation categories are depicted in Table 4.1.
36
Table 4.1. Segmentation Categories A. Defining/Creating a space component or an area
1. Mentioning the space only (gesture, circle rectangle, line) or drawing the
space component or area. 2. Putting things/objects into the space component.
Drawing a spatial element (doors, windows, etc.) Drawing a furniture (table, sofa, accessories etc.) Drawing an equipment (hand basin, bathtub, etc.)
3. Combination of 1 & 2 4. Substituting a space component with another one that had a different
function. B. Revisiting the space component for details
1. Adding space elements (window, door, etc) or/and furniture/accessories, equipment.
2. Associating local relations among objects/things (organization) 3. Combination of 2 & 3.
C. Redefining the space component
1. Transformation of a space component (scale/translate/rotate/change the geometry/combination)
2. Changing the organization of furniture/equipment According to geometry principles (adjacency/ symmetry/reflection).
According to functional requirements Combination
3. Combination of 1 & 2.
D. Definition of spatial relations.
1. Associating global relations (private/semiprivate/public areas) 2. Associating local relations between space components (putting door,
opening, wall, A1 & A2) – the design intention is extracted from the protocol.
E. Redefinition of (a) spatial relation(s)
1. Redefinition of global relations 2. Redefinition of local relations
By changing the location of a space component By changing the location of doors or reorganizing things/objects in or between the space components.
F. Reproduction of design
Copying the design / tracing on a new sheet / redrawing the layout
G. Looking at the 3D view (for CAD-sketch only)
This action becomes a segment when there is a strategy shift. It is not defined as a segment when the action takes place to check the design actions/decisions in the same segment.
37
It is not claimed that these categories cover all the possible goals and actions of the
designer in the specified problem solving process. But all the design sessions in the
experiment could be decomposed in terms of those categories. This classification
was achieved by analyzing the verbal protocols and watching the videotapes for a
number of times. When the designer changes his/her strategy or intention this should
flag the start of a new segment. Sometimes this change might not occur clearly, but
with the visual aid of the videotaped process, the designer most of the time
remembers his/her intention. As long as the change in intention is clear in the verbal
protocol, both the start-end and the type of the segment could be marked.
The following example might make the segmentation process more clear. A designer
draws one rectangle and one more next to the other. Is s/he right now defining or
mentioning a space (A1) (See Table 4.1) or associating a local relation between two
space components (D2) or is it both. Here the intention in the protocol gains
importance. By only looking at the videotape, the segment type could be either one.
In the verbal protocol the designer usually mentions his/her intentions like ‘now I am
trying to figure out a room’s relation with the bathroom’. Although s/he is defining
two space components at the same time, the coded segment type is D2, which is
‘associating local relations’. In some cases, the participants might not reveal any cues
about his/her intentions at that instant, but s/he surely states some cues before or after
the depicting those rectangles. So the verbal protocols are valuable as a whole. The
designer might have made an interpretation before an action or intention was going
to happen or the opposite.
The D2 type segment should be explained in detail. Associating local relations could
be done in several ways. This could be depicting a door or opening, which reveals a
decision about where the access should be from a space to a space, that gives
information about a local relation. Depicting a door might also be interpreted as
‘adding a spatial element into the space component’, the difference between them
again lies in the designers’ intention in the verbal protocol. A local relation might be
associated also by depicting a wall, which is high or low, transparent or solid; that
wall might also be depicted to define a separate space (A1) and again the segment
type coding depends on the verbal protocol. Another way to associate a local relation
is to organize or reorganize the furniture in a way that creates two separate lounges
38
as example (B2 and C2 segments). S/he might not even refer to a ‘local relation’ in
the verbal protocol while s/he already accomplished it, which means the major goal
in his/her mind was not to associate a local relation. So D2 segment would be again
coded depending on the stated intention of the designer. However, in that segment
the related functional action, which was ‘setting up two separate lounges’, will be
coded. As a result, it might be stated that segmentation is done according to the
major intention or goal that the designer reveals in the protocol. Similar approach is
valid for the E2 type segment.
The F type segment was used only in the hand-sketch media, which involved the
copying of design on a new sheet of tracing paper. There was no reproduction
activity in the CAD-sketch that would match the F segment type. The working
principle of the CAD-sketch software was based on modification or drawing a new
depiction, but not copy or mirror commands. In the same context the G segment was
not possible in the hand-sketch media. Drawing quick perspective hand sketches is
possible while working on the plan, but this does not refer to an interactive 3D
camera view, which the designer could recognize immediately the changes and
navigate in the environment. So this feature of the CAD-sketch should be a different
type of segment. When the designer uses this 3D view to check some attributes of the
space element while he had a major intention but this checking activity is only a
means to achieve the major goal, then looking at the 3D view did not become a
segment. Whereas in other cases where the major intention of the designer is to
check spatial relations, or functional issues such as assessing the privacy of the area,
circulation, view, lighting conditions, or aesthetical evaluations then looking at the
3D view became a segment.
4.2.2. Action Categories
Each segment included various kinds of cognitive actions. These actions were
classified into four categories, namely as physical, perceptual, functional and
conceptual by Suwa et al. (1998). These four categories corresponded to the levels at
which incoming information was thought to be processed in human cognition.
Incoming information was claimed to be processed first sensorily, then perceptually
39
and semantically. So the physical actions correspond to sensory level, perceptual
actions to perceptual, and both functional and conceptual categories to semantic level
(Suwa et al. 1998). The present study uses the same action categories, but the
encoded cognitive actions are selected from the ones in Suwa et al. (1998).
Regarding that the aim of this experiment being different than that of Suwa et al.
(1998), there were also some actions added to those ones. This study has been
planned as a comparative one which should provide an insight to the design activity
in traditional versus digital media. Unlike the recent research, this study tries to
analyze 6 participants’ design protocols in different media. This actually limits the
time spent on the analyses of the protocols. Both the segmentation and encoding of
cognitive actions are handled in optimum detail level, which means the evaluation of
the data is at a macroscopic level. The number of design sessions and the number of
participants bring limitations to the analysis at microscopic level. Regarding this as
the major reason for limitation, the other reasons behind selecting specific cognitive
actions to be encoded are explained below.
Physical Actions
Physical actions are divided into three categories, which are ‘draw’, ‘modify’ and
‘copy’ actions (see Table 4.2). These actions have been referred to as D-actions in
Suwa et al. (1998). They had also ‘look’ actions and actions that were related to
motion of pen or hands, but the present experiment did not employ those
subcategories of actions. The encoded actions and subcategories can be seen in Table
4.2.
40
Table 4.2 Physical Actions
The Dc action is making a depiction in both media, but Dsy, which is observed in the
form of arrow symbols usually, and Dts, which is copying, could be possible for
hand-sketch only. The coding scheme denoted the action of ‘copying many
previously drawn depictions’ as one Dts action. Same rule applied to the Dc action,
that even a rectangle is composed of many lines drawing a rectangle, because that
rectangle corresponds to the depiction of a room in designer’s cognition. Independent
of how many strokes s/he takes to draw that room the action was coded as one Dc.
Same rule applies in drawing of a single sofa, it is one action in hand-sketch media,
just like it is one Dc action in CAD media. In this way action of making depictions
could be relatively equalized in both media.
Drf is one of the most common modification actions, which becomes a significant
advantage in the digital media. One can change the size and shape of a room by
stretching the walls of a room. A similar action can be observed in hand-sketches that
a subject makes an additional rectangle to a previous rectangle and goes over the new
boundaries of that depiction. The advantage of the digital media appears to be that
editing of the color and texture of an object is possible as well as editing the parts of
it (e.g., number of mullions of a window) in the conceptual design phase. Dd is also a
common action in both media that is erasing by rubber or deleting an object. Md
could also be observed in both media, but it is a more common action in digital
P H Y S I C A L Actions
Subcategory Action ID Description
Dc Making new depictions (drawing lines, walls, things which are
object, furniture, accessories, space elements etc.)
Draw Dsy Depicting a symbol that represents a relation (for hand-
sketch only)
Drf
Revising the shape, size, or texture of a depiction. These
refer to stretching lines or areas, editing shape, color or
texture in the CAD environment.
Dd Erasing a depiction / delete a wall or object.
Modify
Md Moving a depiction/ object. Rotate an object.
Copy Dts Tracing over a depiction on a new sheet of paper (for hand-
sketch only)
41
media as ‘move’ or ‘rotate’ commands are frequently used in the commercial CAD
software. These commands also apply to the hand-sketches, that a designer might
rotate or move a depiction by drawing the transformed depiction over the previous
depiction with a differing line quality.
Perceptual Actions
This action category is divided into three, which are named as features, relations and
implicit subcategories. As described in Suwa et al. (1998) features refer to visual and
spatial attributes of depicted elements such as their shape, size or texture. The second
class defines spatial relations among elements such as connectedness, alignment, and
remoteness. There is also an action related to implicit spaces which is Psg. The
subcategories and the corresponding cognitive actions can be seen in Table 4.3.
Table 4.3 Perceptual Actions
PERCEPTUAL Actions
Subcategory Action ID Description
Pfn
Attending to the feature of a new depiction (shape, angle,
size, texture)
Pfnp Attending to the feature of a view in 3D (imagery or
graphical).
Features
Pv Creating or attending to a spatial relation between two space
components or area (symmetrical, adjacent, far, on the same
axis,…)
Prn Creating or attending to a relation between two
objects/things.
Plo
Attending to the location of an object in a space component
(alignment or geometrical definition).
Relations
Prp Discovering an organizational relation between
things/objects (more than two things/objects).
implicit Psg Discovering a space as ground.
42
Pfn action is usually coded when the subject’s attention is on the visual or spatial
attributes of a depiction such as “that room is big and rectangular” or “that panel wall
is made of glass” or “this coffee table is 45 degrees to the sofa”. Pv is an action,
which is not present in Suwa et al (1998), that is related to seeing a view in 3D. This
could happen in both media, such that in hand sketching the view is imagery in
designer’s mind (sometimes could be graphical with a quick perspective sketch),
whereas in CAD environment there is an interactive and continuous graphical 3D
view. The examples in a protocol could be “that wall is low” or “the view to privacy
area is hidden by that wall”. Pfnp is related to the relation between space components
such that “bathroom is adjacent to the corner room” or “the terrace is on the same
axis with the living area” or “two corner rooms are symmetrical”.
Plo is not present in Suwa et al (1998) either. As the design problem in this study
was an interior space-planning problem, and the subjects were interior designers,
they usually attended to the location of an object in a space component more than an
architect does. This tendency was mostly observed in the CAD environment, because
of the following reason: The user selects an object from the library menu and clicks
on it and drags that object over the plan then moves the object around the place while
looking for the best location. Then s/he clicks to release the object there and then
s/he usually moves it several times to locate it precisely. So s/he tries to figure out an
alignment or geometrical definition with respect to the space component that the
object is going to be located in. Same action could be observed in hand-sketching
also but not as frequent as observed in CAD environment, because the objects are not
moveable but static in hand-sketches.
The Prp action denotes associating an organization between more than two elements,
which could be furniture or equipments. This action is usually inspected in the
videotaped processes. Sometimes designer might not mention that s/he organized the
things/objects but might give cues that are functional such that “the couches and the
two single sofas in the chat lounge provide seating for 4 people”. Designer might be
drawing and moving furniture while stating that phrase as a verbal protocol. It could
be interpreted that the designer’s attention was on the organization of the furniture
and Prp could be coded in this case.
43
Prn is similar to Prp in the principle of encoding, and it denotes a relation between
two elements/objects/equipments. Designer might place the closet next to a door and
attend to the relation between them. S/he might evaluate this relation conceptually
afterwards, but as long as s/he states (for e.g.: “…it fits to that place next to bathroom
door but when someone opens the door it wouldn’t be nice to see the closet”), the Prn
action would be encoded in that case also with some other actions in functional and
conceptual category.
The last perceptual action, named Psg is related to a discovery of a space as ground.
This space might have been implicit before, but then might be emergent to the
designer as a result of some changes in the depictions so in that case Psg is coded.
Functional Actions
This category is divided into three subcategories named as ‘implement’,
‘reinterpretation’ and ‘thought’ functions. ‘Implement’ refers to the functions related
to implementation of functional criteria that the designer makes up in his/her
strategies. ‘Re-i’ refers to reinterpretation of a function and this category has only
one encoded cognitive action (Fre-i). The last subcategory (thought functions) is
related to the functions, which the designer thinks of during the design process. This
study does not employ the category related to psychological reactions of people,
which was mentioned in Suwa et al. (1998), but only functions related to interactions
between people and artifact. As most of the functional criteria were given in the
design specification sheet (with the design brief), the designer was assumed to think
of those functions (Fc, Fnp), try to implement them (Fn, Fi), and sometimes
reinterpret the functions. That is why the functions below (Table 4.4) were selected
from Suwa et al. (1998), and were revised in meaning identification to fit this study’s
situation.
44
Table 4.4 Functional Actions
Fn is coded when a thought function is implemented. In the previous segments
designer might continually think of a function that was either in the design
specification sheet or discovered by him/her to meet his/her goals. If this thought
function is mentioned while making related depictions, it is usually Fc, and it is
assumed to be soon implemented by the designer. If the designer might remember or
refer to some functions before making any depictions related to that situation then the
function is coded as Fnp. An example of Fc or Fnp might be all rooms should be in
similar size”, “two rooms should share one bathroom” or “the living area should
view the scenery”. When the designer implements a requirement that the function
proposes then the encoded action is Fn. The designer might explore the ways to
implement a function but might leave it aside for later inspection. Then s/he would
figure out a way and implement that previously explored function which is encoded
as Fi.
The designer might choose to reinterpret a function. An example for that case is as
follows: The designer draws a separate rectangular dining table near to the open
kitchen. Then s/he erases that table and draws a circular table added to the kitchen
counter, and draws six high chairs around it stating, “I thought that these are young
people and may eat in such a setting, I think this is more dynamic”. So the kitchen-
dining relationship and the function related to it was re-interpreted, then Fre-i should
FUNCTIONAL Actions
Subcategory Action ID Description
Implement Fn Associating a new depiction, feature or relation with a
specific function that was previously thought or newly
discovered.
Fi Implementing a previously explored or thought function by
creating a new depiction, feature or relation.
Re-I Fre-I Re-interpretation of a function
Fc Thinking of a function to be soon implemented. Thought
functions Fnp Thinking of a function independently of depictions.
45
be encoded. Here, also Fi would be encoded, as this case is a new setting for a
previously explored function.
Conceptual Actions
There are two conceptual actions, which are named as G ‘setting up goals’ and K
‘retrieval of knowledge from past similar cases. As seen in Table 4.5 the explanation
of the G actions is taken from Kavakli et al. (1999), as that study has an approach
closer to an architectural context, which also fits more to the situation of this case
study. As can be inferred from the explanation G actions are related to functional
actions. The previous example where the designer changes the setting for the dining
area could be an example for encoding the conceptual actions. G1 (as the first
conceptual action) would be encoded by “young people may eat in such a setting”
phrase, which is introducing a new function; G2 (second action) would be encoded
by “this is more dynamic” phrase, which is evaluation of the function.
Table 4.5 Conceptual Actions
CONCEPTUAL Actions
G Setting up of goals
Introducing new functions, resolving problematic conflicts, and goals
to apply introduced functions or arrangements (Kavakli et al., 1999)
K Retrieve knowledge
An example to K action might be subject’s statement that “this model I used here,
where two rooms share one bathroom is common in most hotel layouts”. This is
actually recalling knowledge from a past similar case to solve a current problem.
46
4.2. The Experiment The subject group consisted of six graduate students (of whom three were male and
three were female) in the Department of Interior Architecture and Environmetal
Design at Bilkent University. The 6 participants were voluntary and had the basic
knowledge and experience in CAD. They had completed the two undergraduate
AutoCAD courses in one dealing with 2D drafting and the other one introducing the
3D modeling. The participant profiles are examined in detail in a suceeding section.
In general, the participants were knowledgable about design studies, methodologies
and design education. They haven’t been actively designing for at least one year
(they are not practising designers) but all have been giving design critiques to
undergraduate students.
The experiment was conducted at two places, an office room and a CADlab
(Appendix B). The computer in the CADlab was a PentiumIII. A second monitor and
a video recorder were connected to the PC to record the digital design process. In the
office room, a camera was placed above the sketching desk which was connected to a
TV (far from the designer) and a video recorder to monitor and videotape the design
process.
The DesignApprentice (www.designapprentice.com )software used in the experiment
is an easy to use one especially for the interior space planning tasks. It is a cheap,
house-modeling software as Johnson (1998) has described for an ideal CAD
representation. The design proceeds on with space elements such as wall, window,
door, column and furniture instead of lines. The software has many objects in its
library so that the designer can revise the shape, size and texture to fit into his/her
design. While drawing the plan, the user has the opportunity to switch to 3-
dimensional (3D) view (isometric or camera view) to inspect the changes
interactively in the environment.
The hypotheses for the experiment were not strictly set up. The analysis of the total
numbers as well as the frequencies in percentiles of segments and action categories
and subcategories were supposed to display the differences between the two media.
47
The experiment was conducted in three phases. The first phase was a training period
for using the Design Apprentice software. The second phase involved in sketch
design sessions in traditional (hand-sketch) versus digital (CAD-sketch) media. The
third phase finally, was the retrospective reporting task following the design sessions.
4.3.1. First Phase The purpose of the two-week training program was to acquaint the participants with
the Design Apprentice software; introducing the opportunities of the software and
helping them to get into the habit of using the software in interior space planning
process. The training program lasted 4 to 6 hours depending on the participant’s
interest in the software and learning duration. The participants had a starting lecture
introducing the necessary commands and features of the software that would make
the drafting process easier. Then they were required to design a single story house
for a family with pre-defined space components. They experienced designing on
screen using the software. The problem required space planning on a given layout.
The participants had no time limit. After finishing the sketch problem, the participant
was asked to explain his/her design decisions and preferences. The process went on
like an interview to let the designer evaluate his/her design and at the same time to
gain a previous insight on the designer’s view. The interview did not only a rough
rehersal of retrospective reporting but also a way of enquiry on participants’ profiles.
4.3.2. Second Phase
The second phase consisted of three consecutive design sessions. The six participants
were divided into two groups randomly. Group 1 (1 female and 2 male participants)
had the design sessions in CAD-HAND-CAD media repectively and Group 2 (1
male and 2 female participants) had the design sessions in HAND-CAD-HAND
order. In the first design session, the designer is required to solve the design problem
1, in the second sesssion design problem 2 and finally in the third session problem 1
again. The reason for giving problem 1 again is to test the learning effect and to
control the changing of variables in the design process. The sequence of the designed
experiment is shown in Table 4.6.
48
Table 4.6 Sequence of the Experiment
Group 1 Group 2
Session 1 Problem1 CAD-sketch Hand-sketch
Session 2 Problem 2 Hand-sketch CAD-sketch
Session 3 Problem 1 CAD-sketch Hand-sketch
The participants were given 1 hour for each design session and 10 min breaks in
between. The design brief (Figure 4.1) consisted of a problem definition for an
interior space-planning, with a given layout and a specification sheet stating the
client’s requirements. The participants were required to design a flat for four friends
with given space components. The required space components were entry, living,
dining, open kitchen, four bedrooms and a balcony/terrace. The most important
feature required in the design problem was the interior space planning with functions
achieved through appropriate room sizes, internal relationships and spatial hierarchy.
The specification sheet states these requirements in detail. The given boundary was
12m x 20m rectangle and the location of the scenery was indicated. The two design
problems (1 and 2) differ only in the configuration of entry in the layout. The
problem definition and the specifications were the same in two design problems.
49
Figure 4.1 Design Brief
The participants were not asked to report concurrently what was going on in their
minds also they were not interrupted by the experimenter. The three design sessions
were videotaped. Third design sessions lasted for half an hour for the hand-CAD-
hand group and 40 to 60 min in CAD-HAND-CAD group.
4.3.3. Third Phase Following the design task the participants were asked to remember and report what
they were thinking while drawing each portion in the sketch. They watched their
videotaped sessions while reporting, so that they could recall the design thoughts by
the visual aid. If their reports lagged behind the videotape, they were to stop the
videotape until they report all the things about the current topic. The opposite case
Figure 4.1. Design Brief
Design Specification Sheet 1. Each component have to be in the following areas
Public area Semi-private area
Private area
Entry Kitchen Living Dining
Bedrooms (4) Bathrooms
2. The entry should have easy access to kitchen, dining, living. 3. The kitchen should be open to dining and living space. 4. Satisfy the circulation in the kitchen. 5. Living should be adjacent to the outdoor component, and should face the
scenery. 6. Use glass doors opening to outdoor component in appropriate size and
location for daylight and to view the scenery in living area. 7. The living space should have two separate spaces, TV lounge and chat
lounge. 8. The boundaries of the two separate spaces in living area should be defined
by the organization of the furniture. 9. The living space should have furniture for at least four people in each
lounge. 10. Two bedrooms should have direct access to one bathroom. 11. Similar size for all bedrooms (might be in different geometry). 12. Sufficient space for bed and study unit in bedrooms. 13. Use high windows at one wall of bedrooms.
Design Problem 2 You are required to design an apartment flat (inthe city) for four friends in their late 20’s. Asthey are sharing the flat you should design topermit effective common usage of spaces whenfour of them are at home at the same time. Youshould assess the privacy and community ofareas, the organization of furniture, and spacefor circulation within the required spacecomponents.
Required Space Components Entry---4 bedrooms---Living---Kitchen---Dining---2 bathrooms---balcony or terrace
Design Problem 1 You are required to design an apartment flat (inthe city) for four friends in their late 20’s. As theyare sharing the flat you should design to permiteffective common usage of spaces when four ofthem are at home at the same time. You shouldassess the privacy and community of areas, theorganization of furniture, and space for circulationwithin the required space components.
Required Space Components Entry---4 bedrooms---Living---Kitchen---Dining---2 bathrooms---balcony or terrace
scenery
12m x 20m
scenery
12m x 20m
50
The participants were not asked to report concurrently what was going on in their
minds and they were not interrupted by the experimenter. The three design sessions
were videotaped. The third design sessions lasted for half an hour for the HAND-
CAD-HAND group and 40 to 60 min in CAD-HAND-CAD group.
4.3.3. Third Phase
Following the design task, the participants were asked to remember and report what
they were thinking while drawing each portion in the sketch. They watched their
videotaped sessions while reporting, so that they could recall the design thoughts by
the visual aid. If their reports lagged behind the videotape, they were to stop the
videotape until they reported all the things about the current topic. The opposite case
was possible where they were tracing the design on a new sheet or facing some
technical problems with the software, they were allowed to forward those portions on
the videotape. So the duration of the protocols was dependent on each participant.
The protocol of the first design sessions lasted about an hour to 1hr. and 15min,
whereas protocols of second and third sessions lasted one hour or less. Participants
were not interrupted with questions during the reporting task, unless they skipped
reporting about certain portions of their design activity. In that case, the participant
was asked to rewind the videotape and report on those portions. In some cases, the
participants had difficulty in remembering or figuring out what their intentions were
in a portion. Then the participant was allowed to watch the design activity for a while
without reporting until s/he could recall his actions or design thoughts, and when s/he
remembers, s/he rewinds the videotape and reports on the portion. Not only the
participants’ voices but also the screen was videotaped. So, pointing gestures of the
participants were visible in the report task, which provided evidences for the
mentioned topics thus helped in the analysis of the protocols.
51
4.3.4. An Example of the Coding Scheme
In order to make the encoding procedure clearer it might be useful to depict an
example from the coding scheme. Table 4.7 shows an excerpt from the protocols of a
subject employing HAND-CAD-HAND sessions. Table 4.7 is an example from a
CAD-sketch session.
Table 4.7 An Example of a Verbal Protocol Segment PROTOCOLS 18 The bathrooms are too big. So, I decided to change the bathrooms.
And I make the size smaller (v: 2stretching the wall), to the rooms’ size. I see that corridors emerged. I try to locate the bathtub…I chose a closet and located it. Then I select a door type, and plug it in the walls (v: of two bathrooms). I liked the place of doors. I placed the doors near to rooms, not near to each other. Ok, one more thing. I put the closets adjacent to each other in the bathrooms, and also the bathtubs, they all share the same wall, I thought on ease of plumbing.
19 Now I think on this place (p: 1emerged corridor space ). There is a loss of space here, and I want to add this space to semi-private area. I thought that could be the place for kitchen. It is good that wet spaces would be together, but then I realized that the space would be narrow and will be in between chat and TV lounges. Further, I couldn’t solve the problem there, so I changed my mind then. I found a new solution, later.
20 Now I’m looking for a wardrobe and types of beds, and drawers. I chose a wardrobe and put two wardrobes to here (p: two bedrooms) and here. Then I did the same thing for the others. Now the two rooms at the corners are symmetric, adjacent ones are symmetric, and bathrooms are symmetric also. When I look from here (p: living area) to there (p: private area), I can’t see the doors of the bedrooms, they are hidden, that’s what I want. And when I’m here (p: in front of the lobby), I only see that wall, and doors of bathroom and bedroom are hidden, and we can hang a picture on that wall by lighting it in a theatrical effect. I search for furniture to put in the bedroom. I put a desk, near window. I select a bed type but do not locate it. I move the desk, then place the bed there. I choose a drawer. I place the other beds, and then drawers next to them. I zoom in to bedrooms, to place the desks precisely, and chairs, which I’ve selected. Then I rotate the chairs a little.
1 (p:…)- pointing to areas or things when reporting 2 (v:…)- the visual cue in the video recording.
52
Table 4.8 shows the encoded categories of the above protocol segments: Table 4.8 The encoded categories Segment 18 type C3 Segment 19 type A3 Physical Physical ID Content ID Content Dc 1 bathtubs (2) Drf Wall Dc 2 closets (2) Dc 3 bathroom doors (2) Dc 4 sinks (2) Drf stretch the bathroom wall
Perceptual Perceptual
ID Content ID Content Plo 1 locate the bathroom doors Pfn Space would be narrow Plo 2 locate the bathtub Pfnp in between lounges Psg discover a corridor space Prn Closet and bathtub. Functional Functional ID Content ID Content Fn 1 bathroom doors are near to rooms Fnp wet spaces together
Fn 2 bathtubs and closets share the same wall
Conceptual Conceptual ID Content ID Content
G 1 I liked the place of doors G 1 that space could be kitchen
Segment 20 type B3 Physical Perceptual ID Content ID Content Dc 1 wardrobe (4) Plo desk
Dc 2 desk (2) Prn relation btw window and desk
Dc 3 bed (2) Pv 1 doors are hidden
Dc 4 drawer (2) Pv 2 picture on the wall with lighting
Dc 5 chair (2) Pfnp room organizations are symmetric
Md 2 rotate the chairs (2) Md 1 move the desk Functional Conceptual ID Content ID Content Fn privacy of the p-area satisfied G 1 hang a picture on the wall (doors are hidden) G 2 place the desks precisely
53
4.4. Results Results are presented in two sections, which constitute the analysis of data related to
segmentation categories and cognitive actions. For simplicity cognitive actions will
be referred to weather as CA in the rest of the study. Again for a simplistic
representation traditional media will be referred to as HAND and digital media will
be referred to as CAD. The numbers next to the name of the media represents the
session number, so HAND 1 denotes the case where the first problem session was
conducted in traditional media. Another common term which will be used in this part
is ‘frequency’ which refers to the occurrence of a particular action X in percentiles
throughout the entire design session.
4.4.1. Analysis of data related to segmentation categories
The design process of each individual designer was separated into elements called
segments referring to designer’s intentions or goals in design sessions. Using these
segments, it is possible to redefine the whole design process. In the body of each
segment, there are various encoded cognitive actions. Segmentation allows the
interpretation of the design behavior in terms of goals and problem solving strategies.
Each designers’ session had a different number of segments in total depending on
various variables such as the designer’s way of problem solving, his/her procedure of
decision-making, learning effect, media and so on.
Total number of segments
The total number of segments in each session of each individual designer is shown in
Figure 4.2 and Figure 4.3. Subjects’ behavior having the HAND-CAD-HAND
sessions had a common decreasing pattern (Figure 4.2). The first problem session
had the highest number of segments due to the fact that the designer not only tries to
understand what is required, but also chooses among various alternatives to obtain
the best solution. When the second problem is introduced, it is expected that the
designer will be more stable in his/her decision makings as s/he already knows what
is expected. This results in a decrease in the number of segments because the
intentions or goals would have less shifts compared to the first session. In the third
session, the number of segments is expected to decrease even more since it is the
54
designer’s second opportunity to work on the same problem. S/he already knows
both what is expected and the outcome related to each. In this session, the designer
might choose to work on a totally different alternative or on the same one by revising
a number of parts. These preferences affect the number of segments in the third
sessions.
Figure 4.2. Total number of segments in HAND-CAD-HAND sessions Figure 4.3. Total number of segments in CAD-HAND-CAD sessions The expected pattern of problem solving behavior can be seen in the HAND-CAD-
HAND sessions (Figure 4.2), whereas CAD-HAND-CAD sessions depict a different
pattern (Figure 4.3). There is an increase in total number of segments for two
subjects and a decrease for one subject in the second session. The second session was
the one in which the traditional media was introduced after a CAD-sketch session.
Considering the ambiguous nature of sketches (Goel, 1995), designers might tend to
change their decision-makings and change their goals more frequently when they use
0
10
20
30
40
50
60
cad 1 hand 2 cad 3Sessions
tota
l num
ber o
f seg
men
ts
S1
S2
S3
0
10
20
30
40
50
60
hand 1 cad 2 hand 3Sessions
tota
l num
ber o
f seg
men
ts
S4
S5
S6
55
the traditional media. Only Subject 1’s session has a quite small number of segments
that the number is even smaller than the number of segments in the third session.
This can be explained by designer’s preference on his/her ambiguity level (trying
alternative solutions, reinterpretation of depictions or variation of sketches) which
was mentioned to be related to a creative process by Goel (1995). This issue will be
discussed in detail later, considering the designers’ profiles, their approaches about
using different media and by comparing some variables in their sketching activities.
Segment categories versus media
The next step to analyze the segmentation data is to check if the segmentation
categories are dependent on the subjects’ performances in design sessions of
different media. A chi square test (χ2) was conducted by using the mean number of
segmentation categories in all CAD or HAND sessions (Table B1 in Appendix B)
versus media performances of subjects (for details of the test, see Table B3). Table
4.9 shows the chi square probability values for CAD and HAND media with the
given degrees of freedom. The values of p do not provide evidence for dependency,
so it can be concluded that the devised segmentation category scheme is independent
of the subjects’ performances in the two media.
Table 4.9 Dependency of segmentation categories on subjects’ performances in CAD and HAND media Design Media Probability of χ 2 Df
CAD 0.97 10
HAND 0.83 10
Segmentation categories were formed according to the goals and sub goals that the
designers attended to achieve in each design session, which also reflected designer’s
intentions in solving the design problem (Section 4.2.1). Use of the segmentation
categories enables us to decompose the design problem into episodes of goals and
sub goals. The occurrence of each type of sub goals while the designer is engaged in
a specific task could be examined. This might provide a general understanding of
designer’s problem solving strategy.
56
Strategy Clustering
It was observed that designers tended to solve the space planning problem by
simplifying it into two tasks. The first one is, dealing with the private area and the
second one with the semi-private area. The public area was the entry, and was
already located on the layout in the design brief. As the public area was indicated, the
designer started to make a decision on the division of the layout plan for private and
semi-private areas. Thus, the first thing to deal with was the global relation, which
determine the private and semi-private areas regarding their spatial relations and the
scenery. The second issue was the assessment of local relations among the space
components found in the private and semi-private areas.
Each designer was observed to have a different strategy in dealing with the assigned
areas (public, private and semi-private). The period (in terms of segments) they spent
to focus on certain areas changed. While dealing with the design of a certain area or
component, some chose to shift to another part of the layout, and then return to that
area again later on, while some of the designers finished the design of that area
completely then started the design of the new area. During the design sessions,
designers were observed to focus on an area in terms of segment numbers as:
• 6 or more segments
• 2 to 5 segments
• less than 2 segments.
Table 4.10 shows an example of how the strategies in the space planning process
were clustered through either chains of segments or appeared in one segment only
(the complete documentation of strategy clusters is in Appendix B – Table B4). The
frequency of shifts in strategies depends on the characteristics of designer’s problem
solving. There is not a single model to identify the frequencies of shifts in the design
13-16 Back to private area 7-12 Semi private area 17-23 Dealing with semi-
private area 13-14 New layout and
global rel.
24-29 Back to private area 15-20 Dealing with private-area
30-34 Semi-private area 21-28 Semi-private area
The designer’s focus on different strategies should be examined with another set of
data, which is the occurrence of segmentation subcategories in each strategy cluster.
The types of segments in each cluster can be identified. The most common sub goals
for the first problem session were defined in two categories independent of the
media. These two categories were formed according to the tendency in the strategy
clusters, that a designer may deal with an area for the first time and may revisit that
area Table 4.11).
Table 4.11. Most common type segment subcategories Categories Dealing with an area for the first time Revisit that area Most common types of segments involved (1st. Session)
A1, A2, B1, C1, D1 and sometimes E2 A3, B1, B3, C1, C2, C3
Analyzing the sub goals in the strategy clusters, a profile of the problem-solving
process was identified. In the first two or three segments of the first problem
sessions, which can be called as problem definition state, designers deal with global
relations and with a rough sketch of the local relations either in their minds or by
external representations. This stage is usually very short in CAD-sketches, as the
designer decides on a spatial relation model only in his/her mind, but longer in hand-
sketches as the designer has the opportunity to have a diagrammatic representation of
the spatial relations. Deciding on an area to deal with, designers most commonly
define space components and spatial relations (A1, A2, D2), and redefine the space
components (C1) or add elements to the space components (B1). When the designers
revisit an area afterwards, they put things into the space components and organize
58
them (A3, B1), or change the organization of the things inside (C2) or redefine the
space (C3). Sometimes E2 was observed in ‘dealing with an area for the first time’
category. Those sessions (that included E2) had higher number of segments, because
redefinition of spatial relations usually triggered other decisions and goals, which
made the shifts in goals more frequent, and this results in a higher number of
segments.
While analyzing the changes in the strategies of the designers, it was observed that F
(copy the design) was usually followed by a redefinitive segment type (E or C type)
in the hand sketch design sessions. The frequency of this case is 72% while the rest
implies the case that F is followed by other type of segments. This means that, in
many cases, tracing the design on a new sheet of paper seems to trigger redefinition
of spaces or relations. In other words, designers tend to reinterpret some part of
his/her sketch after the copying activity. Then redrawing the sketches might be acting
as a tool to trigger visual thinking.
At the end of analyzing the strategy clusters, an implication about the use of 3D view
in CAD environment was made clear. Designers were observed to switch to 3D view
in three cases: At the end of the design session only, at the end of defining an area
and local relations in that area, and in the segments where s/he was curious about
‘how it looks?’ In three of the nine CAD sessions switching to 3D view was the last
action that the participant was involved in. When CAD sketch was the first problem
session two participants switched to 3D view after defining an area or associating a
local relation. So over the three participants in CAD-HAND-CAD sessions, two
participants used the 3D view to check out planning of an area and the spatial
relations. When CAD-sketch was the second problem session, none of the
participants inspected the space planning in 3D while designing as they were almost
acquainted with the problem. However, in six of the nine CAD sessions participants
were curious about how objects/things looked in 3D. They mostly switched to 3D
view; when they defined a new object (change size and parts), when they changed
the height of a wall or window, and when they want to check the relation of two or
more objects (e.g. bed and study desk).
59
4.4.2. Analysis of data related to cognitive actions (CA)
Total number of CA
The CA belonging to each subject for each design session were coded according to
the coding scheme explained in Section 4.2.2. In this section, there were three data
sets related to the CA in terms of action categories and subcategories. The first data
set displays the total number of CA (Appendix B – Tables B5 and B6). Second data
set displays the frequencies of the cognitive actions (Appendix B –Tables B7 and
B8). The third data set displays the normalized values for the action subcategories
(Appendix B – Table B9). The normalization table is used to understand where the
actual value stands, above or below the average of the action’s frequencies in the 18
sessions. The normalization equation is (Fx – Fxavg) / Fxavg, where Fx is the actual
frequency of a particular action X and Fxavg is average frequency throughout the 18
sessions.
The total numbers of CA in consecutive sessions of CAD-HAND-CAD and HAND-
CAD-HAND for each individual designer are shown in Figures 4.4 and 4.5. The
subjects’ CA having the HAND-CAD-HAND sessions have a common decreasing
pattern (Figure 4.5). Figure 4.5 is similar to the one demonstrating the total number
of segments in consecutive sessions (Figure 4.2) and the same pattern was also
observed there. The same reason for the decreasing pattern is also valid. The first
problem session had the highest number of CA because in this session designer not
only tries to understand what is required, but also chooses among various alternatives
to obtain the best solution to the problem so s/he is engaged in number of cognitive
actions. When the second and third problems are introduced, it is expected that the
designer will be more stable in his/her decision-makings as s/he already knows what
is expected and thus would be engaged in lesser number of cognitive actions.
Figure 4.4 demonstrating the total number of CA in CAD-HAND-CAD sessions
displays a common pattern for the 3 participants. Remembering that the total number
of segments was quite different in CAD 2 sessions (Figure 4.3), it can be inferred
that cognitive actions could be independent of the number of segments in the design
activity.
60
Figure 4.4 Total number of designers’ CA in CAD-HAND-CAD sessions Figure 4.5 Total number of designers’ CA in HAND-CAD-HAND sessions
In order to compare the cognitive actions with respect to media change, CAD 1(in
Figure 4.4) and HAND 1 (in Figure 4.5) sessions are analyzed at first. Thus, for the
first problem the number of CA is higher in hand-sketch media. In Figure 4.4 there is
an increase in the number of CA from CAD 1 to HAND 2 session and in Figure 4.5
there is a decrease in CA from HAND 1 to CAD 2. This indicates that more
cognitive actions are involved in hand-sketch media independent of the sequence of
the media introduced. When the first and third sessions are examined, it can be seen
that there is always a decrease in number of CA, which is called the ‘learning effect’.
The possible reasons for the higher number of cognitive actions involved in hand-
sketch media will be discussed later.
0
50
100
150
200
250
300
350
HAND 1 CAD 2 HAND 3sessions
#of C
A
SUBJ 4 SUBJ 5 SUBJ 6
0
50
100
150
200
250
300
350
CAD 1 HAND 2 CAD 3sessions
#of C
A
SUBJ 1 SUBJ 2 SUBJ 3
61
The second data set employs the frequencies of the four action categories. Frequency
of actions (in percentage) refers to how frequently an action category occurs in a
single design session with respect to the other action categories. Figure 4.6 shows the
distribution of the frequencies of four action categories for each subject.
PHY PERC FUNC CONC
S1S2
S3S4
S5S6
0,0%
10,0%
20,0%
30,0%
40,0%
50,0%
60,0%
action categories
frequency of the actions
Figure 4.6 Distribution of four action categories in the first sessions CA versus Media Sessions
A χ2 test was done to test if action categories were independent of the media (df=4).
The χ2 probability value of 0.785 in Table B.10 shows that the action categories
were independent of the introduced media.
The data related to action categories, next employs the interpretation of the
frequencies of the physical, perceptual, and functional action categories. In each
action category, the frequencies of the action subcategories are also displayed if there
seems to be a significant difference because of the medium of the design activity.
4.4.2. Analysis of data related to action categories
Analyzing physical actions
As seen in Figure 4.7, the frequency of the physical actions in CAD 1 sessions is
higher than HAND 1 sessions. Actually hand sketches include more physical actions,
62
since the designer continuously draws and frequently copies the drawings to another
sheet. Whereas lower frequency of the physical actions in hand sketching means that
the other action categories (perceptual, functional, conceptual) have higher
frequencies. Regarding these implications the reasons for higher frequency of the
physical actions in CAD media for the first problem sessions should be further
discussed.
(a)
(b)
Figure 4.7 Frequency of physical actions (a) CAD-HAND-CAD sessions (b) HAND-CAD-HAND sessions
As stated in section 4.2.2, physical actions category included ‘draw’, ‘modify’ and
‘copy’ subcategories, where copy action (Dts) was only valid for the hand sketches.
In order to analyze the physical actions in subcategories, the Table B4 in Appendix
B, named ‘the frequency of action subcategories’ was used. It was observed that
there was a major difference between the draw and modify actions in CAD versus
HAND media. Table 4.12 displays the mean frequency of draw and modify actions
Figure 4.9 Normalized values for perceptual actions related to ‘relations’ subcategory through 3 sessions for six subjects. The cognitive actions in the ‘relations’ subcategory tend to increase (except subject
1)1 throughout the three consecutive design sessions independent of the media
(Figure 4.9). This increasing pattern shows that designers preferred to deal with
‘relations’ in the proceeding stages of the design process. As far as they got more
acquainted with the design problem, they started to associate more spatial and
organizational relations between objects/elements.
Figure 4.10 Normalized values for perceptual actions related to ‘features’ subcategory through 3 sessions for six subjects. On the contrary the perceptual actions related to the visual-spatial features of the
depictions tend to decrease (except subject 1) throughout the three consecutive
design sessions. This decreasing pattern implies that designers tend to focus much
more on the visual attributes of depictions and the spatial arrangement of the space
components when they were not acquainted with the problem. The learning effect
seems to decrease the focus on the visual and spatial features of depictions. In both
subcategories of ‘features’ and ‘relations’ a major difference could not be observed
due to the change in design media.
Analyzing Functional Actions
As seen in Figure 4.11(b), the occurrences of functional actions in HAND-CAD-
HAND sessions decrease in the second session and then increased in the third
session. This shows that the functional actions occur more frequently in traditional
media. Whereas in CAD-HAND-CAD sessions there is not a single pattern that
would demonstrate the tendency of the occurrences of functional actions. So it
cannot be inferred that the media change has a significant effect on the frequencies of
functional actions in the design activity.
1 2 3
66
(a) (b) Figure 4.11 Frequency of functional actions (a) CAD-HAND-CAD sessions (b) HAND-CAD-HAND sessions The functional actions category had three subcategories including implemented
functions (implement), thought functions (thought) and the functions that are re-
interpreted (re-i). Looking at the frequencies of action subcategories depicted in
Table B8 (Appendix B), it can be observed that re-interpretation of a function is most
frequently observed in the first problem sessions. Whereas the occurence of re-i
(reinterpretation) functional action is 0% for the second sessions (except subject two
where there is a slight decrease though). When the occurence of the action Fre-i (re-i
function) becomes zero in the second sessions, the occurence of the thought
functions increase. This case is quite significant for the group 2 (S4, S5, S6 ) having
HAND 1 and then CAD 2 sessions consecutively. So this means that those designers
did not tend to re-interpret a function in the CAD environment but they thought
about the functional criteria instead. It also occurs that the occurence of function
implementation decreased. It might be concluded that those deginers in the CAD 2
session, thought more frequently on functions and implemented those functions in a
short-cut way, without having ambiguity about their functional decisions and
preferences. However this conclusion cannot be supported with the data from the
CAD-HAND-CAD sessions where there are different tendencies in media
transitions.
4.5. Discussion
Profiles of the participants
All the participants were graduate interior designers. They all had the two basic
courses on using the AutoCAD in 2D and 3D. Only subject 1 had a good command
of knowledge and practice on advanced architectural graphics (3D StudioMax/
AutoDesk) and thus the 3D CAD environment. She was also acquainted with
working on complex 3D projects in digital media She stated that digital
representational media was appropriate for presenting the design to the clients but
not for sketching in the conceptual design phase. She further stated that 3D view
feature of the software was not pivotal in her interior space planning task of a flat
because she could already perceive and evaluate the visual features, spatial and
organizational relations on the plan as she had been used to throughout her
education. Subject 2 had used some of the 3D house modeling software before, and
stated that DesignApprentice was quite similar to that software. Although he was
interested in digital media, he was fond of the traditional media. He stated that he
was more creative and free to try alternative solutions in the traditional media and
that he suffered working with a mouse. Subject 3 was again quite acquainted to
digital media. He worked on several architectural projects with AutoCAD either 2D
or 3D, and also had some practice of advanced graphics (3D StudioMax/Autodesk).
He was fond of digital media and stated that he had been used to work with digital
media in the conceptual design phase. Subject 6 had practiced the AutoCAD in 3D in
some projects, and as a master’s project studied on a virtual reality application in an
architectural context. She also stated that her preference is mostly 3D CAD
environment in the conceptual design phase. Subjects 4 and 5’s background was not
related to digital media, but they spent a lot of time to get acquainted to using the
software. They stated that they did not have a preference of a media.
Through the results in some cases subject 1 seemed to be an outlier. She had
different reactions to media transition when compared with other participants (see
Figure 4.3, Figure 4.8, Figure 4.9). Different than the other participants she finished
68
the hand-sketch in half an hour (2nd session) and produced only one sketch drawing,
which affected the number of segments (Figure 4.3) and also occurrence of some
CA.
On the other hand Subject 2 displayed quite high number of segments and CA (see
Figure 4.3 and 4.4). He considered himself to be more familiar and creative in
traditional media, thus he produced many sketch drawings related to parts of the
entire plan. He produced a sketch with a different form than the others (Appendix C
– Figure C2), but not with different functions in planning. So trying more alternatives
while searching for a different form in designing, increased the number of shifts of
his goals and the number of CA involved, compared to the others in the same group.
Supporting this claim, subject 1 stated during her verbal protocol that she applied a
hotel layout for the rooms which was a past similar case for her (Appendix C –
Figure C1), and rest of the layout was easy to plan, thus she did not try alternatives
and this resulted in a decrease in the number segments (Figure 4.3). Subject 3 tried
some alternative forms though (see variation of sketches in Appendix C – Figure
C3), and this could be inspected in Figure 4.3 again.
The richness of the verbal protocol was also a varying component for each
participant. This directly affects the encoding of segments and CA. If the participant
states continuously in detail each and every action s/he takes, the encoding becomes
richer, resulting in higher numbers of segments and CA, as it was observed for
Subject 4 (see Figures 4.2 and 4.4). In order to eliminate the variances in encoding
depending on each participant’s protocols, the pattern of the distributions was
evaluated and the frequency (in percentiles) of the actions was analyzed.
Implications about the use of digital media (versus traditional media)
The first implication is about the use of the 3D view while using the software . In six
of the nine cad sessions, participants were curious about how objects/things looked in
the 3D view (i.e. see the results). The reason is that the software presents an object in
3D in its library where the user can see it in 3D, rotate and inspect each side of it,
while selecting it. The user also has access to numerical values related to size of the
object and the parts of it. So the designer more frequently has to attend to the
attributes of an object, either to select for use or to change it. Besides the 3D view
69
enables the designer to check the features, organizational relations, such that ‘how
the study desk looks near window’, ‘how that king size bed looks in that room’ or
‘how that antique basin looks in between the doors’. So they had to make many
evaluations conceptually related to the rich graphical imagery they are exposed to.
This is one of the factors which makes the digital media time consuming, because
designer has to deal with those details during conceptual design.
It was expected that the 3D view feature of the software would be useful to designers
in evaluating or implementing the functional criteria during the design process. One
participant made use of the 3D view option in this way. He stated: “Switching to 3D
view helps me to see the view from one place to another. As an example, I checked
whether if the partition wall was long enough to hide the view to the private area.
Standing at the entrance, and then walking ahead (virtually) I could see (with the aid
of interactive camera view) if the rooms were hidden behind that wall”. This
example demonstrates a situation where a function (to satisfy visual privacy by
hiding the view to private area) is implemented and evaluated with the aid of 3D
view in digital media. Novice designers seem to engage in these types of tasks much
more in digital media (Bilda et al., 2000), whereas in this case study expert designers
did not (see section 4.4.2).
Although the designer is exposed to the various imagery characteristics of the digital
media, s/he does not frequently tend to use all of them. The reason might be that the
designers during their education have been acquainted with working on plan
drawings and experiencing most of the 3D features in their mental imagery. As the
participants were graduate students, they had almost gained the ability to perceive
and inspect the features of organizational and spatial relations from a plan drawing.
This claim could be supported by participants’ statements in their short interviews
after the protocols. One of the participants stated: “I always see the plan in 3D, as if
the walls are elevating; when I work on the plan I see also the perspective views.”
The digital sketching medium is defined to be an interactive visual representation,
that one can inspect the changes in visual information (size, location, color, height,
texture etc.) in the design environment. On the contarary free hand sketches are
defined to be static visual representations where the drawn depictions cannot move,
70
rotate, change in size interactively and these kinds of changes are usually
implemented on a new sheet of tracing paper. The static versus interactive nature of
representation medium was observed to affect the design process. An advantage of
the digital medium is revealed by one of the participant’s statement: “I have the
opportunity to store necessary furniture (select the furniture from library menu and
drag it) on the plan, then deal with the arrangement. The objects do not have to be
fixed, I can move them around, rotate them at any time. So I plug everything inside
the space components and then arrange them”. It seems easy to use the software
when one aims at organizing the furniture, as different alternative trials are possible.
However it seems hard to define the spaces and the spatial relations between them.
One participant states the reason for that as follows: “I was making sketches of
spatial relations in my mind when I paused during the CAD sessions. I cannot doodle
on screen like I do on the corner of a tracing paper, when I draw it on screen, it is
there”.
Implications about the ‘learning effect’
In the experiment, the first and the third design sessions employed the same design
problem, thus the third session was a second opportunity of the designer to work on
the same problem. The decrease in numbers of shifts in goals/intentions
(segmentation categories) and of the CA was observed in transition from first
problem session to the third one. The decrease in both cases was explained by
designers’ learning, named the ‘learning effect’. The negative slope of the learning
effect (the decrease between first and third sessions) was observed to be smaller in
CAD-HAND-CAD sessions but higher in HAND-CAD-HAND sessions. This
situation implies that the media affects the learning. If the participants were
designing in a media that they were more acquainted in (traditional media), then the
effect of learning seems to be amplified.
Another implication of ‘learning effect’ was observed in analyzing the perceptual
actions (section 4.4.2). It was observed that while the designers’ attention to relations
among the objects/elements increased in consecutive sessions, their attention to
attributes/features of objects/elements decreased independent of the medium. It
might be reasonable to state that the learning effect (or acquaintance with the
problem) enhanced the attention to ‘relations’ among elements/objects while it
71
inhibited the attention to visual-spatial ‘features’. Subject 1 was exceptional in that
the same outcome was only observed from first to third sessions, but not in the
second session (where there is a media transition). Then her perceptual actions
related to ‘features’ and ‘relations’ were dependent on the medium. This could be
supported by subject 1’s profile that she had a good command of using advanced
architectural graphics software, which means she was more acquainted with the
digital media.
Comparison with related work
The earliest form of the coding scheme used in this study was the scheme by Suwa
and Tversky (1997). They had devised the coding scheme in an architectural context,
where the categories were in terms of spaces, areas, shapes/angles, local and global
relations, views, lights, circulation and so on. The revised coding scheme by Suwa et
al. (1998) was a more detailed taxonomy, constituting indexes for new, continual or
revisited actions, also indexes to display if an action is ‘dependent on’ or ‘triggered
by’ another action. The aim of these indexes was systematically to inspect the links
between the cognitive actions, as these interlinks only might demonstrate the
macroscopic analyses of the cyclic process that a designer engages in (Schon and
Wiggins, 1992). However, the study by Suwa et al. (1998) did not analyze the
interlinks (which was dependency chunks in Suwa and Tversky (1997)), but explored
the correlations between different types of actions.
The present study did not employ any of the analyses mentioned above because there
was a media transition, which is an issue that has to be considered separately. As the
major concern of the study was the media comparison, it was reasonable to utilize the
general taxonomy by Suwa et al. (1998) by making revisions on the coding scheme
to fit to a comparative analysis. At the same time, the design process in the empirical
research was to be closer to a problem solving process in order to easily observe the
contents of the designers’ actions. Introducing an interior space-planning problem
with specifications makes the inspection of design sessions more systematic, as the
entire problem solving process could be decomposed into components of goals (in
terms of designers’ intentions). In this study the definition of segment was related to
these goals/intentions of designers, whereas in the studies by Suwa and Tversky
72
(1997) and Suwa et al. (1998) each design move (which is the smallest component)
was defined to be a segment. A segment in this study might be composed of many
design moves, and further the start of a new segment is more clearly identified
depending on the segmentation categories scheme (Table 4.1). Based on the contents
of the designers’ intentions, the segmentation categories scheme enabled analyzing
the interior space planning as a problem solving process.
Dorst and Dijkhuis (1995) argued that the analyses of design processes should not
only focus on process component of design activities, but also on contents of what
designers see and think. However in this study the segmentation categories were the
process component of design activities (revealing how the process proceeds), and the
encoded CA (Suwa et al., 1998) represented the contents of what designers see and
think. Both components were content-oriented in other words they were based on
designers’ cognition.
73
5. CONCLUSION
This study was an attempt to model and analyze the effects of media in designers’
sketching with a content-oriented approach. The participants’ design thoughts in an
interior space-planning problem were examined by the method of retrospective
protocol analysis. The vocabulary needed to identify the designers’ primitive actions
employed was Suwa et al. (1998)’s coding scheme. The analysis of cognitive action
categories and subcategories enabled an insight on design thinking and making in
traditional versus digital media. Another goal in the study was to decompose the
entire problem solving process into segments depending on designers’ intentions.
The segmentation allowed the interpretation of each design session in terms of goals
and sub goals and comparison of the mechanisms in problem solving strategies in
traditional versus digital media.
The results related to segmentation categories can be summarized as in Table 5.1.
Table 5.1 Results related to segmentation categories Results Evidence
Designers’ goals and intentions change more
frequently in traditional media rather than digital
media.
Increase in total number of segments
Figures 4.2 and 4.3
The occurence of segmentation categories
(specific goals) are independent of the subjects’
performances in different design media.
χ2 Test – Table 4.9
Each designer has a different problem solving
strategy, there is not a single tendency that can be
modeled.
Numbers of shifts in strategy clusters
Table B4 in Appendix B
Designers have common subgoals and intentions
in dealing with specific tasks.
Common types of segment categories
in strategy clusters – Table 4.11
Redrawing/ copying the design usually triggers
new ways of seeing things.
F segment followed by redefinitive (E
or C) segments in 72% of the hand
sketch sessions. (Table B4.1 in
Appendix B)
74
Designers’ sketching activity seems to have different dynamics in different
representational media in terms of design thinking and making. The first significant
difference was that designers’ goals and intentions more frequently changed in
traditional media (Table 5.1). This situation could be explained by Goel (1995)’s
findings about the ambiguous nature of sketches and the designers’ habit of using
sketches as a representational media throughout their education.
The segmentation categories scheme devised was independent of the design sessions
of different media, which means it acted as a general taxonomy that helped to model
the specific problem solving process. Using the segmentation categories scheme, the
problem solving strategies of designers were analyzed and it was observed that there
was no tendency to use specific strategies for all participants throughout the design
sessions. Rather it was observed that all participants had some common sub goals
while dealing with specific tasks. Analyzing the sequence sub goals in the strategy
clusters, a significant result depicted that ‘copying the design’ activity was usually
followed by redefining spaces or relations, which is a signal of re-interpretation.
Strategy clusters also revealed that designers mostly associated global spatial
relations effectively when they work with free-hand sketches, as the digital media
was not flexible to allow a doodling activity or a diagrammatic representation. These
two conclusions provide implications for the structure of conceptual CAD packages
for architects that the system should offer a semi-transparent copying activity like a
tracing paper provides, and a tool for diagrammatic representation.
75
The results related to action categories are summarized in Table 5.2.
Table 5.2 Results related to cognitive actions Results Evidence
Designers have relatively higher number of
cognitive actions in traditional media when
compared with digital media.
Figures 4.4 and 4.5 related to media
transition.
The occurences of action categories are
independent of the media.
χ2 Test – Table B.10
The frequency of physical actions and the ‘modify’
actions throughout the design process is higher in
digital media.
Figure 4.7 and Table 4.12
The frequency of perceptual actions was relatively
high in traditional media.
Figure 4.8.
The frequency of functional actions did not display
a significant tendency due to media transition or
due to transition of problem sessions
Figure 4.11
Similar to the total number of segment categories, the total number of cognitive
actions was also relatively higher in traditional media. This result cannot be
interpreted, as designers tend to think, see, perceive less in digital media, but can be
explained by designers’ mode of thinking and reasoning in different media. Firstly,
designers have always used hand sketches as a cognitive tool throughout their
education, not the digital media. Thus this might limit their cognitive interaction with
the digital media. Secondly, the commercial CAD software is inflexible to support
designers’ habitual activities such as doodling, drawing diagrams, gesture of moving
pencil, copying activity and so on which all seem to be evidences of visual thinking
and reasoning.
In order to analyze the CA in different media, Suwa et al. (1998)’s coding scheme
was revised to make the meaning of an action common in both media, so that the
design thinking and making could be encoded at equal levels. Supporting this claim,
a χ2 test demostrated that the occurrence of the action categories was independent of
the media. Each of the action categories and the subcategories were analyzed in the
scope of figuring out any significant changes through media transitions.
76
The frequency of physical actions in digital media was higher (Table 5.2), which
points out the fact that frequency of other action categories was lower. This implies
that designers tend to use the digital media for implementation of designs (or
simulation purpose) but not as a medium which s/he interacts with to implement
his/her alternative thoughts.
The current CAD software usually work on ‘draw and then modify’ principle, which
was observed in designers’ physical actions, such that ‘modify’ actions were more
frequently used in digital media (Table 5.2). The use of 3D interactive visualization
feature in digital media did not significantly affect the evaluation and implementation
of functional criteria in the specific design problem.
It can be concluded that designers are more effective in using time, conceiving the
problem, producing alternative solutions and in perceiving the visual – spatial
features and the organizational relations of a design in traditional media rather than
digital media during conceptual design. Although digital media seems to be
inconvenient for the conceptual design phase, this situation depends on designers’
designing habits and the inflexibility of the CAD software. This leads to the idea that
conventional CAD software fails to be a design medium where the designer is
allowed to perform his/her habitual activities to enhance the visual reasoning
process. As a further study of this empirical research, types of visual reasoning
process could be identified in terms of the ‘coding scheme actions’. As visual
reasoning is a cognitive process that links conceptual knowledge and perceptually
based knowledge during design (Gero, 1999), it should be defined in terms of various
combinations of some CA triggered by each other. This could envision the
interaction of the designer with digital versus traditional media in detail while s/he is
visually thinking or reasoning.
As concluded earlier, conventional CAD software does not yet support the early
conceptual design phase but mental imagery could be a tool for that. Then a design
medium could be defined as an environment where the designer creates a virtual
model in his/her mind and then makes the simulation digitally. This study could not
analyze the mental imaging of designers (which possibly was an essential component
of the cognitive processes involved) during the CAD sessions, as evidence of mental
77
imagery could be collected by concurrent verbalization. As a further study the
interaction between mental imagery and 3D CAD environment could be analyzed as
both tools aim to work with a virtual model; while mental imagery creates, the latter
externalizes the output. Analyzing this kind of a design medium might propose new
forms of interaction between mental imaging and simulation in digital media. Re-
inventing the nature of cognitive processes involved in such a medium might support
development of conceptual computer-aided architectural design packages, as well as
proposing a new methodology for design education.
78
References
Akin, O. (1978). How do architects design? In Latombe (ed). Artificial Intelligence and Pattern Recognition in Computer Aided Design. Amsterdam: North Holland Publishing Company.
-------- (1986) Psychology of Architectural Design. London : Pion -------- and Lin, C. (1995) Design protocol data and novel design decisions. Design
Studies 16(2), 211-236 Andersen, R.E. and Helstrup, T (1993) Multiple perspectives on discovery and
creativity in mind and on paper. In Roskos-Ewoldsen, M.J Intons-Peterson and R.E. Anderson (eds) Imagery, Creativity and Discovery: A Cognitive Perspective. Amsterdam : Elsevier Science, 223-253.
Arnheim, R. (1969) Visual Thinking. London :Faber & Faber. Athavankar, U. A. (1997) Mental imagery as a design tool. Cybernetics and Systems
28, 25-47. Bermudez, J. (1995). Designing Architectural Experiences.(In Kalisperis and
Kolerevic (eds), ACADIA 1995) Retrieved 2000, from the World Wide Web: http://www.arch.utah.edu/people/faculty/julio/public.htm Bermudez, J. & King K. (2000). Media interaction and design process: establishing a
knowledge base. Automation in Construction, 9 , 37-56. Bilda, Z., Demirkan, H., Erkip, F. (2000, Under Review).Traditional versus digital
design medium: A case study in the interior design studio”. Retrieved from the World Wide Web: www.bilkent.edu.tr/~zafer/exp.htm.
Carrara, G., and Y.E. Kalay (1994a) Past, Present, Future: Process and Knowledge in Architectural Design. In G.Carrara and Y.E. Kalay (eds.) Knowledge–Based Computer–Aided Architectural Design. Amsterdam: Elsevier, 389-395
----- (1994b) Knowledge-Based Computational Support for Architectural Design. In G.Carrara and Y.E. Kalay (eds.) Knowledge–Based Computer–Aided Architectural Design. Amsterdam: Elsevier 147-198.
Chandrasekaran, B. (1999) Multimodal perceptual representations and design
problem solving. In J.S. Gero and B. Tversky (eds), Visual and Spatial Reasoning in Design, Key Center of Design Computing and Cognition, University of Sydney, Sydney, pp. 3-14
79
Coyne, R.D. ,M.A. Rosenman, A.D. Radford, M. Balachandran, and J.S. Gero (1990) Knowledge–Based Design Systems. Reading, MA: Addison Wesley
Coyne, R.D., S. McLaughlin and S. Newton (1994). Information technology and
praxis: a survey of computers in design practice. Environment and Planning B: Planning and Design 23, 515-551.
Do, E. Yi-L., Gross, M.D., Neiman, B., and Zimring, C. (2000). Intentions in and
relations among design drawings. Design Studies 21(5), 483-503. Doorst, K. and Dijkuhuis, J. (1995) Comparing paradigms for describing design
activity. Design Studies 16(2), 261-274. Eastman, C.M. (1970). On the analysis of intuitive design processes. In G.T. Moore
(ed.) Emerging Methods in Environmental Design and Planning. Cambridge, MA : MIT Press, 21-37.
-------------- (1994) A Data Model for Design Knowledge. In G.Carrara and Y.E.
Elsas, P. A. van and Vergeest, J. S. M. (1998) New functionality for computer aided
conceptual design: the displacement feature. Design Studies 19(1), 81-102. Engeli, M. and D. Kurmann (1996). Spatial objects and intelligent agents in a virtual
environment. Automation in Construction. 5, 141-150. Flemming, U. (1994) Case-Based Design in the SEED System. In G. Carrara and
Gero, J.S. (1999). Preface. In J.S. Gero and B. Tversky (eds.). Visual and Spatial
Reasoning in Design. Key Center of Design Computing and Cognition, University of Sydney, Sydney.
Gero, J. S. and McNeill, T. (1998) “An approach to the analysis of design
protocols”. Design Studies 19(1), 21-61. Gero, J.S. and Purcell, A.T. (1998) “Drawings and the design process” Design
Studies 19(4), 389-430. Gero J.S. and Tang, H. (2001) The differences between retrospective and concurrent
protocols in revealing the process-oriented aspects of the design process. Design Studies 22(3), 283-295.
Goel, V. (1995) Sketches of Thought. Cambridge MA : MIT Press. Goldschmidt, G. (1991). The dialectics of sketching. Creativity Research Journal
4(2), 123-143.
80
Goldschmidt, G. (1994). On visual design thinking: the vis kids of architecture. Design Studies 15,158-174.
----------(1995a). The designer as a team of one. Design Studies 16 (2), 189-209. --------- (1995b) Visual displays for design: Imagery, analogy and databases of visual
images. In A. Koutamanis, H. Timmermans, I. Vermeulen (eds.). Visual Databases in Architecture. Avebury:Aldershot, 53-74.
----------(1997). Capturing indeterminism: Representation in the design problem
space. Design Studies 18(4), 441-445. ----------(1999) The backtalk of self-generated sketches. In J.S. Gero and B. Tversky
(eds.). Visual and Spatial Reasoning in Design. Key Center of Design Computing and Cognition, University of Sydney, Sydney, 163-184.
Jacobs, S.P. (1991) The CAD Design Studio, New York: McGraw Hill. Hitchcock, R.J. (1989). Knowledge-based system architectural design guide tools:
Ann Arbor, MI, University Microfilms International Johnson, S. (1998) “What’s in a representation, why do we care, and what does it
mean? Examining evidence from psychology”. Automation in Construction 8, 15-24
Kavakli, M., Suwa, M., Gero J., and Purcell, T. (1999) Sketching interpretation in
novice and expert designers. In J.S. Gero and B. Tversky (eds.). Visual and Spatial Reasoning in Design. Key Center of Design Computing and Cognition, University of Sydney, Sydney, 209-219.
Kokotovich, V. and Purcell A.T. (2000) Mental synthesis and creativity in design: an
experimental examination. Design Studies 21 (5), 437-449. Kosslyn, S.M. (1999). Visual mental images as re-presentations of the world: A
cognitive neuroscience approach. In J.S. Gero and B. Tversky (eds.). Visual and Spatial Reasoning in Design. Key Center of Design Computing and Cognition, University of Sydney, Sydney, 83-92.
Koutamanis, A.(1993). The future of visual design representations in architecture.
Automation in Construction 2, 47-56. Lawson, B.(1990) How Designers Think: The Design Process Demystified. Kent:
Butterworth Architecture. Lloyd, P., Lawson, B., and Scott, P. (1995) Can concurrent verbalization reveal
design cognition? Design Studies 16 (2), 237-259. Madrazo, L. (1999) Types and instances: A paradigm for teaching design with
computers. Design Studies 20,177-193.
81
Marx, J. (2000) A proposal for alternative methods for teaching digital design. Automation in Construction 9, 19-35.
Mc.Kim, R. (1972) Experiences in visual thinking. Monterey, CA : Brooks/ Cole.
Mitchell, W.J. (1994) Three paradigms for computer-aided design. In G.Carrara and Y.E. Kalay (eds.) Knowledge–Based Computer–Aided Architectural Design. Amsterdam: Elsevier 380-387.
Newell, A. and Simon, H.A. (1972) Human Problem Solving. New Jersey: Prentice Hall.
Ohira, T. (1995) Design and Computers. Computer Designics. Singapore: Graphic-
sha Oxman, R. (1995) ‘The reflective eye: Visual reasoning in design’ in A. Koutamanis,
H. Timmermans, I. Vermeulen (eds.), Visual Databases in Architecture, Avebury : Aldershot, 89-112.
Richens, P.(1994) Does Knowledge Really Help? CAD Research at the Martin
Center. In G.Carrara and Y.E. Kalay (eds.) Knowledge–Based Computer–Aided Architectural Design. Amsterdam: Elsevier, 305-316.
Rutherford, J.H. and T.W. Maver (1994) Knowledge-Based Design Support. In
Schmitt, G. (1999) Information Architecture (Basis and Future of CAAD).
Italy:Birkhauser. Schmitt, G. and W. Oechslin (1992) Computer-Aided Architectural Design Futures.
In G. Schmidt (ed.) CAAD Futures ’91: Computer Aided Architectural Design Futures Education, Research, Applications. Braunschweig: Vieweg.
Scrivener, S.A.R., Ball, L.J. and Tseng, W. (2000) Uncertainity and sketching
behaviour. Design Studies 21(5) , 465-481 Schon, D. A. (1987). The reflective practitioner. London: Temple Smith. Schon, D.A. and Wiggins, G. (1992) Kinds of seeing and their function in designing.
Design Studies13, 135-156. Seebohm, T. and Van Wyk S. (2000). Digital Design Studios (Editorial).
Automation in Construction 9, 1-4. Suwa, M., Gero, J. and Purcell, T. (2000) Unexpected discoveries and S-invention of
design requirements: important vehicles for a design process. Design Studies 21(6), 539-567
82
Suwa, M., Purcell, T. and Gero, J.S. (1998). Macroscopic analysis of design processes based on a scheme for coding designers’ cognitive actions. Design Studies 19(4), 455-483.
Suwa, M. and Tversky, B. (1997) What do architects and students perceive in their
design sketches? A protocol analysis. Design Studies 18(4), 385-403. Tang, H-Hui and Gero J.S. (2000) Content-oriented coding scheme for protocol
analysis and computer –aided architectural design. Retrieved 2001, from the World Wide Web: www.arch.usyd.edu.au/~john/publications
Tversky B. (1999) What does drawing reveal about thinking?. In J.S. Gero and B.
Tversky (eds.). Visual and Spatial Reasoning in Design. Key Center of Design Computing and Cognition, University of Sydney, Sydney, 93-101.
Verstijnen, I.M., Hennessey, J.M., Leeuwen, C van, Hamel, R., and Goldschmidt, G.
(1998) Sketching and creative discovery. Design Studies, 19 (4), 519-546. Won, P.H. (2001) The comparison between visual thinking using computer and
conventional media in the concept generation stages of design. Automation in Construction 10, 319-325.
Zampi, G. and C.L. Morgan (1995) CAD: a user’s guide. Virtual Architecture, New
York: McGraw Hill, 28-44
84
85
86
APPENDIX B
TABLE B1. TOTAL NUMBER OF SEGMENTS OF THE SUBJECTSSUBJECT 1 SUBJECT 2 SUBJECT 3CAD 1 HAND 2 CAD 3 CAD 1 HAND 2 CAD 3 CAD 1 HAND 2 CAD 3
TABLE B3. THE CHI SQUARE TEST WITH DIFFERENT MEDIA
MEAN CAD 1 MEAN CAD 2 MEAN CAD 3A 9,0 7,3 8,0B 8,3 5,0 4,3C 5,0 4,0 3,3D 3,3 3,0 4,7E 2,3 0,0 1,7G 1,3 0,7 1,3
CHI TEST P = 0.97
MEAN HAND 1 MEAN HAND 2 MEAN HAND 3A 11,0 8,3 6,7B 6,3 7,0 6,3C 7,7 5,0 3,3D 9,3 6,7 3,0E 4,3 1,0 1,3F 5,7 2,3 0,3
CHI TEST P = 0.8323
88
TABLE B4. STRATEGY CLUSTERS
SUBJECT 1 CAD 1 HAND 2 CAD 3
SEGMENT NO STRATEGY SEGMENT NO STRATEGY SEGMENT NO STRATEGY
3--11 Dealing with private area 3--7 Dealing with semi-private area 2--11 Dealing with privacy area12 Shift to balcony 8--14 Dealing with private area 12--24 Dealing with semi-private area
13-16 Back to private area 15--18 Dealing with semi-private area17-23 Dealing with semi-private area
24-29 Back to private area
30-34 Dealing with semi-private area
SUBJECT 2 CAD 1 HAND 2 CAD 3
SEGMENT NO STRATEGY SEGMENT NO STRATEGY SEGMENT NO STRATEGY
2--6 Dealing with Public area 1--7 Global and local relations diagram 2--3 Dealing with semi-private area7--18 dealing with first private area 8 Entry 4 Public19--24 dealing with second private area 9 Dealing with private area 5 Dealing with semi-private area
25--32 Dealing with semi-private area 10 outdoor component 6--13 Dealing with private area11--12 Dealing with private area 14 Public13--15 Global and local relations 15--22 Dealing with private area16--25 Dealing with private area 23--30 Dealing with semi-private area26--28 Dealing with semi-private area
29 Entry30--38 Dealing with semi-private area39--41 Dealing with private area42--44 Dealing with semi-private area46--49 Dealing with semi-private area
SUBJECT 3 CAD 1 HAND 2 CAD 3
SEGMENT NO STRATEGY SEGMENT NO STRATEGY SEGMENT NO STRATEGY
4 Dealing with global relations 1--3 Global and local relations diagram 2--12 Dealing with private area5--6 Dealing with private area 4--5 Dealing with private area 13--15 Dealing with semi-private area7--12 Dealing with semi-private area 6--15 Dealing with semi-private area 16--17 Public area
13 New layout 17--20 Dealing with private area 18--21 Dealing with semi-private area14 Dealing with global relations 21--22 Dealing with semi-private area
15--20 Dealing with private area 23-- Public area21 Public area 24--28 Dealing with semi-private area
25--28 Dealing with semi-private area
SUBJECT 4 HAND 1 CAD 2 HAND 3
SEGMENT NO STRATEGY SEGMENT NO STRATEGY SEGMENT NO STRATEGY
1--4 Global and local relations diagram 3--14 Dealing with private area 1--3 Global and local relations diagram5--10 Dealing with private area 15--30 Dealing with semi-private area 4--15 Dealing with private area12--22 Dealing with private area 16--25 Dealing with semi-private area
23 Public area 56 Public area24--27 Dealing with private area 2 27--28 Dealing with semi-private area28--29 Dealing with semi-private area
30 Dealing with private area 231 Outdoor component32 Public area
33--44 Dealing with semi-private area45--48 Dealing with private area 249--51 Dealing with semi-private area52--57 Dealing with private area
SUBJECT 5 HAND 1 CAD 2 HAND 3
SEGMENT NO STRATEGY SEGMENT NO STRATEGY SEGMENT NO STRATEGY
1--5 Global and local relations 2 Dealing with semi-private area 2 Global and local relations6--10 Dealing with semi-private area 3--4 Dealing with private area 3--9 Dealing with private area11--12 Global and local relations 5--10 Dealing with semi-private area 10 Public area13--16 Dealing with semi-private area 11 Dealing with private area 11--17 Dealing with semi-private area17--25 Dealing with private area 12 Dealing with semi-private area 18--19 Dealing with private area
89
TABLE B.4.1
DOCUMENTATION OF SEGMENT TYPES THROUGHOUT THE DESIGN SESSIONS
SUBJECT 1 SUBJECT 2 SUBJECT 3Segments CAD 1 HAND 2 CAD 3 CAD 1 HAND 2 CAD 3 CAD 1 HAND 2 CAD 3
TABLE B5 TOTAL NUMBERS OF ACTION CATEGORIESPHYSICAL PERCEPTUAL FUNCTIONAL CONCEPTUAL
56% 26% 9% 8%65% 24% 9% 2%52% 23% 15% 9%
51% 38% 10% 1%43% 39% 11% 7%53% 35% 10% 2%
45% 27% 15% 13%49% 33% 11% 7%52% 25% 14% 9%
38% 37% 11% 15%44% 35% 10% 11%50% 34% 10% 6%
45% 33% 15% 7%58% 21% 13% 8%47% 26% 18% 8%
48% 30% 13% 9%60% 22% 6% 13%54% 32% 8% 6%
TABLE B6 TOTAL NUMBER OF CAP H Y S I C A L Actions PERCEPTUAL Actions FUNCTIONAL Actions CONCEPTUAL ActionsDraw Modify copy features relations implement re-i thought func.Dc Dsy Drf Dd Md Dts Pfn Pfnp Pv Prn Plo Prp Psg Fn Fi Fre-i Fc Fnp G K