26
Phil Bourne Being Data Informed Issues arising from the new accountability reforms BETTER INFORMATION FOR LEADERS IN EDUCATION @philbourne77
| Date post: | 15-Jul-2015 |
| Category: |
Education |
| Upload: | wholeeducation |
| View: | 296 times |
| Download: | 1 times |

Phil Bourne
Being Data InformedIssues arising from the new accountability reforms
BETTER INFORMATION FOR LEADERS IN EDUCATION
@philbourne77

Being Data Informed• To examine what we know about the changes to the
accountability measures and identify what can be learnt from the national data available
• To identify what approaches might be taken to support learning and leadership to maximise outcomes
• To share what has been learnt about schools involved in the Whole Education network
• To explore and share best practice in supporting readiness for the accountability changes

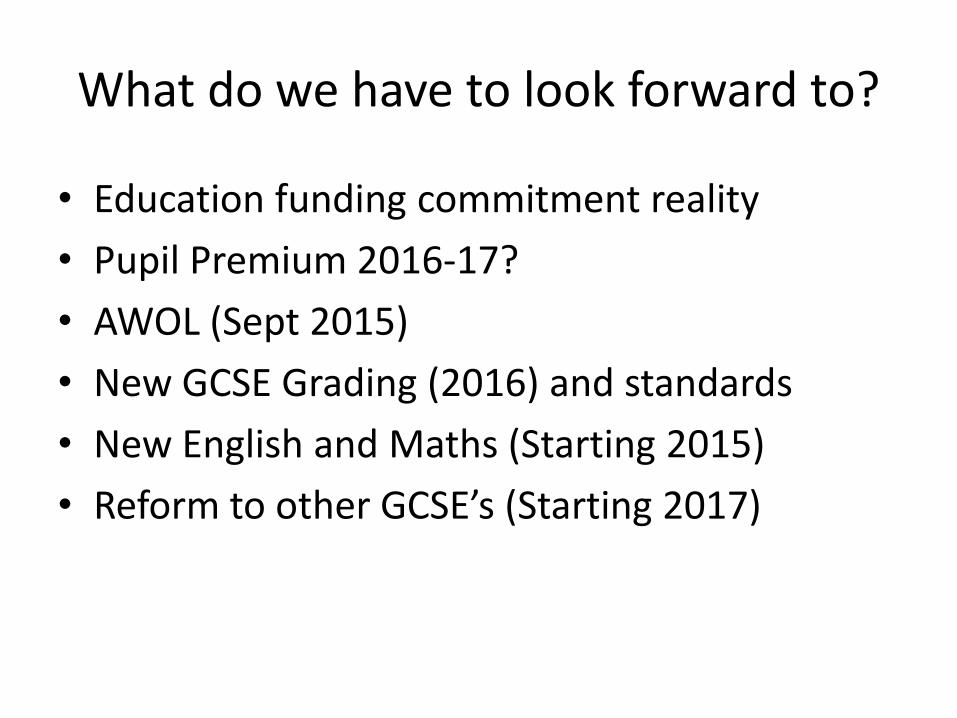
What do we have to look forward to?
• Education funding commitment reality
• Pupil Premium 2016-17?
• AWOL (Sept 2015)
• New GCSE Grading (2016) and standards
• New English and Maths (Starting 2015)
• Reform to other GCSE’s (Starting 2017)
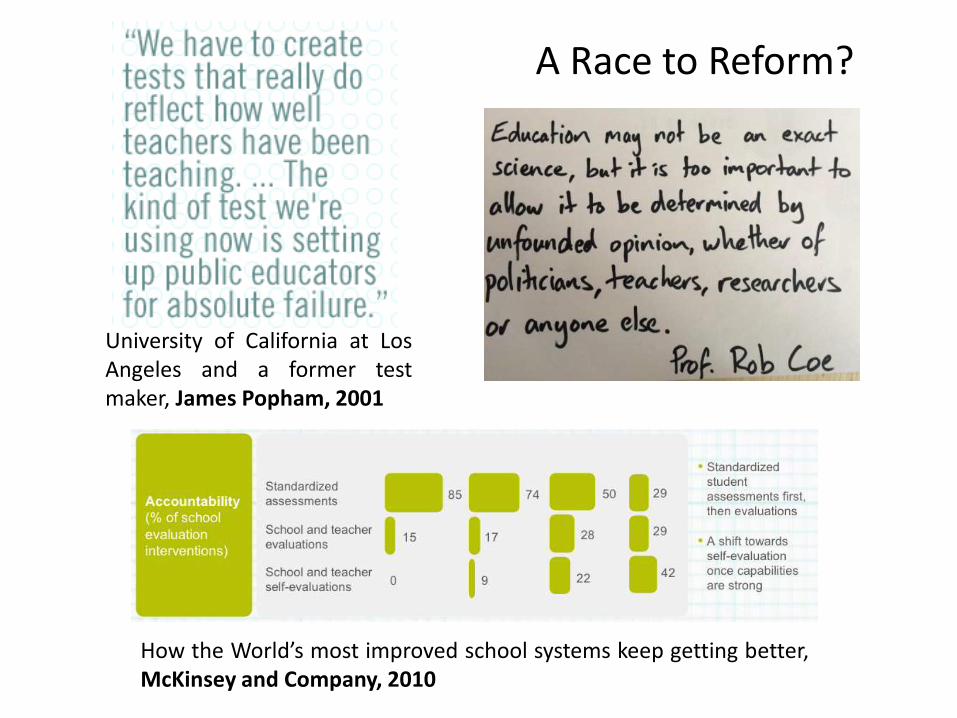
University of California at LosAngeles and a former testmaker, James Popham, 2001
How the World’s most improved school systems keep getting better,McKinsey and Company, 2010
A Race to Reform?

David Laws: Assessment Reform: Reform Think Tank, 25th February 2015
• Diagnostic assessment to improve outcomes is critical in supporting learning and stakeholders.
• More assessment, but without the use of levels.• Levels were not used well (Teachers put words on
the wall for pupils to learn to reach level 5?).
• Freedom to innovate (but textbooks need to be better so that pupils can learn autonomously).
• Quality and quantity of work is really important.
• More assessment and better assessment is needed (but less data?!?)

New KS4 Accountability MeasuresWhat do they look like!
What? Metric (e.g.)
Progress 8 +0.5
Attainment 8 B-
English and mathematics 79%
English Baccalaureate 35%
Destination Unconfirmed

SchoolsWeek – Digital Supplement: Guide to the performance tables (Feb 2015)

2016 new KS4 Grades
@andysquires
The distribution will be standardised.
Will ‘the new standards’ have sufficiently increased by 2017 for a normal distribution?

Progress 898
7
654
3
21

What are you doing in readiness for the reforms?

Do you know how well others schools are doing with a similar
intake and are you using this knowledge to challenge
expectations?

https://www.schooldata.org.uk

5+ A*-C including GCSE English and Mathematics
Below average KS2 APS
Above average KS2 APS
Above average attainment 3 12Below average attainment 18 5Best 8 Capped –Converted to a grade
Below average KS2 APS
Above average KS2 APS
Above average attainment 3 14Below average attainment 18 3
Exploring attainment – Pathfinder Schools
Based on views of the existing attainment measure and through using the capped 8 grade, there is little difference for the Pathfinder schools

Expected progress – Mathematics KS2-4
Below average KS2 APS
Above average KS2 APS
Above average progress 4 11Below average progress 17 6
Expected progress – English KS2-4
Below average KS2 APS
Above average KS2 APS
Above average progress 10 9Below average progress 11 8
Exploring progress – Pathfinder schools
Based on progress, there is generally higher progress in English than in Mathematics for the Pathfinder schools

Relationship between KS2 APS and Average Grade Score capped at the best 8
All schools: KS2APS 27.8; Average grade score 39.8 (C grade)Whole Education Pathfinder Schools: KS2APS 27.7; Average grade score 38.5 (C grade)

Attainment 8
0
100
200
300
400
500
600
700
A*- A+ A A- B+ B B- C+ C C- D+ D D- E+ E E- F+ F F- G+ G G- U
Histogram - schools and attainment 8
Special schools and Cohorts < 60students are excluded from this analysis

Attainment 8 (Capped 8) Grade Distributions
0%
2%
4%
6%
8%
10%
12%
14%
16%
18%
20%
A*- A+ A A- B+ B B- C+ C C- D+ D D- E+ E E- F+ F F- G+ G G- U
Proportion of all schools
Whole Education- Pathfinder
• Caution, small numbers are used for the proportion ofPathfinder schools (n. 38)
• The data suggests that that distribution of PathfinderSchools is not significantly different from the nationaldistribution
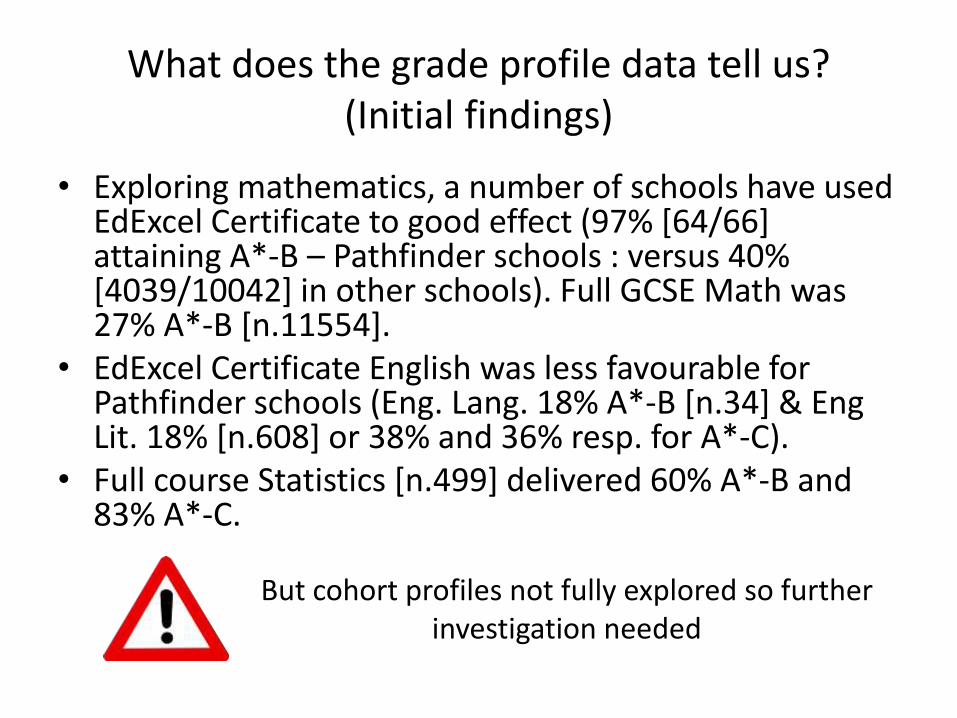
What does the grade profile data tell us? (Initial findings)
• Exploring mathematics, a number of schools have used EdExcel Certificate to good effect (97% [64/66] attaining A*-B – Pathfinder schools : versus 40% [4039/10042] in other schools). Full GCSE Math was 27% A*-B [n.11554].
• EdExcel Certificate English was less favourable for Pathfinder schools (Eng. Lang. 18% A*-B [n.34] & EngLit. 18% [n.608] or 38% and 36% resp. for A*-C).
• Full course Statistics [n.499] delivered 60% A*-B and 83% A*-C.
But cohort profiles not fully explored so further investigation needed

• A8 & P8 trackers
• Data informed decision-making (Estimates for curriculum provision)
• Filling curriculum gaps & curriculum choice
• Residuals from targets set
• Average grade reporting
• Progress to ‘basket’ leaders
Monitoring and Intervention (aka. League Table Gaming?!?)
• Identifying which students may be better off from a reduced set

Are you targeting interventions forensically and do you have robust tracking systems in place to establish what is making a difference and what is not?

WINWhat is Next?
• Deeper analysis into curriculum options and outcomes for Whole Education
• Ongoing activities to rationalisethe reforms
• Learning from and sharing best practice
@[email protected]://www.schooldata.org.uk

Normal Distribution / Standardised

0%
10%
20%
30%
40%
50%
60%
70%
80%
90%
100%
Effectiveness Achievement Teaching Leadership
Distribution of Ofsted Judgements for Pathfinder schools (n. 20, Primary Phase)
Outstanding Good Requires Improvement Inadequate

0%
10%
20%
30%
40%
50%
60%
70%
80%
90%
100%
Effectiveness Achievement Teaching Leadership
Distribution of Ofsted Judgements for Pathfinder schools (n. 36, Secondary Phase)
Outstanding Good Requires Improvement Inadequate

Ofsted and KS2 APSWhat do we know about Ofstedand prior attainment?
Outstanding GoodRequires
ImprovementInadequate
Primary 26% 51% 56% 61%Secondary 25% 50% 68% 76%
• Examining the relationship between below average prior attainment for primary and secondary schools shows a most interesting pattern


