83
DESIGNING CHARTS & TABLES How to Display Data that Enlightens and Informs Krista K. Payne, PhD. [email protected] CFDR Summer 2021 Workshop Series

DESIGNING CHARTS & TABLESHow to Display Data that Enlightens and InformsKrista K. Payne, [email protected]
CFDR Summer 2021 Workshop Series

RANK THIS CHART
6.60%
6.80%
7.00%
7.20%
7.40%
7.60%
7.80%
8.00%
8.20%
8.40%
8.60%
2009 2019
Percentage of Children Living in Grandparent-Headed Households, 2009 and 2019

TODAY’S WORKSHOP
GOAL:
Help you to use charts and tables to more effectively...
• tell data stories
• communicate results
• clarify ideas

WHY WORDS AREN’T ALWAYS ENOUGHFirst, you will need to provide support above the usual level. If you do not have a device for this elevation, you will need to obtain one. Before you provide the elevation support, you will want to decrease the later resistance for all the critical contact points. After the elevation device has been utilized, you can complete the rotation of the critical contact points and exchange the impacted element. You will then want to re-engage the critical contact points and remove the device. You may continue to use the replacement element. If it is not adequate for long-term use, you may want to repair or replace the original element, at which point you will need to repeat the process.Design for How People Learn, p. 45, by Julie Dirksen, 2016.

WHY WORDS AREN’T ALWAYS ENOUGHFirst, you will need to provide support above the usual level. If you do not have a device for this elevation, you will need to obtain one. Before you provide the elevation support, you will want to decrease the later resistance for all the critical contact points. After the elevation device has been utilized, you can complete the rotation of the critical contact points and exchange the impacted element. You will then want to re-engage the critical contact points and remove the device. You may continue to use the replacement element. If it is not adequate for long-term use, you may want to repair or replace the original element, at which point you will need to repeat the process.
Design for How People Learn, p. 45, by Julie Dirksen, 2016.

CHARTS
• Provide insights based on the shape(s) of the data.
• Tell stories.
• Enlighten and inform the reader.
TABLES
• Provide precise values.
• Use to supply data.
TWO ELEMENTS, TWO PURPOSES

NOVICE MASTER
PRACTICE & EXPERIENCE
→

THE RECIPECooking Up A Good Data Viz

THE RECIPE COOKING UP A GOOD DATA VIZ
+ + +
=
Data Color
+
Geometry
Good Data Visualization
Idea
THE RECIPE COOKING UP A GOOD DATA VIZ
• What format?
• What applications/ programs are needed?
• What structure?
Data

THE RECIPE COOKING UP A GOOD DATA VIZ
Your Visual Cues
• Position
• Length
• Angles
• Direction
• Area or Volume
Geometry
+

THE RECIPE COOKING UP A GOOD DATA VIZ
The Other Visual Cue –
I like to think of color as thesecrete sauce.
• Accessibility?
• Branding strategy?
• Add to the story?
Color

COLORACCESSIBILITY
• Approximately 4.5% of the population has some type of color insensitivity.
• Section 508 of the Rehabilitation Act of 1973 sets a legal standard for the contrast level necessary between text and its background.
Source: https://designsystem.digital.gov/design-tokens/color/overview/

COLORACCESSIBILITY
BEST PRACTICES
• Ratio: Text and interactive elements should have a color contrast ratio of at least 4.5:1.
• Color as indicator: Color should NOT be the only indicator. For example, underline links, or mark a required field with an asterisk.
• Color blindness: Red/green color blindness is the most common, so avoid green on red or red on green.
Source: https://designsystem.digital.gov/design-tokens/color/overview/

COLORACCESSIBILITY
ON-LINE RESOURCES
https://webaim.org/resources/contrastchecker/
http://colorsafe.co/
https://colorable.jxnblk.com/ffffff/6b757b
https://contrastchecker.com/

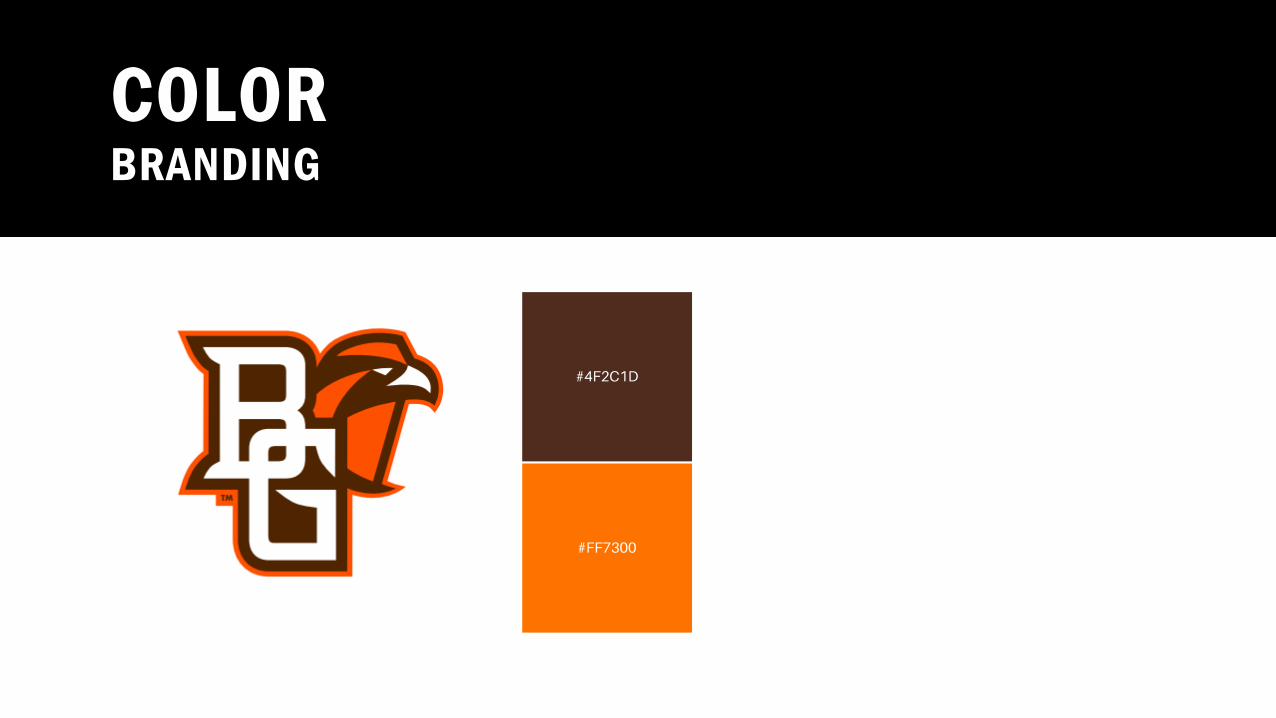
COLORBRANDING
Powerful!

COLORBRANDING

COLORBRANDING

COLORBRANDING
COLORBRANDING
#4F2C1D
#FF7300

COLOR BRANDINGThis is a screenshot of the BGSU official identity colors page.

COLOR BRANDING• This is a screenshot of the
BGSU web identity guidelines page.
• These guidelines take accessibility into account.

COLORSTORY
With accessibility and branding in mind...
Use color to make important ideas come forward.

1. GRAY IS YOUR FRIEND
COLORSTORY - 1
15.4 15.118.7 17.0
13.2 11.5
0
5
10
15
20
25
30
35
<HS HS/GED SomeCollege
Associate's Bachelor's Master's+Rat
e pe
r 1,0
00 m
arrie
d w
omen
First Divorce Rate for Women 18 and Older by Educational Attainment, 2019
Data Source: U.S. Census Bureau, American Community Survey, 1-year Estimates, 2019
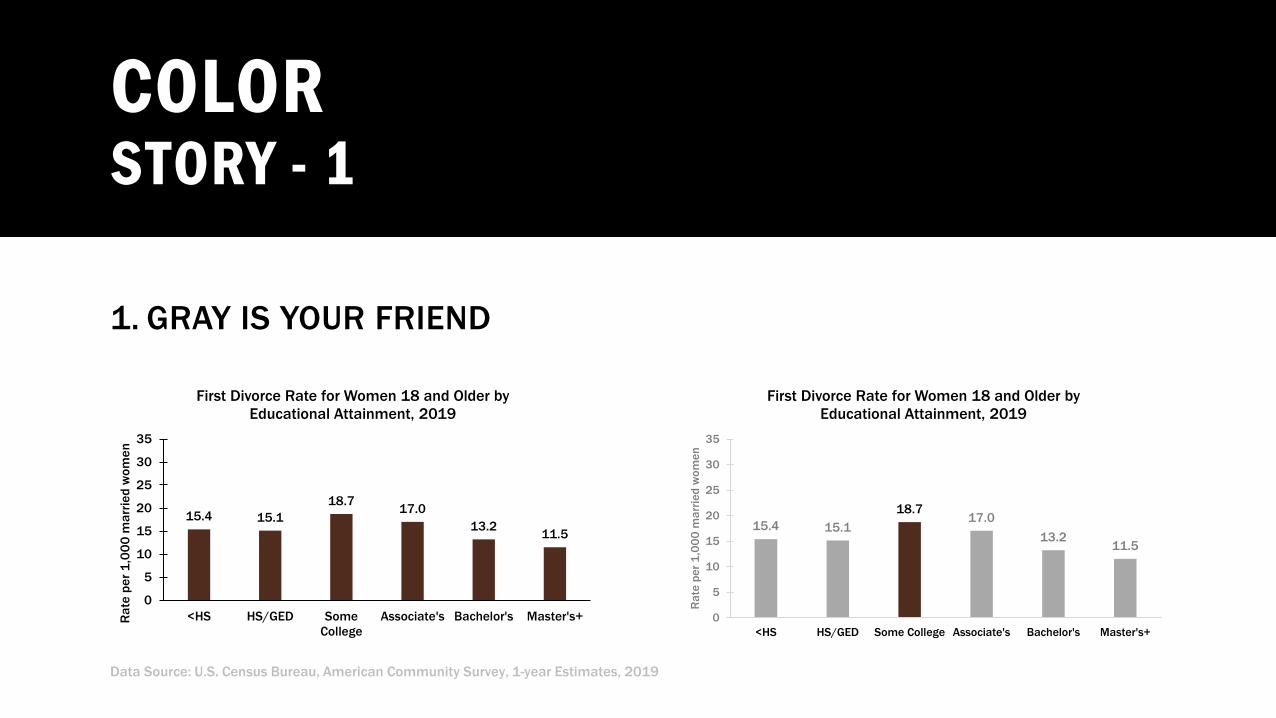
1. GRAY IS YOUR FRIEND
COLORSTORY - 1
15.4 15.118.7 17.0
13.2 11.5
0
5
10
15
20
25
30
35
<HS HS/GED SomeCollege
Associate's Bachelor's Master's+Rat
e pe
r 1,0
00 m
arrie
d w
omen
First Divorce Rate for Women 18 and Older by Educational Attainment, 2019
15.4 15.118.7
17.013.2
11.5
0
5
10
15
20
25
30
35
<HS HS/GED Some College Associate's Bachelor's Master's+
Rat
e pe
r 1,0
00 m
arrie
d w
omen
First Divorce Rate for Women 18 and Older by Educational Attainment, 2019
Data Source: U.S. Census Bureau, American Community Survey, 1-year Estimates, 2019

2. CONTRASTING DATA USE CONTRASTING COLORS
Two colors from different segments of the color wheel are contrasting colors (AKA complementary or clashing colors).
COLORSTORY - 2
3.5%
18.8%
37.5%
11.5%
32.5%
54.3%
0% 25% 50% 75% 100%
Male Same-Sex
Female Same-Sex
Male/Female
Male Same-Sex
Female Same-Sex
Male/Female
Coha
bitin
g Co
uple
sM
arrie
d Co
uple
s
Presence of Biological, Adopted, Step, or Foster Children of the Householder Under Age 18 Among Coupled
Households by Couple Type, 2019
Data Source: U.S. Census Bureau, American Community Survey, 1-year Estimates, 2019
Cool color
Warm color


DATA
Est LB UB
Cohabiting Couples
Male Same-Sex 3.5% 1.0% 1.3%
Female Same-Sex 18.8% 2.3% 2.6%
Male/Female 37.5% 0.5% 0.5%
Married Couples
Male Same-Sex 11.5% 1.7% 1.9%
Female Same-Sex 32.5% 2.2% 2.2%
Male/Female 54.3% 0.2% 0.2%
ADD CHART ELEMENT
CONFIDENCE INTERVALSHOW DO YOU ADD THEM IN EXCEL?
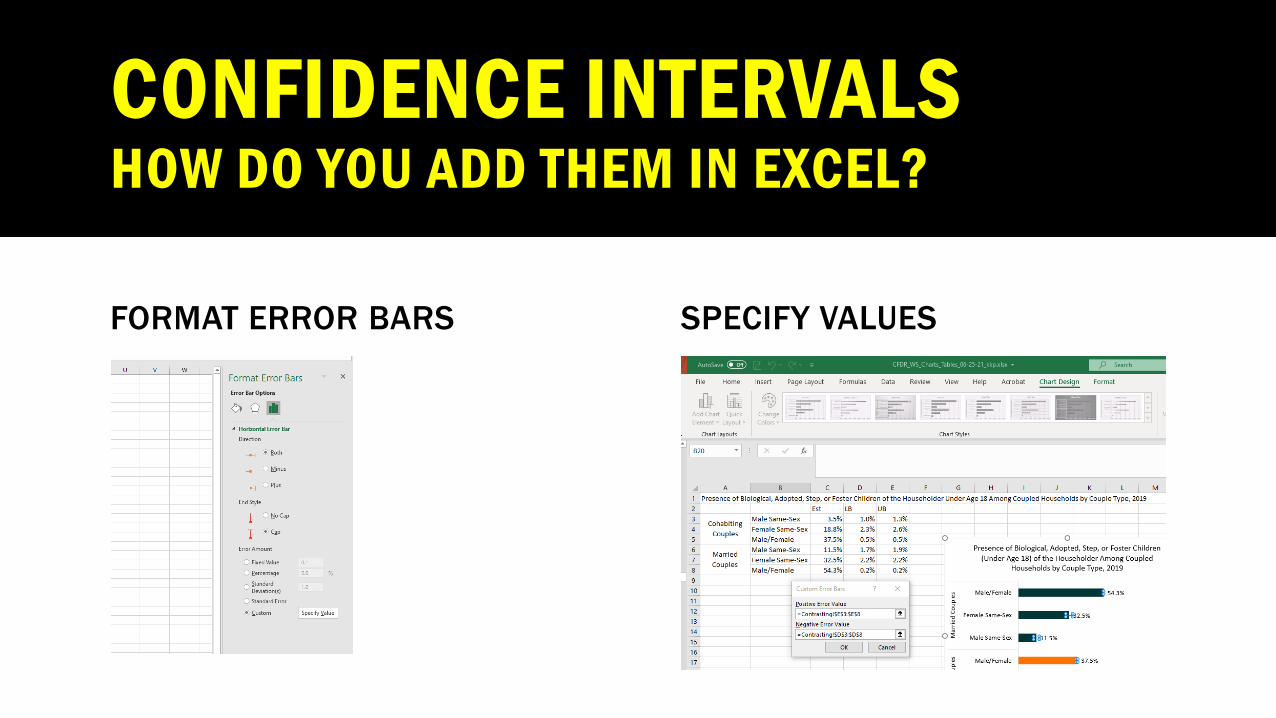
FORMAT ERROR BARS SPECIFY VALUES
CONFIDENCE INTERVALSHOW DO YOU ADD THEM IN EXCEL?

Welcome back to your regularly scheduled programming...

COLORSTORY - 3
4. Data ranges
Use low saturation/ paler/ whiter colors for lower values
and
Use higher saturation/ richer/ darker colors for higher values
Source: NCFMR analyses of U.S. Census Bureau, American Community Survey, 1-yr. est., 2019
29.0 31.7 32.6
50.5
64.0
78.4
0
25
50
75
100
<HS HS/GED SomeCollege
Associate's Bachelor's Master's+
Rat
e pe
r 1,0
00 N
ever
Mar
ried
Wom
en a
ged
18 a
nd o
lder
First Marriage Rate for Never-Married Women 18 and Older by Educational Attainment, 2019

COLORSTORY - 4
3. Groups of data Use the same or similar colors
Source: NCFMR analyses of Current Population Survey (IPUMS) 1995 and 2020 March Supplements
76%
53%
71% 72%
62%
37%
55%58%
0%
25%
50%
75%
100%
White Black Hispanic Others
Twenty-five Years of Change in the Share of Women (18-49) Who Ever Married by Racial/Ethnic Status
1995 2020

COLORSTORY - 5
5. Don’t use too many colors.
Find the “lowest common denominator” that allows you to still tell your story.

CHARTS

CATEGORICAL DATAGOAL: Bring structure to data by grouping people, places and things

CATEGORICAL DATA
Uses visual cues such as position, length, angles, direction, area or volume, and color

CATEGORICAL DATA
CategoriesBAR GRAPH
Useful for direct comparisons where length is used as the visual cue
Data Source: U.S. Census Bureau, American Community Survey, 1-year Estimates, 2009 and 2019
7.2% 8.4%
0%
5%
10%
15%
20%
25%
2009 2019
Percentage of Children Living in Grandparent-Headed Households, 2009 and 2019
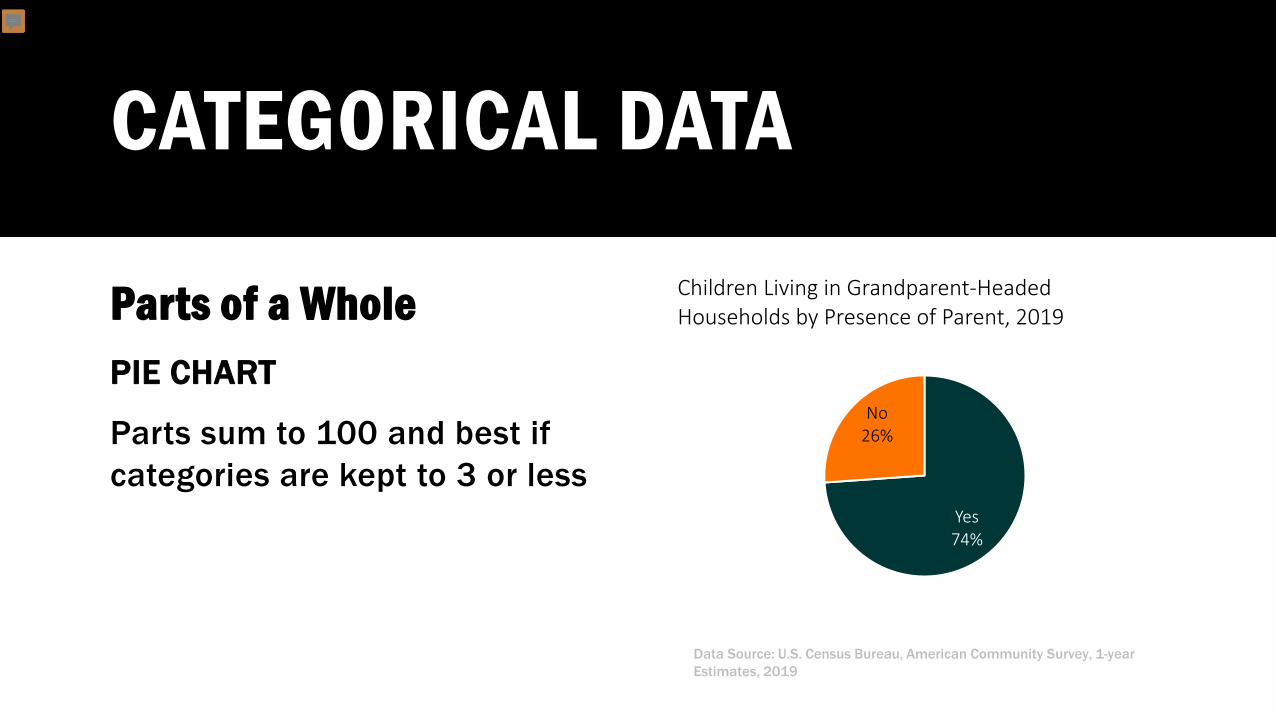
CATEGORICAL DATA
Parts of a WholePIE CHART
Parts sum to 100 and best if categories are kept to 3 or less
Yes74%
No26%
Children Living in Grandparent-Headed Households by Presence of Parent, 2019
Data Source: U.S. Census Bureau, American Community Survey, 1-year Estimates, 2019

CATEGORICAL DATA
Parts of a WholeDOUGHNUT CHART
Parts sum to 100 and best if categories are kept to 3 or less
Data Source: U.S. Census Bureau, American Community Survey, 1-year Estimates, 2019
Children Living in Grandparent-Headed Households by Presence of Parent, 2019

CATEGORICAL DATA
Parts of a WholeGAUGE CHART
Parts sum to 100 and best if categories are kept to 3 or less
Data Source: U.S. Census Bureau, American Community Survey, 1-year Estimates, 2019
Children Living in Grandparent-Headed Households by Presence of Parent, 2019

CATEGORICAL DATA
Parts of a WholeSTACKED BAR CHART
Each bar can sum to 100 or can be used to show raw counts
83% 71% 61%
17% 29% 39%
0%
25%
50%
75%
100%
6 & under 7 to 12 13 to 17
Age of Child
Children Living in Grandparent-Headed Households by Presence of Parent and Age of Child, 2019
Skipped Generation
Multigenerational
Data Source: U.S. Census Bureau, American Community Survey, 1-year Estimates, 2019

CATEGORICAL DATA
BEWARE of defaults when using Excel!
• REMEMBER - position and length are visual cues.

7.2%
8.4%
6%
8%
10%
Boys Girls
Figure A
7.2%
8.4%
0%
2%
4%
6%
8%
10%
Boys Girls
Figure B
7.2% 8.4%
0%
25%
50%
75%
100%
Boys Girls
Figure C
GEOMETRY: LENGTH & POSITION MATTERS
Source: NCFMR analyses of the American Community Survey 1-year estimates, 2019

7.2%
8.4%
6%
8%
10%
Boys Girls
Figure A
7.2%
8.4%
0%
2%
4%
6%
8%
10%
Boys Girls
Figure B
7.2% 8.4%
0%
25%
50%
75%
100%
Boys Girls
Figure C
GEOMETRY: LENGTH & POSITION MATTERS
Source: NCFMR analyses of the American Community Survey 1-year estimates, 2019

7.2%
8.4%
6%
8%
10%
Boys Girls
Figure A. Axis starting at 6% and ending at 10%
7.2%
8.4%
0%
2%
4%
6%
8%
10%
Boys Girls
Figure B. Axis starting at 0% and ending at 10%
7.2% 8.4%
0%
25%
50%
75%
100%
Boys Girls
Figure C. Axis starting at 0 % and ending at 100%
GEOMETRY: LENGTH & POSITION MATTERS
Source: NCFMR analyses of the American Community Survey 1-year estimates, 2019
TIME SERIES DATAGOAL: See what has passed, what is different, what is the same, and by how much

TIME SERIES DATA
Uses visual cues such as length, direction, and position

TIME SERIES DATA
BAR GRAPH
Useful for discrete points in time
Data Source: Bureau of Labor Statistics
0%
6%
12%
18%
Jun-
19
Aug-
19
Oct
-19
Dec-
19
Feb-
20
Apr-
20
Jun-
20
Aug-
20
Oct
-20
Dec-
20
Feb-
21
Apr-
21
Jun-
21
Ohio Monthly Unemployment RateJune 2019-June 2021

TIME SERIES DATA
LINE CHART
Lines can make it easier to see trends
Data Source: Bureau of Labor Statistics
0%
6%
12%
18%
Jun-
19
Aug-
19
Oct
-19
Dec-
19
Feb-
20
Apr-
20
Jun-
20
Aug-
20
Oct
-20
Dec-
20
Feb-
21
Apr-
21
Jun-
21
Ohio Monthly Unemployment RateJune 2019-June 2021
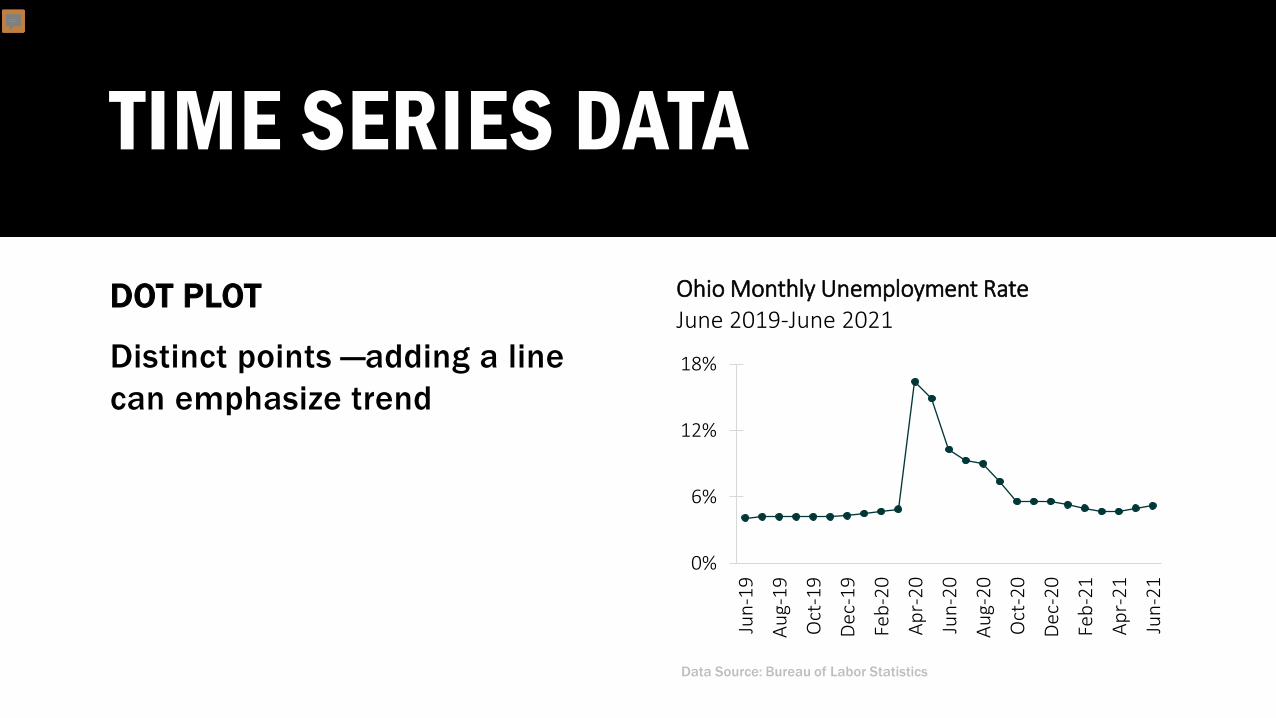
TIME SERIES DATA
DOT PLOT
Distinct points —adding a line can emphasize trend
0%
6%
12%
18%
Jun-
19
Aug-
19
Oct
-19
Dec-
19
Feb-
20
Apr-
20
Jun-
20
Aug-
20
Oct
-20
Dec-
20
Feb-
21
Apr-
21
Jun-
21
Ohio Monthly Unemployment RateJune 2019-June 2021
Data Source: Bureau of Labor Statistics
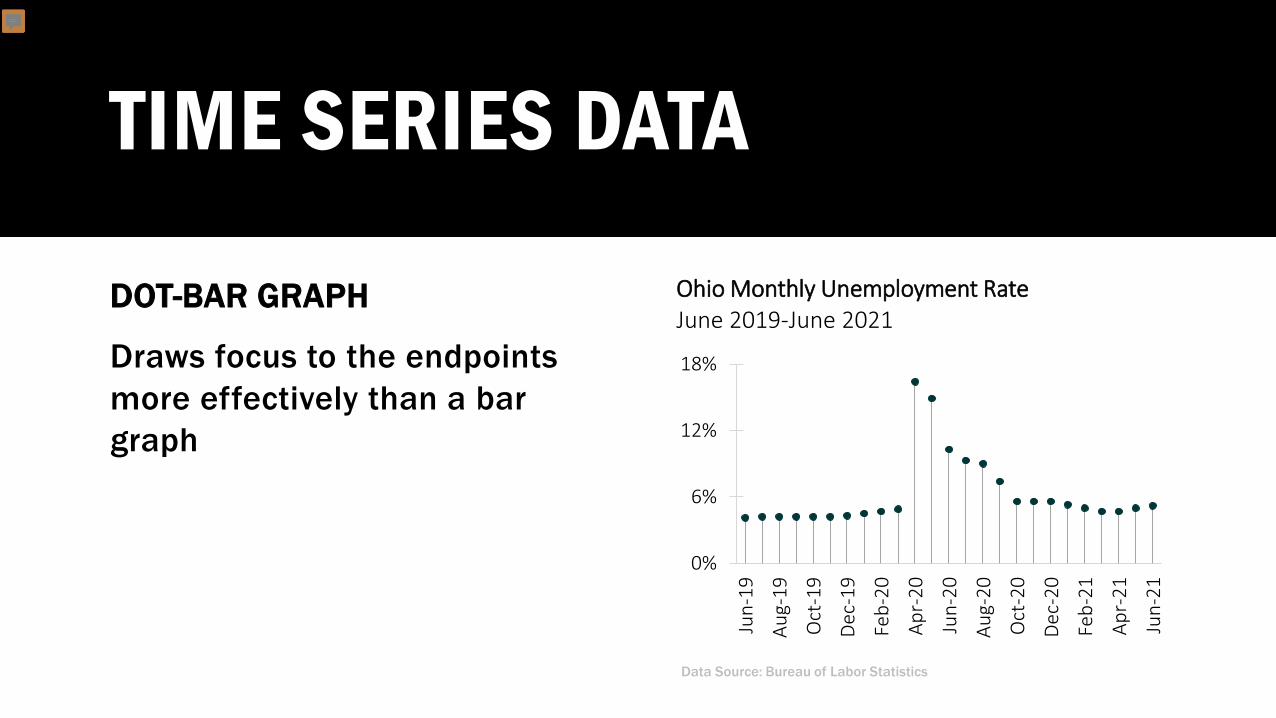
TIME SERIES DATA
DOT-BAR GRAPH
Draws focus to the endpoints more effectively than a bar graph
0%
6%
12%
18%
Jun-
19
Aug-
19
Oct
-19
Dec-
19
Feb-
20
Apr-
20
Jun-
20
Aug-
20
Oct
-20
Dec-
20
Feb-
21
Apr-
21
Jun-
21
Ohio Monthly Unemployment RateJune 2019-June 2021
Data Source: Bureau of Labor Statistics

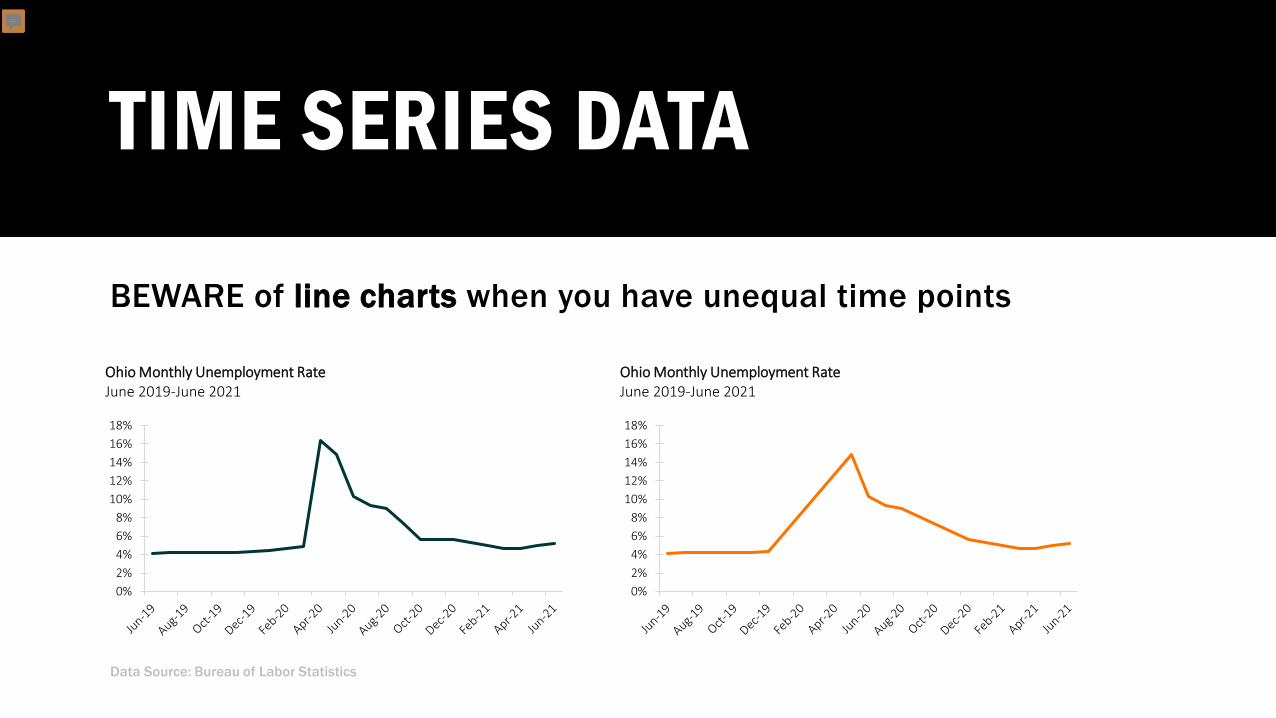
TIME SERIES DATA
BEWARE of line charts when you have unequal time points
0%2%4%6%8%
10%12%14%16%18%
Ohio Monthly Unemployment RateJune 2019-June 2021
Data Source: Bureau of Labor Statistics

TIME SERIES DATA
BEWARE of line charts when you have unequal time points
Data Source: Bureau of Labor Statistics
0%2%4%6%8%
10%12%14%16%18%
Ohio Monthly Unemployment RateJune 2019-June 2021
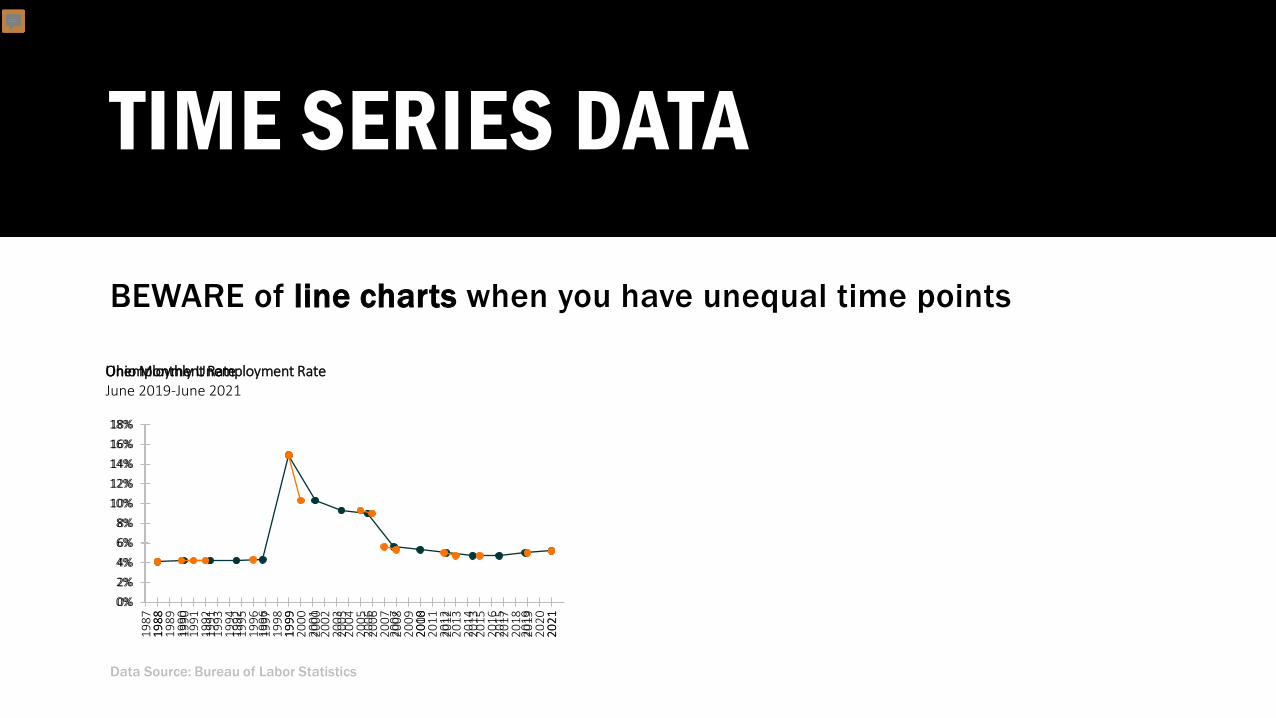
TIME SERIES DATA
BEWARE of line charts when you have unequal time points
0%2%4%6%8%
10%12%14%16%18%
Ohio Monthly Unemployment RateJune 2019-June 2021
Data Source: Bureau of Labor Statistics
0%2%4%6%8%
10%12%14%16%18%
Ohio Monthly Unemployment RateJune 2019-June 2021

TIME SERIES DATA
BEWARE of line charts when you have unequal time points
0%2%4%6%8%
10%12%14%16%18%
Ohio Monthly Unemployment RateJune 2019-June 2021
Data Source: Bureau of Labor Statistics
0%2%4%6%8%
10%12%14%16%18%
Ohio Monthly Unemployment RateJune 2019-June 2021

TIME SERIES DATA
BEWARE of line charts when you have unequal time points
Data Source: Bureau of Labor Statistics
0%2%4%6%8%
10%12%14%16%18%
Ohio Monthly Unemployment RateJune 2019-June 2021
0%2%4%6%8%
10%12%14%16%18%
Ohio Monthly Unemployment RateJune 2019-June 2021
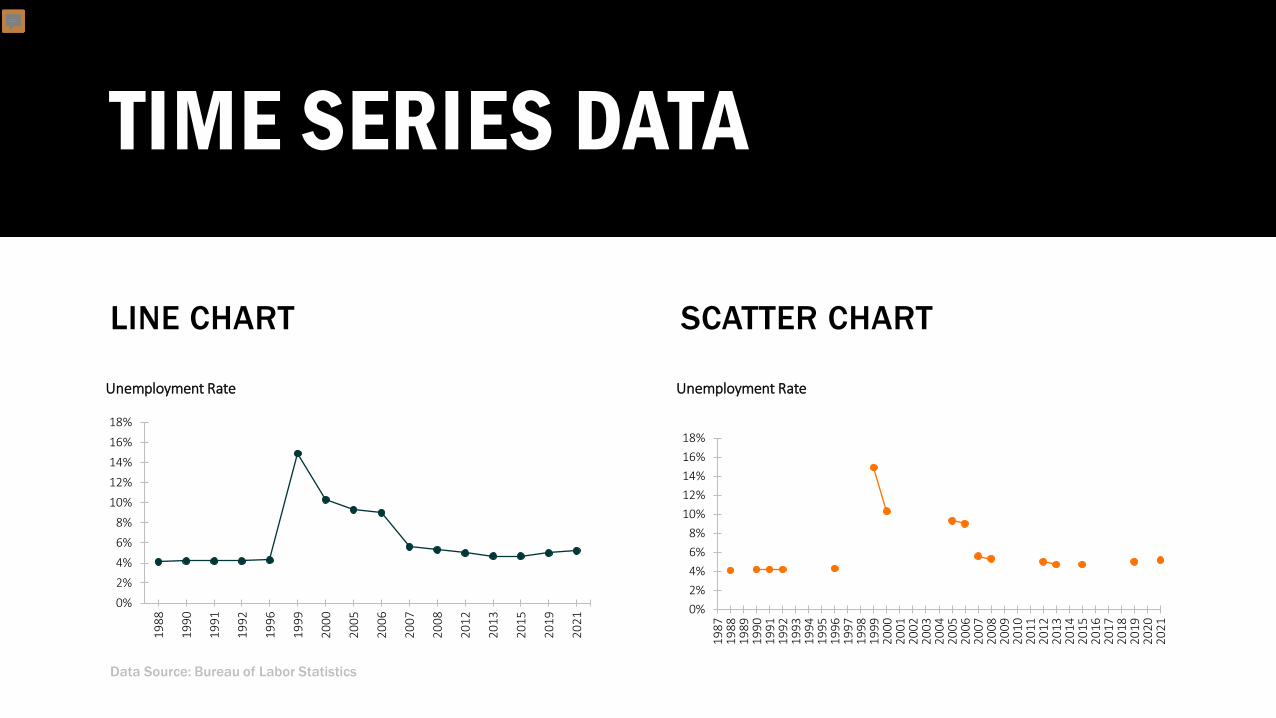
LINE CHART SCATTER CHART
TIME SERIES DATA
Data Source: Bureau of Labor Statistics
0%2%4%6%8%
10%12%14%16%18%
1987
1988
1989
1990
1991
1992
1993
1994
1995
1996
1997
1998
1999
2000
2001
2002
2003
2004
2005
2006
2007
2008
2009
2010
2011
2012
2013
2014
2015
2016
2017
2018
2019
2020
2021
Unemployment Rate
0%2%4%6%8%
10%12%14%16%18%
1988
1990
1991
1992
1996
1999
2000
2005
2006
2007
2008
2012
2013
2015
2019
2021
Unemployment Rate
TIME SERIES DATA
BEWARE of line charts when you have unequal time points
Data Source: Bureau of Labor Statistics
0%2%4%6%8%
10%12%14%16%18%
1988
1990
1991
1992
1996
1999
2000
2005
2006
2007
2008
2012
2013
2015
2019
2021
Ohio Monthly Unemployment RateJune 2019-June 2021
0%2%4%6%8%
10%12%14%16%18%
1987
1988
1989
1990
1991
1992
1993
1994
1995
1996
1997
1998
1999
2000
2001
2002
2003
2004
2005
2006
2007
2008
2009
2010
2011
2012
2013
2014
2015
2016
2017
2018
2019
2020
2021
Unemployment Rate

ANNOTATE
0
2
4
6
8
10
12
14
16
18
20
0
20
40
60
80
100
120
140
1880
1890
1900
1910
1920
1930
1940
1950
1960
1970
1980
1990
2000
2010
2019
Rat
e pe
r 1,0
00 to
tal p
opul
atio
n
Rat
e pe
r 1,0
00 u
nmar
ried
wom
en a
ged
15+
Figure 1U.S. Decennial Marriage Rates, 1880-2019
Adjusted Marriage Rate Crude Marriage Rate
Following 1940 until 1980, the patterns are not as similar
Since 1980, both the crude and adjusted rates have declined at a similar rate
From 1880-1940, trends are similar

SPATIAL DATAGOAL: Represent where (you) are, were (you)’ve been, where (you) want to go

SPATIAL DATA

SPATIAL DATA
I maps.

SPATIAL DATA
CHOROPLETH MAP
Defined regions colored by data
Women’s State-Level Median Age at First Marriage by Quartile, 2019
Source: NCFMR analyses of the American Community Survey 1-year estimates, 2019
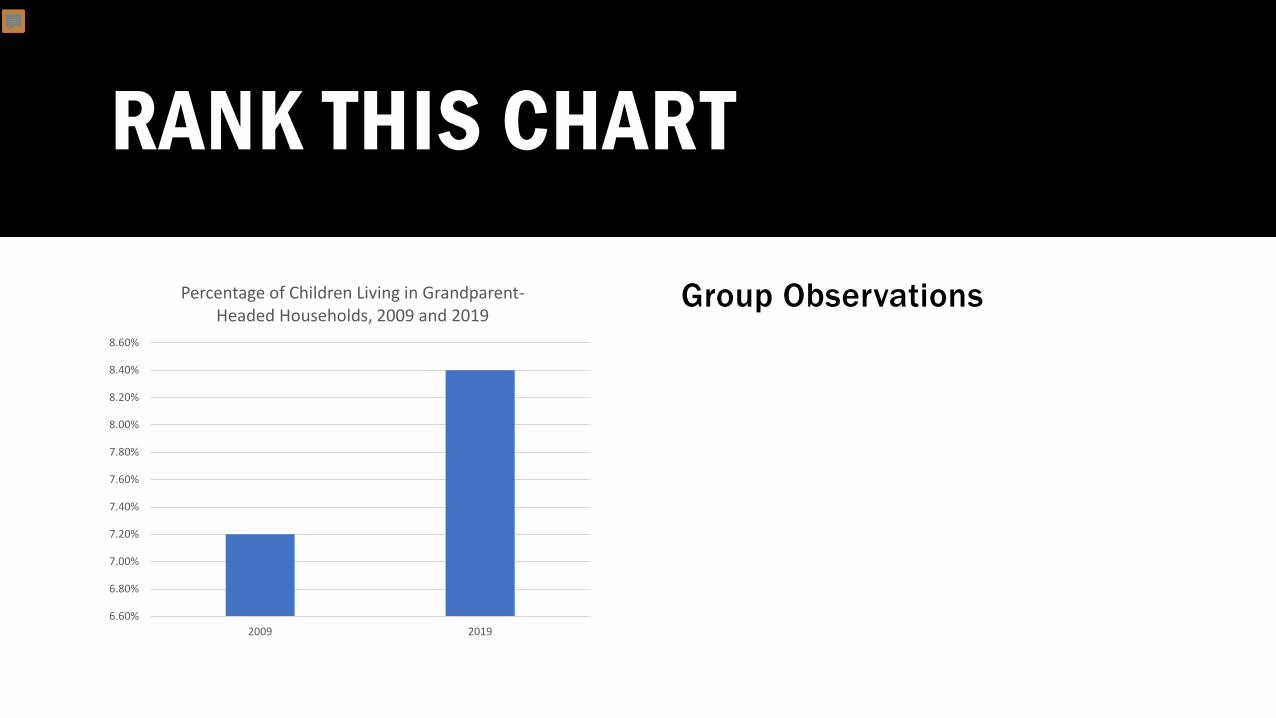
RANK THIS CHART
6.60%
6.80%
7.00%
7.20%
7.40%
7.60%
7.80%
8.00%
8.20%
8.40%
8.60%
2009 2019
Percentage of Children Living in Grandparent-Headed Households, 2009 and 2019
Group Observations

TABLES
In Excel Word

TABLES
Where is your table going to be viewed and by whom?
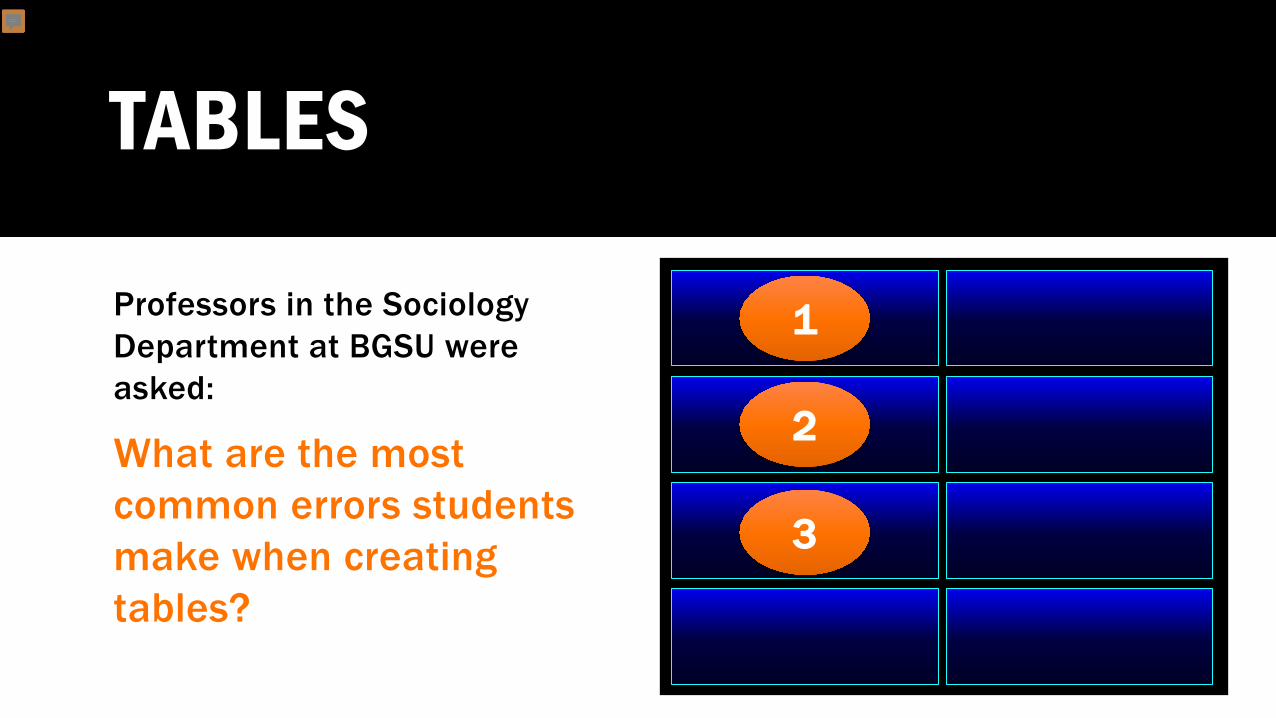
TABLES
Professors in the Sociology Department at BGSU were asked:
What are the most common errors students make when creating tables?
1
2
3

TABLES
2
3
Survey says...

TABLES
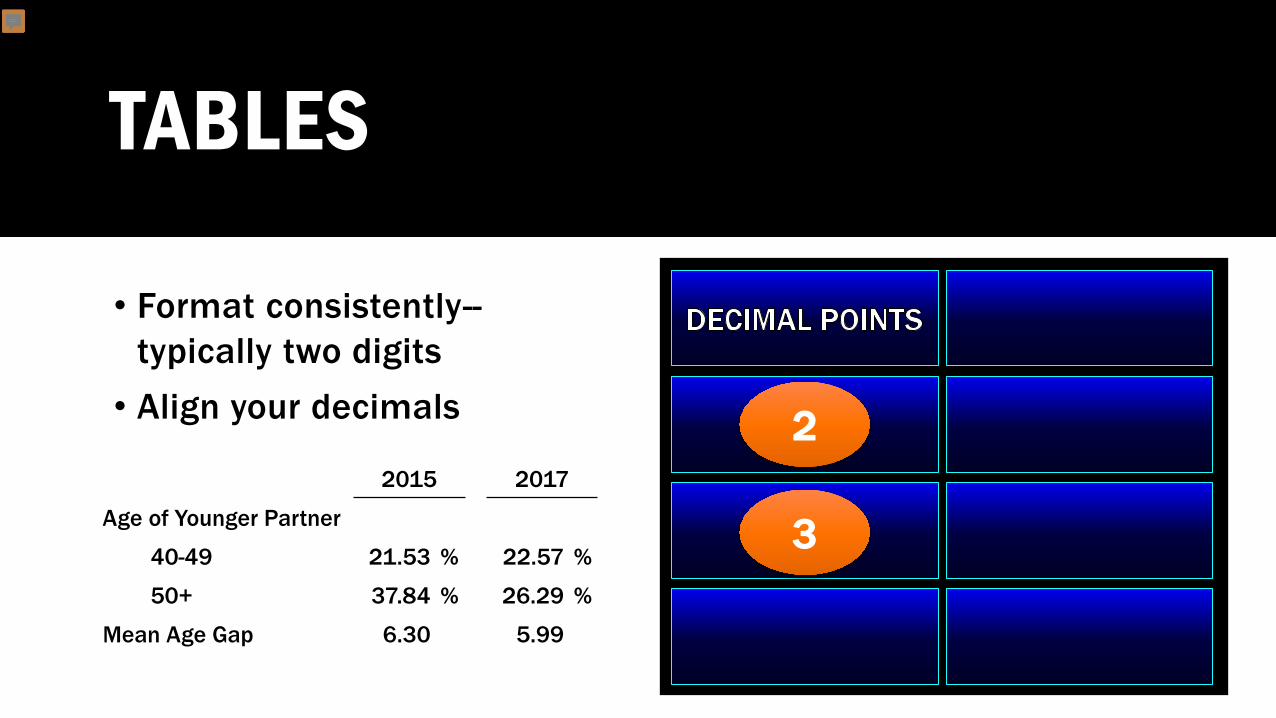
• Format consistently--typically two digits
2015 2017
Age of Younger Partner
40-49 21.53 % 22.57 %
50+ 37.84 % 26.29 %
Mean Age Gap 6.30 5.99
2
3

TABLES
• Format consistently--typically two digits
• Align your decimals
2015 2017
Age of Younger Partner
40-49 21.53 % 22.57 %
50+ 37.84 % 26.29 %
Mean Age Gap 6.30 5.99
2
3
TABLES
• Format consistently--typically two digits
• Align your decimals
2015 2017
Age of Younger Partner
40-49 21.53 % 22.57 %
50+ 37.84 % 26.29 %
Mean Age Gap 6.30 5.99
2
3

TABLES
Survey says...
3
DECIMAL POINTS
TABLES
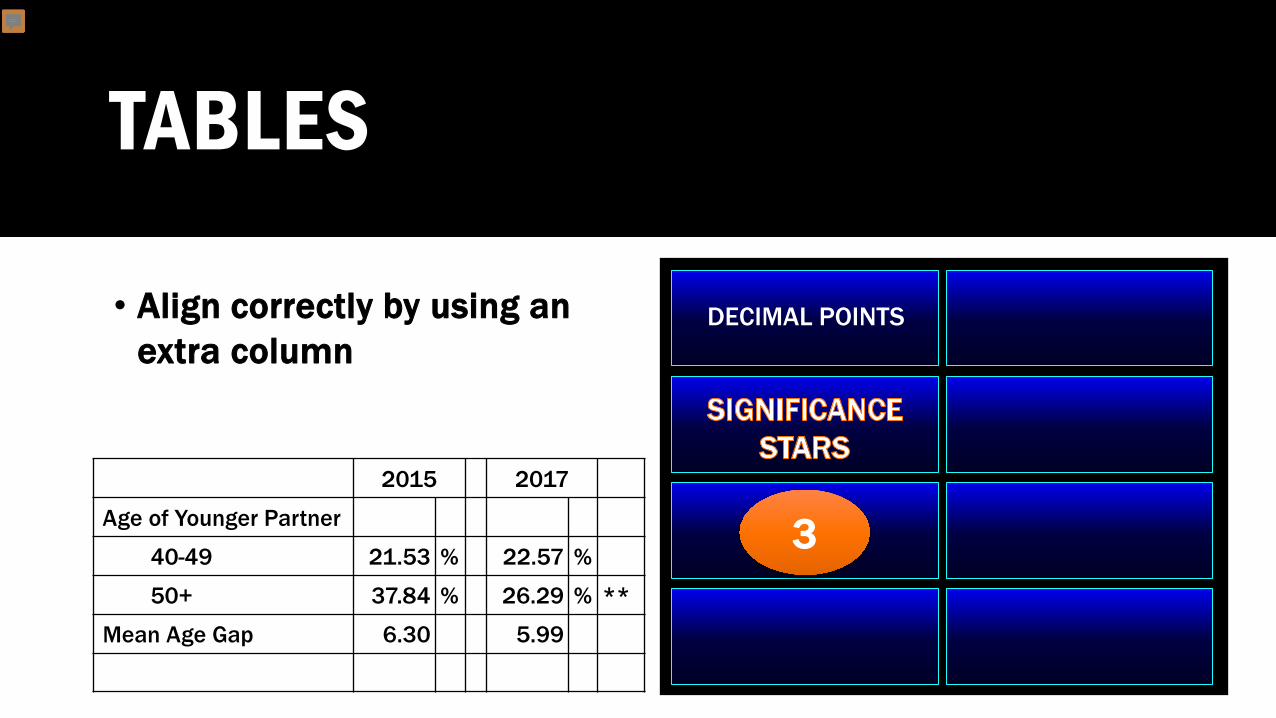
• Align correctly by using an extra column
3
DECIMAL POINTS
2015 2017
Age of Younger Partner
40-49 21.53 % 22.57 %
50+ 37.84 % 26.29 % **
Mean Age Gap 6.30 5.99

TABLES
• Align correctly by using an extra column
3
DECIMAL POINTS
2015 2017
Age of Younger Partner
40-49 21.53 % 22.57 %
50+ 37.84 % 26.29 % **
Mean Age Gap 6.30 5.99
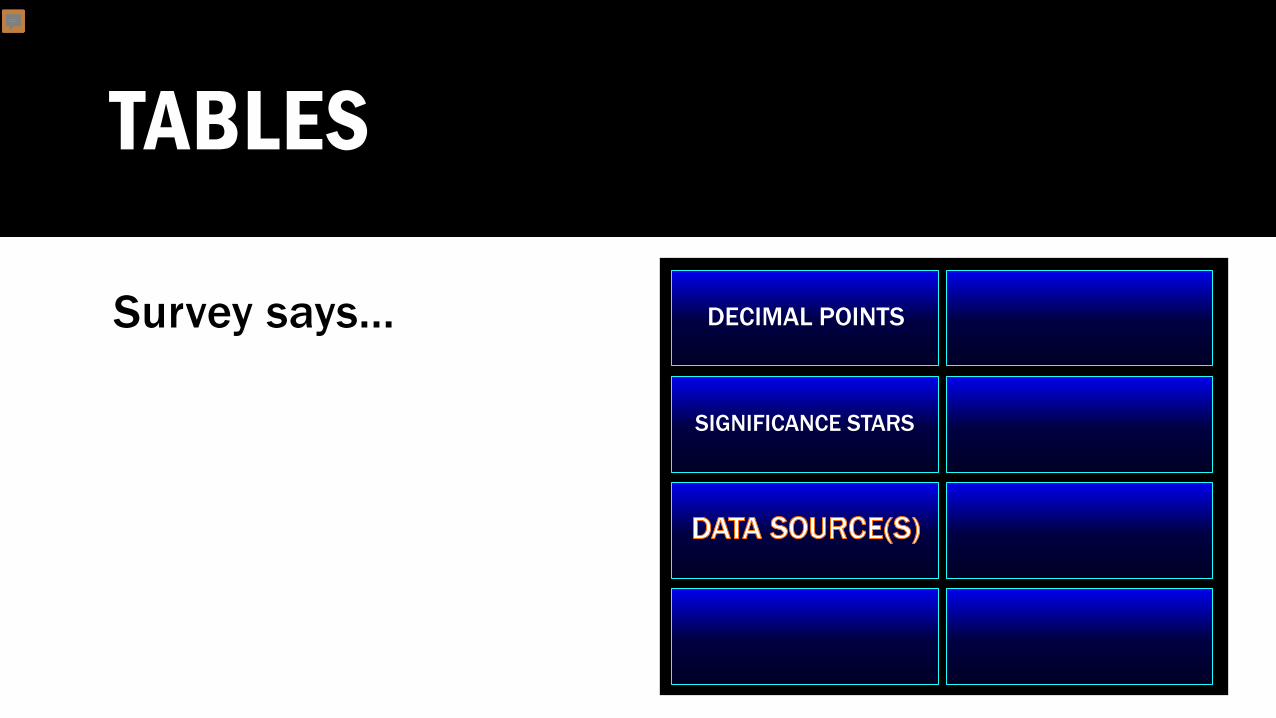
TABLES
Survey says... DECIMAL POINTS
SIGNIFICANCE STARS
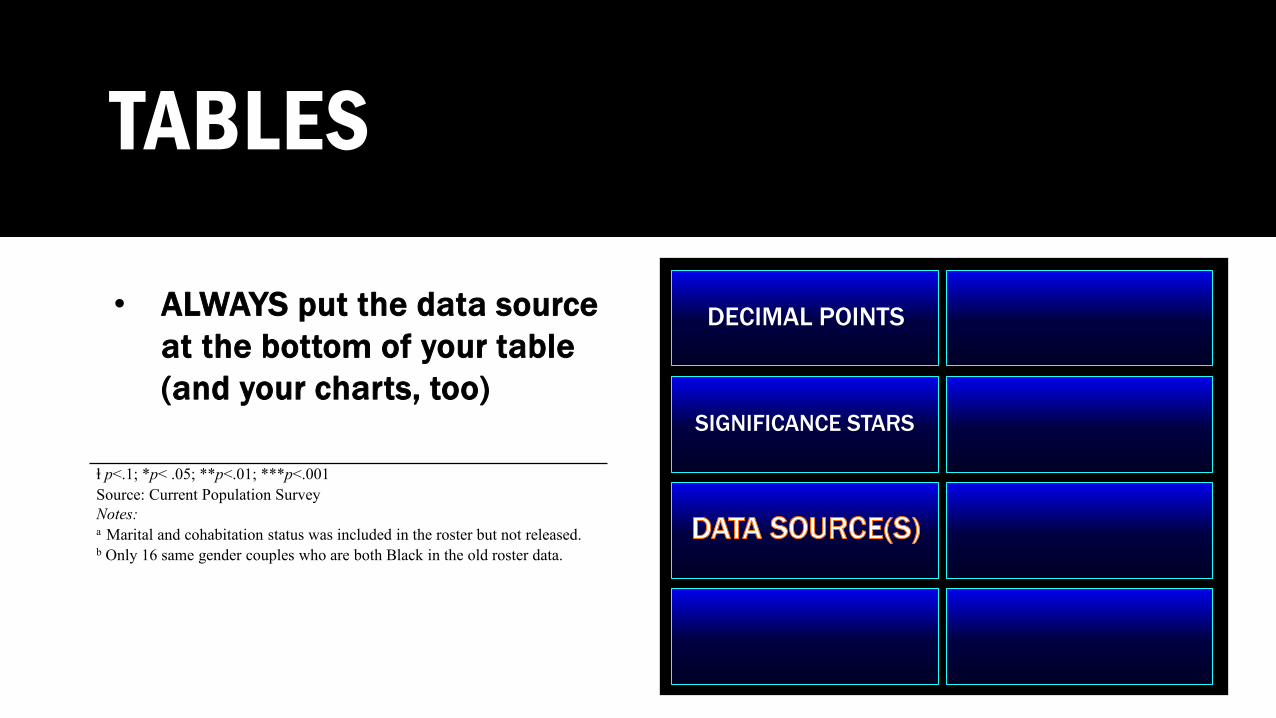
TABLES
• ALWAYS put the data source at the bottom of your table (and your charts, too)
DECIMAL POINTS
SIGNIFICANCE STARS
ⱡ p<.1; *p< .05; **p<.01; ***p<.001Source: Current Population SurveyNotes:a Marital and cohabitation status was included in the roster but not released.b Only 16 same gender couples who are both Black in the old roster data.

P.S. FOREST PLOTS
https://mbounthavong.com/blog/tag/forest+plots
DATA PRESENTATION
• Published papers
• Conference posters
• Blog posts
• Research briefs
• Infographics
DATA EXPLORATION
You can use data visualization as an...
• Analysis tool!
BUT WAIT, THERE’S MORE

SUGGESTED READING
• Avoiding Data Pitfalls: How to Steer Clear of Common Blunders When Working with Data and Presenting Analysis and Visualizations. Ben Jones
• Data Points: Visualization that Means Something. Nathan Yau
• Data Story: Explain Data and Inspire Action Through Story. Nancy Duarte
• Design for How People Learn. Julie Dirksen
• Elevate the Debate: A Multilayered Approach to Communicating Your Research. Eds. Jonathan A. Schwabish
• Good Charts: The HBR Guide to Making Smarter, More Persuasive Data Visualizations. Scott Berinato
• How Charts Lie: Getting Smarter about Visual Information. Alberto Cairo
• How to Lie with Statistics. Darrell Huff
• Now You See It. Stephen Few
• Show Me the Numbers: Designing Tables and Graphs to Enlighten. Stephen Few
• Slide:ology: The Art and Science of Creating Great Presentations. Nancy Duarte
• Storytelling with Data: A Data Visualization Guide for Business Professionals. Cole Nussbaumer Knaflic
• The Non-Designer’s Design Book, 4th Edition. Robin Williams
• Turning Number into Knowledge. Jonathan Koomey
• Visualize This: The FlowingData Guide to Design, Visualization, and Statistics. Nathan Yau