86
DESIGNING WHOLESALE ELECTRICITY MARKETS Paul L. Joskow MARCH 20, 2006

DESIGNING WHOLESALE ELECTRICITY MARKETS
Paul L. Joskow
MARCH 20, 2006

OUTLINE
• Background goals and challenges for liberalization (restructuring, competition and regulatory reform)
• Short-term wholesale market design objectives and principles
• U.S. standard market design– Short-term performance– Long-run investment incentives
• Transmission network investment issues

Transmission lines230-500 kV
Networkswitchyard
Transmission subs
66-115 kV lines
Distribution subs
Distribution lines
GeneratorStep-up
ELECTRICITY SUPPLY SEGMENTS

GOALS FOR WHOLESALE (G&T) ELECTRIC POWER SYSTEMS
• Efficient and reliable system operation• Balance supply and demand in real time• Maintain network’s physical parameters (e.g., frequency)• Low probability of “non-price” rationing (e.g. rolling blackouts)• Avoid adverse impacts on interconnected networks• Rapid system restoration• Minimize cost of achieving these goals• Provide efficient price signals to consumers
• Efficient investment consistent with reliability andenvironmental standards
• Minimize long-run bulk power supply costs (G&T) consistentwith reliability and environmental goals

GeneratingUnits
TransmissionNetwork Distribution
NetworkOperationsandDispatch
Consumers
Other Control Areas
Vertical Integration
Wholesale Market
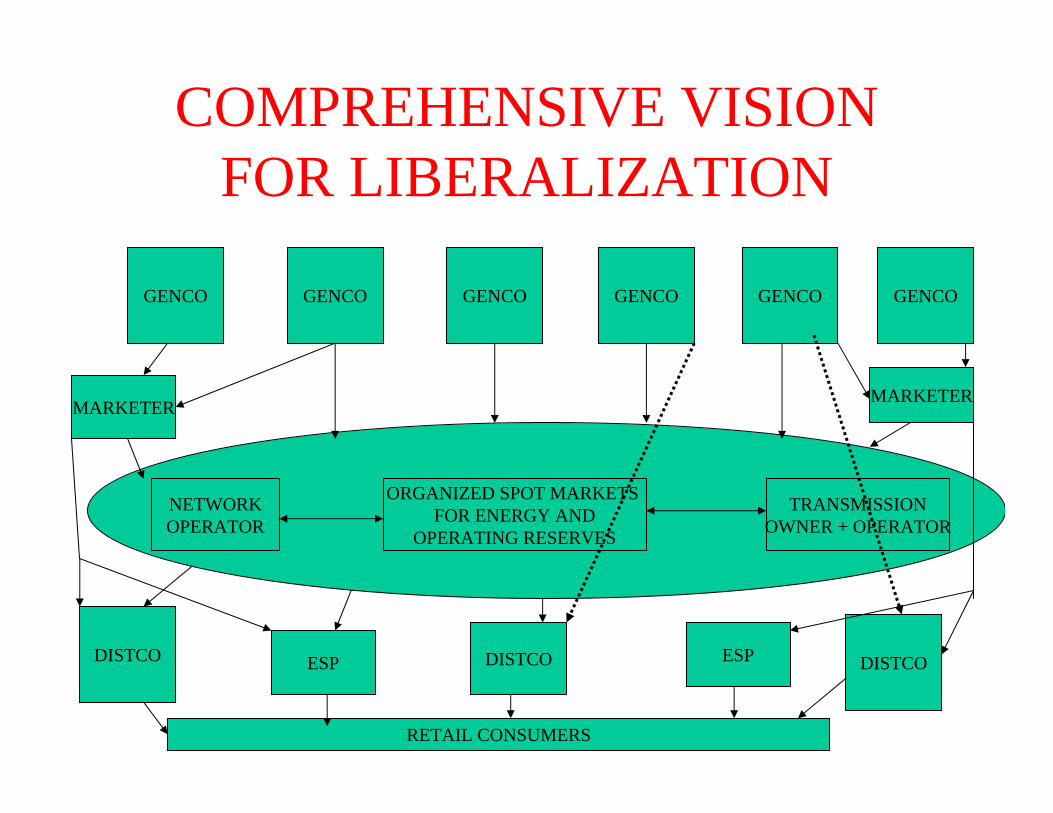
COMPREHENSIVE VISION FOR LIBERALIZATION
GENCO GENCO GENCO GENCO GENCO GENCO
NETWORKOPERATOR
ORGANIZED SPOT MARKETS FOR ENERGY AND
OPERATING RESERVES
TRANSMISSIONOWNER + OPERATOR
DISTCODISTCODISTCO
MARKETERMARKETER
ESPESP
RETAIL CONSUMERS

WHY WHOLESALE AND RETAIL COMPETITION?
• Goal is to provide long run net benefits to society • Provide better incentives for controlling capital and operating
costs of new and existing generating capacity• Encourage innovation in power supply technologies• Shift risks of “mistakes” to suppliers and away from consumers• Support retail prices that reflect marginal production cost
including the costs of congestion, losses, and scarcity• Provide enhanced array of retail service products, risk
management, demand management, and opportunities for service quality differentiation based on individual consumer preferences
• Facilitate better regulation of residual monopoly services to enhance efficiency incentives and reduce T&D costs (broadly defined)
• Consistent with environmental and reliability policy goals usingmarket-compatible mechanisms (green taxes or cap-and-trade)

CREATING COMPETITIVE WHOLESALE AND RETAIL MARKETS
• Easy to do badly and difficult to do well.• Electricity has unusual physical and economic
attributes that make wholesale and retail market design a significant technical and institutional challenge
• Major institutional changes are required– Industry Restructuring- vertical and horizontal– New market institutions– New regulatory institutions– Re-evaluation and adaptation of engineering reliability rules
• A strong political commitment to making competitive markets work is important because it’s a long difficult process with gainers and losers

RESTRUCTURING FOR COMPETITION• New market and institutional structures are necessary for successful
liberalization (good market design cannot fix a bad market structure)– Vertical separation and unbundling of competitive segments
from regulated monopoly segments– Horizontal decentralization to support competition in generation
and retail supply – Horizontal integration of transmission ownership and operations
to internalize network externalities– New wholesale market institutions to replace central economic
dispatch and network management – New regulatory institutions for T&D networks– Harmonization of market and regulatory institutions between
network control areas to facilitate efficient trading, enhance competition, and support investment in transmission capacity over large geographic regions
– Compatible retail market institutions (prices, demand response)

WHOLESALE MARKET DESIGNSHORT-TERM OPERATIONS
• Replace internal behavioral protocols used by vertically integrated system operators with transparent decentralized market mechanisms– Efficient scheduling generation and load to balance supply
and demand continuously– Efficient generator dispatch– Efficient provision of frequency regulation and operating
reserves– Efficient allocation of scarce transmission capacity – Coordination with neighboring systems to support trade
and reliability – Manage operating reserve emergencies and unplanned
outages of G&T consistent with appropriate reliability criteria using market mechanisms

INVESTMENT INCENTIVES • Well functioning short-term wholesale (and retail) markets are necessary to provide appropriate incentives for investment in and retirement of generating capacity• Well functioning wholesale markets provide necessary signals for evaluating both regulated and merchant transmission investments• Several revenue streams
• energy revenues• ancillary services or “operating reserves” revenues• capacity revenues (if any)
• Other factors are also important• congestion management and locational pricing• contract regime (spot, longer term)• transmission interconnection and transit rules and prices• engineering reliability rules

INVESTMENT INCENTIVE ISSUES
• Investment incentives for new generation– Do “energy-only” markets provide adequate incentives
to stimulate generation investment consistent with reliability criteria
– Do we get the right “mix” of generating capacity?– Are capacity obligations and capacity markets
necessary?• How should investment in transmission capacity
be governed?– Intra-network for reliability– Intra-network to reduce congestion– Inter-network connections (“interconnectors”)– Regulated, merchant, a mixture?

WHOLESALE MARKET DESIGN FEATURES
• Wholesale electricity markets do not design themselves• Organized day-ahead, intra-day adjustment and real time
balancing markets for energy– Efficient unit commitment and dispatch– Efficient wholesale prices
• Organized day-ahead and adjustment markets for ancillary services– How are requirements defined? (public goods?)– Integration with energy markets– Efficient (arbitraged) prices
• Transmission congestion and loss management– Integration of allocation of transmission with energy markets– Efficient prices for congestion and losses– Over large geographic areas– Minimize “seams” problems between control areas
• Capacity obligations, capacity prices, capacity markets?

WHOLESALE MARKET DESIGN FEATURES
• Accommodating “self-scheduling” to support bilateral contracts– Consistent and transparent congestion and loss prices– Consistent and transparent imbalance prices
• Integration with engineering reliability rules and criteria– Where do they come from?
• Demand-side responses– Real time pricing– Controllable loads– Non-price rationing
• Price formation during “scarcity conditions”

U.S. STANDARD MARKET DESIGN
• The basic standard wholesale market design (SMD) in operation in the U.S. Northeast and Midwest works reasonably well from a short run operating cost and reliability perspective
• New England, New York, PJM, MISO (CAISO and ERCOT Soon)
• The SMD has evolved over time and its performance has improved based on experience
• Primary deficiencies relate to investment incentives for new generation and transmission
• T&D regulatory frameworks and industry restructuring have not kept up with wholesale market design improvements in the U.S. (unlike UK, etc.)
• Imperfections in competitive retail markets have adverse effects on wholesale market performance

AlbertaOntario

970,000Total U.S. Generating Capacity
_______
552,000ISO/RTO Total
_______
60,000Southwest Power Pool (RTO)[1]
78,000ERCOT (Texas)
52,000California ISO
130,000Midwest ISO (MISO)
164,000PJM (expanded) (RTO)
37,000New York ISO
31,000ISO-New England (RTO)
Generating Capacity
(MW)
System Operator
Table 1. Independent System Operators and Organized Wholesale Markets 2005
[1] Organized markets being developed


BASIC ATTRIBUTES OF U.S. WHOLESALE (SMD) MARKETS
• Independent System Operator (ISO)– Non-profit entity (effectively) that does not own transmission assets– Responsible for operating reliability of network– Control area operator (SO)– Manages Open Access Transmission Tariff and OASIS– Manages voluntary wholesale spot markets for power and ancillary
services– Manages requests for transmission service, allocation of scarce
transmission capacity and network expansions– Regional Transmission Expansion Planning process– Supports market monitoring and mitigation programs– Coordination with neighboring control areas, including imports/exports
(cross-border trade)• Regulated Incumbent Transmission Owners (TOs)
– Functional separation rules due to G&T vertical integration– Opportunities/obligations for both regulated and merchant projects

BASIC FEATURES OF WHOLESALE MARKET DESIGN
• Security constrained bid-based dispatch using state-estimator network model– Day-ahead hourly markets – Intra-day adjustment and balancing markets (adjustments,
imbalances, 5-minutes)– Self-scheduling and bilateral contracts permitted subject to
imbalance and congestions charges• Resulting LMPs calculated at each bus
– Marginal cost of congestion– Marginal cost of losses (NE, NY, not yet in PJM)– Internalizes network externalities into prices– Allocates scarce transmission capacity efficiently
• Market-based provision of operating reserves integrated with day-ahead and real-time energy markets

BASIC FEATURES OF WHOLESALE MARKET
• Financial Transmission Rights (FTRs) are auctioned and traded to provide congestion price hedges
• Also provide property rights to support new merchant transmission investment
• Generating capacity (reserve) obligations imposed on suppliers (e.g. 18% forward reserve margin) and associated “capacity markets” and capacity prices– Uniform reserve obligation on all retail suppliers (LSEs)– Annual and monthly auctions for “capacity”– “Reserve Capacity demand curve” in New York– 4-year forward reserve capacity obligation for LSEs agreed
in NE and proposed in PJM

MARKET MONITORING AND MARKET POWER MITIGATION
• $1000/MWh general bid cap on spot energy and capacity markets
• Local market power mitigation rules (e.g. NYC, Boston)– Bid caps– RMR contracts– Must-offer restrictions– Interaction with computation of market prices
• Must offer requirements during tight supply conditions
• Ex-post bid/price adjustments• Monitoring of individual market participant behavior
and market performance

PERFORMANCE OF SHORT-TERM SMD WHOLESALE MARKETS
• Short term markets (day-ahead, intra-day adjustment, balancing) function reasonably well within each ISO/RTO– Efficient generator dispatch and higher generator availability– Real fuel-price adjusted wholesale prices have declined slightly along
with average heat rate of dispatched units since 2000– Scarce transmission capacity is allocated efficiently– Locational price differences reflect congestion (and marginal losses in
NE and NY)– Day-ahead, hour-ahead and real time markets are reasonably well
arbitraged, but some “gaming” in constrained-on areas (“load pockets”)
– Operating reserves and energy markets are generally well integrated– Market power is not a significant problem when measured over a
reasonable time period except in load pockets– Market redesign has improved performance but also created
uncertainty for investors

Source: New England ISO

Source: New England ISO

ISO-NE (2006)


Source: New York ISO (2005)

Source: New York ISO (2005)

NENY
PJM
MISO
MISO
MISO
ONT

Source: PJM (2006)

SOURCE: ISO-NE (2006)


Source: ISO New England

DAY-AHEAD PEAK PRICES (2004) $/MWH
0
20
40
60
80
100
120
140
160
180
1/14
/200
4
1/21
/200
4
1/28
/200
4
2/4/
2004
2/11
/200
4
2/18
/200
4
2/25
/200
4
3/3/
2004
3/10
/200
4
3/17
/200
4
3/24
/200
4
3/31
/200
4
4/7/
2004
4/14
/200
4
4/21
/200
4
4/28
/200
4
5/5/
2004
5/12
/200
4
5/19
/200
4
5/26
/200
4
6/2/
2004
MASS HUB NY-G NY-J PJM-W CINERGY

FUEL PRICE EFFECTS
• Large increases in natural gas prices have led to large increases in wholesale prices in many regions– New England market clears on gas and oil fueled
generation 85% of the hours
• Makes it difficult for consumers and policymakers to see performance improvements
• Price increases are creating significant political problems now

U.S. NATURAL GAS WELLHEAD PRICES (1998-2005)
0
2
4
6
8
10
12
Jan-98Ju
l-98
Jan-99Ju
l-99
Jan-00Ju
l-00
Jan-01Ju
l-01
Jan-02Ju
l-02
Jan-03Ju
l-03
Jan-04Ju
l-04
Jan-05Ju
l-05
$/M
CF

Source: PJM (2006)

OPERATING EFFICIENCIES• Nuclear units
– Availability has improved– Non-fuel O&M has declined
• Fossil units– Availability has improved– Heat rates have improved– Non-fuel O&M has declined
• Distribution– O&M costs have declined
• Transmission congestion has increased

PERFORMANCE PROBLEMS WITH SHORT-TERM SMD WHOLESALE
MARKETS• Problems with short term SMD markets
– Energy prices do not rise fast enough or high enough during scarcity conditions
– System operators need more “products” to maintain reliability without undermining market performance (OOM)
– “Seams” issues are slowly being resolved through better integration of markets between RTO/ISOs or by internalization (PJM expansions)
– Discrimination by vertically integrated transmission owners and incomplete unbundling is a continuing problem in some areas
– Demand side participation has been slow to emerge– Market power in load pockets is a continuing problem– Liquidity in forward markets is being restored slowly

LONGER TERM SMD MARKET PERFORMANCE ISSUES
• Policymakers are worried about “shortages” resulting from inadequate investment in generation and transmission
• Energy-only markets do not provide adequate incentives for new investment consistent with reliability rules
• Existing capacity obligations/markets provide partial but inadequate safety valve and are being redesigned
• Transmission planning and investment mechanisms have been slow to evolve and have been side-tracked by FERC’s initial focus on “market driven” transmission investment– Congestion has increased significantly since 1998– Better transmission planning and investment frameworks have been adopted
in NE, PJM and MISO• Reliability planning and investment rules have not been
harmonized with market mechanisms and incentives

NEW U.S. GENERATING CAPACITYYEAR CAPACITY ADDED (MW)1997 4,000
1998 6,500
1999 10,500
2000 23,500
2001 48,000
2002 55,000
2003 50,000
2004 20,000
2005 15,000
230,000 MwSource: EIA

GENERATING CAPACITY UNDER CONSTRUCTIONJanuary 2005
ISO-NE 3 Mw
NY-ISO 3,700 Mw
PJM (traditional) 1,800 Mw
Source: Argus

Annualized 20-year Fixed Cost ~ $70,000/Mw/year
$27,700Average
_______
10,453
18,000
2004
2005
14,5442003
25,6222002
41,6592001
18,8662000
$64,4451999
Net Energy and Ancillary Services Revenue
Year
Theoretical Net Energy and Ancillary Services Revenue For A New Combustion Turbine
Peaking Plant (PJM)$/MW- Year

New York ISO (2005)
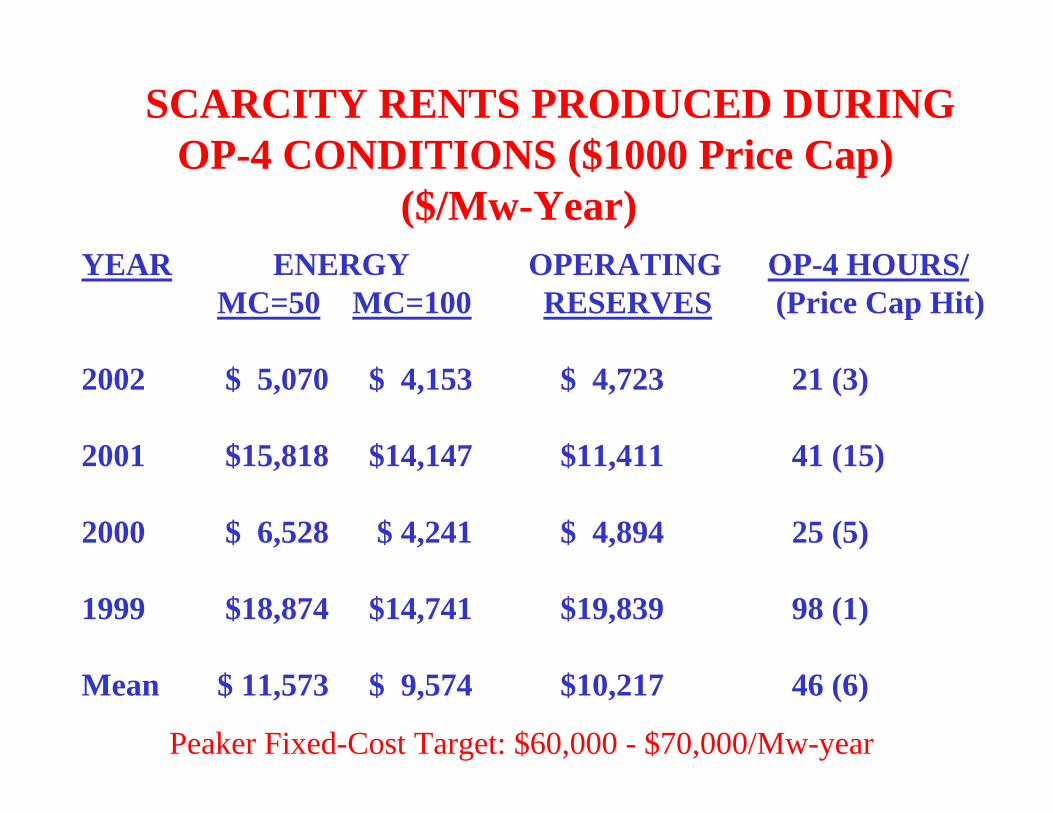
SCARCITY RENTS PRODUCED DURINGOP-4 CONDITIONS ($1000 Price Cap)
($/Mw-Year)YEAR ENERGY OPERATING OP-4 HOURS/
MC=50 MC=100 RESERVES (Price Cap Hit)
2002 $ 5,070 $ 4,153 $ 4,723 21 (3)
2001 $15,818 $14,147 $11,411 41 (15)
2000 $ 6,528 $ 4,241 $ 4,894 25 (5)
1999 $18,874 $14,741 $19,839 98 (1)
Mean $ 11,573 $ 9,574 $10,217 46 (6)
Peaker Fixed-Cost Target: $60,000 - $70,000/Mw-year

MC
D1
D2
D3
D4
IDEALIZED WHOLESALE ELECTRICITY MARKETWITH DEMAND RESPONSE
Price
Quantity
P1
P2
P3
Kmax

MCDemandPrice
Quantity
Pc
Infra-marginal rentshelp to pay for capital costs
Kmax

MC
Dp
Kmax
R
Additional “scarcity rents” help pay capital costs of all units and are especially important for “reserves” that run infrequently
Price
Quantity
Pc
Scarcity rationed by Demand and systemoperator’s procedures
Capacity constraint

MC
D1
D2
D3
D4
WHOLESALE ELECTRICITY MARKETWITHOUT DEMAND RESPONSE
Price
Quantity
P1
P2
P3
Kmax
Non-pricerationing

IDEALIZED “PEAK PERIOD” WHOLESALE MARKET PRICE PATTERNS
$100
$10,000
Operating reserve surplus ReserveDeficient Load shedding/demand rationing
$2000
$15, 000
cp ●
●
$/Mwh
Joskow-Tirole (2005c)
D1 D2 D4D3
K max

FERC (2005)

WHY DON’T “ENERGY-ONLY” MARKETS PROVIDE ADEQUATE PRICE SIGNALS?
• Several factors “truncate” the upper tail of the distribution of spot energy prices– Price caps and other market power mitigation mechanisms
• Where did $1000/Mwh come from?– Prices are too low during operating reserve deficiency conditions for a
variety of challenging implementation problems– Administrative rationing of scarcity rather than demand/price rationing of
scarcity depresses prices– “Reliability” actions ahead of market price response keep prices low– SO dispatch decisions that are not properly reflected in market prices
(OOM; too few “products” to manage the network?)• Consumer valuations may be inconsistent with traditional
reliability criteria– The implicit value of lost load associated with “one-day of a single firm
load curtailment event in ten-year” criterion is very high and inconsistent with reliability of the distribution system (NPCC ~ $150,000/Mwh)
– Administrative rationing increases the cost of outages to consumers

Sorce: ISO New England (2005)

Source: NYISO (2005)

Source: PJM (2006)

Source: NYISO (2005)

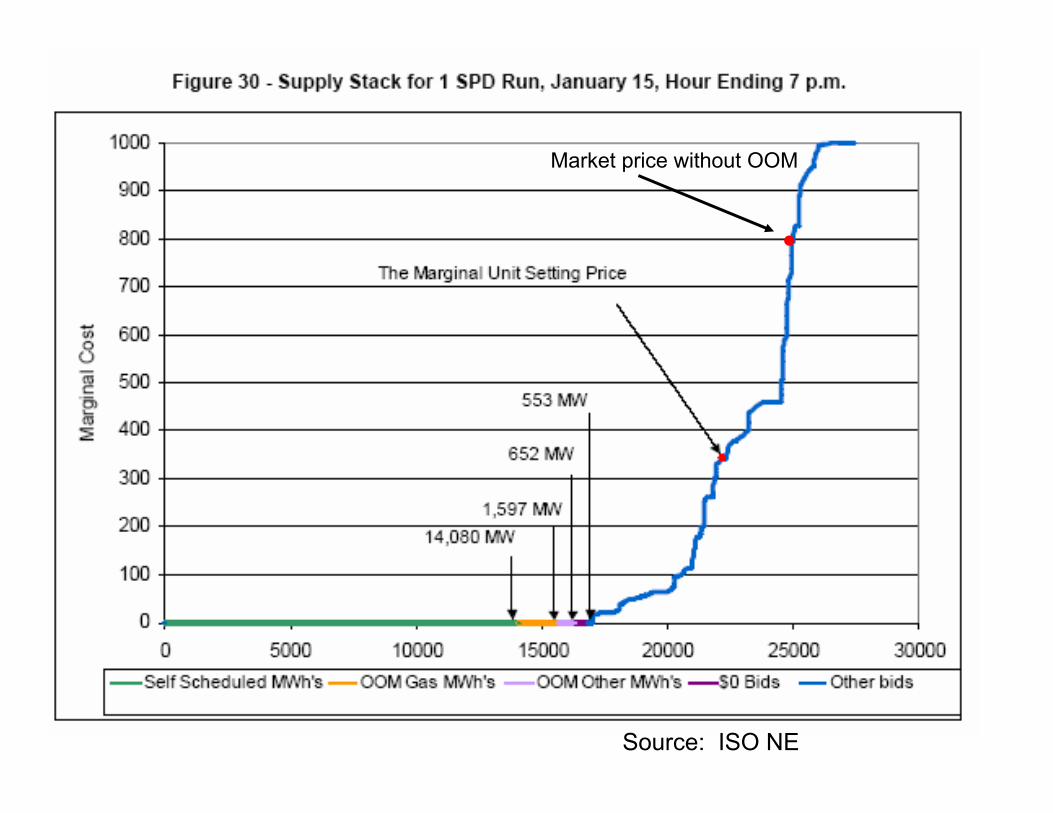
Source: ISO NE
●
Market price without OOM

●
Without OOM
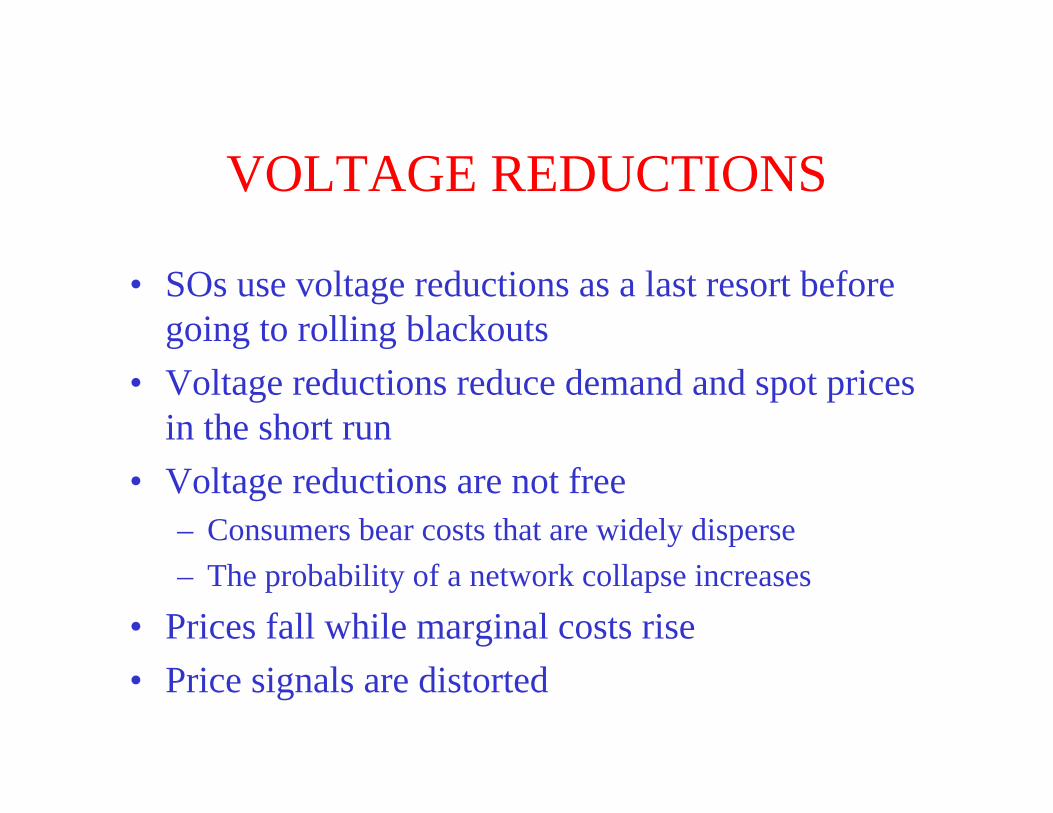
VOLTAGE REDUCTIONS
• SOs use voltage reductions as a last resort before going to rolling blackouts
• Voltage reductions reduce demand and spot prices in the short run
• Voltage reductions are not free – Consumers bear costs that are widely disperse– The probability of a network collapse increases
• Prices fall while marginal costs rise• Price signals are distorted

WHAT TO DO ON WHOLESALE MARKET REFORM?
• Continue to improve the performance of the spot markets for energy and operating reserves– Raise the price caps to reflect reasonable estimates of VOLL– Allow prices to rise faster and higher under operating reserve
deficiency conditions– Minimize use of OOM or define a wider array of wholesale market
products that are fully integrated with markets for related products (e.g. NE Forward reserve market for 10 minute and 30 minute non-spinning reserves)
– Continue efforts to bring active demand side into the spot market for energy and reserves
– Increase harmonization of markets separated by “seams”– Reform inter-area spot transmission pricing rules – Re-evaluate reliability criteria to better reflect consumer valuations

WHAT TO DO ON WHOLESALE MARKET REFORM?
• Implement improved “capacity price” or “capacity obligation” mechanisms as a “safety valve” to produce adequate net revenues to support investment consistent with reliability criteria (target reserve margin and associated capacity)– PJM– NY-ISO– NE-ISO– California-ISO (in process)
• These reforms should mitigate generator investment incentive problems

Source: PJM (2006)

1.037
2 x EBCC
$0.0
$2.0
$4.0
$6.0
$8.0
$10.0
$12.0
$14.0
$16.0
$18.0
$20.0
0.80 0.85 0.90 0.95 1.00 1.05 1.10 1.15 1.20
Surplus/OC
$/kW
-mon
th
EBCC
ISO NEW ENGLAND PROPOSED “CAPACITY” DEMAND CURVE
Source: NSTAR
(2 x CK)
(CK)
K*
PK – peaker rents

Source: NSTAR

TRANSMISSION INVESTMENT• Well functioning wholesale markets need a “robust”
transmission network– Wholesale market performance– Entry of new generation– Market power mitigation
• Assume that transmission investment will be mediated primarily through regulated monopoly TO/SOs– Define clear investment criteria– Implement a consistent transparent “wide area” planning process– Apply a consistent, credible incentive regulation program that
makes desired transmission investment profitable– Apply clear principles for “who pays” that provide good
locational incentives and do not distort short-run generation and trading decisions
– Harmonization and coordination between SO/TO areas evaluation of contingencies, rating of interfaces, planning, investment and cost-sharing
• Merchant investment should be an option but not the foundation for expanding the transmission grid

Source: PJM (2006)


Source: New York ISO (2005)

Source: NCEP (2005)

TRANSMISSION INVESTMENT• The “market driven” merchant model based on
differences in LMPs and allocation of FTRs (property rights) has not worked as a general framework for stimulating transmission investment– Economic issues (e.g. lumpiness)– Inconsistent with implementation of reliability rules – Inconsistent with market power mitigation rules– Does not take account of increased difficulties of relying on
wholesale market mechanisms when there is a lot of congestion (OOM, RMR, etc.)
– Leads to too little investment to support efficient wholesale markets consistent with reliability criteria
– But opportunity for merchant investment is an important safety valve for organizational and regulatory imperfections

TRANSMISSION INVESTMENT• Transmission investment problems are compounded
in the U.S.– Balkanized ownership of transmission– Separation of TO and SO functions– Inconsistencies between federal and state regulation of
transmission prices and siting permits– Lack of clear transmission investment criteria, planning
processes and credible supporting incentive regulation mechanisms
– Inconsistent policies regarding pricing of transmission service and “who pays” for new investment
– NIMBY impediments

2005 U.S. ENERGY POLICY ACT
• Creates new federal government authority to grant permits for “critical” transmission facilities
• Provides more attractive tax treatment for investments in new transmission facilities
• Directs FERC to provide “incentive prices” to encourage transmission investment
• Creates tax incentives to divest transmission facilities

REACTIONS• At least two major new interregional transmission
facilities have been proposed so far in 2006– AEP: 550 mile long 765kv link from West Virginia to
New Jersey– AE: 330 mile long 500kv link from West Virginia to
Maryland
• Several major links between Alberta, Wyoming and California under consideration


BACKGROUND MATERIAL ON RETAIL COMPETITION IN THE
U.S.

STATUS OF RETAIL COMPETITIONAND RESTRUCTURING REFORMS
2004

BUSH V. KERRY 2004

31.022.6Total
______________
59.548.3Large Commercial/Industrial
24.317.0Medium Commercial/Industrial
21.210.8Small Commercial/Industrial
7.42.6Residential
January 2006February 2004
% of Load Served by ESP’s
Customer Type
Retail Choice Began March 1998
Retail Competition in MassachusettsFebruary 2004 and January 2006
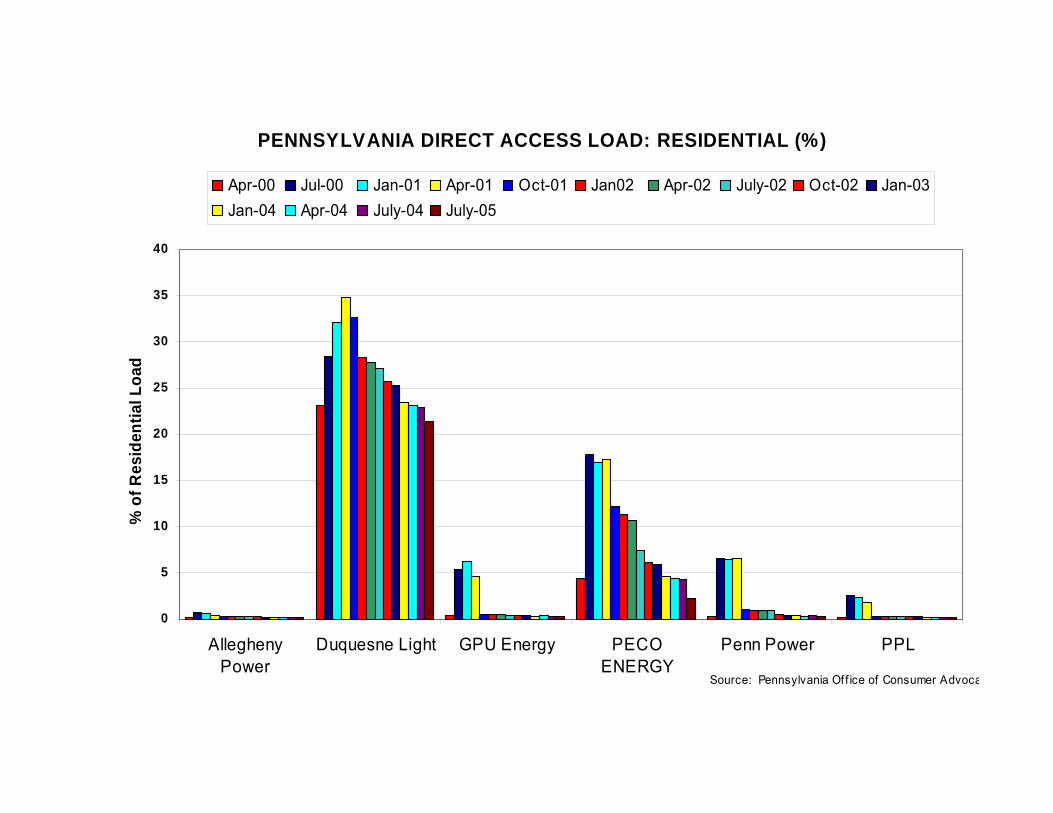
PENNSYLVANIA DIRECT ACCESS LOAD: RESIDENTIAL (%)
0
5
10
15
20
25
30
35
40
AlleghenyPower
Duquesne Light GPU Energy PECOENERGY
Penn Power PPL
% o
f Res
iden
tial L
oad
Apr-00 Jul-00 Jan-01 Apr-01 Oct-01 Jan02 Apr-02 July-02 Oct-02 Jan-03Jan-04 Apr-04 July-04 July-05
Source: Pennsylvania Of f ice of Consumer Advoca

PENNSYLVANIA DIRECT ACCESS LOAD: INDUSTRIAL (%)
0
10
20
30
40
50
60
70
80
AlleghenyPower
Duquesne Light GPU Energy PECOENERGY
Penn Power PPL
% o
f Ind
ustr
ial L
oad
Apr-00 Jul-00 Jan-01 Apr-01 Oct-01 Jan-02 Apr-02 Jul-02 Oct-02Jan-03 Jan-04 Apr-04 July-04 July-05
Source: Pennsylvania Of f ice of Consumer Advoca

Source: Public Utility Commission of Texas
January 2002-June 2005

Source: Public Utility Commission of Texas

Source: Public Utility Commission of Texas


