Design of experiment for diagnosis of thetemperatures in AC motor driveM. Zygmunt*, M. Orkisz*, P. Joerg**, M. Wnek* and J. Nowak*
changeable hysteresis bandsAbstract-the paper describes statistical methods used to * utilization of the inverters thermal capacity for short
diagnose power semiconductors in DTC drive system. Simulation term power increasewas used to train the data-mining model and then trained model These methods are adjusted to the application by estimatingwas used to diagnose temperatures. To select the most significant how much thermal capacity of the drive is used for throughtraining points the design of experiment was applied. . putting power. For full utilization, the power semiconductorsFrom the measurement point of view the challenge is in .
t
predicting the maximum temperature reached by the as the mai source of heat have to be considered durig designsemiconductors (a momentary effect) based on signals that vary and - even better - during commissioning and operationon much larger time scales, e.g., the cooling water temperature. phase.
In this paper we present some requirements regardingcollection and analysis of drive signals for the purpose of Motor [MVWdiagnosing temperatures.
100Index Terms- AC motor drives, Fault diagnosis.
1. INTRODUCTION 50
Voltage source inverter technology has entered the mediumvoltage drives applications in the past decade. Thanks to its 20flexibility and scalability, the new technology is nowestablished in the low and mid power area (1 - 30MW). Fig. 1shows ABB's MV Drives product portfolio, where LCI 10denotes the traditional thyristor based current source inverterand ACS the different families of voltage source inverters. 5Voltage source inverters gain their flexibility by empoying socalled tur-off semiconductors. These are solid state siliconswitches, which can be turned on and off at any time. 2Advanced control schemes operate these switches so as to getperfect control over even the largest electrical motors.One of the most advanced solutions is Direct Torque Control I(DTC). DTC is known from publications [1] [5] as well asfrom academic books [2]. Core ideas ofDTC are: 0t315
K the basic control loop runs every 25 he 1.82o43s34i16 6.06p9 10.0t torque and stator flux are controlled on every control Motor [kV]
cycle Fig. 1 MV AC Drives product portfolioo torque and flux is controlled using hysteresis controlThanks to this hysteresis control, the converter only The idea presented in this paper is to treat the drive as a
switches when required by the motor and its load. Contrary to black box. We can predict the behavior of drive by looking atpredefined switching patterns (e.g. pulse width modulation its inputs and outputs. Having in mind that not all outputs can
PWM), this results in fewer switching actions per second for be measured, we used simulation to model missing signals.the same motor torque quality. We divided model signals into three basic groups: inputs,
Knowing that the number of switchings per second is measured outputs and simulated outputs. Later on there will betraded against available output power, DTC already greatly a description how we have used these groups to train theoptimizes available output power. Several additional control database and how to use the trained database for diagnosisprocedures further increase power utilization, such as: purpose. Diagnosis is done using predictive data-mining
*ABB Corporate Research Center use simulation tools for training the database. In order to beStarowislna 13 A, 31-038 Krakow, Poland
e-al mcj. mutapbbcmsure that simulation results are free from digital simulation**ABB Switzerland Ltd errors we have perormed extensve tests in industrialAustrasse, CH-5300 Turgi, Switzerland environments. Planning of these industrial tests has been done
e-al idcjcg~ cabcmwith the support Of design Of experiment theory.
have high operating parameters like, for example, 4.5 kV. 91mm IGCT is capable of switching current 3800 A with 2500
II. SELECTIVE DATA COLLECTION VDC or 3300 A with 2800 VDC, it has low on-state voltagedrop and low turn-off switching losses, but nevertheless
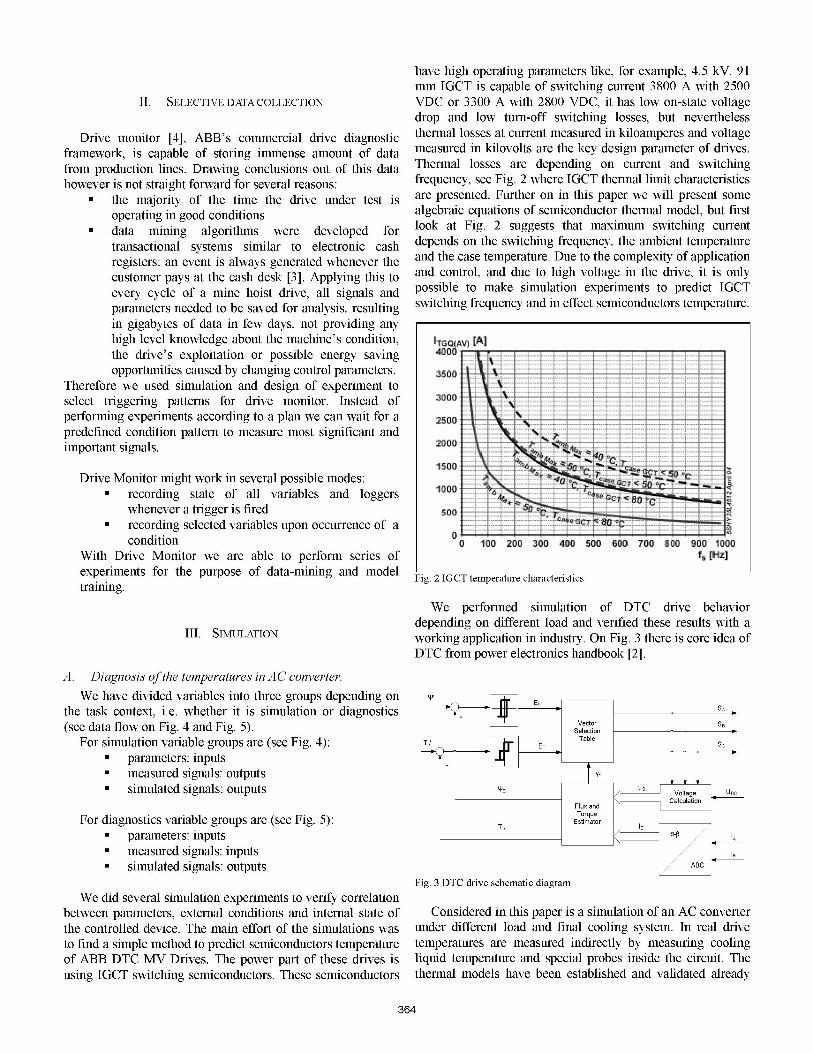
Drive monitor [4], ABB's commercial drive diagnostic thermal losses at current measured in kiloamperes and voltageframework, is capable of storing immense amount of data measured in kilovolts are the key design parameter of drives.from production lines. Drawing conclusions out of this data Thermal losses are depending on current and switchinghowever is not straight forward for several reasons: frequency, see Fig. 2 where IGCT thermal limit characteristics
* the majority of the time the drive under test is are presented. Further on in this paper we will present someoperating in good conditions algebraic equations of semiconductor thermal model, but first
* data mining algorithms were developed for look at Fig. 2 suggests that maximum switching currenttransactional systems similar to electronic cash depends on the switching frequency, the ambient temperatureregisters: an event is always generated whenever the and the case temperature. Due to the complexity of applicationcustomer pays at the cash desk [3]. Applying this to and control, and due to high voltage in the drive, it is onlyevery cycle of a mine hoist drive, all signals and possible to make simulation experiments to predict IGCTparameters needed to be saved for analysis, resulting switching frequency and in effect semiconductors temperature.in gigabytes of data in few days, not providing anyhigh level knowledge about the machine's condition, I T,A, [Althe drive's exploitation or possible energy saving 0ropportunities caused by changing control parameters.
Therefore we used simulation and design of experiment toselect triggering patterns for drive monitor. Instead ofperforming experiments according to a plan we can wait for apredefined condition pattern to measure most significant andimportant signals.
1500
Drive Monitor might work in several possible modes: m* recording state of all variables and loggers
whenever a trigger is fired Soo<* recording selected variables upon occurrence of a
condition X 100 2 3 a a 0 7 X 900 1 NOWith Drive Monitor we are able to perform series of fs [4vexperiments for the purpose of data-mining and model Fig. 2 IGCT temperature characteristicstraining.
We performed simulation of DTC drive behaviordepending on different load and verified these results with a
III. SIMULATION working application in industry. On Fig. 3 there is core idea ofDTC from power electronics handbook [2].
A. Diagnosis ofthe temperatures in AC converter.We have divided variables into three groups depending on W
the task context, i.e. whether it is simulation or diagnosticsc(see data flow on Fig. 4 and Fig. 5). Selection
For simulation variable groups are (see Fig. 4): r Table
Fig. 3 DTC drive schematic diagramWe did several simulation experiments to verify correlation
between parameters, external conditions and internal state of Considered in this paper is a simulation of an AC converterthe controlled device. The main effort of the simulations was under different load and final cooling system. In real driveto find a simple method to predict semiconductors temperature temperatures are measured indirectly by measuring coolingof ABB DTC MV Drives. The power part of these drives is liquid temperature and special probes inside the circuit. Theusing IGCT switching semiconductors. These semiconductors thermal models have been established and validated afready
364
during the development of the drives. For training the wherediagnostics database, temperatures will be simulated and in the Ax: hysteresis bandend simulation results will be compared with working xO: controlled signalindustrial medium voltage installation once more. The target T time constant of the a dynamic system (either electricalof these simulations and measurements is to find the most or electromechanical)significant factors influencing semiconductors temperatures.
MeasuredSignal Temperatures could be approximated with the followingSW AVG i_s thermal model:SW FREQ act
Parameters *4 thermal losses in IGCT depend on switching- Mechanical Torque frequency and switching current
WaterHYST_FACSR SX Siigulation ls * heat transfer is usually calculated using equivalentnO Simulated SignalsT_1GCT_out RC model see Fig. 7, where formulas are
The diagnostic process is similar to the simulation process, Where:but measurement signals are now input to the diagnostic r -hRrCprocess. An example diagnostic process is shown on Fig. 5. tn = Rth(n) Cth(n)Given a set of parameters and measured signals, diagnosticsignals are obtained from the trained model. Single RO-cellMeasuredSignal
SW AVG lsSW FREQ act
Simulated Signals th(l) thin}T_IGCT_out
Parameters Di tics T_diodes_out- Mechanical Torque T -niodesut
HYST FACTORWater TeipereturenO
0+'\ ~~~~Cth(l) Cth(n)Fig. 5 Diagnostics data flow
IV. ALGEBRAIC CALCULATIONAlgebraic calculations will be more deterministic:
switching frequency is based on general hysteresis controller Fig. 7 Equivalent RC modelmodel shown on Fig. 6.Describing the whole system with algebraic formula would
------- be the best solution, but due to some nonlinearities, and theoverall system complexity, instead a dependency network (see
_ ---'\ --<-------------------- Fig. 8) was constructed based on engineering knowledge ofx, the system internals, then this network was verified with the
So switching frequency will be based on formula (1) , having --t
--in mind that there are two hysteresis controllers in DTC: one is lds < tcin f en a alflux controller and second one is torque controller, and eii l pendsconsequently time constants are one electrical and second oneelectromechanical. a e tor a
1+ Ax>, Lqeid12rln Ax(1) Fig. 8 Dependency graph
~1-x)O With algorithmic calculation it was possible to check model
365
in several point to get confidence in diagnostics results. B. Predictive queriesOn trained model one can ask questions about not existing
data, verify missing variable for example one can ask: "whatV. DESIGN OF EXPERIMENT will be IGCT temperature on [Sw Avg Is] =200, [T water]
Engineers usually use experience to select most significant 47" the trained model can give the answer, furthermore it canparameters set, but it is beneficial to use analysis of variability give the answer and tell you what is the confidence level, so(ANOVA) methods to select most significant parameters. the answer will be: temperature will be 65 with confidenceThe design of experiment theory has been applied to select level 92%.most significant points for the training model. Three levelexperiment plan was used for selected parameters. Parameters El UitVew ProctetHd 1)ie6b Dat61566 M6ig Mdeld Ie TIGols W1nd6selection and parameter limits where dynamically changed QU hduring sequential iterations of the experiments. The wholesimulation model has at least 200 input parameters, each Vt Xsimulation experiment takes about 2 minutes execution time a mrining ttre Miidg Is J Mi iFg Model Newer 1rVri Acurac yM, d P d.on a modem PC. Calculating all parameters in 3 level design zwould take 3200 2.6 * 1096 times 2 minutes - a complexityimpossible to handle. Therefore there was initial pre-selection I i t M Cdrnumn Vleof parameters based on engineering knowledge. In this paper l H CALo RXYCALCEn mScal
VI. DATA-MINING IT TWater #7We used simulation results to train the data mining model.
On trained and tested model we can ask predictive queries.Testing model is performed on simulated data and will beperformed in industrial environment. Sl_EC
[Mult aiSka ut-, .7T Ig6;t Dit 3
A. Data-mining model _F_n33 MuJlt a6ka Out-
SQL server 2005 analysis services supports following NURA FRED7ITjI iDINJ3(SEi ECI 20 AkS g 5w ]AVij l sl-Z
data-mining algorithms: 47 A 7LT Wate±D AS t
* neural networks* naive bayes networks
jC:edi C64ka6g Reu1s sE ak ILM
* clustering ReAdy Ln7 CoIl2 Chl2 INS
* decision trees Fig. 9 Predictive Query* time series* sequence clustering.
On the trained model one can perform several tasks: FII Ed Vi w Prt 8dlud Debug B3t3be Mining Md' Te_ l,* predict a discrete attribute T| o s Win6do wC6mrifniU l,* predict a continuous attribute k_ i* predict a sequence _h* find a group of common items in transaction. I Mlt 6kt GUt Ldrnm MDei n] Multa6 Outdim [M -.X..
Detail description which algorithm is suitable for each task a mlii Mininilog Mo, Mininirg MO Mininhg Ac. Miig ocan be found in SQL Server 2005 literature [6]. la <
Depending on the performed task, an appropriate T_algorithm should be used. In our work we get interesting 64.5966854967 0O.927921711results in predicting continuous attribute using neural 7
networks. SQL Server provides flexible framework where _ utrained model is accessed with high level query language !-hiding algorithms complexity from the programmer. During T
F~~~k6ft ~~Ln 7 Col 12 Chi I2the designing of additional diagnostics packages we will use Read-different tasks like predicting diagnostics sequences or Fig.. 10 Predictive query result
predicting discrete attributes where different algorithms might VII. BLACK BOX APPROACH VERSUS SIMULATIONbe most appropriate.We used data-mining process in the following scenario: If we have enough time for the simulation in real-time it
* train the model on simulated data from multiple would be most precise while simulator we have is very preciseruns ofthe model and was many time tested against real drive. Problem is that
* verify model on simulated data (or on real data). we would like to have answers in seconds how much further* perform diagnostics predictive queries on the can we overload semiconductors without compromising safety
trained model. limits. Further on we would like to somehow predict future or
366
avoid points where will be now safe way to reduce load simulation data. In some circumstances the most probablewithout risk of overheating semiconductors. Summarizing load profile can be associated with drive's internal variables,black box approach looks interesting for the following and then in consequence algorithms can be trained forreasons: predicting load profiles and later on effectively predict load in
* well trained model will give the answer fast and extreme conditions.better then simple protection system; Using selected method we where able to design high level
* with design of experiment we can capture most asset optimization system. It can be tuned for selectedimportant parameters influencing reaction of the applications - e.g. metal rolling - on a system level where thesystem, which in case of the simulation can be load diagram is known in advance for the selected application.simply not taken into account; This will reduce the risk of stopping the drive during work
* we will answer not only what to do to avoid too under extreme conditions.big temperature, but also what to do to avoid"point of no return" see Fig. 11, means situation IX. APENDIXAthat reducing parameters will not guarantee safe Selected variables used in example diagnostics case study:functioning of the system.
HYCALC_fnom_scale Hysteresis scale factorj i E Legend hI T water Cooling water temperature
Allowed zone _
4t Conditionally allowed zone 5W avg_1s Switchig average frequencyPower 0 Overheat zone 1 second
sw_freq_act Switching frequency actualT_igct out IGCT temperatureT_diodes_out Diodes temperatureT_np_diodes_out Null point clamping diodes
temperature
X. ACKNOWLEDGMENT
10 20 50 F[Hz] The authors gratefully acknowledge the contributions ofH. Burzanowska, P. Ciechanowski and P. Bohren for support
Fig. 11 Allowed load to this work.
XI. REFERENCESVIII. CONCLUSIONS [1] Tiitinen, P. and Surandra, M. (1996).The next generation motor control
Due to the complexity of a DTC-controlled MV AC drive, method, DTC direct torque control. Power Electronics, Drives andfinding exact dependencies between system parameters and Energy Systems for Industrial Growth, 1996., Proceedings of the 1996finding exact dependencies between system parameters and International Conference on 1, 37--43 vol.1.output temperatures was possible only with simulation, but [2] Bose, B.,K. (2001). Modern Power Electronics andAC Drives. Prenticealgebraic formulas and dependency graph were helpful for Hall PTR.more efficient planning of simulation experiments. The [3] Ong K.-L , Zhang Z , Ng W.-K , Lim E.-P (2005). Agents and stream
data mining: a new perspective. Intelligent Systems, IEEE 20(3) 60--67.proposed methodology can be used for other diagnostic [4] Wnek, M., Nowak, J., Orkisz, M., Budyn, M. and Legnani, S.procedures, it allows making smart tabularization of non (2006).Efficient use of Process and Diagnostic Data for the Lifecycledirectly measurable signals and even it gives good background Management.3rd World Congress on Maintenance, Basel, Switzerland,
for planning expriments on physial objects. [5]73-78.for planning experiments on physical objects. [5] Blaabjerg, F., Kazmierkowski, M. P., Zelecehowski, M., Swierczynski,In industrial environment it is not possible to measure D. and Kolomyjski, W. (2005).Design and comparison direct torque
semiconductor temperatures directly, but combining real control techniques for induction motors. Power Electronics andmeasurements withcomutersimlatinwareaApplications, 2005 European Conference on, 9 pp.+.measurements with computer simulation we are able to draw [6] Tang Z , Maclennan J (2005). Data Mining with SQL Server 2005.
conclusions about possible peek overloading of the AC drive Wiley.and allow to utilize more power out of the device without therisk of overheating semiconductors. The behavior of the drivehas also been tested under some conditions where analyticalformulas apply, in order to have more general methods thanstatistics and data-mining.
Diagnostics via predictive query is just one database selecttherefore it is much faster than online simulation. It gives thepossibility to have nearly real-time predictive diagnostics.Further on it will be fine tuned and trained on the real object,so it will contain more accurate knowledge than only
367
6
XII. BIOGRAPHIESMaciej Zygmunt was born in Krak6w, Poland.
He received M.Sc. and Ph.D. in Computer Sciencefrom University of Mining and Metallurgy inKrakow in 1989 and 1999 respectively. 1989-2000he worked at University of Mining and Metallurgyas Research and Teaching Assistant. Since 2000 heis with ABB Corporate Research working mainly inthe area of condition monitoring, diagnostics, andmanufacturing.
Michal Orkisz was born in Krak6w, Poland. Hereceived B.S. degrees in Computer Science, Physicsand Mathematics at M.I.T. in 1988, and Ph.D. inCondensed Matter Physics in 1994 at M.I.T. He hasworked in Gel Sciences, Inc., Genome Therapeutics,and, since 1998, in ABB's Corporate Research,where he has dealt with condition monitoring, riskanalysis and computer vision.
Pieder Jorg (member IEEE) was born inDomat/Ems, Switzerland. He received his M.Sc.degree in electrical engineering from ETH Zurich in1995. 1995 - 2002 he worked in the area of powerelectronics research at ABB Corporate Research.Since 2002 he is with ABB Medium VoltageDrives, dealing with product development of largemedium voltage motor drives.
Maciej Wnek was born in Krakow, Poland onDecember 05th 1965. He received M.Sc. and Ph.D.In Physics from Jagiellonian University inKrakow in 1989 and 1993 respectively in the area ofsolid state matter. 1992-1995 temporarily heworked at Tohoku University, Sendai, Japan andUniversita La Sapienza Rome, Italy in the area ofliquid crystals displays (LCD). Since 1997 he iswith ABB Corporate Research working mainly inthe area of condition monitoring, diagnostics, andasset management.
Jaroslaw Nowak was born in Warsaw, Poland inJune 24th 1974. He received M.Sc. in AutomaticControl and Robotics from Warsaw University ofTechnology in 1999 in the area of industrial processdiagnostics. Since 2000 he is with ABB CorporateResearch working mainly in the area of conditionmonitoring and software development.


![Full page photo print · Carbaryl Carbofuran Methomyl Oxarnyl Glyphosate Abbreviations/ References: ML Minimum Leve' LRL RL ug/L ug/L uglL uglL ug/L ug]L ugJL ug[L uglL uglL uglL](https://static.documents.pub/doc/80x56/5ec442420abc4702252a1ce3/full-page-photo-print-carbaryl-carbofuran-methomyl-oxarnyl-glyphosate-abbreviations.jpg)


