55
DOE/NETL-401/012111

DOE/NETL-2010/???? DOE/NETL-401/012111

National Energy Technology Laboratory Office of Program Performance and Benefits
2
January 2012
Detailed Coal Specifications
Quality Guidelines for Energy System Studies
Disclaimer
This report was prepared as an account of work sponsored by an agency of the United States
Government. Neither the United States Government nor any agency thereof, nor any of their
employees, makes any warranty, express or implied, or assumes any legal liability or
responsibility for the accuracy, completeness, or usefulness of any information, apparatus,
product, or process disclosed, or represents that its use would not infringe privately owned rights.
Reference therein to any specific commercial product, process, or service by trade name,
trademark, manufacturer, or otherwise does not necessarily constitute or imply its endorsement,
recommendation, or favoring by the United States Government or any agency thereof. The
views and opinions of authors expressed therein do not necessarily state or reflect those of the
United States Government or any agency thereof.
National Energy Technology Laboratory Office of Program Performance and Benefits
3
January 2012
Detailed Coal Specifications
Quality Guidelines for Energy System Studies
Detailed Coal Specifications
DOE/NETL-401/012111
Final Report
January 2012
NETL Contact:
Mike Matuszewski
General Engineer
Office of Program Planning and Analysis
National Energy Technology Laboratory
www.netl.doe.gov

National Energy Technology Laboratory Office of Program Performance and Benefits
4
January 2012
Detailed Coal Specifications
Quality Guidelines for Energy System Studies
Prepared by:
Energy Sector Planning and Analysis (ESPA)
Vladimir Vaysman
WorleyParsons Group, Inc.
Yixin Lu
WorleyParsons Group, Inc.
DOE Contract Number DE-FE0004001
National Energy Technology Laboratory Office of Program Performance and Benefits
5
January 2012
Detailed Coal Specifications
Quality Guidelines for Energy System Studies
Acknowledgments
This report was prepared by Energy Sector Planning and Analysis (ESPA) for the United States
Department of Energy (DOE), National Energy Technology Laboratory (NETL). This work was
completed under DOE NETL Contract Number DE-FE0004001. This work was performed
under ESPA Task 341.03.01.
The authors wish to acknowledge the excellent guidance, contributions, and cooperation of the
NETL staff, particularly:
Mike Matuszewski, NETL Technical Project Monitor

National Energy Technology Laboratory Office of Program Performance and Benefits
6
January 2012
Detailed Coal Specifications
Quality Guidelines for Energy System Studies
This page intentionally left blank.
National Energy Technology Laboratory Office of Program Performance and Benefits
7
January 2012
Detailed Coal Specifications
Quality Guidelines for Energy System Studies
Table of Contents
1 Objective .....................................................................................................................................11
2 Approach .....................................................................................................................................11
3 The U.S. Coal Industry ...............................................................................................................12
3.1 Coal Historical and Future Demand ........................................................................................12
3.2 Coal Deposits ...........................................................................................................................14
3.3 Coal Production .......................................................................................................................15
3.4 Coal Production Forecast .........................................................................................................18
3.5 Coal Cleaning...........................................................................................................................19
3.5.1 Nature of Coal Impurities .....................................................................................................20
3.5.2 Cleaning Methods .................................................................................................................20
3.5.3 Special Treatment Methods ..................................................................................................21
4 Definition of Coal Specifications................................................................................................22
4.1 ASTM Classification by Rank .................................................................................................22
4.2 Proximate Analysis ..................................................................................................................22
4.3 Ultimate Analysis.....................................................................................................................22
4.4 Higher and Lower Heating Value ............................................................................................22
4.5 Grindability ..............................................................................................................................24
4.6 Ash Properties ..........................................................................................................................24
4.7 Ash Fusion Characteristics ......................................................................................................24
4.8 Trace Elements.........................................................................................................................24
4.9 Coal Moisture...........................................................................................................................24
5 Coal Types Used in the Previous System Studies ......................................................................25
6 Typical Market Quality of Selected Coals ..................................................................................29
7 Recommended Coal Analysis .....................................................................................................31
7.1 Low Volatile Bituminous .........................................................................................................31
7.2 Medium Volatile Bituminous ..................................................................................................34
7.3 High Volatile Bituminous ........................................................................................................37
7.4 “Super-Compliance” Subbituminous PRB Coal ......................................................................42
7.5 Subbituminous .........................................................................................................................45
7.6 North Dakota Lignite ...............................................................................................................48
National Energy Technology Laboratory Office of Program Performance and Benefits
8
January 2012
Detailed Coal Specifications
Quality Guidelines for Energy System Studies
7.7 Texas Lignite ...........................................................................................................................51
8 Revision Control .........................................................................................................................53
9 References ...................................................................................................................................54

National Energy Technology Laboratory Office of Program Performance and Benefits
9
January 2012
Detailed Coal Specifications
Quality Guidelines for Energy System Studies
List of Exhibits
Exhibit 3-1 U.S. primary energy consumption, 1980-2035 (quadrillion Btu) ............................. 12
Exhibit 3-2 U.S. electric power industry net generation by fuel, 2008 ....................................... 13
Exhibit 3-3 Electricity generation by fuel, 2008 and 2035 (billion kilowatt-hours) ................... 13
Exhibit 3-4 U.S. coal fields .......................................................................................................... 15
Exhibit 3-5 U.S. coal production versus demand, 1949-2009 ..................................................... 15
Exhibit 3-6 Coal production by coal rank and number of mines ................................................. 16
Exhibit 3-7 2009 coal production by coal-production region ...................................................... 17
Exhibit 3-8 Historical coal production by coal rank and location ............................................... 18
Exhibit 3-9 Current and projected coal production by region (quadrillion Btu) ......................... 19
Exhibit 4-1 ASTM D388 classification of coals by rank ............................................................. 23
Exhibit 5-1 Coal types used in past NETL system studies .......................................................... 25
Exhibit 6-1 Form 423 summary of 2001-2003 coal quality by coal type .................................... 30
Exhibit 6-2 Average quality of commercially shipped coal by state per Utah Geological Survey
............................................................................................................................................... 30
Exhibit 7-1 Low volatile bituminous coal ................................................................................... 31
Exhibit 7-2 Medium volatile bituminous coal ............................................................................. 34
Exhibit 7-3 High volatile bituminous coal analysis (Pittsburgh No. 8) ....................................... 37
Exhibit 7-4 High volatile bituminous coal analysis (Illinois No. 6) ............................................ 39
Exhibit 7-5 “Super-compliance” subbituminous coal analysis .................................................... 42
Exhibit 7-6 Subbituminous coal from PRB field ......................................................................... 45
Exhibit 7-7 North Dakota lignite analysis (high-sodium) ............................................................ 48
Exhibit 7-8 Texas lignite analysis (low-sodium) ......................................................................... 51
National Energy Technology Laboratory Office of Program Performance and Benefits
10
January 2012
Detailed Coal Specifications
Quality Guidelines for Energy System Studies
Acronyms and Abbreviations
APFBC Advanced pressurized fluidized
bed combustion
ASTM American Society for Testing and
Materials
CO2 Carbon dioxide
CTL Coal-to-liquids
DOE Department of Energy
EIA Energy Information
Administration
EPA Environmental Protection Agency
FERC Federal Energy Regulatory
Commission
FT Fluid temperature
HAP Hazardous air pollutants
HHV Higher heating value
HRSG Heat recovery steam generator
HT Hemispherical temperature
HV High volatile
ICR Information collection request
IGCC Integrated gasification combined
cycle
IT Initial deformation temperature
LHV Lower heating value
ND North Dakota
NETL National Energy Technology
Laboratory
NYPA New York Power Authority
ppm Parts per million
PRB Powder River Basin
QGESS Quality Guidelines for Energy
System Studies
R&D Research and development
SCPC Supercritical pulverized coal
SNG Synthetic natural gas
ST Softening temperature
T&S Transport and storage
TX Texas
U.S. United States
National Energy Technology Laboratory Office of Program Performance and Benefits
11
January 2012
Detailed Coal Specifications
Quality Guidelines for Energy System Studies
1 Objective
Specifications for selected feedstocks that are commonly found in the National Energy
Technology Laboratory (NETL)-sponsored energy system studies are summarized in NETL’s
“Quality Guidelines for Energy System Studies” (QGESS). The purpose of this companion
section is to document default QGESS specifications for coal compositions reflecting a spectrum
of seven coal ranks:
North Dakota (ND) lignite
Texas (TX) lignite
“super-compliance” subbituminous, ~0.2 percent sulfur (as-received weight percent)
subbituminous, > 0.5 percent sulfur (as-received weight percent)
high volatile bituminous
medium volatile bituminous
low volatile bituminous
2 Approach
The QGESS coal specification selection process was based on the following criteria:
1. Recommendations for QGESS were selected from the coal analyses most commonly used
in the previous system studies to maximize the comparability of future system studies
with those done in the past. A list was compiled of the coal types used in studies of coal-
fueled energy conversion systems. Based on the frequency of coal types in this listing,
one coal type was recommended as the QGESS default for each of the seven coal ranks.
2. Selected default coal specifications are, as much as possible, representative of the typical
coal quality in the United States (U.S.) commercial market (i.e., as procured by the power
plants in the U.S.). Some coal analyses in this current version of QGESS were obtained
from the Argonne Premium Coal Sample Program that report as-mined coal properties.
[1] The as-mined analyses are potentially different from as-shipped (or as-received) due
to possible coal beneficiation at the mine prior to shipment (coal preparation at the mine
is described in Section 3.5 of this report). Since the purpose of these coal analyses is to
provide a consistent basis for energy system modeling, this distinction (as-mined versus
as-shipped composition) is not a primary concern. Other coal composition data sources
are documented in Section 7.
3. If there were compelling reasons to do so, a coal type other than that most frequently
used in past studies could be recommended. For example, the most frequently used
Pittsburgh No. 8 coal composition was similar to the currently used Illinois No. 6
composition. Therefore, an alternative Pittsburgh No. 8 composition was selected to
provide a greater distinction between it and Illinois No. 6 coal.

National Energy Technology Laboratory Office of Program Performance and Benefits
12
January 2012
Detailed Coal Specifications
Quality Guidelines for Energy System Studies
3 The U.S. Coal Industry
This section provides background information about the U.S. coal industry, including coal
reserves, current and future coal demand, coal production, and coal cleaning methods at the
mine. Information on characteristics of U.S. coal, transportation, and utilization at power plants
can be found in the Department of Energy (DOE) NETL report, “Overview of U.S. Coal Supply
and Infrastructure.” [2]
3.1 Coal Historical and Future Demand
Coal has been a major energy source for more than a century in the U.S. In the last five decades,
coal production grew steadily from 434 million short tons in 1960, to 1,073 million short tons in
2009. According to the Energy Information Administration’s (EIA) Annual Energy Outlook
2010, although the long-term, 25-year outlook presents uncertainties -- resulting from the
difficulty of accurately predicting future costs of producing and transporting coal, economic
growth, world oil prices, and future greenhouse gas regulations -- coal demand is expected to be
relatively steady (Exhibit 3-1). [3]
Exhibit 3-1 U.S. primary energy consumption, 1980-2035 (quadrillion Btu)
Source: U.S. EIA
In the last decade, natural gas utilization went through a solid growth period and has increased its
share of the electricity market from 13.7 percent in 1997, to 21.4 percent in 2008. Renewable
energy sources also have increased their share of total net power generation in recent years.
Meanwhile, coal’s share of total net generation continued its downward trend, accounting for
48.2 percent in 2008 as compared to 52.8 percent in 1997. Nevertheless, coal continues to be the
most important source of energy for the U.S. power industry (Exhibit 3-2). [4]

National Energy Technology Laboratory Office of Program Performance and Benefits
13
January 2012
Detailed Coal Specifications
Quality Guidelines for Energy System Studies
Exhibit 3-2 U.S. electric power industry net generation by fuel, 2008
Source: U.S. EIA
According to the EIA Annual Energy Outlook for 2010, in the next 25 years coal will retain its
largest share position of total electricity generation, while most new capacity additions will be
natural gas and renewable energy sources (Exhibit 3-3). [3]
Exhibit 3-3 Electricity generation by fuel, 2008 and 2035 (billion kilowatt-hours)
Source: U.S. EIA

National Energy Technology Laboratory Office of Program Performance and Benefits
14
January 2012
Detailed Coal Specifications
Quality Guidelines for Energy System Studies
3.2 Coal Deposits
In the U.S., coal is found in 37 states, with 6 states containing about 75 percent of recoverable
reserves: Montana (28.7 percent), Wyoming (14.9 percent), Illinois (14.6 percent), West Virginia
(6.7 percent), Kentucky (5.6 percent), and Pennsylvania (4.4 percent). [5]
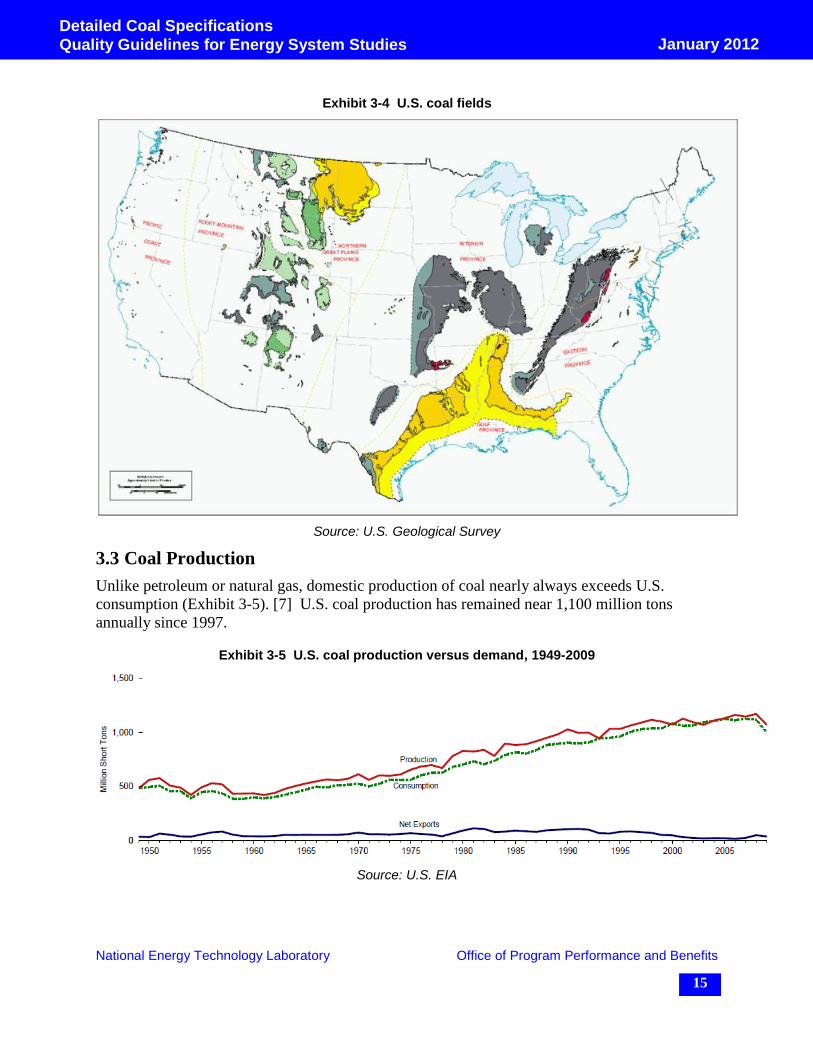
The U.S. Geological Survey has divided the coal-bearing areas of the contiguous U.S. into six
main provinces: Eastern, Interior, Gulf, Northern Great Plains, Rocky Mountain, and Pacific.
The provinces are subdivided into coal regions, coal fields, and coal districts. The U.S. coal
fields, by coal rank and geographical location, are presented in Exhibit 3-4. [6]
The Eastern province includes anthracite regions of Pennsylvania and Rhode Island, the Atlantic
Coast region, and the Appalachian region. The Appalachian region is of most importance in the
Eastern province. It is one of the great coal producing regions in the U.S., and contains the
largest deposits of high-grade bituminous coal. The Appalachian region includes portions of
Pennsylvania, West Virginia, Ohio, Maryland, Kentucky, Virginia, Tennessee, and Alabama.
The Interior province includes all bituminous coal in the Mississippi Valley area and the coal
fields of Texas and Michigan. This province is subdivided into the Northern region consisting of
the coal fields of Michigan; the Eastern region (a.k.a. Illinois basin) comprising fields of Illinois,
Indiana, and western Kentucky; the Western region including the coal fields of Iowa, Missouri,
Nebraska, Kansas, Arkansas, Oklahoma; and the Southwestern region of Texas. The bituminous
coals of the Interior province are of lower rank and higher sulfur content as compared to the
Eastern province. Much of the low sulfur, chlorine, and sodium content surface-mineable coal in
the Illinois basin has been mined. The remaining coal with high chlorine content will have to be
deep-mined.
The Gulf province consists of the Mississippi region, including the lignite fields of Alabama,
Mississippi, and Louisiana; and the Texas region that comprises the lignite fields of Arkansas
and Texas. Coals found in the Gulf province are of the lowest quality in the U.S., with heating
value as low as 4,000 Btu/lb, and moisture content as high as 55 percent.
The Northern Great Plains province includes all coal fields east of the Rocky Mountains,
encompassing lignite fields of both Dakotas, bituminous and subbituminous fields of northern
Wyoming, and northern and eastern Montana. This province includes immense deposits of low-
sulfur, near-surface, and thick subbituminous coal seams of the Powder River Basin (PRB).
The Rocky Mountain province comprises the coal fields of mountainous areas of Montana,
Wyoming, Utah, Colorado, and New Mexico. The deposits in this province cover a range of coal
ranks.
The Pacific province is largely confined to the State of Washington, and ranges in rank from
subbituminous through bituminous to anthracite.
National Energy Technology Laboratory Office of Program Performance and Benefits
15
January 2012
Detailed Coal Specifications
Quality Guidelines for Energy System Studies
Exhibit 3-4 U.S. coal fields
Source: U.S. Geological Survey
3.3 Coal Production
Unlike petroleum or natural gas, domestic production of coal nearly always exceeds U.S.
consumption (Exhibit 3-5). [7] U.S. coal production has remained near 1,100 million tons
annually since 1997.
Exhibit 3-5 U.S. coal production versus demand, 1949-2009
Source: U.S. EIA
National Energy Technology Laboratory Office of Program Performance and Benefits
16
January 2012
Detailed Coal Specifications
Quality Guidelines for Energy System Studies
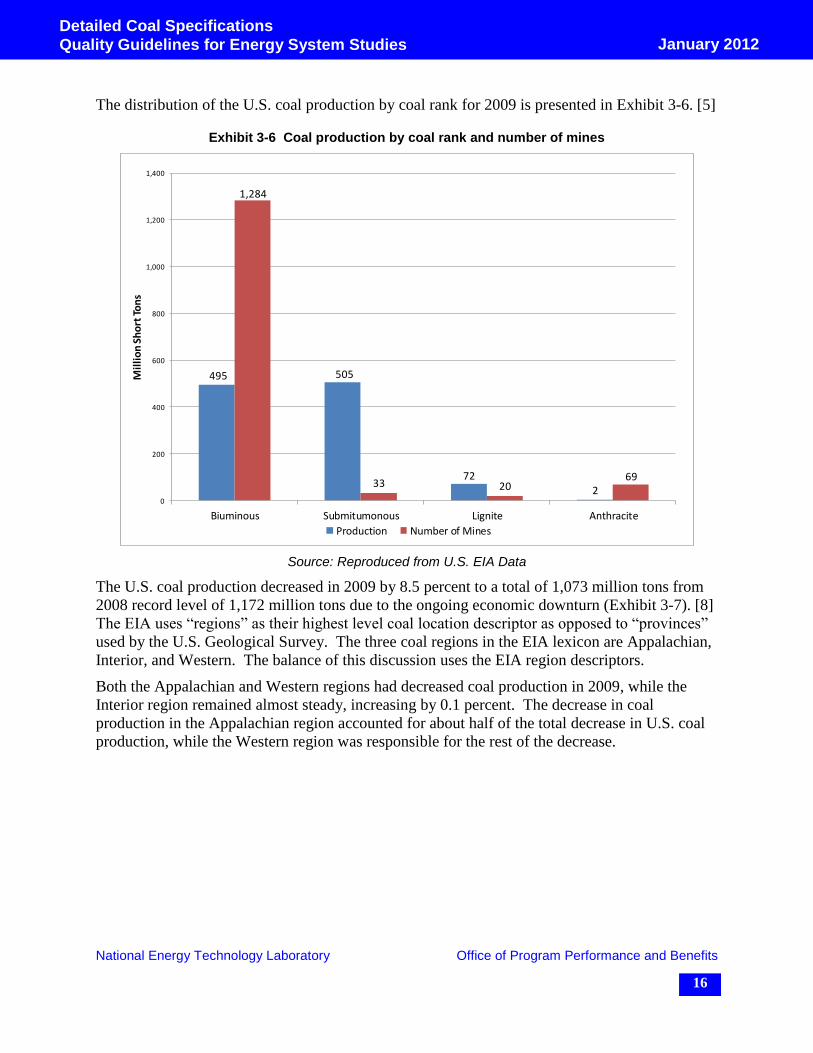
The distribution of the U.S. coal production by coal rank for 2009 is presented in Exhibit 3-6. [5]
Exhibit 3-6 Coal production by coal rank and number of mines
Source: Reproduced from U.S. EIA Data
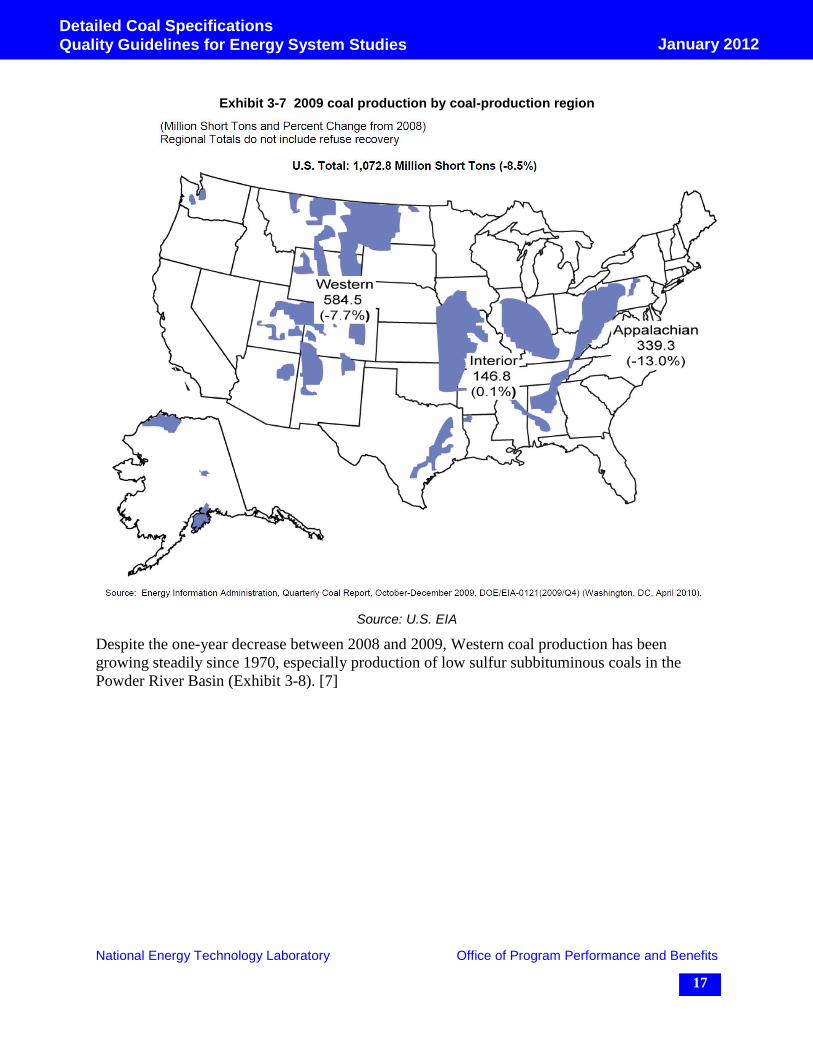
The U.S. coal production decreased in 2009 by 8.5 percent to a total of 1,073 million tons from
2008 record level of 1,172 million tons due to the ongoing economic downturn (Exhibit 3-7). [8]
The EIA uses “regions” as their highest level coal location descriptor as opposed to “provinces”
used by the U.S. Geological Survey. The three coal regions in the EIA lexicon are Appalachian,
Interior, and Western. The balance of this discussion uses the EIA region descriptors.
Both the Appalachian and Western regions had decreased coal production in 2009, while the
Interior region remained almost steady, increasing by 0.1 percent. The decrease in coal
production in the Appalachian region accounted for about half of the total decrease in U.S. coal
production, while the Western region was responsible for the rest of the decrease.
495 505
72
2
1,284
33 2069
0
200
400
600
800
1,000
1,200
1,400
Biuminous Submitumonous Lignite Anthracite
Mil
lio
n S
ho
rt T
on
s
Production Number of Mines
National Energy Technology Laboratory Office of Program Performance and Benefits
17
January 2012
Detailed Coal Specifications
Quality Guidelines for Energy System Studies
Exhibit 3-7 2009 coal production by coal-production region
Source: U.S. EIA
Despite the one-year decrease between 2008 and 2009, Western coal production has been
growing steadily since 1970, especially production of low sulfur subbituminous coals in the
Powder River Basin (Exhibit 3-8). [7]

National Energy Technology Laboratory Office of Program Performance and Benefits
18
January 2012
Detailed Coal Specifications
Quality Guidelines for Energy System Studies
Exhibit 3-8 Historical coal production by coal rank and location
Source: U.S. EIA
3.4 Coal Production Forecast
According to the EIA Annual Energy Outlook 2010 forecast, increase of coal use for electricity
generation, along with projected startup of several coal-to-liquid (CTL) plants, should result in
coal production growth averaging 0.2 percent per year from 2008 through 2035. This is
significantly less than the 0.9 percent average growth rate for U.S. coal production during the
1980 to 2008 period. It is also expected that increasingly tight pollutant emissions caps will lead
to more use of low-sulfur coal from the Western mines. Western coal production, which has
grown steadily since 1970, is projected to continue to increase through 2035, but at a much
slower rate than in the past (Exhibit 3-9). [3] Both new and existing electric power plants are
projected to be major contributors to growth in demand for Western coal. Supplies of low-cost
National Energy Technology Laboratory Office of Program Performance and Benefits
19
January 2012
Detailed Coal Specifications
Quality Guidelines for Energy System Studies
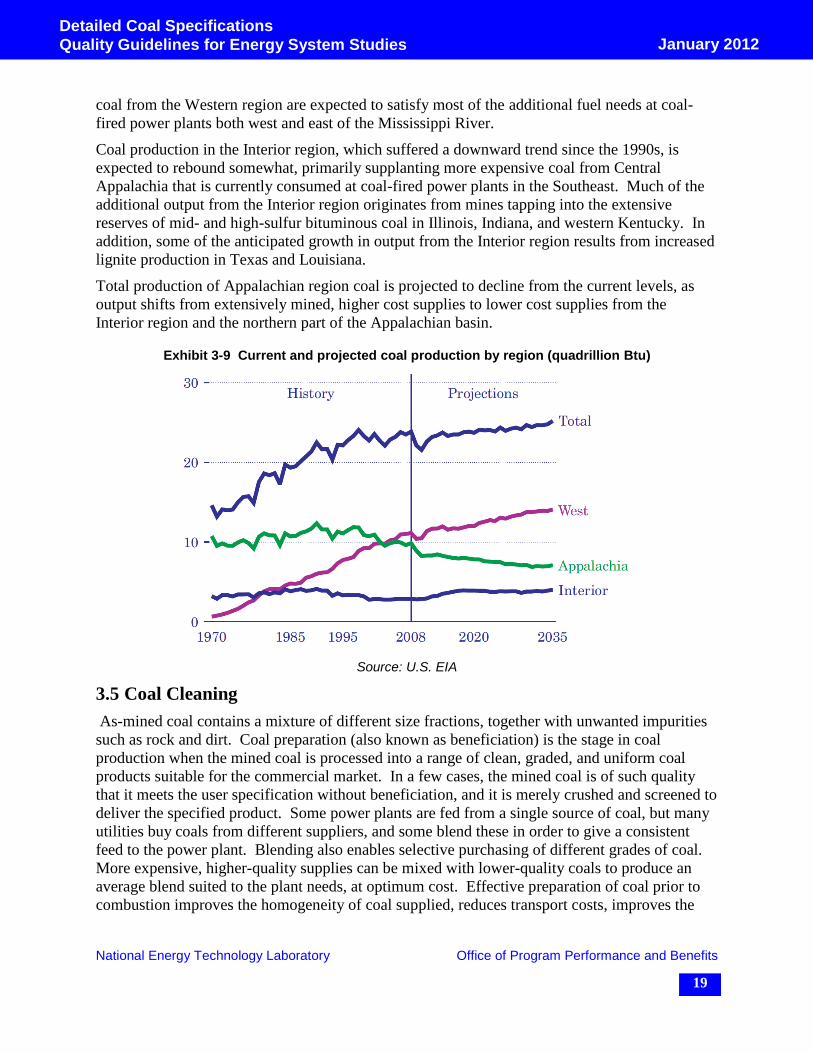
coal from the Western region are expected to satisfy most of the additional fuel needs at coal-
fired power plants both west and east of the Mississippi River.
Coal production in the Interior region, which suffered a downward trend since the 1990s, is
expected to rebound somewhat, primarily supplanting more expensive coal from Central
Appalachia that is currently consumed at coal-fired power plants in the Southeast. Much of the
additional output from the Interior region originates from mines tapping into the extensive
reserves of mid- and high-sulfur bituminous coal in Illinois, Indiana, and western Kentucky. In
addition, some of the anticipated growth in output from the Interior region results from increased
lignite production in Texas and Louisiana.
Total production of Appalachian region coal is projected to decline from the current levels, as
output shifts from extensively mined, higher cost supplies to lower cost supplies from the
Interior region and the northern part of the Appalachian basin.
Exhibit 3-9 Current and projected coal production by region (quadrillion Btu)
Source: U.S. EIA
3.5 Coal Cleaning
As-mined coal contains a mixture of different size fractions, together with unwanted impurities
such as rock and dirt. Coal preparation (also known as beneficiation) is the stage in coal
production when the mined coal is processed into a range of clean, graded, and uniform coal
products suitable for the commercial market. In a few cases, the mined coal is of such quality
that it meets the user specification without beneficiation, and it is merely crushed and screened to
deliver the specified product. Some power plants are fed from a single source of coal, but many
utilities buy coals from different suppliers, and some blend these in order to give a consistent
feed to the power plant. Blending also enables selective purchasing of different grades of coal.
More expensive, higher-quality supplies can be mixed with lower-quality coals to produce an
average blend suited to the plant needs, at optimum cost. Effective preparation of coal prior to
combustion improves the homogeneity of coal supplied, reduces transport costs, improves the

National Energy Technology Laboratory Office of Program Performance and Benefits
20
January 2012
Detailed Coal Specifications
Quality Guidelines for Energy System Studies
utilization efficiency, produces less ash for disposal at the power plant, and may reduce the
emissions of oxides of sulfur.
Few coal seams are clean enough for coal to be shipped without cleaning. Consumers typically
require coal of consistent quality. To prepare fuel conforming to customer specifications,
practically all large, mechanized mines have preparation plants in which coal is sized and
cleaned to the extent economically justified.
3.5.1 Nature of Coal Impurities
Coal is a heterogeneous mixture of organic and inorganic materials. Coal properties may differ
not only from seam to seam, but also depending upon the coal location and elevation within the
same seam. Coal impurities are typically classified as inherent and removable.
The inherent impurities in ash-forming mineral matter are organically combined with the coal.
Approximately 2 percent of total coal ash-forming material is considered inherent mineral
matter. [9] The bulk of the coal mineral matter is interstratified material which settles into the
coal deposit as a result of water penetration during and after coal formation. Some of the mineral
matter can be introduced into the coal during a mechanized mining process as a result of
undesirable mixing with the overburden material. This is less likely for the larger and better strip
mines that do not mine coal near the outcrop. The inherent impurities cannot be economically
separated from the coal during coal preparation while removable impurities can be segregated
and removed using cleaning methods.
Sulfur is present in the coal in three forms – pyritic sulfur (sulfur combined with iron in the form
of pyrite), organic sulfur (sulfur combined with carbon in coal), and sulfate sulfur (sulfur in the
form of calcium or iron sulfate). The latter usually does not exceed 0.1 percent of total sulfur.
[9] The larger pieces of pyritic sulfur can be removed with mineral matter using coal cleaning
methods. Fines of the pyritic sulfur and organic sulfur cannot be economically removed using
modern cleaning methods.
3.5.2 Cleaning Methods
Most mechanical cleaning processes depend on differences in specific gravity of coal and
impurities to facilitate separation. Typically, most common solid impurities are heavier than
coal and can be removed by gravity concentration. The cleaning process may be wet or dry, with
either water or air used as a medium. In general, wet processes are more efficient; however,
determination of which process is more suitable for a specific coal depends upon the coal
washability characteristics, i.e., properties of the various specific gravity fractions and the
variations of these properties with coal sizing. The most frequently used wet methods are [9]:
Jigs - Pulsating currents of water pass through a bed of coal resting on a
screen plate. The upward flow, called “pulsion stroke,” fluidizes the
coal, and the subsequent downward flow, called “suction stroke,”
settles the bed. While coal particles are in suspension they are
separated into fractions and diverted into separate streams.
Dense-Media Method - Coal is immersed in a medium with specific gravity intermediate
between that of coal and impurities. The impurities sink, and the coal
floats.

National Energy Technology Laboratory Office of Program Performance and Benefits
21
January 2012
Detailed Coal Specifications
Quality Guidelines for Energy System Studies
Concentration tables - This method is primarily used for washing fine coal (50 mesh sizing)
Only a small percentage of the total coal is cleaned by pneumatic (dry) process in the U.S. It is
typically applied to the coal less than ½ inch in size. The raw coal may be screened upstream
from the cleaning plant with larger fractions directed to the wet process and smaller to the
pneumatic process. In pneumatic processes, air is blown upward through the bed of coal resting
on a moving table equipped with riffles. The air flow segregates coal and impurities by bringing
particles with lower specific gravity (mostly coal) to the top of the bed. Low gravity particles
then move across the table in direction perpendicular to the riffles. The heavy particles (mostly
impurities) settle in the riffles and move along the riffles, discharging at the end opposite to the
coal feed. Fines suspended in the air are recovered in cyclone separators and/or bag filters.
3.5.3 Special Treatment Methods
De-dusting - De-dusting is the process of coal fines removal using air separation. It
is often utilized to remove fines ahead of wet cleaning. De-dusting is
accomplished by passing an air stream through the coal with
subsequent fine coal recovery in cyclone separators and bag filters.
The fines may be added to clean coal (if low in ash) or disposed of with
the impurities.
Dewatering - Larger size coal (above 3/8 inch) can be dewatered using gravity with
special hoppers and bins with drainage, screen conveyors, or perforated
bucket elevators.
When fine sizes need to be dried, or lower moisture content is required,
mechanical dewatering or thermal drying is utilized. Mechanical
dewatering devices include shaker or vibrating screens, centrifuges, and
thickening equipment. Thermal dryers are of fluidized bed, rotary,
cascade, reciprocating screen, and conveyer type. All thermal dryers
require dust collection to recover fines, which may be centrifugal
cyclones, bag filters, or water-spray systems. Thermal drying is
predominantly used for obtaining low moisture content, fine-size coal.
Dust proofing - Dust proofing is accomplished by spraying oil and calcium chloride on
streams of coal falling from chutes or loading booms. When coal is
sprayed by oil, the film causes dust particles to adhere to the larger
pieces or to agglomerate into larger lumps. About 13 percent of
cleaned bituminous coal is sprayed by oil. [9] Sometimes coal is
sprayed with oil and calcium chloride. Calcium chloride absorbs
moisture from the air, providing a wet surface to which dust adheres.
Freeze proofing - Freeze proofing is used to prevent coal from freezing during
transportation and storage. The most commonly used method is spray
oil application, the same as dust proofing. Sometimes the railroad car
hoppers are sprayed to ease coal unloading at the final destination.
Less often freeze proofing is accomplished by thermal drying the fine
coal, especially for high moisture content, low-rank coal.

National Energy Technology Laboratory Office of Program Performance and Benefits
22
January 2012
Detailed Coal Specifications
Quality Guidelines for Energy System Studies
4 Definition of Coal Specifications
4.1 ASTM Classification by Rank
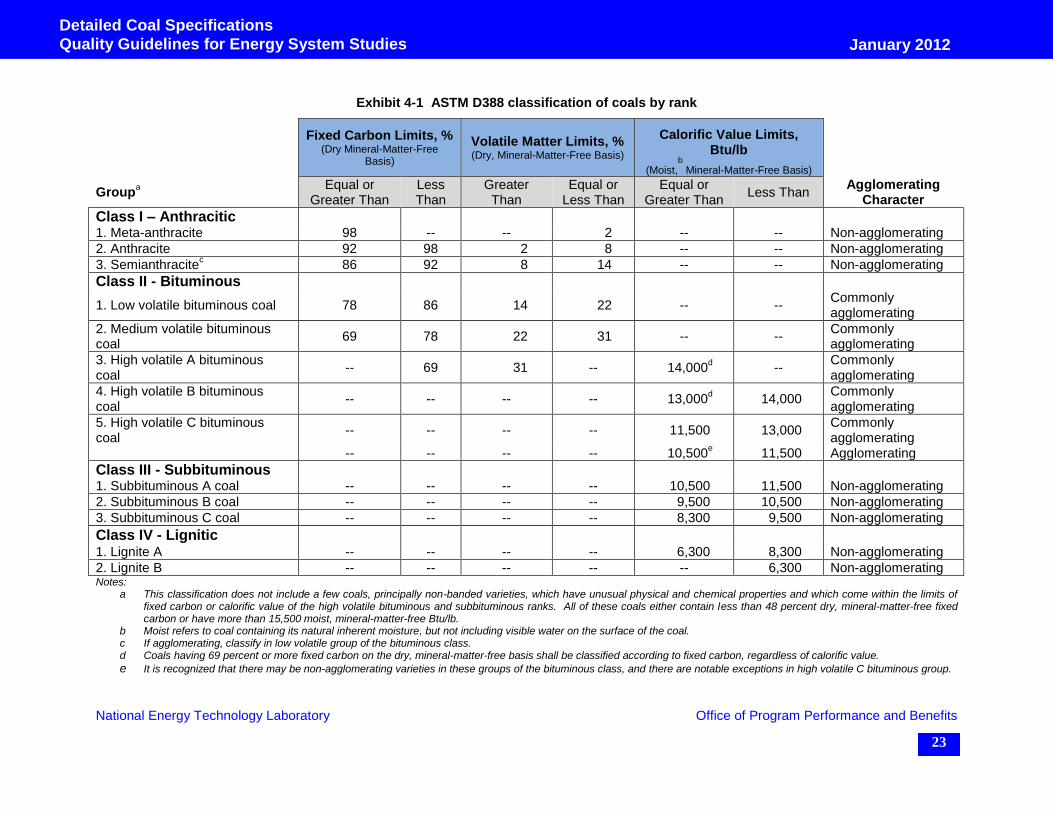
Coal is a heterogeneous substance, with wide variability in composition. A system used for
classifying coals was established by the American Society for Testing and Materials (ASTM),
Exhibit 4-1. [9] The ASTM D388 classification system uses volatile matter and fixed carbon
content in the proximate analysis along with the heating value of the coal to establish the coal
rank. This ranking system provides basic information that assists in making judgments about the
combustion properties and the commercial uses of the various types of coal.
4.2 Proximate Analysis
The proximate analysis (percent by weight) gives information on coal behavior when it is heated,
e.g., how much coal goes off as gas, tar, and vapor, and how much remains as fixed carbon. The
proximate analysis is described by ASTM Standard D3172. This determines volatile matter,
fixed carbon, and ash. The quantity of volatile matter indicates ease of ignition of a coal and
whether supplemental flame stabilization is needed.
4.3 Ultimate Analysis
The ultimate analysis (percent by weight) gives the coal composition by constituent elements.
The ultimate analysis is described by ASTM Standard D3176. This establishes the quantities of
carbon, hydrogen, nitrogen, and sulfur content in the coal, as well as the calculated oxygen
content. The ultimate analysis is utilized for combustion calculations.
4.4 Higher and Lower Heating Value
The heat of combustion is usually determined by direct calorimeter measurements of the heat
evolved. Heating value is either reported as 'higher heating value’ (HHV), or as 'lower heating
value' (LHV). The heating value of a fuel is a measure of the sensible energy released during
combustion when both the fuel and combustion air are brought to standard conditions, the
combustion reactions occur, and the products of combustion are brought back to standard
conditions.
Heating value can be defined in one of two ways depending on the convention chosen for
reporting how hydrogen energy in the fuel is released. The water vapor produced holds the heat
of vaporization of the water. The HHV, also called gross heating value, of a fuel includes the
heat released if all of the water vapor in the combustion products were condensed, releasing the
heat of vaporization of the water in the combustion products. This is typically the situation that
exists when a bomb calorimeter is used to measure the heat of combustion. The procedures for
measuring HHV are described in ASTM Standard D5865. In the U.S., HHV is generally used in
the coal power industry.
The LHV is the second definition frequently used to measure energy released during combustion.
The LHV of a fuel is the heat released if all of the water vapor in the combustion products
remained as a vapor, retaining the heat of vaporization of the water in the combustion products.
In the U.S., LHV is generally used in the natural-gas and oil-fueled gas turbine industry, while in
Europe LHV is typically utilized for all power industry applications.
National Energy Technology Laboratory Office of Program Performance and Benefits
23
January 2012
Detailed Coal Specifications
Quality Guidelines for Energy System Studies
Exhibit 4-1 ASTM D388 classification of coals by rank
Fixed Carbon Limits, %
(Dry Mineral-Matter-Free Basis)
Volatile Matter Limits, % (Dry, Mineral-Matter-Free Basis)
Calorific Value Limits, Btu/lb
(Moist,b Mineral-Matter-Free Basis)
Groupa
Equal or Greater Than
Less Than
Greater Than
Equal or Less Than
Equal or Greater Than
Less Than Agglomerating
Character
Class I – Anthracitic 1. Meta-anthracite 98 -- -- 2 -- -- Non-agglomerating
2. Anthracite 92 98 2 8 -- -- Non-agglomerating
3. Semianthracitec 86 92 8 14 -- -- Non-agglomerating
Class II - Bituminous
1. Low volatile bituminous coal 78 86 14 22 -- -- Commonly agglomerating
2. Medium volatile bituminous coal
69 78 22 31 -- -- Commonly agglomerating
3. High volatile A bituminous coal
-- 69 31 -- 14,000d --
Commonly agglomerating
4. High volatile B bituminous coal
-- -- -- -- 13,000d 14,000
Commonly agglomerating
5. High volatile C bituminous coal
-- -- -- -- 11,500 13,000 Commonly agglomerating
-- -- -- -- 10,500e 11,500 Agglomerating
Class III - Subbituminous 1. Subbituminous A coal -- -- -- -- 10,500 11,500 Non-agglomerating
2. Subbituminous B coal -- -- -- -- 9,500 10,500 Non-agglomerating
3. Subbituminous C coal -- -- -- -- 8,300 9,500 Non-agglomerating
Class IV - Lignitic
1. Lignite A -- -- -- -- 6,300 8,300 Non-agglomerating
2. Lignite B -- -- -- -- -- 6,300 Non-agglomerating Notes:
a This classification does not include a few coals, principally non-banded varieties, which have unusual physical and chemical properties and which come within the limits of fixed carbon or calorific value of the high volatile bituminous and subbituminous ranks. All of these coals either contain less than 48 percent dry, mineral-matter-free fixed carbon or have more than 15,500 moist, mineral-matter-free Btu/lb.
b Moist refers to coal containing its natural inherent moisture, but not including visible water on the surface of the coal. c If agglomerating, classify in low volatile group of the bituminous class. d Coals having 69 percent or more fixed carbon on the dry, mineral-matter-free basis shall be classified according to fixed carbon, regardless of calorific value.
e It is recognized that there may be non-agglomerating varieties in these groups of the bituminous class, and there are notable exceptions in high volatile C bituminous group.
National Energy Technology Laboratory Office of Program Performance and Benefits
24
January 2012
Detailed Coal Specifications
Quality Guidelines for Energy System Studies
4.5 Grindability
Grindability is an empirical measurement of the relative ease with which a coal can be reduced in
size, and is described by ASTM Standard D409.
4.6 Ash Properties
A successful boiler design requires proper sizing and arrangement of the furnace and tube
surfaces. A first priority in any design is to minimize slagging and ash deposition problems.
The slagging and the fouling potential of the coal directly affect furnace design, having a
significant influence on tubing spacing. Ash analyses of the expected fuel source are performed
before undertaking any boiler design, using ash prepared according to ASTM D3174.
The slagging potential of ash is the tendency to form fused deposits on tube surfaces
exposed to high temperature radiant heat.
The fouling potential is the tendency of ash to bond to lower temperature convection
surfaces.
4.7 Ash Fusion Characteristics
Many comparisons of chemical makeup have been developed to analyze the behavior of ash in
boilers. Empirical testing of ash-fusion temperature is still the most basic way of predicting
slagging and fouling-fusion temperature. This testing is prescribed in ASTM D1857. The test
consists of observing the gradual thermal deformation (melting) of a pyramid-shaped ash sample
and recording the initial deformation temperature (IT), softening temperature (ST),
hemispherical temperature (HT), and fluid temperature (FT). The stages at which these
temperatures are recorded are generally measured under reducing and oxidizing conditions.
4.8 Trace Elements
All coals contain trace elements, albeit in very small quantities, that are measured in parts per
million. Typically, most trace elements in coal occur in abundances not greatly different from
those in rock making up the crust of the earth, with the exception of boron, chlorine, and
selenium. The 1990 Amendments to the Clean Air Act listed a number of minor and trace
elements that commonly occur in coal as “hazardous air pollutants” (HAP).
Mercury is the element of greatest immediate concern because it is emitted from the plant stack,
and limiting legislation is due to be finalized in November, 2011. Deposits containing high
enough concentrations of arsenic and selenium to be of concern have been observed starting in
low temperature gas cooling all the way through the boiler or heat recovery steam generator
(HRSG). Air emissions of lead have been regulated by some states.
4.9 Coal Moisture
All coals contain moisture. Total moisture of a coal is comprised of surface moisture and
inherent moisture. Inherent moisture is a quality of the coal seam in its natural state of
deposition and includes only that water considered to be part of the deposit, and not that moisture
which exists as a surface addition. Surface moisture is the water from external sources, such as
weather or coal washing processes. The standard test method for total moisture in coal is defined
in ASTM D3302.

National Energy Technology Laboratory Office of Program Performance and Benefits
25
January 2012
Detailed Coal Specifications
Quality Guidelines for Energy System Studies
The moisture content of coals varies widely by rank. In the high-rank, low volatile bituminous
coals it is frequently under 5 percent. High volatile bituminous coals may have as much as 12
percent moisture and lignite, and as high as 45 percent as mined. [10] Coal as mined, shipped,
and received may also contain varying amounts of water due to gain or loss in coal treatment
processes, transportation, and storage. Depending on moisture in a coal and the technology
applied, the coal may need to be dried before use. For instance, coals entering dry-feed gasifiers
typically need to be dried to achieve appropriate gasification temperature and reduce system
thermal loss.
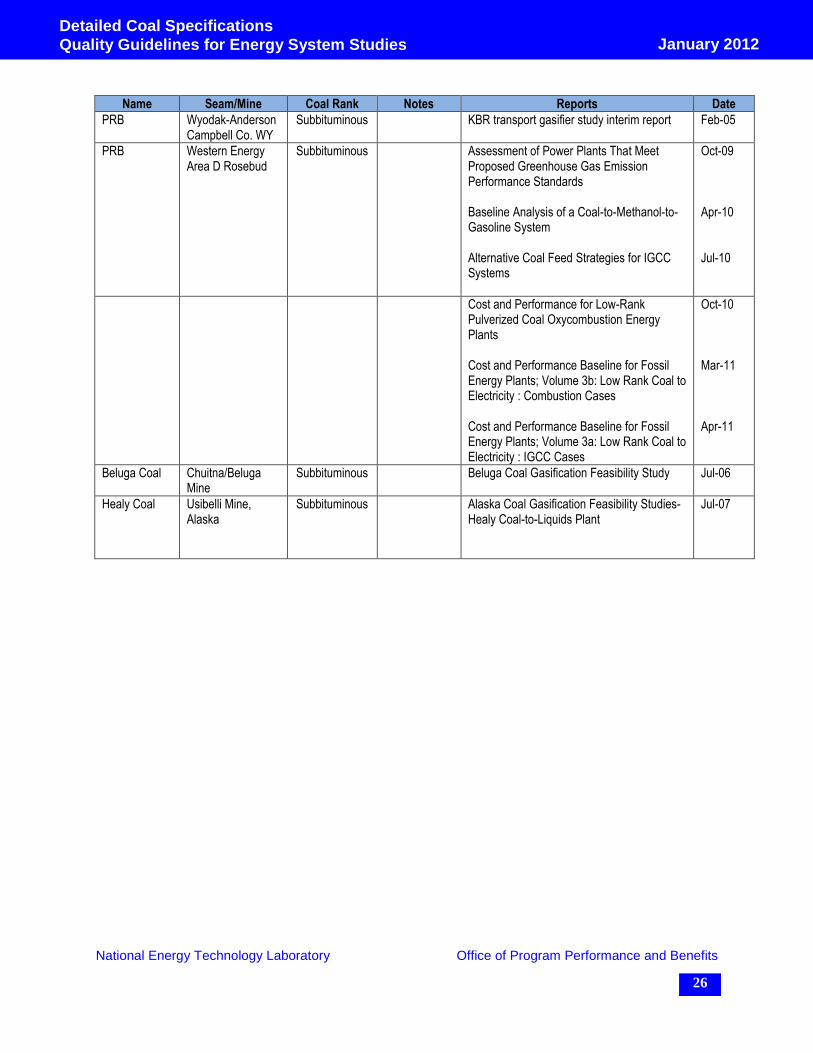
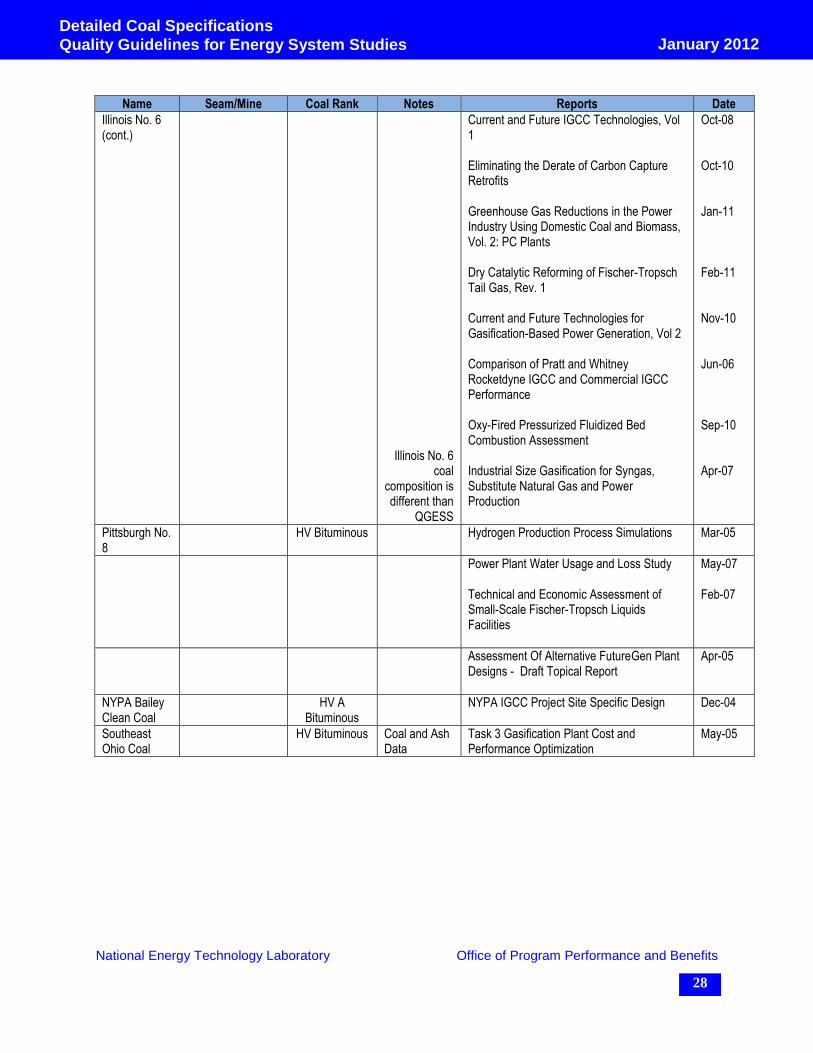
5 Coal Types Used in the Previous System Studies
A list of coal types utilized in the energy system studies completed since 2004 is tabulated in
Exhibit 5-1. High volatile bituminous coals (such as Illinois No. 6 and Pittsburgh No. 8) have
been utilized in multiple studies. Subbituminous coals from the Powder River Basin as well as
North Dakota lignite are also relatively well represented. There were no system studies
completed since 2004 that considered low volatile bituminous, medium volatile bituminous or
“super-compliance” subbituminous coal as a design fuel.
While most of the records include a proximate analysis, an ultimate analysis, and coal heating
value, a few also contain ash composition and fusion temperatures, grindability index, and trace
element composition.
Exhibit 5-1 Coal types used in past NETL system studies
Name Seam/Mine Coal Rank Notes Reports Date
ND Lignite Freedom-Beulah, ND
Lignite High Sodium Repowering with APFBC Series: Leland Olds Cost and Performance for Low-Rank Pulverized Coal Oxycombustion Energy Plants Cost and Performance Baseline for Fossil Energy Plants; Volume 2: Coal to Synthetic Natural Gas and Ammonia Cost and Performance Baseline for Fossil Energy Plants; Volume 3b: Low Rank Coal to Electricity : Combustion Cases
Cost and Performance Baseline for Fossil Energy Plants; Volume 3a: Low Rank Coal to Electricity : IGCC Cases
Mar-04 Oct-10 Oct-10 Mar-11
Apr-11
TX Lignite Wilcox Lignite Lignite Low Sodium
Coal analysis different than
first study
Polygeneration of SNG, Hydrogen, Power, and Carbon Dioxide from Texas Lignite Assessment of Alternative FutureGen Plant Designs, Case 7.1.3
Dec-04 Mar-06
PRB Dry Fork, WY Subbituminous Repowering with APFBC Series: Leland Olds Mar-04
PRB Wyodak Subbituminous Hydrogen Production Process Simulations Mar-05
National Energy Technology Laboratory Office of Program Performance and Benefits
26
January 2012
Detailed Coal Specifications
Quality Guidelines for Energy System Studies
Name Seam/Mine Coal Rank Notes Reports Date
PRB Wyodak-Anderson Campbell Co. WY
Subbituminous KBR transport gasifier study interim report Feb-05
PRB Western Energy Area D Rosebud
Subbituminous Assessment of Power Plants That Meet Proposed Greenhouse Gas Emission Performance Standards Baseline Analysis of a Coal-to-Methanol-to-Gasoline System Alternative Coal Feed Strategies for IGCC Systems
Oct-09 Apr-10 Jul-10
Cost and Performance for Low-Rank Pulverized Coal Oxycombustion Energy Plants Cost and Performance Baseline for Fossil Energy Plants; Volume 3b: Low Rank Coal to Electricity : Combustion Cases Cost and Performance Baseline for Fossil Energy Plants; Volume 3a: Low Rank Coal to Electricity : IGCC Cases
Oct-10 Mar-11 Apr-11
Beluga Coal Chuitna/Beluga Mine
Subbituminous Beluga Coal Gasification Feasibility Study Jul-06
Healy Coal Usibelli Mine, Alaska
Subbituminous Alaska Coal Gasification Feasibility Studies-Healy Coal-to-Liquids Plant
Jul-07

National Energy Technology Laboratory Office of Program Performance and Benefits
27
January 2012
Detailed Coal Specifications
Quality Guidelines for Energy System Studies
Name Seam/Mine Coal Rank Notes Reports Date
Illinois No. 6
Old Ben No. 26 Mine
HV Bituminous
Coal and Trace Mineral Data
Baseline Technical and Economic Assessment of a Commercial Scale Fischer-Tropsch Liquids Facility Pulverized Coal Oxycombustion Power Plants Evaluation of Alternate Water Gas Shift Configurations for IGCC Systems Systems Analysis of an Integrated Gasification Fuel Cell Combined Cycle Cost and Performance Baseline for Fossil Energy Plants, Volume 4: Coal-to-Fischer-Tropsch Liquids Using a Dry-Feed Gasifier Cost and Performance Baseline for Fossil Energy Plants, Volume 1: Bituminous Coal and Natural Gas to Electricity, Revision 2 CO2 Capture Ready Coal Power Plants Assessment of Hydrogen Production with CO2 Capture, Vol 1: Baseline State-of-the Art Plants Alternative Coal Feed Strategies for IGCC Systems Production of High Purity Hydrogen from Domestic Coal: Assessing the Techno-Economic Impact of Emerging Technologies Life Cycle Analysis: Existing Pulverized Coal Power Plant Life Cycle Analysis: Integrated Gasification Combined Cycle (IGCC) Power Plant Life Cycle Analysis: Supercritical Pulverized Coal (SCPC) Power Plant Advancing Oxycombustion Technology for Bituminous Coal Power Plants: An R&D Guide Preliminary Results of the Modified Benfield Process for CO2 Capture from Syngas Ionic Liquids-Based Absorption Process for Warm CO2 Capture from Syngas
Apr-07 Aug-08 Aug-09 Aug-09 Sep-10 Nov-10 Apr-08 Aug-10 Jul-10 Aug-10 Sep-10 Sep-10 Dec-10 Feb-10 Mar-10 Oct-10
National Energy Technology Laboratory Office of Program Performance and Benefits
28
January 2012
Detailed Coal Specifications
Quality Guidelines for Energy System Studies
Name Seam/Mine Coal Rank Notes Reports Date
Illinois No. 6 (cont.)
Illinois No. 6 coal
composition is different than
QGESS
Current and Future IGCC Technologies, Vol 1 Eliminating the Derate of Carbon Capture Retrofits Greenhouse Gas Reductions in the Power Industry Using Domestic Coal and Biomass, Vol. 2: PC Plants Dry Catalytic Reforming of Fischer-Tropsch Tail Gas, Rev. 1 Current and Future Technologies for Gasification-Based Power Generation, Vol 2 Comparison of Pratt and Whitney Rocketdyne IGCC and Commercial IGCC Performance Oxy-Fired Pressurized Fluidized Bed Combustion Assessment Industrial Size Gasification for Syngas, Substitute Natural Gas and Power Production
Oct-08 Oct-10 Jan-11 Feb-11 Nov-10 Jun-06 Sep-10 Apr-07
Pittsburgh No. 8
HV Bituminous Hydrogen Production Process Simulations
Mar-05
Power Plant Water Usage and Loss Study Technical and Economic Assessment of Small-Scale Fischer-Tropsch Liquids Facilities
May-07 Feb-07
Assessment Of Alternative FutureGen Plant Designs - Draft Topical Report
Apr-05
NYPA Bailey Clean Coal
HV A Bituminous
NYPA IGCC Project Site Specific Design Dec-04
Southeast Ohio Coal
HV Bituminous Coal and Ash Data
Task 3 Gasification Plant Cost and Performance Optimization
May-05

National Energy Technology Laboratory Office of Program Performance and Benefits
29
January 2012
Detailed Coal Specifications
Quality Guidelines for Energy System Studies
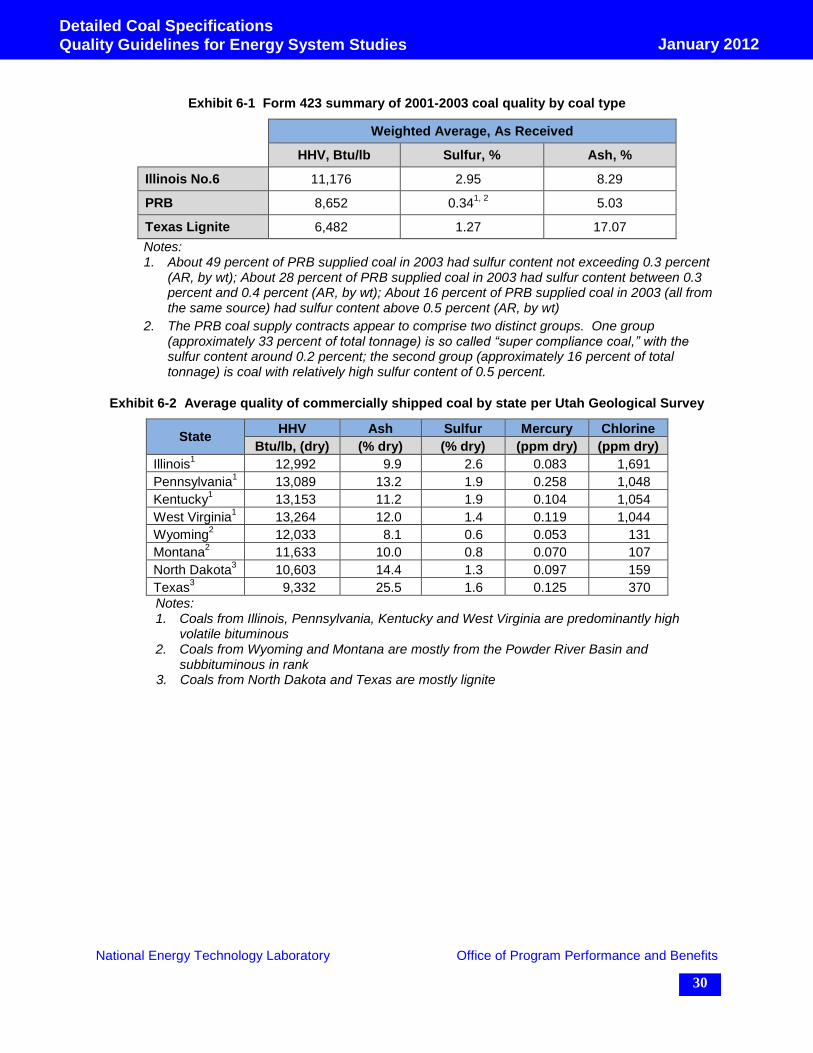
6 Typical Market Quality of Selected Coals
According to the Keystone Coal Industry Manual [11], mine operators generally hold recent coal
quality data confidential. Publicly available coal-quality data are 20 or more years old, and 72
percent of these data are from areas that are now mined out. Several public sources of typical
market coal quality are utilized in this report. However, those sources do not yield consistent
mine and/or seam specific data.
The Form 4231 Database [12] contains coal quality information by coal rank and by source.
However, the Supplier field in the Form 423 database does not provide uniform data. It may
contain the sales company name, the mining company name, the mine name, a seam indication,
or varying abbreviations of these depending on who completed the form. Furthermore, coal in
Form 423 is identified by rank, but not by the seam where the coal was mined, i.e., bituminous
coals from all regions (Appalachian, Interior, etc.) are grouped into the same category. Not all
data fields are complete for all records.
Average coal quality of commercially shipped coal in The Utah Geological Survey [13] is
reported by state and by county, but not by the coal rank and mine.
Thus, the average quality of commercially shipped coal from EIA Form 423 and the Utah
Geological Survey, presented in Exhibit 6-1 and Exhibit 6-2, can be used for indicative
comparison only.
1 The Form No. 423 is a compilation of data for cost and quality of fuels delivered to electric power plants to be
used for determination of electric rates. Prior to 2002, the “Monthly Cost and Quality of Fuels for Electric
Plants Database” came from FERC Form 423, and included cost information as well as Btu, sulfur, and ash
content, but the specific supplier was not included in the FERC database. Currently the “Monthly Cost and
Quality of Fuels for Electric Plants Database” comes from EIA Form 423 and includes supplier information as
well as Btu, sulfur, and ash content, but the cost information is not included in the database. Both databases are
available from the EIA website.
National Energy Technology Laboratory Office of Program Performance and Benefits
30
January 2012
Detailed Coal Specifications
Quality Guidelines for Energy System Studies
Exhibit 6-1 Form 423 summary of 2001-2003 coal quality by coal type
Weighted Average, As Received
HHV, Btu/lb Sulfur, % Ash, %
Illinois No.6 11,176 2.95 8.29
PRB 8,652 0.341, 2
5.03
Texas Lignite 6,482 1.27 17.07
Notes: 1. About 49 percent of PRB supplied coal in 2003 had sulfur content not exceeding 0.3 percent
(AR, by wt); About 28 percent of PRB supplied coal in 2003 had sulfur content between 0.3 percent and 0.4 percent (AR, by wt); About 16 percent of PRB supplied coal in 2003 (all from the same source) had sulfur content above 0.5 percent (AR, by wt)
2. The PRB coal supply contracts appear to comprise two distinct groups. One group (approximately 33 percent of total tonnage) is so called “super compliance coal,” with the sulfur content around 0.2 percent; the second group (approximately 16 percent of total tonnage) is coal with relatively high sulfur content of 0.5 percent.
Exhibit 6-2 Average quality of commercially shipped coal by state per Utah Geological Survey
State HHV Ash Sulfur Mercury Chlorine
Btu/lb, (dry) (% dry) (% dry) (ppm dry) (ppm dry)
Illinois1 12,992 9.9 2.6 0.083 1,691
Pennsylvania1 13,089 13.2 1.9 0.258 1,048
Kentucky1 13,153 11.2 1.9 0.104 1,054
West Virginia1 13,264 12.0 1.4 0.119 1,044
Wyoming2 12,033 8.1 0.6 0.053 131
Montana2 11,633 10.0 0.8 0.070 107
North Dakota3 10,603 14.4 1.3 0.097 159
Texas3 9,332 25.5 1.6 0.125 370
Notes: 1. Coals from Illinois, Pennsylvania, Kentucky and West Virginia are predominantly high
volatile bituminous 2. Coals from Wyoming and Montana are mostly from the Powder River Basin and
subbituminous in rank 3. Coals from North Dakota and Texas are mostly lignite
National Energy Technology Laboratory Office of Program Performance and Benefits
31
January 2012
Detailed Coal Specifications
Quality Guidelines for Energy System Studies
7 Recommended Coal Analysis
The coal analyses recommended for the QGESS are presented in the following sections. The
data sources, if known, are documented at the beginning of each coal rank section. Some coal
types have been used in previous system analysis studies and the compositions presented here are
consistent with prior modeling efforts. However, in some instances the original data source for
those compositions is no longer known and therefore simply specified as “previous system
studies.”
It should be noted that low volatile and medium volatile bituminous coals are mostly utilized by
the steel industry. Combustion of these coals in wall-fired boilers may present a significant
challenge due to their low reactivity. Regardless, recommended compositions are still provided
for those coal types. Two options for high volatile bituminous coals, Pittsburgh No. 8 and
Illinois No. 6, are included. There are also two options for lignite (Texas and North Dakota) and
subbituminous coal (“super-compliance” and high [relatively] sulfur).
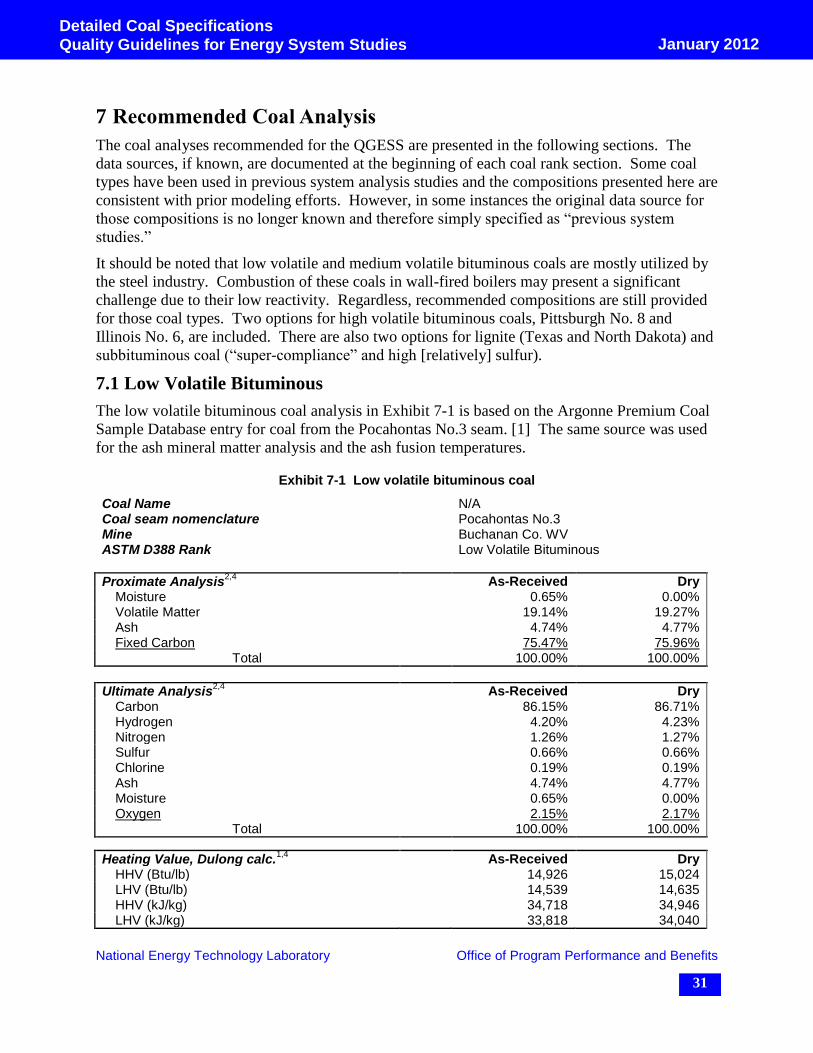
7.1 Low Volatile Bituminous
The low volatile bituminous coal analysis in Exhibit 7-1 is based on the Argonne Premium Coal
Sample Database entry for coal from the Pocahontas No.3 seam. [1] The same source was used
for the ash mineral matter analysis and the ash fusion temperatures.
Exhibit 7-1 Low volatile bituminous coal
Coal Name N/A Coal seam nomenclature Pocahontas No.3 Mine Buchanan Co. WV ASTM D388 Rank Low Volatile Bituminous
Proximate Analysis2,4
As-Received Dry Moisture 0.65% 0.00% Volatile Matter 19.14% 19.27% Ash 4.74% 4.77% Fixed Carbon 75.47% 75.96%
Total 100.00% 100.00%
Ultimate Analysis2,4
As-Received Dry Carbon 86.15% 86.71% Hydrogen 4.20% 4.23% Nitrogen 1.26% 1.27% Sulfur 0.66% 0.66% Chlorine 0.19% 0.19% Ash 4.74% 4.77% Moisture 0.65% 0.00% Oxygen 2.15% 2.17%
Total 100.00% 100.00%
Heating Value, Dulong calc.1,4
As-Received Dry HHV (Btu/lb) 14,926 15,024 LHV (Btu/lb) 14,539 14,635 HHV (kJ/kg) 34,718 34,946 LHV (kJ/kg) 33,818 34,040

National Energy Technology Laboratory Office of Program Performance and Benefits
32
January 2012
Detailed Coal Specifications
Quality Guidelines for Energy System Studies
Coal Name N/A Coal seam nomenclature Pocahontas No.3
Hardgrove Grindability Index3 100 HGI
Typical Ash Mineral Analysis2
Silica SiO2 32.0% Aluminum Oxide Al2O3 20.1% Titanium Dioxide TiO2 1.9% Iron Oxide Fe2O3 15.8% Calcium Oxide CaO 12.8% Magnesium Oxide MgO 2.0% Sodium Oxide Na2O 2.0% Potassium Oxide K2O 0.6% Phosphorus Pentoxide P2O5 0.4% Sulfur Trioxide SO3 12.4% Undetermined 0.0%
Total 100.00%
Typical Ash Fusion Temperatures (°F)2
Reducing Initial - Limited deformation 2,183 Softening H=W 2,240 Hemispherical H=1/2W 2,310 Fluid 2,407
Oxidizing Initial - Limited deformation 2,400 Softening H=W 2,414 Hemispherical H=1/2W 2,422 Fluid 2,487
Average trace element composition, dry basis, ppm
Arithmetic Mean Standard Deviation
Arsenic As
Barium Ba Boron B Beryllium Be Cadmium Cd Cerium Ce Cobalt Co Chromium Cr Copper Cu Gallium Ga Germanium Ge Lanthanum La Lead Pb Lithium Li Manganese Mn Mercury
5,6 Hg 0.079 0.009
Molybdenum Mo Neodymium Nd
National Energy Technology Laboratory Office of Program Performance and Benefits
33
January 2012
Detailed Coal Specifications
Quality Guidelines for Energy System Studies
Coal Name N/A Coal seam nomenclature Pocahontas No.3
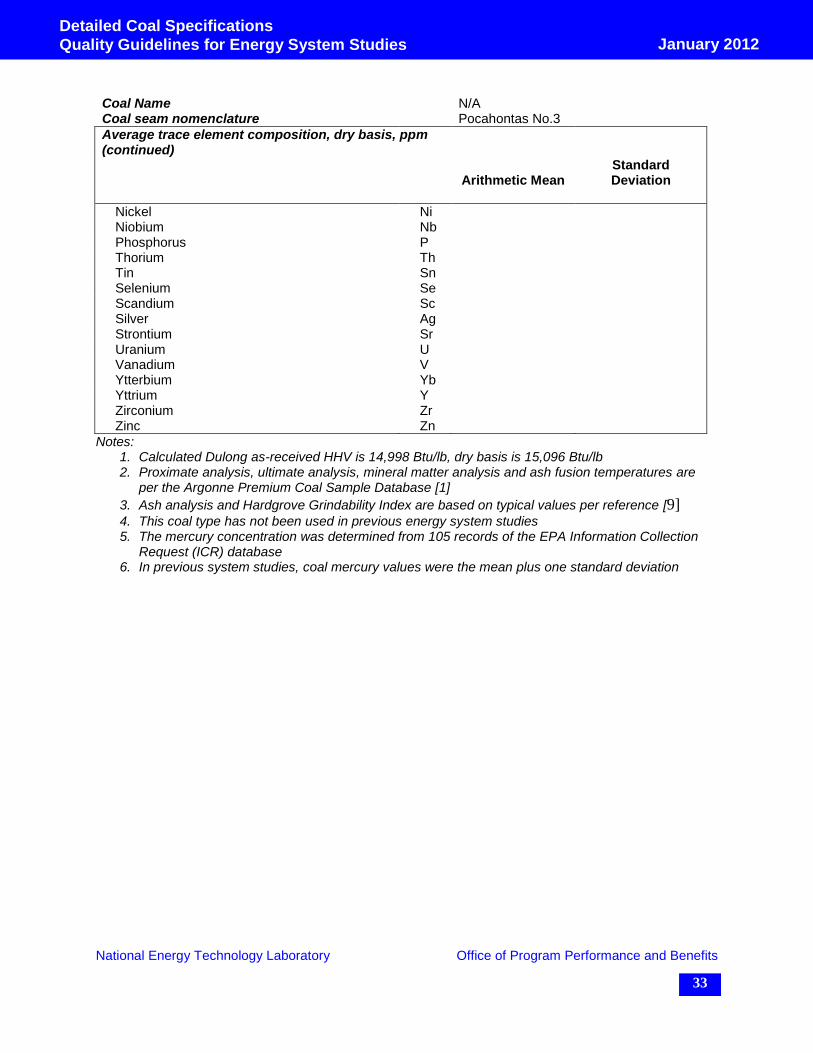
Average trace element composition, dry basis, ppm (continued)
Arithmetic Mean Standard Deviation
Nickel Ni Niobium Nb Phosphorus P Thorium Th Tin Sn Selenium Se Scandium Sc Silver Ag Strontium Sr Uranium U Vanadium V Ytterbium Yb Yttrium Y Zirconium Zr Zinc Zn
Notes: 1. Calculated Dulong as-received HHV is 14,998 Btu/lb, dry basis is 15,096 Btu/lb 2. Proximate analysis, ultimate analysis, mineral matter analysis and ash fusion temperatures are
per the Argonne Premium Coal Sample Database [1]
3. Ash analysis and Hardgrove Grindability Index are based on typical values per reference [9] 4. This coal type has not been used in previous energy system studies 5. The mercury concentration was determined from 105 records of the EPA Information Collection
Request (ICR) database 6. In previous system studies, coal mercury values were the mean plus one standard deviation

National Energy Technology Laboratory Office of Program Performance and Benefits
34
January 2012
Detailed Coal Specifications
Quality Guidelines for Energy System Studies
7.2 Medium Volatile Bituminous
The medium volatile bituminous coal analysis in Exhibit 7-2 is based on the Argonne Premium
Coal Sample Database for the Upper Freeport coal seam. This analysis is consistent with the
average quality of commercially shipped coal from Indiana County, Pennsylvania. [13]
Exhibit 7-2 Medium volatile bituminous coal
Coal Name N/A Coal seam nomenclature Upper Freeport Mine Indiana Co, PA ASTM D388 Rank Mid Volatile Bituminous
Proximate Analysis2,4
As-Received Dry Moisture 1.13% 0.00% Volatile Matter 29.43% 29.77% Ash 13.03% 13.18% Fixed Carbon 56.41% 57.05%
Total 100.00% 100.00%
Ultimate Analysis2,4
As-Received Dry Carbon 73.39% 74.23% Hydrogen 4.03% 4.07% Nitrogen 1.33% 1.35% Sulfur 2.29% 2.32% Chlorine 0.00% 0.00% Ash 13.03% 13.18% Moisture 1.13% 0.00% Oxygen 4.80% 4.85%
Total 100.00% 100.00%
Heating Value, Dulong calc.1,4
As-Received Dry HHV (Btu/lb) 13,315 13,467 LHV (Btu/lb) 12,944 13,092 HHV (kJ/kg) 30,971 31,324 LHV (kJ/kg) 30,108 30,451
Hardgrove Grindability Index3 95 HGI
Typical Ash Mineral Analysis2
Silica SiO2 44.8% Aluminum Oxide Al2O3 24.1% Titanium Dioxide TiO2 1.3% Iron Oxide Fe2O3 17.3% Calcium Oxide CaO 4.2% Magnesium Oxide MgO 1.6% Sodium Oxide Na2O 0.0% Potassium Oxide K2O 2.7% Phosphorus Pentoxide P2O5 0.1% Sulfur Trioxide SO3 3.9% Undetermined 0.0%
Total 100.00%

National Energy Technology Laboratory Office of Program Performance and Benefits
35
January 2012
Detailed Coal Specifications
Quality Guidelines for Energy System Studies
Coal Name N/A Coal seam nomenclature Upper Freeport
Typical Ash Fusion Temperatures (°F)2, 7
Reducing
Initial - Limited deformation 2,191 Softening H=W 2,250 Hemispherical H=1/2W 2,321 Fluid 2,433
Oxidizing Initial - Limited deformation 2,140 Softening H=W 2,170 Hemispherical H=1/2W 2,200 Fluid 2,225
Average trace element composition, dry basis, ppm
Arithmetic Mean Standard Deviation
Antimony Sb Arsenic As Barium Ba Boron B Beryllium Be Cadmium Cd Cerium Ce Cobalt Co Chromium Cr Copper Cu Fluorine F Gallium Ga Germanium Ge Lanthanum La Lead Pb Lithium Li Manganese Mn Mercury
5,6 Hg 0.238 0.099
Molybdenum Mo Neodymium Nd Nickel Ni Niobium Nb Phosphorus P Thorium Th Tin Sn Selenium Se Scandium Sc Silver Ag Strontium Sr Uranium U Vanadium V Ytterbium Yb Yttrium Y Zirconium Zr Zinc Zn
Notes: 1. Calculated Dulong as-received HHV is 12,897 Btu/lb, dry basis is 13,044 Btu/lb

National Energy Technology Laboratory Office of Program Performance and Benefits
36
January 2012
Detailed Coal Specifications
Quality Guidelines for Energy System Studies
2. Proximate analysis, ultimate analysis, ash mineral matter analysis, and ash fusion temperatures are per Argonne Premium Coal Sample Database
3. Hardgrove Grindability Index is per reference [9] 4. This coal type has not been used in previous energy system studies 5. The mercury concentration was determined from 396 records of EPA Information Collection
Request (ICR) database 6. In previous system studies, coal mercury values were the mean plus one standard deviation 7. Oxidizing ash fusion temperatures are generally higher than reducing, but these data are as
reported by the Argonne Premium Coal Sample Database
National Energy Technology Laboratory Office of Program Performance and Benefits
37
January 2012
Detailed Coal Specifications
Quality Guidelines for Energy System Studies
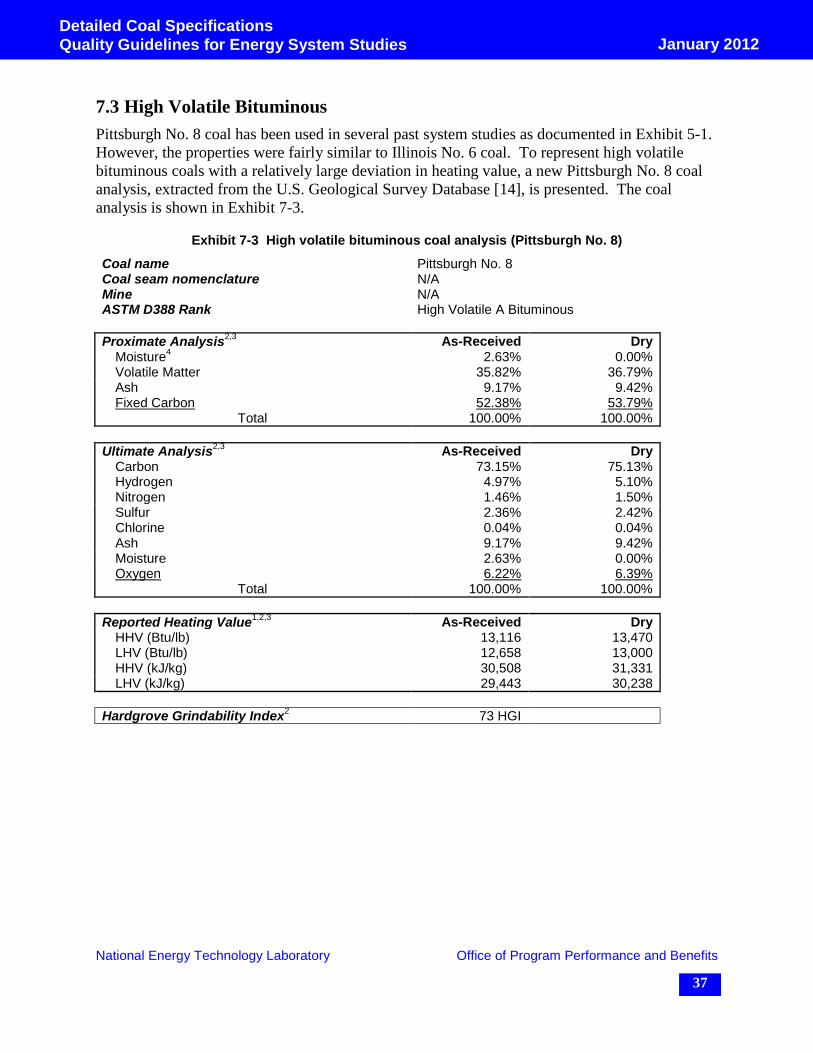
7.3 High Volatile Bituminous
Pittsburgh No. 8 coal has been used in several past system studies as documented in Exhibit 5-1.
However, the properties were fairly similar to Illinois No. 6 coal. To represent high volatile
bituminous coals with a relatively large deviation in heating value, a new Pittsburgh No. 8 coal
analysis, extracted from the U.S. Geological Survey Database [14], is presented. The coal
analysis is shown in Exhibit 7-3.
Exhibit 7-3 High volatile bituminous coal analysis (Pittsburgh No. 8)
Coal name Pittsburgh No. 8 Coal seam nomenclature N/A Mine N/A ASTM D388 Rank High Volatile A Bituminous
Proximate Analysis2,3
As-Received Dry Moisture
4 2.63% 0.00%
Volatile Matter 35.82% 36.79% Ash 9.17% 9.42% Fixed Carbon 52.38% 53.79%
Total 100.00% 100.00%
Ultimate Analysis2,3
As-Received Dry Carbon 73.15% 75.13% Hydrogen 4.97% 5.10% Nitrogen 1.46% 1.50% Sulfur 2.36% 2.42% Chlorine 0.04% 0.04% Ash 9.17% 9.42% Moisture 2.63% 0.00% Oxygen 6.22% 6.39%
Total 100.00% 100.00%
Reported Heating Value1,2,3
As-Received Dry HHV (Btu/lb) 13,116 13,470 LHV (Btu/lb) 12,658 13,000 HHV (kJ/kg) 30,508 31,331 LHV (kJ/kg) 29,443 30,238
Hardgrove Grindability Index2 73 HGI

National Energy Technology Laboratory Office of Program Performance and Benefits
38
January 2012
Detailed Coal Specifications
Quality Guidelines for Energy System Studies
Coal name Pittsburgh No. 8
Typical Ash Mineral Analysis2
Silica SiO2 41.80% Aluminum Oxide Al2O3 22.30% Titanium Dioxide TiO2 1.03% Iron Oxide Fe2O3 22.76% Calcium Oxide CaO 3.20% Magnesium Oxide MgO 0.70% Sodium Oxide Na2O 0.48% Potassium Oxide K2O 1.51% Phosphorus Pentoxide P2O5 0.37% Sulfur Trioxide SO3 2.87% Undetermined 2.94%
Total 100.0%
Typical Ash Fusion Temperatures (°F) Reducing
Initial – Limited deformation ºF 2,260 Softening H=W ºF 2,350 Hemispherical H=1/2W ºF Fluid ºF 2,430
Oxidizing Initial – Limited deformation ºF Softening H=W ºF Hemispherical H=1/2W ºF Fluid ºF
Average trace element composition of selected coal samples, dry basis, ppm2
Arithmetic
Mean Standard Deviation
Arsenic As 996 749 Boron B 42 15 Beryllium Be 1.2 0.7 Cadmium Cd 0.08 0.06 Chlorine Cl 457 367 Cobalt Co 4.0 2.6 Chromium Cr 14.0 6.0 Copper Cu 7.1 3.5 Fluorine F 75.0 105 Mercury
5 Hg 0.23 0.20
Lithium Li 12.9 7.9 Manganese Mn 19.8 13.3 Molybdenum Mo 2.7 2.6 Nickel Ni 11.1 6.5 Phosphorus P 181 221 Lead Pb 4.3 2.6 Tin Sn 0.6 0.5 Selenium Se 1.4 0.8 Thorium Th 1.8 0.7 Uranium U 0.9 1.0 Vanadium V 16.0 8.0 Zinc Zn 12.6 8.5
Notes: 1. Calculated Dulong HHV, As-Received – 13,335 Btu/lb, Dry – 13,695 Btu/lb

National Energy Technology Laboratory Office of Program Performance and Benefits
39
January 2012
Detailed Coal Specifications
Quality Guidelines for Energy System Studies
2. Proximate analysis, ultimate analysis, HHV, ash mineral analysis, Hardgrove Grindability Index, ash fusion temperature and trace element composition were average values based on 46 Pittsburgh formation coal samples extracted from the USGS database [14]
3. This analysis is different than Pittsburgh No. 8 coal analyses that were used in past system studies
4. In previous system studies, this coal was dried to 2.5 percent moisture for dry-feed gasifiers 5. In previous system studies, mercury values for coal analyses were the mean plus one standard
deviation
The coal analysis from the Old Ben Mine No. 26 has been utilized in several major studies,
including multiple revisions of Volume 1 of the Cost and Performance Baseline Report. [15] The
coal quality in this guideline is consistent with the commercial offerings for the high volatile
bituminous rank coal and coals shipped from the state of Illinois. The composition documented
in this guideline has been reported previously in other studies dating back to 1996. [16] The high
volatile bituminous coal analysis (Illinois No. 6) is presented in Exhibit 7-4.
Exhibit 7-4 High volatile bituminous coal analysis (Illinois No. 6)
Coal name Illinois No. 6 Coal seam nomenclature Herrin (No. 6) Mine N/A ASTM D388 Rank High Volatile A Bituminous
Proximate Analysis6 As-Received Dry
Moisture7 11.12% 0.00%
Volatile Matter 34.99% 39.37% Ash 9.70% 10.91% Fixed Carbon 44.19% 49.72%
Total 100.00% 100.00%
Ultimate Analysis6 As-Received Dry
Carbon 63.75% 71.72% Hydrogen 4.50% 5.06% Nitrogen 1.25% 1.41% Sulfur 2.51% 2.82% Chlorine 0.29% 0.33% Ash 9.70% 10.91% Moisture
7 11.12% 0.00%
Oxygen 6.88% 7.75% Total 100.00% 100.00%
Reported Heating Value1,6
As-Received Dry HHV (Btu/lb) 11,666 13,126 LHV (Btu/lb) 11,252 12,712 HHV (kJ/kg) 27,113 30,506 LHV (kJ/kg) 26,151 29,444
Hardgrove Grindability Index 60 HGI
National Energy Technology Laboratory Office of Program Performance and Benefits
40
January 2012
Detailed Coal Specifications
Quality Guidelines for Energy System Studies
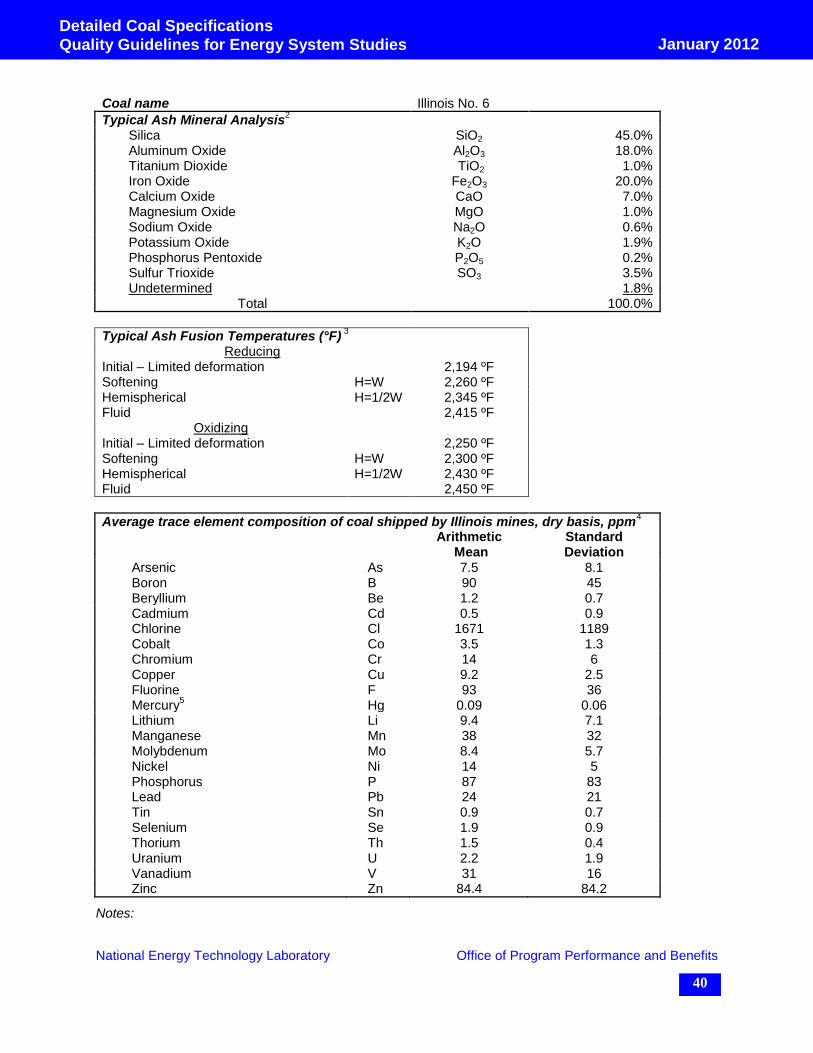
Coal name Illinois No. 6
Typical Ash Mineral Analysis2
Silica SiO2 45.0% Aluminum Oxide Al2O3 18.0% Titanium Dioxide TiO2 1.0% Iron Oxide Fe2O3 20.0% Calcium Oxide CaO 7.0% Magnesium Oxide MgO 1.0% Sodium Oxide Na2O 0.6% Potassium Oxide K2O 1.9% Phosphorus Pentoxide P2O5 0.2% Sulfur Trioxide SO3 3.5% Undetermined 1.8%
Total 100.0%
Typical Ash Fusion Temperatures (°F) 3
Reducing Initial – Limited deformation 2,194 ºF Softening H=W 2,260 ºF Hemispherical H=1/2W 2,345 ºF Fluid 2,415 ºF
Oxidizing Initial – Limited deformation 2,250 ºF Softening H=W 2,300 ºF Hemispherical H=1/2W 2,430 ºF Fluid 2,450 ºF
Average trace element composition of coal shipped by Illinois mines, dry basis, ppm4
Arithmetic
Mean Standard Deviation
Arsenic As 7.5 8.1 Boron B 90 45 Beryllium Be 1.2 0.7 Cadmium Cd 0.5 0.9 Chlorine Cl 1671 1189 Cobalt Co 3.5 1.3 Chromium Cr 14 6 Copper Cu 9.2 2.5 Fluorine F 93 36 Mercury
5 Hg 0.09 0.06
Lithium Li 9.4 7.1 Manganese Mn 38 32 Molybdenum Mo 8.4 5.7 Nickel Ni 14 5 Phosphorus P 87 83 Lead Pb 24 21 Tin Sn 0.9 0.7 Selenium Se 1.9 0.9 Thorium Th 1.5 0.4 Uranium U 2.2 1.9 Vanadium V 31 16 Zinc Zn 84.4 84.2
Notes:
National Energy Technology Laboratory Office of Program Performance and Benefits
41
January 2012
Detailed Coal Specifications
Quality Guidelines for Energy System Studies
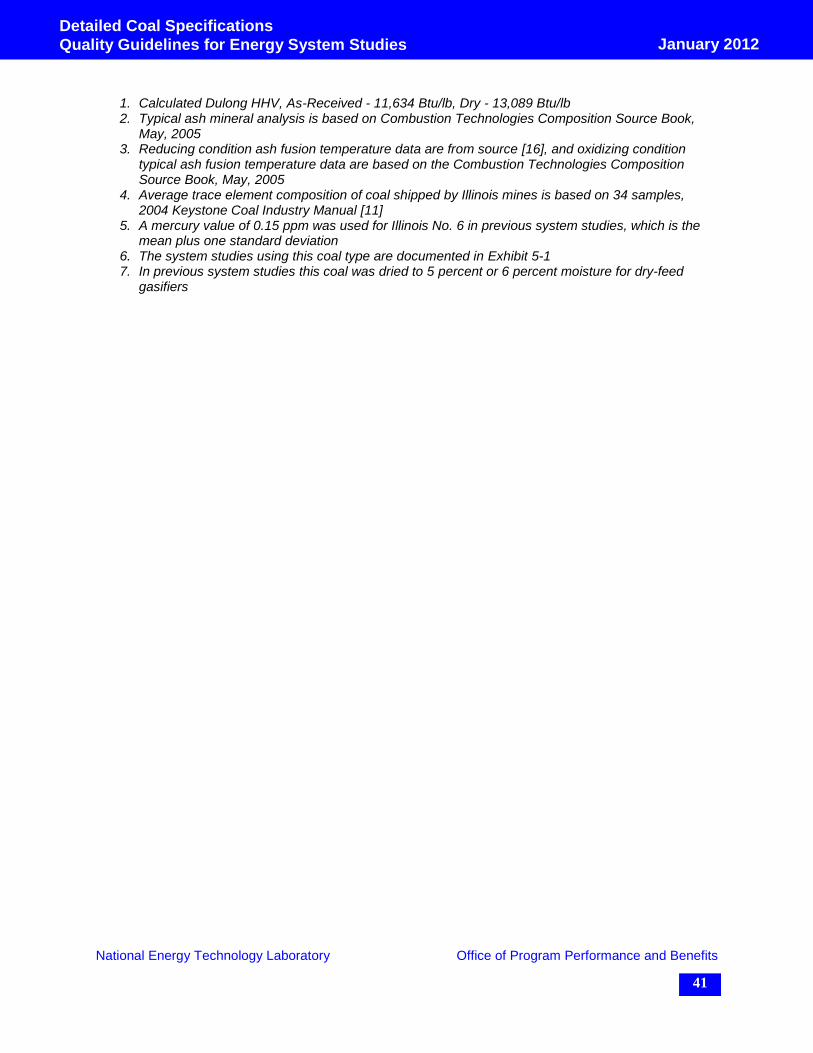
1. Calculated Dulong HHV, As-Received - 11,634 Btu/lb, Dry - 13,089 Btu/lb 2. Typical ash mineral analysis is based on Combustion Technologies Composition Source Book,
May, 2005 3. Reducing condition ash fusion temperature data are from source [16], and oxidizing condition
typical ash fusion temperature data are based on the Combustion Technologies Composition Source Book, May, 2005
4. Average trace element composition of coal shipped by Illinois mines is based on 34 samples, 2004 Keystone Coal Industry Manual [11]
5. A mercury value of 0.15 ppm was used for Illinois No. 6 in previous system studies, which is the mean plus one standard deviation
6. The system studies using this coal type are documented in Exhibit 5-1 7. In previous system studies this coal was dried to 5 percent or 6 percent moisture for dry-feed
gasifiers

National Energy Technology Laboratory Office of Program Performance and Benefits
42
January 2012
Detailed Coal Specifications
Quality Guidelines for Energy System Studies
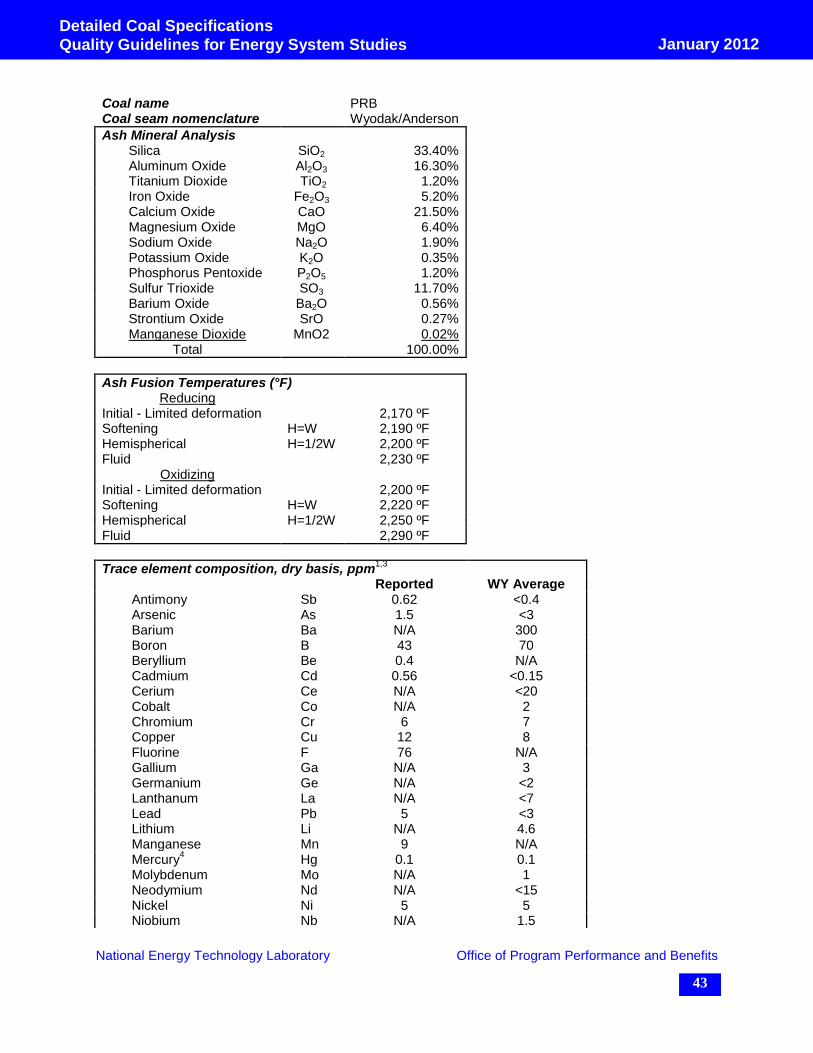
7.4 “Super-Compliance” Subbituminous PRB Coal
“Super-compliance” subbituminous coal analysis is based on a coal sample reported by the
Sheldon Station power plant for an energy system study conducted in 2003 [17], and is presented
in Exhibit 7-5.
Exhibit 7-5 “Super-compliance” subbituminous coal analysis
Coal name PRB Coal seam nomenclature Wyodak/Anderson Mine Rochelle Coal Co. ASTM D388 Rank Subbituminous C
Proximate Analysis5 As-Received Dry
Moisture 27.42% 0.00% Volatile Matter 31.65% 43.61% Ash 4.50% 6.20% Fixed Carbon 36.43% 50.19%
Total 100.00% 100.00%
Ultimate Analysis5 As-Received Dry
Carbon 50.23% 69.21% Hydrogen 3.41% 4.70% Nitrogen 0.65% 0.89% Sulfur 0.22% 0.30% Chlorine 0.02% 0.03% Ash 4.50% 6.20% Moisture 27.42% 0.00% Oxygen 13.55% 18.67%
Total 100.00% 100.00%
Heating Value2,5
As-Received
(Reported) Dry
(Dulong calc.) HHV (Btu/lb) 8,800 11,546 LHV (Btu/lb) 8,486 11,113 HHV (kJ/kg) 20,469 26,856 LHV (kJ/kg) 19,738 25,850
Hardgrove Grindability Index 52 HGI
National Energy Technology Laboratory Office of Program Performance and Benefits
43
January 2012
Detailed Coal Specifications
Quality Guidelines for Energy System Studies
Coal name PRB Coal seam nomenclature Wyodak/Anderson
Ash Mineral Analysis Silica SiO2 33.40% Aluminum Oxide Al2O3 16.30% Titanium Dioxide TiO2 1.20% Iron Oxide Fe2O3 5.20% Calcium Oxide CaO 21.50% Magnesium Oxide MgO 6.40% Sodium Oxide Na2O 1.90% Potassium Oxide K2O 0.35% Phosphorus Pentoxide P2O5 1.20% Sulfur Trioxide SO3 11.70% Barium Oxide Ba2O 0.56% Strontium Oxide SrO 0.27% Manganese Dioxide MnO2 0.02%
Total 100.00%
Ash Fusion Temperatures (°F) Reducing
Initial - Limited deformation 2,170 ºF Softening H=W 2,190 ºF Hemispherical H=1/2W 2,200 ºF Fluid 2,230 ºF
Oxidizing Initial - Limited deformation 2,200 ºF Softening H=W 2,220 ºF Hemispherical H=1/2W 2,250 ºF Fluid 2,290 ºF
Trace element composition, dry basis, ppm1,3
Reported WY Average
Antimony Sb 0.62 <0.4 Arsenic As 1.5 <3 Barium Ba N/A 300 Boron B 43 70 Beryllium Be 0.4 N/A Cadmium Cd 0.56 <0.15 Cerium Ce N/A <20 Cobalt Co N/A 2 Chromium Cr 6 7 Copper Cu 12 8 Fluorine F 76 N/A Gallium Ga N/A 3 Germanium Ge N/A <2 Lanthanum La N/A <7 Lead Pb 5 <3 Lithium Li N/A 4.6 Manganese Mn 9 N/A Mercury
4 Hg 0.1 0.1
Molybdenum Mo N/A 1 Neodymium Nd N/A <15 Nickel Ni 5 5 Niobium Nb N/A 1.5
National Energy Technology Laboratory Office of Program Performance and Benefits
44
January 2012
Detailed Coal Specifications
Quality Guidelines for Energy System Studies
Coal name PRB Coal seam nomenclature Wyodak/Anderson
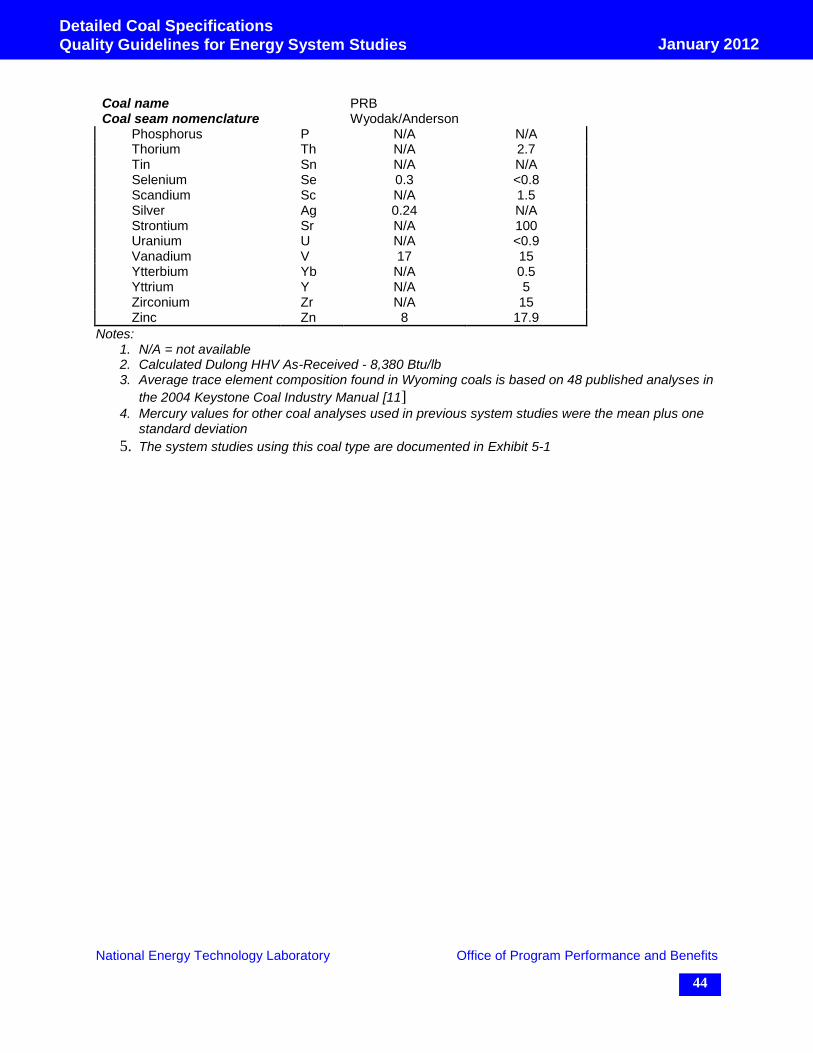
Phosphorus P N/A N/A Thorium Th N/A 2.7 Tin Sn N/A N/A Selenium Se 0.3 <0.8 Scandium Sc N/A 1.5 Silver Ag 0.24 N/A Strontium Sr N/A 100 Uranium U N/A <0.9 Vanadium V 17 15 Ytterbium Yb N/A 0.5 Yttrium Y N/A 5 Zirconium Zr N/A 15 Zinc Zn 8 17.9
Notes: 1. N/A = not available 2. Calculated Dulong HHV As-Received - 8,380 Btu/lb 3. Average trace element composition found in Wyoming coals is based on 48 published analyses in
the 2004 Keystone Coal Industry Manual [11] 4. Mercury values for other coal analyses used in previous system studies were the mean plus one
standard deviation
5. The system studies using this coal type are documented in Exhibit 5-1

National Energy Technology Laboratory Office of Program Performance and Benefits
45
January 2012
Detailed Coal Specifications
Quality Guidelines for Energy System Studies
7.5 Subbituminous
The subbituminous coal analysis in Exhibit 7-6 represents a relatively smaller group of PRB
coals with sulfur content higher than 0.5 percent. The original source of the composition data is
not known, but it is very close to the composition reported for Wyoming coal in the Argonne
Premium Coal Sample Database. [1]
Exhibit 7-6 Subbituminous coal from PRB field
Coal seam nomenclature Montana Rosebud Coal field PRB, Area D Mine Western Energy Co. ASTM D388 Rank Subbituminous
Proximate Analysis2 As-Received Dry
Moisture3 25.77% 0.00%
Volatile Matter 30.34% 40.87% Ash 8.19% 11.04% Fixed Carbon 35.70% 48.09%
Total 100.00% 100.00%
Ultimate Analysis2 As-Received Dry
Carbon 50.07% 67.45% Hydrogen 3.38% 4.56% Nitrogen 0.71% 0.96% Sulfur 0.73% 0.98% Chlorine 0.01% 0.01% Ash 8.19% 11.03% Moisture
3 25.77% 0.00%
Oxygen 11.14% 15.01% Total 100.00% 100.00%
Heating Value1,2
As-Received Dry (Dulong
calc.) HHV (Btu/lb) 8,564 11,516 LHV (Btu/lb) 8,252 11,096 HHV (kJ/kg) 19,920 26,787 LHV (kJ/kg) 19,195 25,810
Hardgrove Grindability Index 57

National Energy Technology Laboratory Office of Program Performance and Benefits
46
January 2012
Detailed Coal Specifications
Quality Guidelines for Energy System Studies
Coal seam nomenclature Montana Rosebud Coal field PRB, Area D
Ash Mineral Analysis Silica SiO2 38.09% Aluminum Oxide Al2O3 16.73% Titanium Dioxide TiO2 0.72% Iron Oxide Fe2O3 6.46% Calcium Oxide CaO 16.56% Magnesium Oxide MgO 4.25% Sodium Oxide Na2O 0.54% Potassium Oxide K2O 0.38% Phosphorus Pentoxide P2O5 0.35% Sulfur Trioxide SO3 15.08% Barium Oxide Ba2O 0.00% Strontium Oxide SrO 0.00% Unknown MnO2 0.84%
Total 100.00%
Ash Fusion Temperatures (°F) Reducing
Initial - Limited deformation 2,238 ºF Softening H=W 2,254 ºF Hemispherical H=1/2W 2,270 ºF Fluid 2,298 ºF
Oxidizing Initial - Limited deformation 2,284 ºF Softening H=W 2,301 ºF Hemispherical H=1/2W 2,320 ºF Fluid 2,367 ºF
Trace element composition, dry basis, ppm Reported WY Average
Antimony Sb Arsenic As Barium Ba Boron B Beryllium Be Cadmium Cd Cerium Ce Cobalt Co Chromium Cr Copper Cu Fluorine F Gallium Ga Germanium Ge Lanthanum La Lead Pb Lithium Li Manganese Mn Mercury
4 Hg 0.056 0.025
Molybdenum Mo Neodymium Nd Nickel Ni Niobium Nb
National Energy Technology Laboratory Office of Program Performance and Benefits
47
January 2012
Detailed Coal Specifications
Quality Guidelines for Energy System Studies
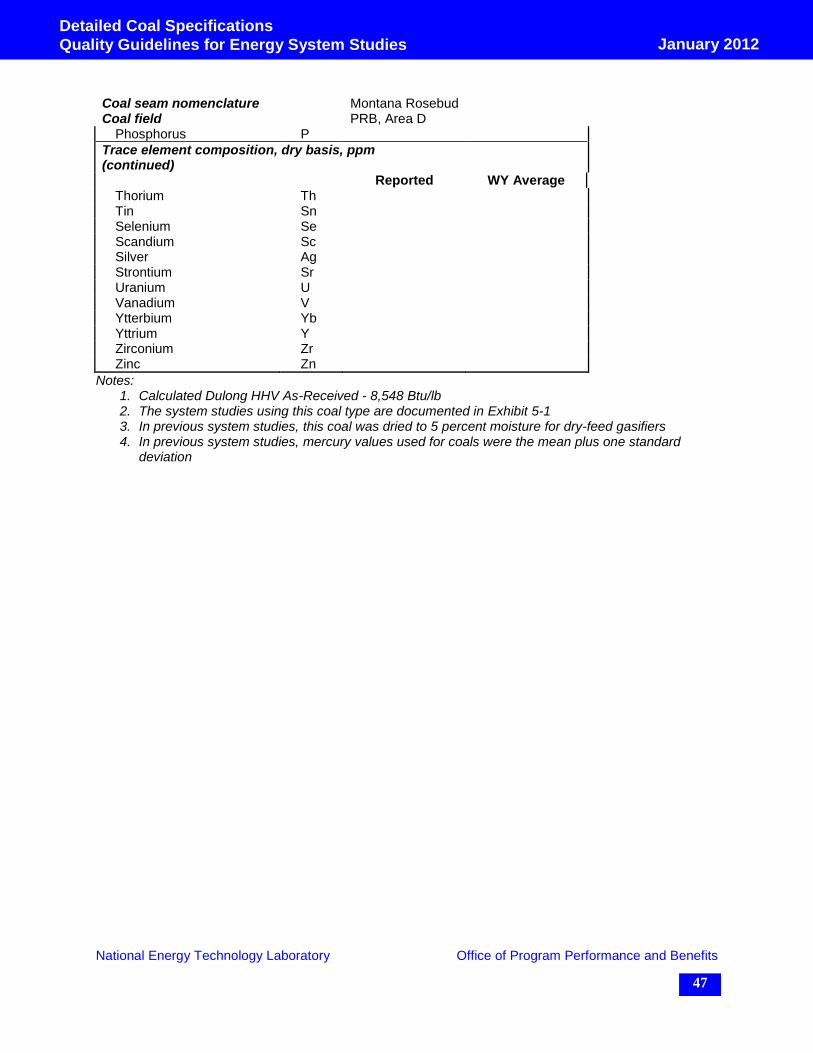
Coal seam nomenclature Montana Rosebud Coal field PRB, Area D
Phosphorus P
Trace element composition, dry basis, ppm (continued) Reported WY Average
Thorium Th Tin Sn Selenium Se Scandium Sc Silver Ag Strontium Sr Uranium U Vanadium V Ytterbium Yb Yttrium Y Zirconium Zr Zinc Zn
Notes: 1. Calculated Dulong HHV As-Received - 8,548 Btu/lb 2. The system studies using this coal type are documented in Exhibit 5-1 3. In previous system studies, this coal was dried to 5 percent moisture for dry-feed gasifiers 4. In previous system studies, mercury values used for coals were the mean plus one standard
deviation
National Energy Technology Laboratory Office of Program Performance and Benefits
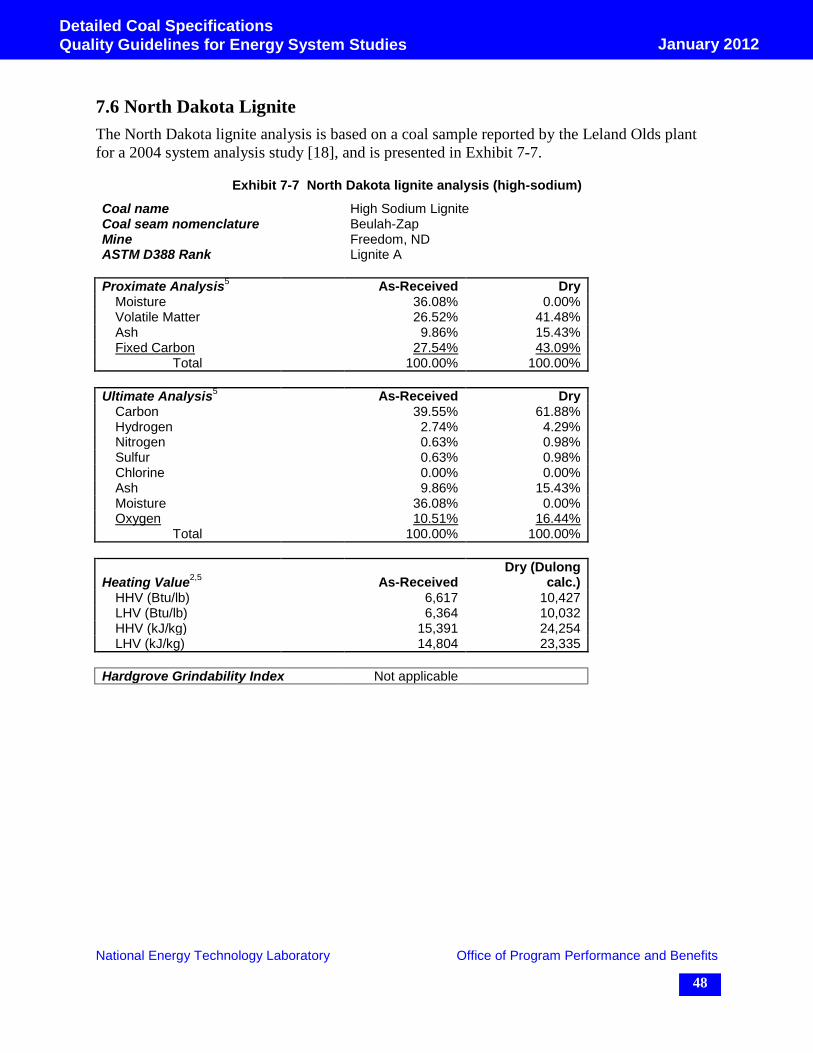
48
January 2012
Detailed Coal Specifications
Quality Guidelines for Energy System Studies
7.6 North Dakota Lignite
The North Dakota lignite analysis is based on a coal sample reported by the Leland Olds plant
for a 2004 system analysis study [18], and is presented in Exhibit 7-7.
Exhibit 7-7 North Dakota lignite analysis (high-sodium)
Coal name High Sodium Lignite Coal seam nomenclature Beulah-Zap Mine Freedom, ND ASTM D388 Rank Lignite A
Proximate Analysis5 As-Received Dry
Moisture 36.08% 0.00% Volatile Matter 26.52% 41.48% Ash 9.86% 15.43% Fixed Carbon 27.54% 43.09%
Total 100.00% 100.00%
Ultimate Analysis5 As-Received Dry
Carbon 39.55% 61.88% Hydrogen 2.74% 4.29% Nitrogen 0.63% 0.98% Sulfur 0.63% 0.98% Chlorine 0.00% 0.00% Ash 9.86% 15.43% Moisture 36.08% 0.00% Oxygen 10.51% 16.44%
Total 100.00% 100.00%
Heating Value2,5
As-Received Dry (Dulong
calc.) HHV (Btu/lb) 6,617 10,427 LHV (Btu/lb) 6,364 10,032 HHV (kJ/kg) 15,391 24,254 LHV (kJ/kg) 14,804 23,335
Hardgrove Grindability Index Not applicable

National Energy Technology Laboratory Office of Program Performance and Benefits
49
January 2012
Detailed Coal Specifications
Quality Guidelines for Energy System Studies
Coal name High Sodium Lignite
Ash Mineral Analysis Silica SiO2 35.06% Aluminum Oxide Al2O3 12.29% Titanium Dioxide TiO2 0.58% Iron Oxide Fe2O3 5.12% Calcium Oxide CaO 14.39% Magnesium Oxide MgO 6.61% Sodium Oxide Na2O 5.18% Potassium Oxide K2O 0.64% Phosphorus Pentoxide P2O5 0.00% Sulfur Trioxide SO3 16.27% Barium Oxide Ba2O 0.56% Strontium Oxide SrO 0.27% Manganese Dioxide MnO2 0.02% Unknown 3.00%
Total 100.00%
Ash Fusion Temperatures (°F)6
Reducing Initial - Limited deformation 2,045 ºF Softening H=W 2,085 ºF Hemispherical H=1/2W 2,125 ºF Fluid 2,165 ºF
Oxidizing Initial - Limited deformation 2,125 ºF Softening H=W 2,155 ºF Hemispherical H=1/2W 2,190 ºF Fluid 2,215 ºF
Trace element composition, dry basis, ppm3
As Reported1
Antimony Sb N/A Arsenic As 67 Barium Ba 7000 Boron B 1590 Beryllium Be N/A Cadmium Cd 0.89 Cerium Ce N/A Cobalt Co N/A Chromium Cr 29 Copper Cu 50 Fluorine F N/A Gallium Ga N/A Germanium Ge N/A Lanthanum La N/A Lead Pb 38.7 Lithium Li N/A Manganese Mn N/A Mercury
4 Hg 0.116
Molybdenum Mo N/A Neodymium Nd N/A Nickel Ni 27 Niobium Nb N/A
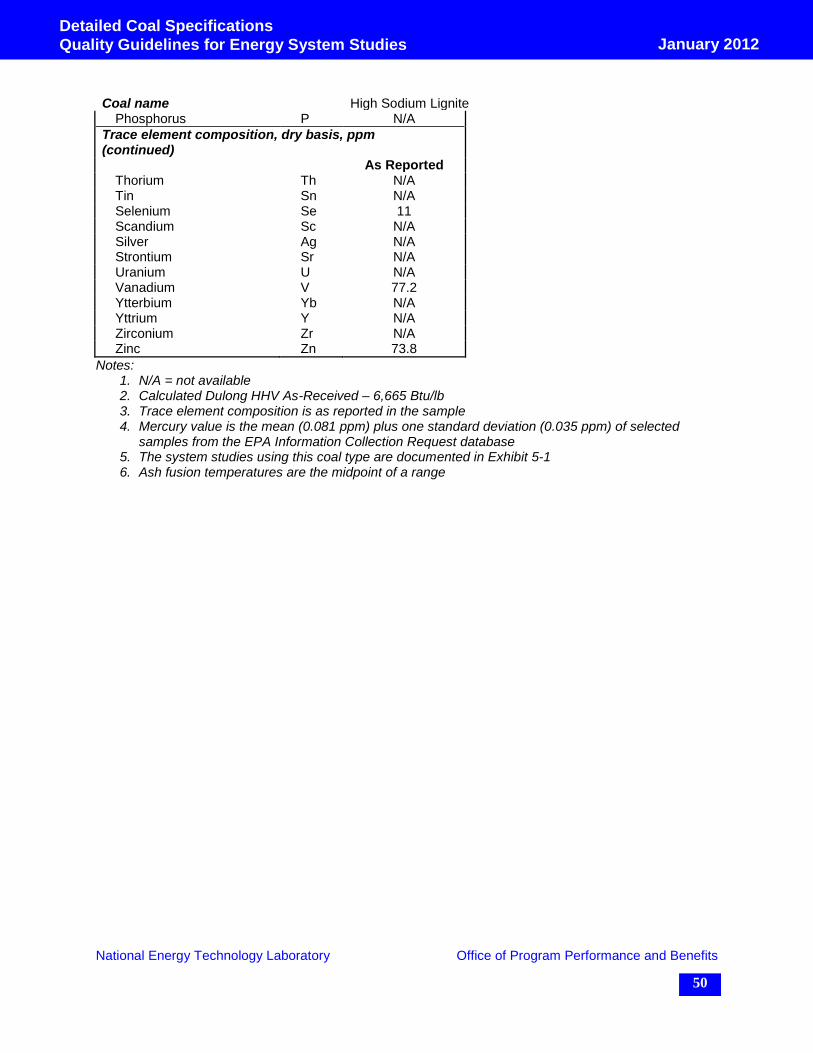
National Energy Technology Laboratory Office of Program Performance and Benefits
50
January 2012
Detailed Coal Specifications
Quality Guidelines for Energy System Studies
Coal name High Sodium Lignite Phosphorus P N/A
Trace element composition, dry basis, ppm (continued) As Reported
Thorium Th N/A Tin Sn N/A Selenium Se 11 Scandium Sc N/A Silver Ag N/A Strontium Sr N/A Uranium U N/A Vanadium V 77.2 Ytterbium Yb N/A Yttrium Y N/A Zirconium Zr N/A Zinc Zn 73.8
Notes: 1. N/A = not available 2. Calculated Dulong HHV As-Received – 6,665 Btu/lb 3. Trace element composition is as reported in the sample 4. Mercury value is the mean (0.081 ppm) plus one standard deviation (0.035 ppm) of selected
samples from the EPA Information Collection Request database 5. The system studies using this coal type are documented in Exhibit 5-1 6. Ash fusion temperatures are the midpoint of a range

National Energy Technology Laboratory Office of Program Performance and Benefits
51
January 2012
Detailed Coal Specifications
Quality Guidelines for Energy System Studies
7.7 Texas Lignite
Texas lignite was used in several energy system studies since 2004. [19, 20] The coal
composition used in the two studies was not consistent. The coal analysis presented in the
QGESS does not exactly match either study composition, but is based on mean values of the
Texas Wilcox Group lignite coals from the 2004 Keystone Coal Industry Manual. [11] The
Keystone Coal reference provided values closest to the weighted average Texas lignite values for
the coals sold on the U.S. market (Exhibit 6-1), and are also very close to the FutureGen study
composition. [19] Ash of Wilcox Group lignite contains less than 1 percent sodium. Thus, both
low-sodium and high-sodium lignite (ND lignite) are represented in the QGESS. The Texas
lignite analysis is presented in Exhibit 7-8.
Exhibit 7-8 Texas lignite analysis (low-sodium)
Coal seam nomenclature Wilcox Group Coal name Mean Values Mine TX ASTM D388 Rank Lignite
Proximate Analysis1,3
As-Received Dry Moisture 32.00% 0.00% Volatile Matter 28.00% 41.18% Ash 15.00% 22.06% Fixed Carbon 25.00% 36.76%
Total 100.00% 100.00%
Ultimate Analysis1,3
As-Received Dry Carbon 37.70% 55.44% Hydrogen 3.00% 4.41% Nitrogen 0.70% 1.03% Sulfur 0.90% 1.32% Chlorine 0.02% 0.03% Ash 15.00% 22.06% Moisture 32.00% 0.00% Oxygen 10.68% 15.71%
Total 100.00% 100.00%
Heating Value, Dulong calc. 3 As-Received Dry
HHV (Btu/lb) 6,554 9,638 LHV (Btu/lb) 6,277 9,231 HHV (kJ/kg) 15,243 22,417 LHV (kJ/kg) 14,601 21,472
Hardgrove Grindability Index 60 HGI

National Energy Technology Laboratory Office of Program Performance and Benefits
52
January 2012
Detailed Coal Specifications
Quality Guidelines for Energy System Studies
Coal seam nomenclature Wilcox Group
Typical Ash Mineral Analysis Silica SiO2 44.10% Aluminum Oxide Al2O3 15.03% Titanium Dioxide TiO2 1.03% Iron Oxide Fe2O3 8.96% Calcium Oxide CaO 11.91% Magnesium Oxide MgO 2.67% Sodium Oxide Na2O 0.70% Potassium Oxide K2O 0.78% Phosphorus Pentoxide P2O5 0.00% Sulfur Trioxide SO3 11.77% Undetermined 3.05%
Total 100.00%
Typical Ash Fusion Temperatures (°F) 2
Reducing Initial - Limited deformation 2,152 Softening H=W 2,260 Hemispherical H=1/2W 2,248 Fluid 2,362
Oxidizing Initial - Limited deformation Softening H=W Hemispherical H=1/2W Fluid
Average trace element composition, dry basis, ppm
Arithmetic Mean Standard Deviation
Antimony Sb Arsenic As Barium Ba Boron B Beryllium Be Cadmium Cd Cerium Ce Cobalt Co Chromium Cr Copper Cu Fluorine F Gallium Ga Germanium Ge Lanthanum La Lead Pb Lithium Li Manganese Mn Mercury
4 Hg 0.148 0.058
Molybdenum Mo Neodymium Nd Nickel Ni Niobium Nb Phosphorus P Thorium Th

National Energy Technology Laboratory Office of Program Performance and Benefits
53
January 2012
Detailed Coal Specifications
Quality Guidelines for Energy System Studies
Coal seam nomenclature Wilcox Group Tin Sn
Average trace element composition, dry basis, ppm (continued)
Arithmetic Mean Standard Deviation
Selenium Se Scandium Sc Silver Ag Strontium Sr Uranium U Vanadium V Ytterbium Yb Yttrium Y Zirconium Zr Zinc Zn
Notes: 1. Coal analysis is based on mean values for Texas Wilcox Group Coals, 2004 Keystone Coal
Industry Manual [11] 2. Ash fusion temperatures (reducing) are for Northeast of Wilcox Group 3. The system studies using this coal type (but not this composition) are documented in Exhibit 5-1 4. In previous systems studies, mercury values used for other coals were the mean plus one
standard deviation 5. In previous systems studies, this coal was dried to 15 percent, 12 percent or 8 percent moisture
for dry-feed gasifiers
8 Revision Control
Exhibit 8-1 Revision table
Revision Number
Revision Date Description of Change Comments
1 February 5, 2014 Document formatted

National Energy Technology Laboratory Office of Program Performance and Benefits
54
January 2012
Detailed Coal Specifications
Quality Guidelines for Energy System Studies
9 References
1 Argonne National Laboratory. (2012). Argonne Premium Coal Samples. Retrieved on
May 7, 2013, from http://www.anl.gov/PCS/
2 National Energy Technology Laboratory (NETL). (2010). Overview of U.S. Coal Supply
and Infrastructure. DOE/NETL-403/081709.
3 U.S. Energy Information Administration (EIA). (2010). Annual Outlook 2010. DOE/EIA-
0383.
4 U.S. Energy Information Administration (EIA). (2008). Electric Power Annual 2008.
DOE/EIA-0348.
5 U.S. Energy Information Administration (EIA). (2010). Annual Coal Report 2009.
DOE/EIA 0584.
6 U.S. Energy Information Administration (EIA). (1999). The Demonstrated Reserve Base,
U.S. Coal Reserves: 1997, Update.
7 U.S. Energy Information Administration (EIA). (2010). Annual Energy Review 2009.
DOE/EIA-0384.
8 U.S. Energy Information Administration (EIA). (2009). U.S. Coal Supply and Demand:
2009 Review.
9 Babcock & Wilcox Company (2005). Steam, its generation and use. 41st edition.
10 Combustion Engineering Inc. (1981). Combustion – Fossil Power Systems (3rd edition).
11 Keystone Coal Industry Manual. (2004). Published by Coal Age, a Mining Media
publication.
12 U.S. Energy Information Administration (EIA). (n.d.). Electricity: Survey-level Detail
Data Files. Retrieved on May 7, 2013, from
http://www.eia.doe.gov/cneaf/electricity/page/data.html
13 Quick, Jeffrey. C, David E. Tabet, Sharon Wakefield, and Roger L. Bon. (2004).
Optimizing Technology to Reduce Mercury and Acid Gas Emissions from Electric Power
Plants. Prepared by the Utah Geological Survey. Prepared for the U.S. DOE. DE-FG26-
03NT41901.
14 U.S. Geological Survey (USGS). (2004). National Coal Resources Data System: US Coal
Quality Database. Retrieved on May 7, 2013, from
http://energy.er.usgs.gov/coalqual.htm
15 National Energy Technology Laboratory (NETL). (2010). Cost and Performance
Baseline for Fossil Energy Plants; Volume 1: Bituminous Coal and Natural Gas to
Electricity, Revision 2. DOE/NETL-2010/1397.

National Energy Technology Laboratory Office of Program Performance and Benefits
55
January 2012
Detailed Coal Specifications
Quality Guidelines for Energy System Studies
16 Doctor, R.D., J.C. Molburg, and P.R. Thimmapuram. (1996). KRW Oxygen-Blown
Gasification Combined Cycle: Carbon Dioxide Recovery, Transport, and Disposal.
Prepared by Argonne National Laboratory, Energy Systems Division. Sponsored by U.S.
DOE, ANL/ESD-34.
17 Department of Energy (DOE). (2003). Repowering the Sheldon Station with Advanced
Pressurized Fluidized Bed Combustion. DOE Contract No. DE-AM26-99FT4046.
18 Department of Energy (DOE). (2004). Repowering Leland Olds Unit 2 with Combustion
Hybrid Technology. DOE Contract No. DE-AM26-99FT40465.
19 National Energy Technology Laboratory (NETL). (2006). Assessment of Alternative
FutureGen Plant Designs, Case 7.1.3 – Series #7 Base Case with Shell Gasifier for
Power Only w/o CO2 Capture. Internal Distribution Only. DOE/NETL-310/032406,
March 2006.
20 Gray, David, Salvatore Salerno, Glen Tomlinson, and John Marano. (2004).
Polygeneration of SNG, Hydrogen, Power, and Carbon Dioxide from Texas Lignite.
Prepared by Mitretek Systems. Prepared for U.S. DOE.


