60
Detailed Lab Testing Report DR121129 Cisco Catalyst 4500-X 1/10 Gigabit Ethernet Switch 20 June 2013 Miercom http://www.miercom.com
| Date post: | 12-Apr-2018 |
| Category: |
Documents |
| Upload: | duongtuyen |
| View: | 222 times |
| Download: | 2 times |
Detailed Lab Testing Report DR121129
Cisco Catalyst 4500-X 1/10 Gigabit
Ethernet Switch
20 June 2013
Miercom
http://www.miercom.com
Cisco Catalyst 4500-X Page 2 DR121129 Copyright © 2013 Miercom 20June2013
Contents
1.0 Executive Summary .................................................................................................................. 4
2.0 Test Bed Diagrams ................................................................................................................... 5
VSS Topology .......................................................................................................................... 7
2.1 How We Did It .................................................................................................................... 7
3.0 RFC 2544 ................................................................................................................................. 9
3.1 Layer 2 Throughput ............................................................................................................ 9
Figure 3.1.1: RFC 2544 Layer 2 Throughput .......................................................................... 10
3.2 Layer 2 Latency ............................................................................................................... 11
Figure 3.2.1: RFC 2544 Layer 2 Latency ............................................................................... 12
3.3 Layer 2 Frame Loss ......................................................................................................... 13
Figure 3.3.1: RFC 2544 Layer 2 Frame Loss ......................................................................... 14
3.4 Layer 3 IPv4 Throughput.................................................................................................. 15
Figure 3.4.1: RFC 2544 Layer 3 Throughput – Unicast IPv4 .................................................. 16
3.5 Layer 3 IPv4 Latency ....................................................................................................... 17
Figure 3.5.1: RFC 2544 Layer 3 Latency – Unicast IPv4 ........................................................ 18
3.6 Layer 3 IPv4 Frame Loss ................................................................................................. 19
Figure 3.6.1: RFC 2544 Layer 3 Frame Loss – Unicast IPv4 ................................................. 20
3.7 Layer 3 IPv6 Throughput.................................................................................................. 21
Figure 3.7.1: RFC 2544 Layer 3 Throughput - Unicast IPv6 ................................................... 22
3.8 Layer 3 IPv6 Latency ....................................................................................................... 23
Figure 3.8.1: RFC 2544 Layer 3 Latency - Unicast IPv6 ........................................................ 24
3.9 Layer 3 IPv6 Frame Loss ................................................................................................. 25
Figure 3.9.1: RFC 2544 Layer 3 Frame Loss - Unicast IPv6 .................................................. 26
4.0 RFC 2889 ............................................................................................................................... 27
4.1 Layer 2 Full Mesh Throughput ......................................................................................... 27
Figure 4.1.1: RFC 2889 Layer 2 Full Mesh Throughput ......................................................... 28
4.2 Layer 3 IPv6 Full Mesh Throughput ................................................................................. 29
Figure 4.2.1: RFC 2889 Layer 3 IPv6 Full Mesh Throughput ................................................. 30
4.3 Layer 2 One-to-Many Throughput .................................................................................... 31
Cisco Catalyst 4500-X Page 3 DR121129 Copyright © 2013 Miercom 20June2013
Figure 4.3.1: RFC 2889 Layer 2 One-to-Many ....................................................................... 32
5.0 RFC 3918 ............................................................................................................................... 33
5.1 Layer 3 Multicast IPv4 Throughput ................................................................................... 33
Figure 5.1.1: RFC 3918 Layer 3 IPv4 Multicast Throughput ................................................... 34
5.2 Layer 3 Multicast IPv4 Latency ........................................................................................ 35
Figure 5.2.1: RFC 3918 Layer 3 IPv4 Multicast Latency ........................................................ 36
5.3 Layer 3 Multicast IPv4 Frame Loss .................................................................................. 37
Figure 5.3.1: RFC 3918 Layer 3 IPv4 Multicast Frame Loss .................................................. 38
5.4 Layer 3 Multicast IPv6 Throughput ................................................................................... 39
Figure 5.4.1: RFC 3918 Layer 3 IPv6 Multicast Throughput ................................................... 40
5.5 Layer 3 Multicast IPv6 Latency ........................................................................................ 41
Figure 5.5.1: RFC 3918 Layer 3 IPv6 Multicast Latency ........................................................ 42
5.6 Layer 3 Multicast IPv6 Frame Loss .................................................................................. 43
Figure 5.6.1: RFC 3918 Layer 3 IPv6 Multicast Frame Loss .................................................. 44
6.0 Scalability ................................................................................................................................ 45
6.1 Maximum Multicast MAC Entries ..................................................................................... 45
6.2 Scalability for Layer 3 Multicast IPv4 and IPv6 ................................................................. 46
6.3 Maximum Unicast MAC Entries ........................................................................................ 47
6.4 Layer 3 Maximum FIB Entries IPv4 and IPv6 ................................................................... 49
7.0 Flexible NetFlow Collection ..................................................................................................... 50
8.0 Wireshark Integration .............................................................................................................. 51
9.0 VSS Layer 2 Throughput, Latency and Frame Loss ................................................................ 52
Figure 9.1: VSS Layer 2 - Line Rate and End-to-End (3-hop) Average Latency ..................... 53
10.0 VSS Resiliency during MEC Link Failure ............................................................................... 55
11.0 Resiliency during VSS Active to Standby Switchover ............................................................ 57
12.0 Resiliency during ISSU .......................................................................................................... 58
13.0 SPAN Performance ............................................................................................................... 59
13.1 SPAN Diagram .............................................................................................................. 59
Cisco Catalyst 4500-X Page 4 DR121129 Copyright © 2013 Miercom 20June2013
1.0 Executive Summary
Cisco engaged Miercom to verify the performance, scalability, high availability, resiliency and advanced features of the Catalyst 4500-X aggregation switch. Overall, we were impressed with the capabilities and features exhibited by the switch. In addition to standard RFC 2544, 2889 and 3918 tests, Miercom conducted an evaluation of Cisco’s Virtual Switching System (VSS) which provides high availability, resiliency, increased operational efficiency with a single point of management, In Service Software Upgrade (ISSU) and double the system bandwidth with Multichassis EtherChannel (MEC). Miercom also validated the Flexible NetFlow, Wireshark integration and SPAN capabilities of the Catalyst 4500-X.
In VSS mode, the Catalyst 4500-X switch proved to achieve sub-second recovery time during a MEC failure and Active to Standby switchover. The VSS configuration also proved to have minimal down time during an ISSU.
Additionally, we were impressed with the scalability of the switch. A total of 47,000 ARP entries; 55,000 MAC addresses, 32,000 IP multicast group addresses, 32,000 IGMP group entries, 128,000 NetFlow entries, and up to 250,000 IPv4 FIB entries, or up to 125,000 IPv6 route entries are supported in hardware.
Network traffic analysis becomes an easy task with the support of Flexible NetFlow and Wireshark integration. Traffic analysis can be performed locally on the switch without having to use additional tools and analyzers. If an administrator prefers to analyze traffic with a third party tool, SPAN can be configured on the switch to mirror traffic out to another device. Eight simultaneous, bi-directional SPAN sessions were verified and performed at 80% line rate of 10 Gbps.
This report, sponsored by Cisco Systems, Inc., was produced with data obtained completely and independently as part of the Miercom Ethernet Switch Industry Assessment. The details of our results and findings are thoroughly discussed in this report.
Bottom line, Cisco has demonstrated that its Catalyst 4500-X aggregation switch provides excellent performance, scalability, high availability and resiliency.
Rob Smithers CEO Miercom
Cisco Catalyst 4500-X Page 5 DR121129 Copyright © 2013 Miercom 20June2013
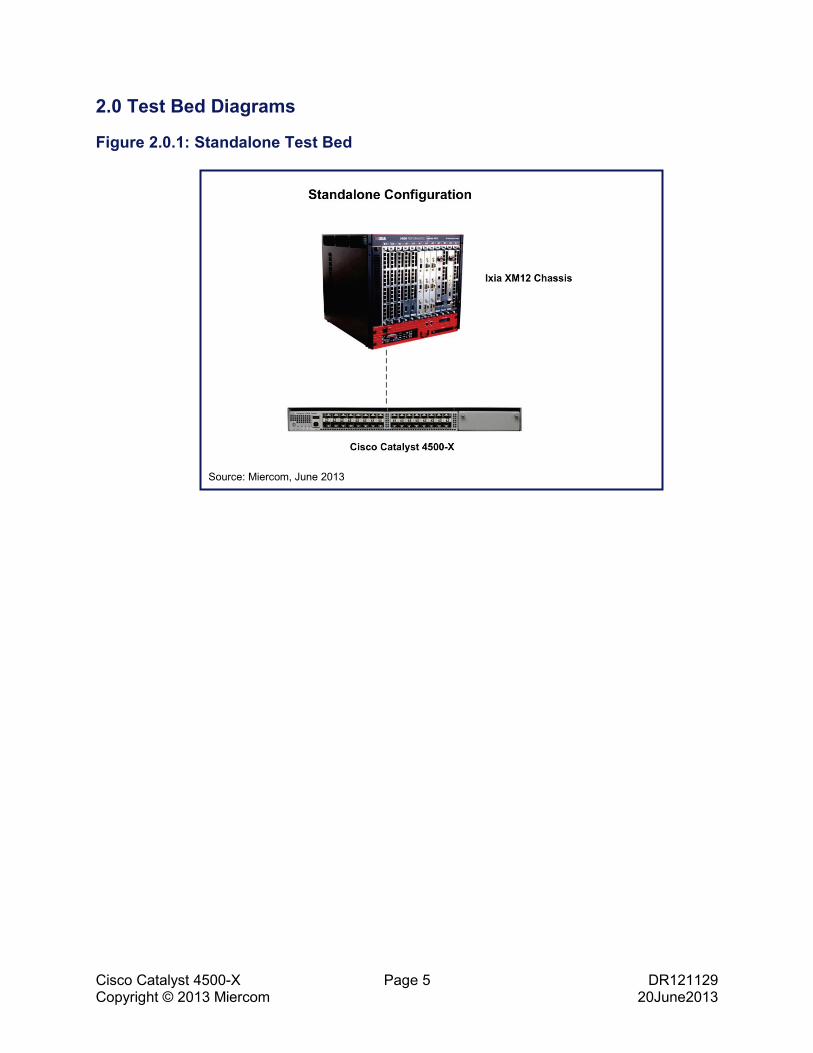
2.0 Test Bed Diagrams
Figure 2.0.1: Standalone Test Bed
Source: Miercom, June 2013
Cisco Catalyst 4500-X Page 6 DR121129 Copyright © 2013 Miercom 20June2013
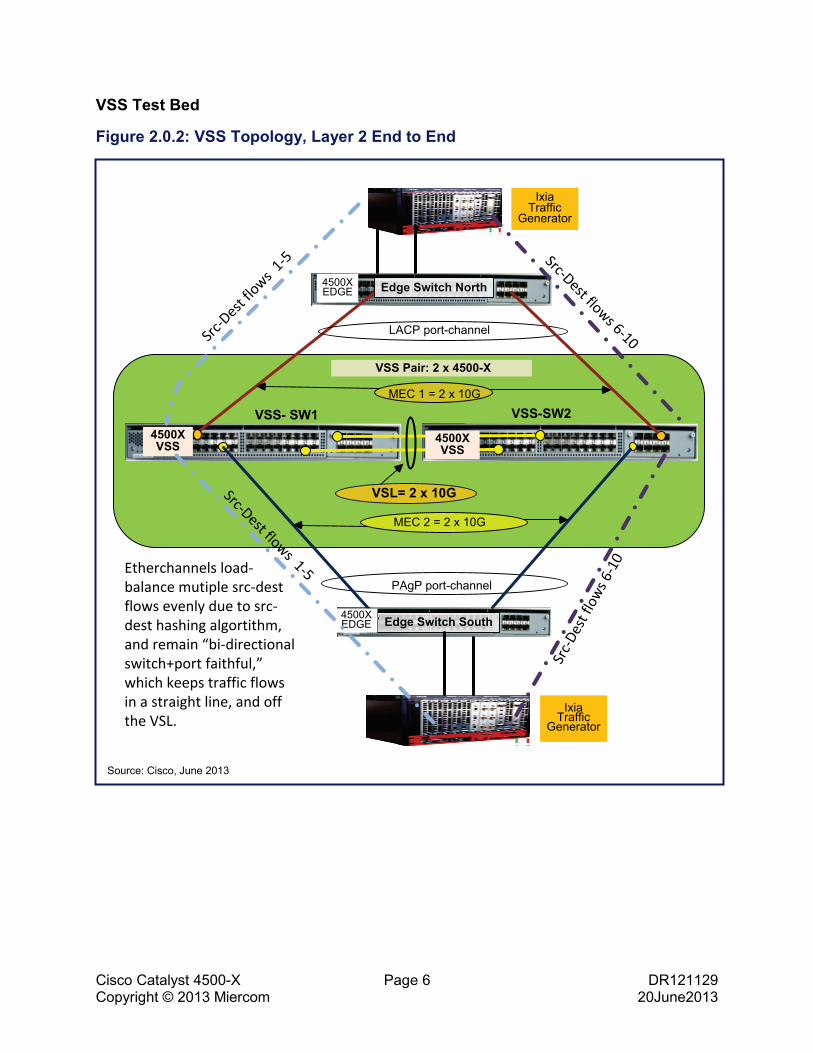
VSS Test Bed
Figure 2.0.2: VSS Topology, Layer 2 End to End
Source: Cisco, June 2013
MEC 1 = 2 x 10G
LACP port-channel
PAgP port-channel
Edge Switch North
Edge Switch South
IxiaTraffic
Generator
IxiaTraffic
Generator
VSS Pair: 2 x 4500-X
4500XVSS
VSS- SW1 VSS-SW2
VSL= 2 x 10G
MEC 2 = 2 x 10G
4500XEDGE
4500XVSS
4500XEDGE
Src-D
est flo
ws 1-5
Src-Dest flows 1-5Sr
c-Des
t flo
ws 6-1
0
Src-Dest flows 6-10
Etherchannels load-balance mutiple src-dest flows evenly due to src-dest hashing algortithm, and remain “bi-directional switch+port faithful,” which keeps traffic flows in a straight line, and off the VSL.
Cisco Catalyst 4500-X Page 7 DR121129 Copyright © 2013 Miercom 20June2013
VSS Topology
A Catalyst 4500-X VSS domain is formed when two standalone switches are configured to join the same virtual switch domain ID. While in standalone mode two adjoining ether channels are configured as “virtual links” that will form the Virtual Switch Link (VSL) after conversion to “mode virtual.” Once both standalone switches are rebooted and converted to a VSS, the two switches are then managed and configured on the active switch only, and act as if all the ports and trunks are on one switch.
The only CLI change is that all the ports and interfaces in a VSS are prepended with their physical switch number (1 or 2). For example, interface ten1/1/1 represents the TenGig interface 1/1 on switch-1 and the interface ten2/1/1 represents the TenGig interface 1/1 on switch-2, but act as though they were on the same physical switch.
In order to recreate a more realistic network test bed, we used two more Catalyst 4500-X switches as the “North” and “South” edge switches to a) split the test traffic across the multichassis ether channels (see Figure 2.0.2 VSS Topology), and b) to have consistent per-switch forwarding characteristics on each switch hop, to help correlate latency across the 3-hop network.
2.1 How We Did It
Testing was performed on the Catalyst 4500-X 40-Port model switch running version IOS XE 03.04.00.SG and ROMmon (bootrom) version IOS 15.0(1r)SG7.
Testing was conducted in two phases.
First-phase testing used a single Catalyst 4500-X in standalone mode (see Figure 2.0.1 Standalone Test Bed).
The second phase used two Catalyst 4500-Xs joined in a Virtual Switching System (VSS), plus two additional 4500-Xs acting as edge switches, forming a VSS configuration, as shown in Figure 2.0.2.
Standalone mode tests included industry standard RFC 2544, RFC 2889, and RFC 3918. Other tests on performance, scalability and features included maximum MAC entries, maximum Forwarding Information Base (FIB) entries, Flexible NetFlow, Wireshark integration, and Switched Port Analyzer (SPAN) capability.
RFC 2544 and 2889 were conducted to verify bi-directional Layer 2 and Layer 3 throughput, latency, and frame loss for frame/packet sizes 64, 128, 256, 512, 1024, 1280, and 1518-bytes. The RFC 2544 and 2889 methodologies were run on the Catalyst 4500-X using 40 10Gb SFP+ ports outfitted with 10Gb SFP+ SR optics. Additionally the RFC 3918 test methodology was conducted to validate multicast throughput, latency and frame loss. The RFC 3918 test methodology was run using 40 10Gb fiber transceivers.
The Catalyst 4500-X 32-port model supports 32 1 Gb/10Gb SFP/SFP+ ports plus an optional 8 port expansion module that also has 8 SFP/SFP+ ports, providing a total of 40 1 Gb/10GE SFP/SFP+ switching ports. All switching ports are SFP/SFP+ and require Cisco-certified 1Gb or 10Gb transceivers. The Catalyst 4500-X also supports 1Gb copper transceivers, 10Gb Twinax and a variety of SFP and SFP+ short and long-range optics.
Cisco Catalyst 4500-X Page 8 DR121129 Copyright © 2013 Miercom 20June2013
Ixia (www.ixiacom.com) is an industry leader in performance testing of networking equipment. Ixia’s unique approach utilizes coordination of energy measurements with network traffic load – allowing energy consumption to be graphed against network traffic volume. Real-world traffic is generated by Ixia’s test platform and test applications, principally IxAutomate for layer 2-3 switching and routing traffic.
The tests in this report are intended to be reproducible for customers who wish to recreate them with the appropriate test and measurement equipment. Current or prospective customers interested in repeating these results may contact [email protected] for details on the configurations applied to the Device Under Test (DUT) and test tools used in this evaluation. Miercom recommends customers conduct their own needs analysis study and test specifically for the expected environment for product deployment before making a product selection.
Cisco Catalyst 4500-X Page 9 DR121129 Copyright © 2013 Miercom 20June2013
3.0 RFC 2544 RFC 2544 defines how to benchmark the data plane performance of networking devices. Ixia has a benchmark suite covering RFC 2544 which uses several tests to obtain the performance data for a networking device. Metrics of the test suite include throughput, latency, and frame loss for Layer 2 and Layer 3 IPv4 and IPv6.
3.1 Layer 2 Throughput
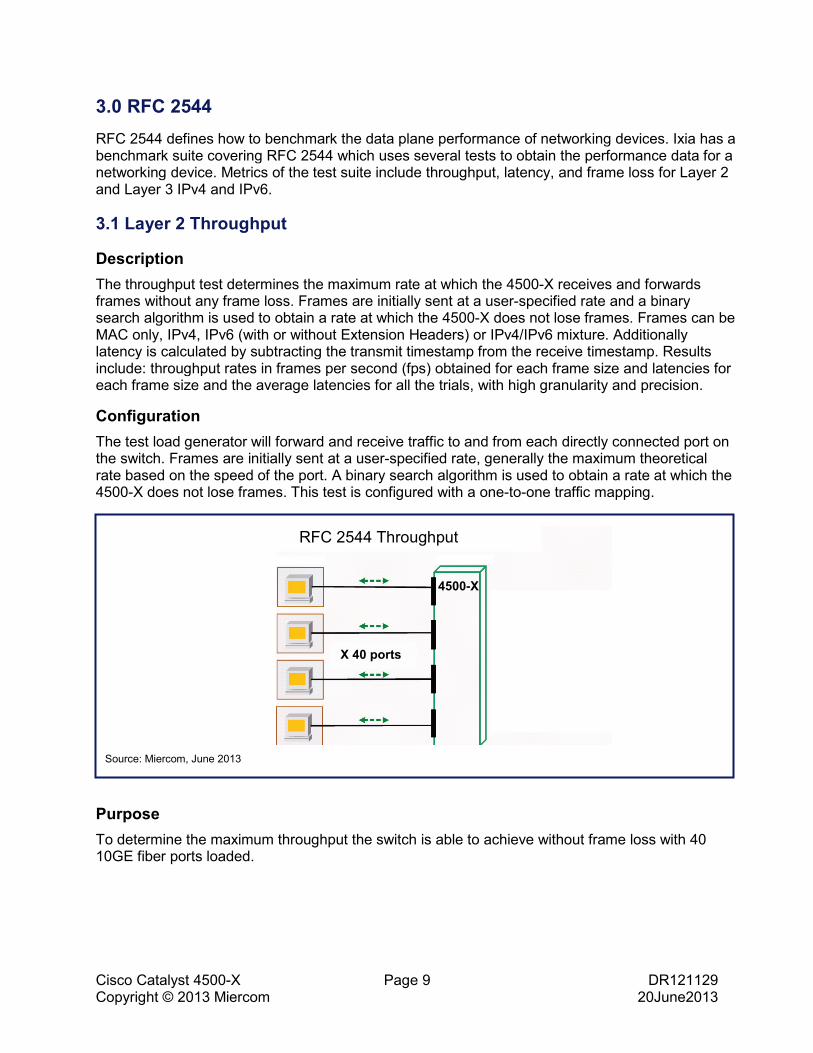
Description The throughput test determines the maximum rate at which the 4500-X receives and forwards frames without any frame loss. Frames are initially sent at a user-specified rate and a binary search algorithm is used to obtain a rate at which the 4500-X does not lose frames. Frames can be MAC only, IPv4, IPv6 (with or without Extension Headers) or IPv4/IPv6 mixture. Additionally latency is calculated by subtracting the transmit timestamp from the receive timestamp. Results include: throughput rates in frames per second (fps) obtained for each frame size and latencies for each frame size and the average latencies for all the trials, with high granularity and precision.
Configuration The test load generator will forward and receive traffic to and from each directly connected port on the switch. Frames are initially sent at a user-specified rate, generally the maximum theoretical rate based on the speed of the port. A binary search algorithm is used to obtain a rate at which the 4500-X does not lose frames. This test is configured with a one-to-one traffic mapping.
Purpose To determine the maximum throughput the switch is able to achieve without frame loss with 40 10GE fiber ports loaded.
Source: Miercom, June 2013
X 40 ports
Packet Length
RFC 2544 Throughput
4500-X

Cisco Catalyst 4500-X Page 10 DR121129 Copyright © 2013 Miercom 20June2013
Observation The Cisco Catalyst 4500-X forwarded Layer 2 fames at 100% of line rate for frame sizes of 256-byte and longer. For short frames, specifically 64-byte and 128-byte frames, the 4500-X forwarded 100% of its maximum frame forwarding rate of 250Mpps, which on a 10Gbps link equates to 41.6% and 73.3% of line rate throughput, respectively.
Figure 3.1.1: RFC 2544 Layer 2 Throughput
In all of the above Layer 2 throughput test cases, the Catalyst 4500-X forwarded all Layer 2 frames with 0% frame loss.
100 100 100 100 100
0102030405060708090
100
256 512 1024 1280 1518
Inte
rfac
e B
andw
idth
(%)
Frame Size (Bytes)Source: Miercom, June 2013
Cisco Catalyst 4500-X Page 11 DR121129 Copyright © 2013 Miercom 20June2013
3.2 Layer 2 Latency
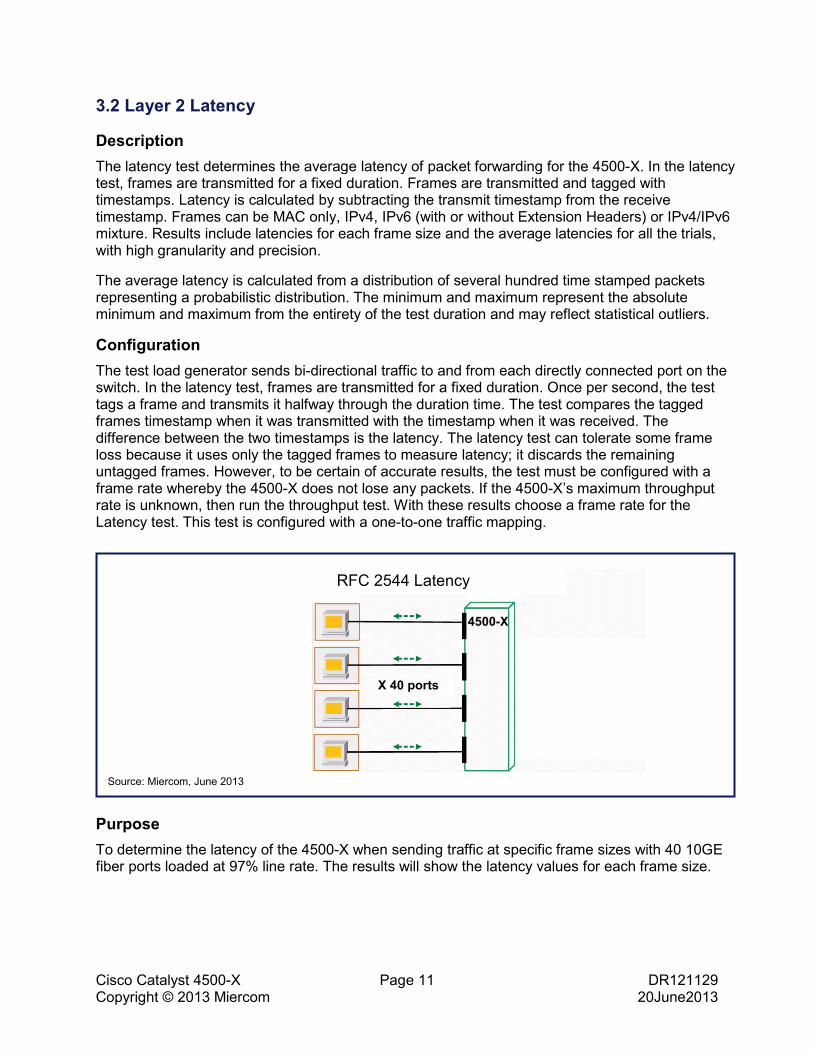
Description The latency test determines the average latency of packet forwarding for the 4500-X. In the latency test, frames are transmitted for a fixed duration. Frames are transmitted and tagged with timestamps. Latency is calculated by subtracting the transmit timestamp from the receive timestamp. Frames can be MAC only, IPv4, IPv6 (with or without Extension Headers) or IPv4/IPv6 mixture. Results include latencies for each frame size and the average latencies for all the trials, with high granularity and precision.
The average latency is calculated from a distribution of several hundred time stamped packets representing a probabilistic distribution. The minimum and maximum represent the absolute minimum and maximum from the entirety of the test duration and may reflect statistical outliers.
Configuration The test load generator sends bi-directional traffic to and from each directly connected port on the switch. In the latency test, frames are transmitted for a fixed duration. Once per second, the test tags a frame and transmits it halfway through the duration time. The test compares the tagged frames timestamp when it was transmitted with the timestamp when it was received. The difference between the two timestamps is the latency. The latency test can tolerate some frame loss because it uses only the tagged frames to measure latency; it discards the remaining untagged frames. However, to be certain of accurate results, the test must be configured with a frame rate whereby the 4500-X does not lose any packets. If the 4500-X’s maximum throughput rate is unknown, then run the throughput test. With these results choose a frame rate for the Latency test. This test is configured with a one-to-one traffic mapping.
Purpose To determine the latency of the 4500-X when sending traffic at specific frame sizes with 40 10GE fiber ports loaded at 97% line rate. The results will show the latency values for each frame size.
Source: Miercom, June 2013
RFC 2544 Latency
X 40 ports
4500-X
Cisco Catalyst 4500-X Page 12 DR121129 Copyright © 2013 Miercom 20June2013
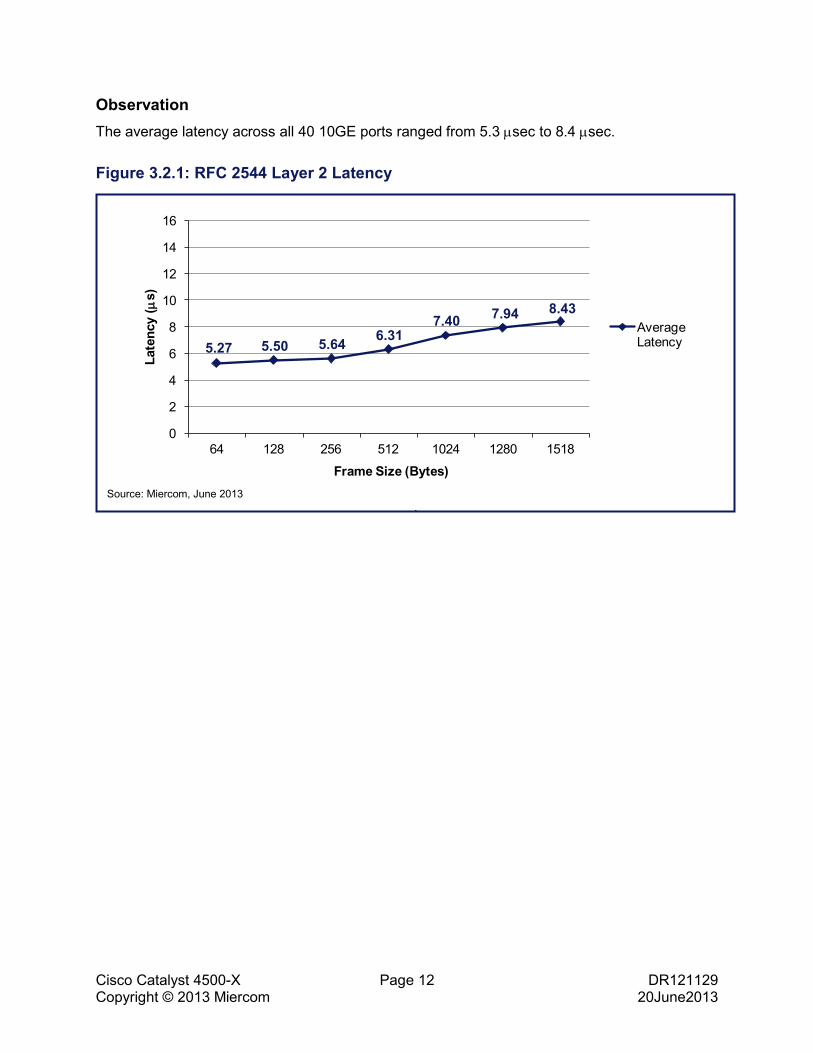
Observation The average latency across all 40 10GE ports ranged from 5.3 µsec to 8.4 µsec.
Figure 3.2.1: RFC 2544 Layer 2 Latency
.
Source: Miercom, June 2013
5.27 5.50 5.64 6.317.40 7.94 8.43
0
2
4
6
8
10
12
14
16
64 128 256 512 1024 1280 1518
Late
ncy
(µs)
Frame Size (Bytes)
Average Latency
Cisco Catalyst 4500-X Page 13 DR121129 Copyright © 2013 Miercom 20June2013
3.3 Layer 2 Frame Loss
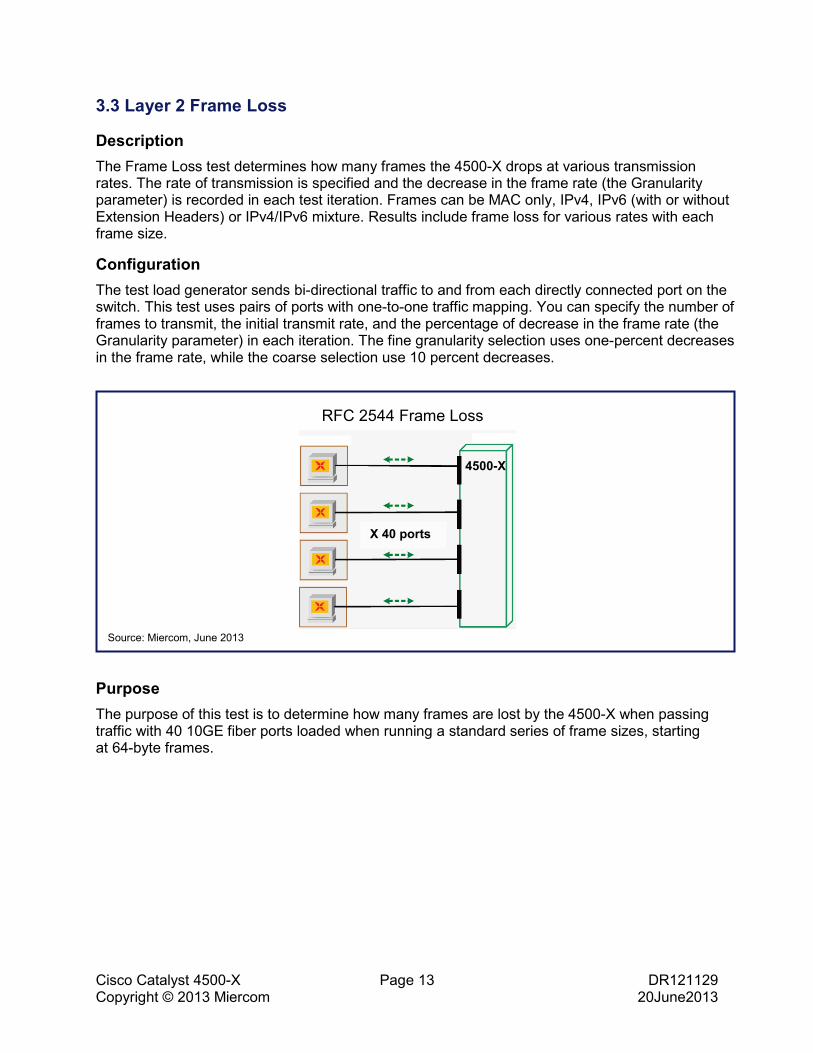
Description The Frame Loss test determines how many frames the 4500-X drops at various transmission rates. The rate of transmission is specified and the decrease in the frame rate (the Granularity parameter) is recorded in each test iteration. Frames can be MAC only, IPv4, IPv6 (with or without Extension Headers) or IPv4/IPv6 mixture. Results include frame loss for various rates with each frame size.
Configuration The test load generator sends bi-directional traffic to and from each directly connected port on the switch. This test uses pairs of ports with one-to-one traffic mapping. You can specify the number of frames to transmit, the initial transmit rate, and the percentage of decrease in the frame rate (the Granularity parameter) in each iteration. The fine granularity selection uses one-percent decreases in the frame rate, while the coarse selection use 10 percent decreases.
Purpose The purpose of this test is to determine how many frames are lost by the 4500-X when passing traffic with 40 10GE fiber ports loaded when running a standard series of frame sizes, starting at 64-byte frames.
Source: Miercom, June 2013
RFC 2544 Frame Loss
4500-X
X 40 ports
Cisco Catalyst 4500-X Page 14 DR121129 Copyright © 2013 Miercom 20June2013
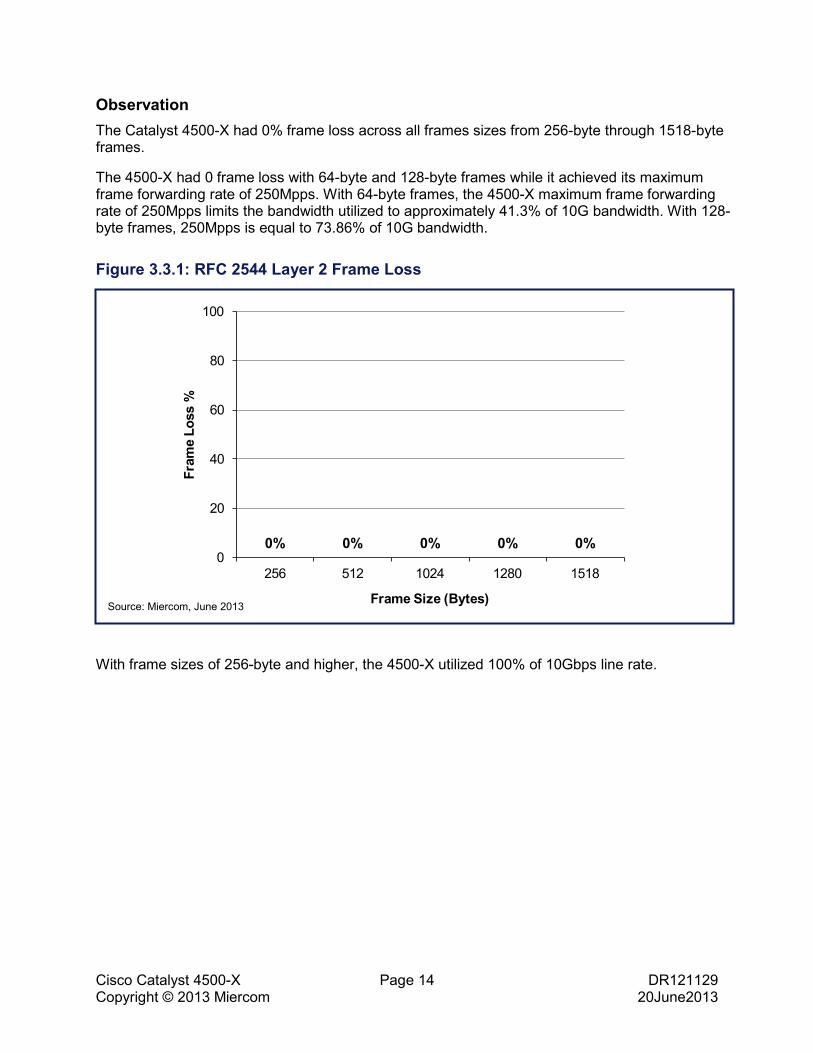
Observation The Catalyst 4500-X had 0% frame loss across all frames sizes from 256-byte through 1518-byte frames.
The 4500-X had 0 frame loss with 64-byte and 128-byte frames while it achieved its maximum frame forwarding rate of 250Mpps. With 64-byte frames, the 4500-X maximum frame forwarding rate of 250Mpps limits the bandwidth utilized to approximately 41.3% of 10G bandwidth. With 128-byte frames, 250Mpps is equal to 73.86% of 10G bandwidth.
Figure 3.3.1: RFC 2544 Layer 2 Frame Loss
With frame sizes of 256-byte and higher, the 4500-X utilized 100% of 10Gbps line rate.
0% 0% 0% 0% 0%0
20
40
60
80
100
256 512 1024 1280 1518
Fram
e Lo
ss %
Frame Size (Bytes)Source: Miercom, June 2013

Cisco Catalyst 4500-X Page 15 DR121129 Copyright © 2013 Miercom 20June2013
3.4 Layer 3 IPv4 Throughput
Description The throughput test determines the maximum rate at which the 4500-X receives and forwards frames without any frame loss. Frames are initially sent at a user-specified rate and a binary search algorithm is used to obtain a rate at which the 4500-X does not lose frames. Frames can be MAC only, IPv4, IPv6 (with or without Extension Headers) or IPv4/IPv6 mixture. Additionally latency is calculated by subtracting the transmit timestamp from the receive timestamp. Results include: throughput rates in frames per second obtained for each frame size and latencies for each frame size and the average latencies for all the trials, with high granularity and precision.
Configuration The test load generator will forward and receive traffic to and from each directly connected port on the switch. Frames are initially sent at a user-specified rate, generally the maximum theoretical rate based on the speed of the port. A binary search algorithm is used to obtain a rate at which the 4500-X does not lose frames. This test is configured with a one-to-one traffic mapping.
Purpose To determine the maximum throughput the switch is able to achieve without frame loss with 40 10 GE fiber ports loaded when running a standard series of frame sizes, starting at 64-byte frames.
Source: Miercom, June 2013
RFC 2544 Throughput
4500-X
X 40 ports

Cisco Catalyst 4500-X Page 16 DR121129 Copyright © 2013 Miercom 20June2013
Observation The Cisco Catalyst 4500-X achieved 100% of 10Gbps line rate for packet sizes of 256-byte and higher.
For smaller IPv4 packets, specifically 64-byte and 128-byte packets, the 4500-X reached 100% of its maximum packet forwarding rate of 250Mpps, which, on a 10G link, equates to 41.6% and 73.3% line rate throughput, respectively.
Figure 3.4.1: RFC 2544 Layer 3 Throughput – Unicast IPv4
In all of the above throughput test cases, the Cat4500-X performed consistently with 0% packet loss.
100 100 100 100 100
0102030405060708090
100
256 512 1024 1280 1518
Inte
rfac
e B
andw
idth
(%)
Frame Size (Bytes)Source: Miercom, June 2013
Cisco Catalyst 4500-X Page 17 DR121129 Copyright © 2013 Miercom 20June2013
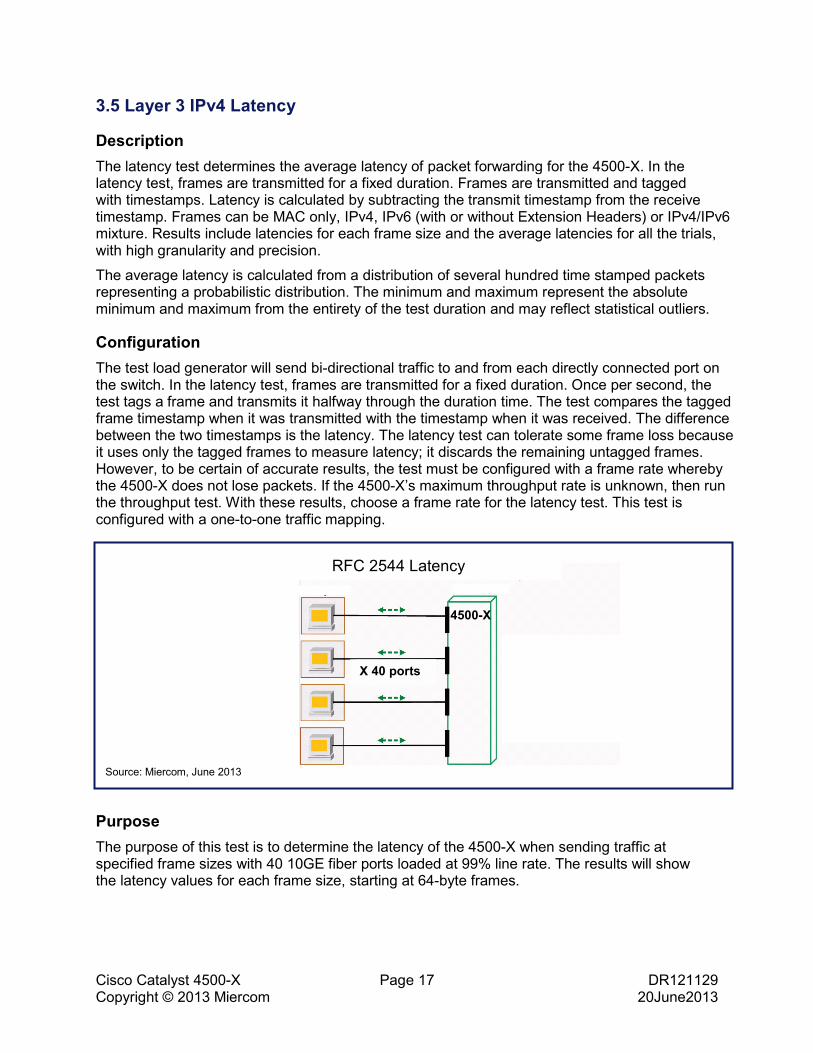
3.5 Layer 3 IPv4 Latency
Description The latency test determines the average latency of packet forwarding for the 4500-X. In the latency test, frames are transmitted for a fixed duration. Frames are transmitted and tagged with timestamps. Latency is calculated by subtracting the transmit timestamp from the receive timestamp. Frames can be MAC only, IPv4, IPv6 (with or without Extension Headers) or IPv4/IPv6 mixture. Results include latencies for each frame size and the average latencies for all the trials, with high granularity and precision.
The average latency is calculated from a distribution of several hundred time stamped packets representing a probabilistic distribution. The minimum and maximum represent the absolute minimum and maximum from the entirety of the test duration and may reflect statistical outliers.
Configuration The test load generator will send bi-directional traffic to and from each directly connected port on the switch. In the latency test, frames are transmitted for a fixed duration. Once per second, the test tags a frame and transmits it halfway through the duration time. The test compares the tagged frame timestamp when it was transmitted with the timestamp when it was received. The difference between the two timestamps is the latency. The latency test can tolerate some frame loss because it uses only the tagged frames to measure latency; it discards the remaining untagged frames. However, to be certain of accurate results, the test must be configured with a frame rate whereby the 4500-X does not lose packets. If the 4500-X’s maximum throughput rate is unknown, then run the throughput test. With these results, choose a frame rate for the latency test. This test is configured with a one-to-one traffic mapping.
Purpose The purpose of this test is to determine the latency of the 4500-X when sending traffic at specified frame sizes with 40 10GE fiber ports loaded at 99% line rate. The results will show the latency values for each frame size, starting at 64-byte frames.
Source: Miercom, June 2013
RFC 2544 Latency
4500-X
X 40 ports

Cisco Catalyst 4500-X Page 18 DR121129 Copyright © 2013 Miercom 20June2013
Observation The average latency across all 40 10GE ports ranged from 4.7 μsec to 7.1 μsec. The average latency is calculated by using thousands of time stamped frames.
The following port-to-port L3 latency numbers were observed using 99% line rate: IPv4 One-to-One Latency on 40-port 10G test setup.
Figure 3.5.1: RFC 2544 Layer 3 Latency – Unicast IPv4
The latency results illustrate the minimum, maximum and average latency across all ports (10GE). The ports were paired up as 1/1 – 1/2, 1/3-1/4…1/27 – 1/28 and 1/29 – 1/30,…1/39-1/40.
Source: Miercom, June 2013
4.694.89
5.29
5.76
6.456.77
7.08
4.0
4.5
5.0
5.5
6.0
6.5
7.0
7.5
8.0
64 128 256 512 1024 1280 1518
Late
ncy
(µs)
Frame Size (Bytes)
Average Latency

Cisco Catalyst 4500-X Page 19 DR121129 Copyright © 2013 Miercom 20June2013
3.6 Layer 3 IPv4 Frame Loss
Description The Packet Loss test determines if any or how many packets the 4500-X loses at various transmission rates. The rate of transmission is specified and the decrease in the frame rate (the Granularity parameter) is recorded in each test iteration. Frames can be MAC only, IPv4, IPv6 (with or without Extension Headers) or IPv4/IPv6 mixture. Results include frame loss for various rates with each frame size.
Configuration The test load generator will send bi-directional traffic to and from each directly connected port on the switch. This test uses pairs of ports with one-to-one traffic mapping. You can specify the number of frames to transmit, the initial transmit rate, and the percentage of decrease in the frame rate (the Granularity parameter) in each iteration for ach packet size tested. The fine granularity selection uses one-percent decreases in the frame rate, while the coarse selection use 10 percent decreases.
Purpose The purpose of this test is to determine how many frames, if any, the 4500-X loses when passing traffic with 40 10GE fiber ports loaded when running a standard series of frame sizes, starting at 64-byte frames.
Source: Miercom, June 2013
RFC 2544 Frame Loss
4500-X
X 40 ports
Cisco Catalyst 4500-X Page 20 DR121129 Copyright © 2013 Miercom 20June2013
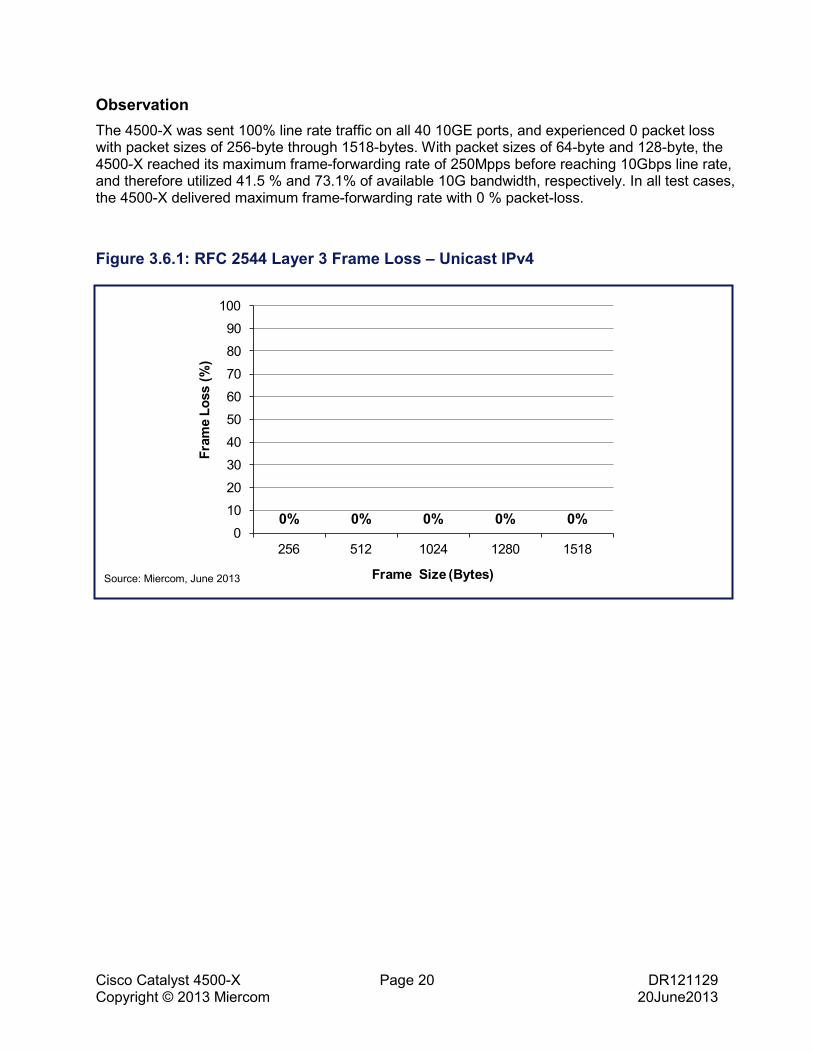
Observation The 4500-X was sent 100% line rate traffic on all 40 10GE ports, and experienced 0 packet loss with packet sizes of 256-byte through 1518-bytes. With packet sizes of 64-byte and 128-byte, the 4500-X reached its maximum frame-forwarding rate of 250Mpps before reaching 10Gbps line rate, and therefore utilized 41.5 % and 73.1% of available 10G bandwidth, respectively. In all test cases, the 4500-X delivered maximum frame-forwarding rate with 0 % packet-loss.
Figure 3.6.1: RFC 2544 Layer 3 Frame Loss – Unicast IPv4
0% 0% 0% 0% 0%0
10
20
30
40
50
60
70
80
90
100
256 512 1024 1280 1518
Fram
e Lo
ss (%
)
Frame Size (Bytes)Source: Miercom, June 2013
Cisco Catalyst 4500-X Page 21 DR121129 Copyright © 2013 Miercom 20June2013
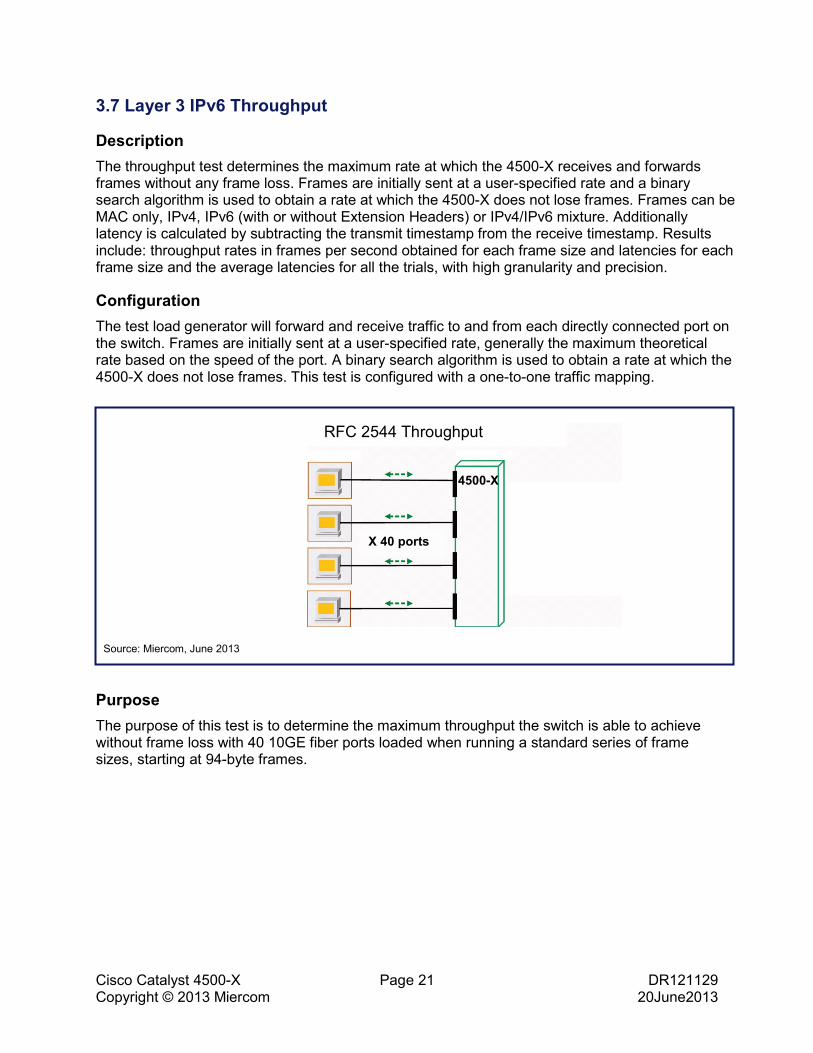
3.7 Layer 3 IPv6 Throughput
Description The throughput test determines the maximum rate at which the 4500-X receives and forwards frames without any frame loss. Frames are initially sent at a user-specified rate and a binary search algorithm is used to obtain a rate at which the 4500-X does not lose frames. Frames can be MAC only, IPv4, IPv6 (with or without Extension Headers) or IPv4/IPv6 mixture. Additionally latency is calculated by subtracting the transmit timestamp from the receive timestamp. Results include: throughput rates in frames per second obtained for each frame size and latencies for each frame size and the average latencies for all the trials, with high granularity and precision.
Configuration The test load generator will forward and receive traffic to and from each directly connected port on the switch. Frames are initially sent at a user-specified rate, generally the maximum theoretical rate based on the speed of the port. A binary search algorithm is used to obtain a rate at which the 4500-X does not lose frames. This test is configured with a one-to-one traffic mapping.
Purpose The purpose of this test is to determine the maximum throughput the switch is able to achieve without frame loss with 40 10GE fiber ports loaded when running a standard series of frame sizes, starting at 94-byte frames.
Source: Miercom, June 2013
RFC 2544 Throughput
4500-X
X 40 ports
Cisco Catalyst 4500-X Page 22 DR121129 Copyright © 2013 Miercom 20June2013
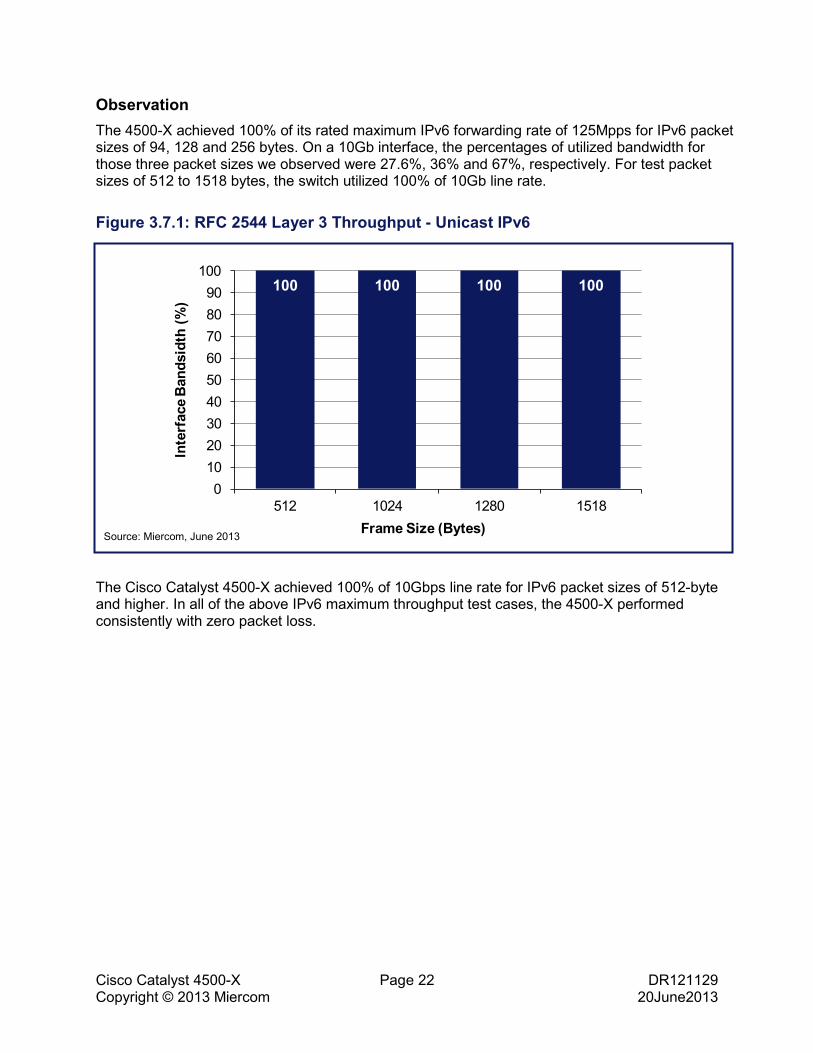
Observation The 4500-X achieved 100% of its rated maximum IPv6 forwarding rate of 125Mpps for IPv6 packet sizes of 94, 128 and 256 bytes. On a 10Gb interface, the percentages of utilized bandwidth for those three packet sizes we observed were 27.6%, 36% and 67%, respectively. For test packet sizes of 512 to 1518 bytes, the switch utilized 100% of 10Gb line rate.
Figure 3.7.1: RFC 2544 Layer 3 Throughput - Unicast IPv6
The Cisco Catalyst 4500-X achieved 100% of 10Gbps line rate for IPv6 packet sizes of 512-byte and higher. In all of the above IPv6 maximum throughput test cases, the 4500-X performed consistently with zero packet loss.
100 100 100 100
0102030405060708090
100
512 1024 1280 1518
Inte
rfac
e B
ands
idth
(%)
Frame Size (Bytes)Source: Miercom, June 2013
Cisco Catalyst 4500-X Page 23 DR121129 Copyright © 2013 Miercom 20June2013
3.8 Layer 3 IPv6 Latency
Description The latency test determines the average latency of packet forwarding for the 4500-X. In the latency test, frames are transmitted for a fixed duration. Frames are transmitted and tagged with timestamps. Latency is calculated by subtracting the transmit timestamp from the receive timestamp. Frames can be MAC only, IPv4, IPv6 (with or without Extension Headers) or IPv4/IPv6 mixture. Results include latencies for each frame size and the average latencies for all the trials, with high granularity and precision.
The average latency is calculated from a distribution of several hundred time stamped packets representing a probabilistic distribution. The minimum and maximum represent the absolute minimum and maximum from the entirety of the test duration and may reflect statistical outliers.
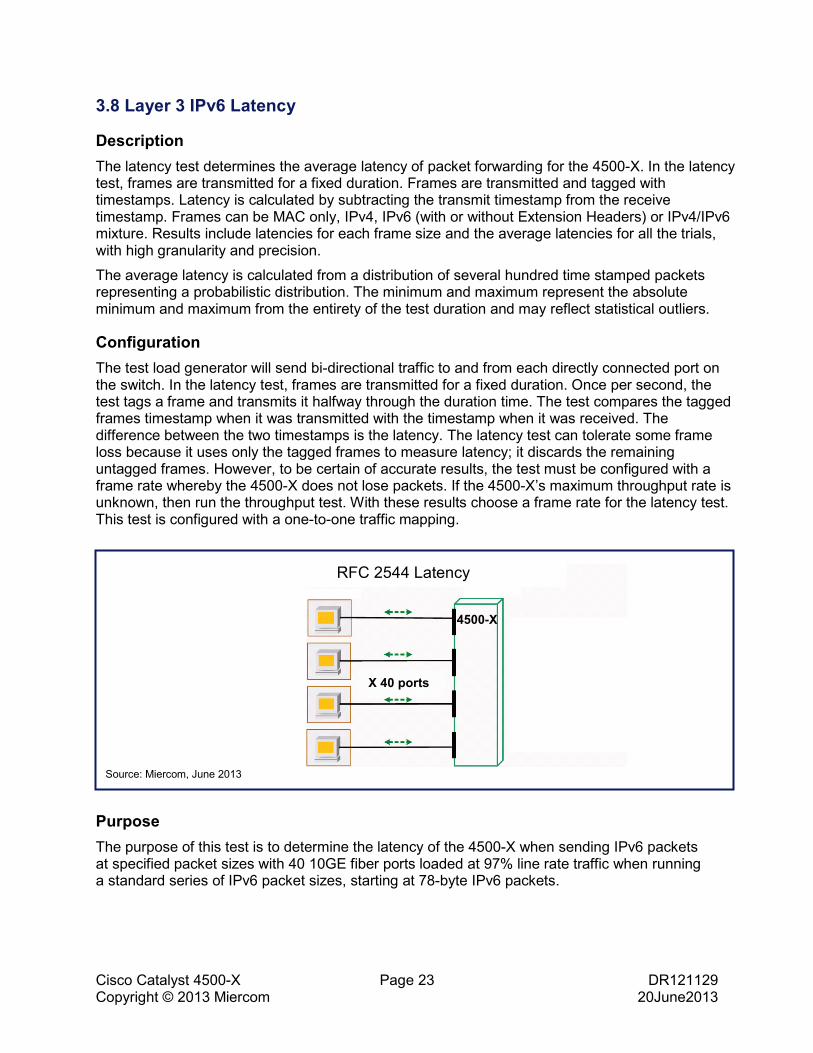
Configuration The test load generator will send bi-directional traffic to and from each directly connected port on the switch. In the latency test, frames are transmitted for a fixed duration. Once per second, the test tags a frame and transmits it halfway through the duration time. The test compares the tagged frames timestamp when it was transmitted with the timestamp when it was received. The difference between the two timestamps is the latency. The latency test can tolerate some frame loss because it uses only the tagged frames to measure latency; it discards the remaining untagged frames. However, to be certain of accurate results, the test must be configured with a frame rate whereby the 4500-X does not lose packets. If the 4500-X’s maximum throughput rate is unknown, then run the throughput test. With these results choose a frame rate for the latency test. This test is configured with a one-to-one traffic mapping.
Purpose The purpose of this test is to determine the latency of the 4500-X when sending IPv6 packets at specified packet sizes with 40 10GE fiber ports loaded at 97% line rate traffic when running a standard series of IPv6 packet sizes, starting at 78-byte IPv6 packets.
Source: Miercom, June 2013
RFC 2544 Latency
4500-X
X 40 ports
Cisco Catalyst 4500-X Page 24 DR121129 Copyright © 2013 Miercom 20June2013
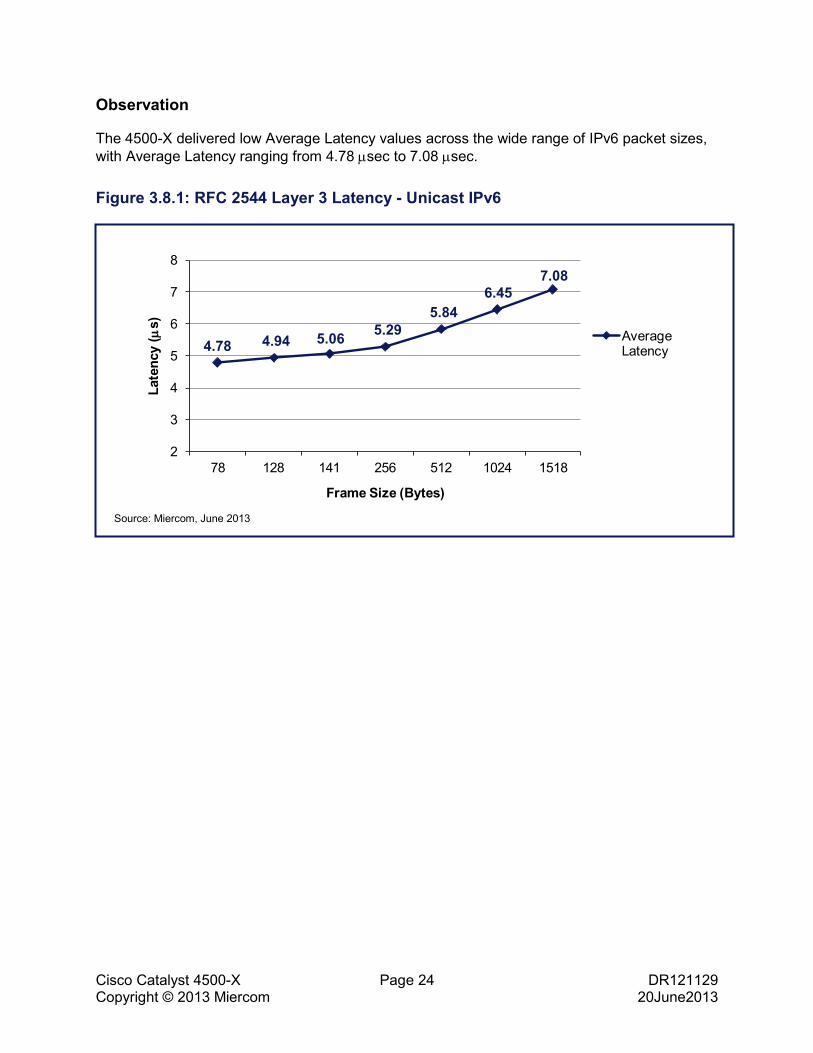
Observation
The 4500-X delivered low Average Latency values across the wide range of IPv6 packet sizes, with Average Latency ranging from 4.78 µsec to 7.08 µsec.
Figure 3.8.1: RFC 2544 Layer 3 Latency - Unicast IPv6
4.78 4.94 5.06 5.295.84
6.457.08
2
3
4
5
6
7
8
78 128 141 256 512 1024 1518
Late
ncy
(µs)
Frame Size (Bytes)
Average Latency
Source: Miercom, June 2013
Cisco Catalyst 4500-X Page 25 DR121129 Copyright © 2013 Miercom 20June2013
3.9 Layer 3 IPv6 Frame Loss
Description The Frame Loss test determines how many frames the 4500-X loses at various transmission rates. The rate of transmission is specified and the decrease in the frame rate (the Granularity parameter) is recorded for each test iteration. Frames can be MAC only, IPv4, IPv6 (with or without Extension Headers) or IPv4/IPv6 mixture. Results include frame loss for various rates with each frame size.
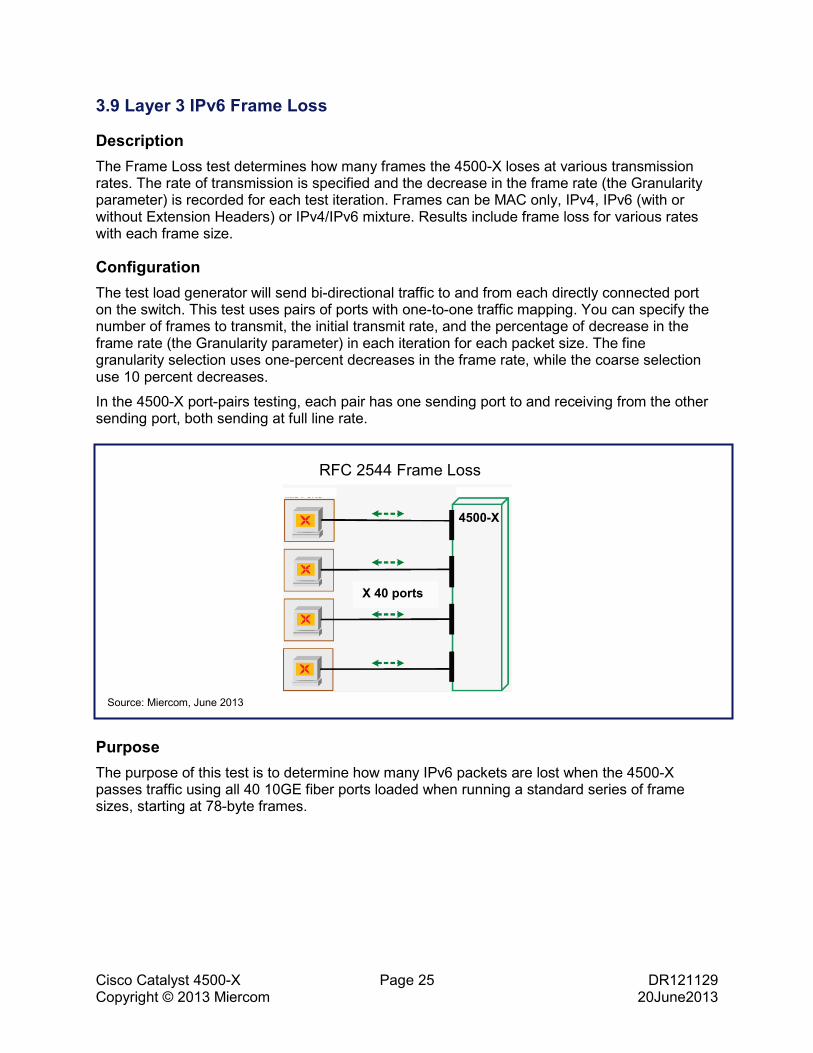
Configuration The test load generator will send bi-directional traffic to and from each directly connected port on the switch. This test uses pairs of ports with one-to-one traffic mapping. You can specify the number of frames to transmit, the initial transmit rate, and the percentage of decrease in the frame rate (the Granularity parameter) in each iteration for each packet size. The fine granularity selection uses one-percent decreases in the frame rate, while the coarse selection use 10 percent decreases.
In the 4500-X port-pairs testing, each pair has one sending port to and receiving from the other sending port, both sending at full line rate.
Purpose The purpose of this test is to determine how many IPv6 packets are lost when the 4500-X passes traffic using all 40 10GE fiber ports loaded when running a standard series of frame sizes, starting at 78-byte frames.
Source: Miercom, June 2013
RFC 2544 Frame Loss
4500-X
X 40 ports
Cisco Catalyst 4500-X Page 26 DR121129 Copyright © 2013 Miercom 20June2013
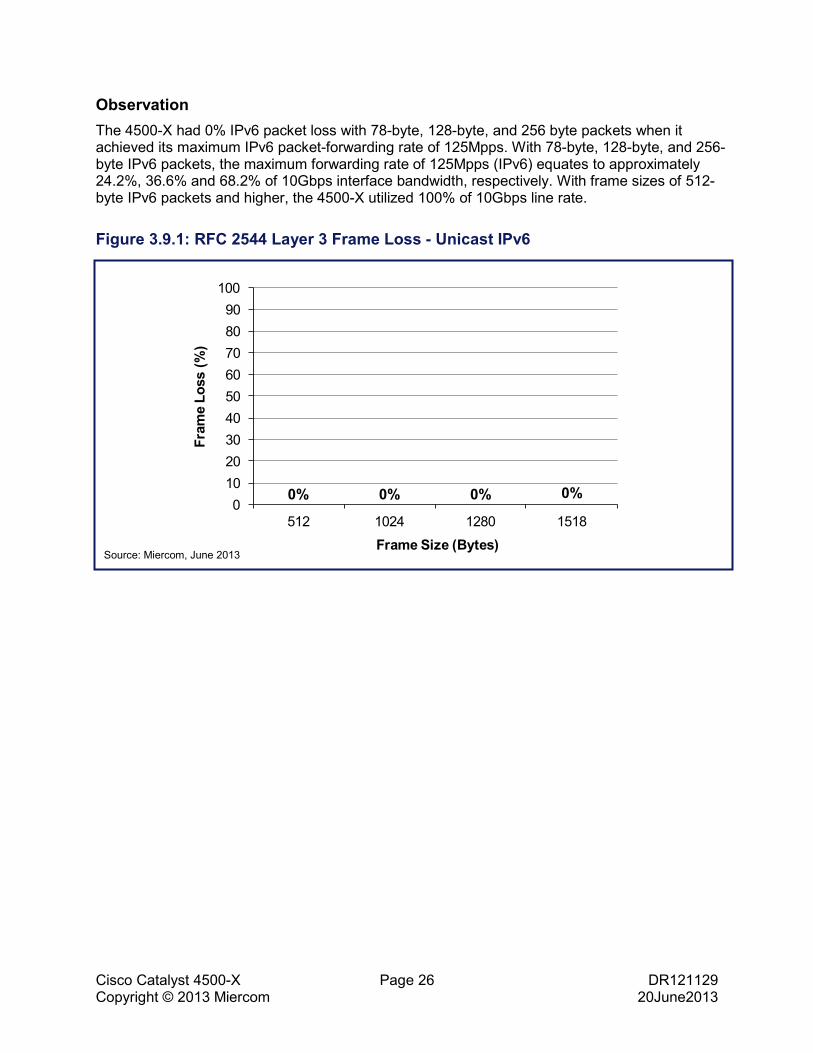
Observation The 4500-X had 0% IPv6 packet loss with 78-byte, 128-byte, and 256 byte packets when it achieved its maximum IPv6 packet-forwarding rate of 125Mpps. With 78-byte, 128-byte, and 256-byte IPv6 packets, the maximum forwarding rate of 125Mpps (IPv6) equates to approximately 24.2%, 36.6% and 68.2% of 10Gbps interface bandwidth, respectively. With frame sizes of 512-byte IPv6 packets and higher, the 4500-X utilized 100% of 10Gbps line rate.
Figure 3.9.1: RFC 2544 Layer 3 Frame Loss - Unicast IPv6
0% 0% 0% 0%0
102030405060708090
100
512 1024 1280 1518
Fram
e Lo
ss (%
)
Frame Size (Bytes)Source: Miercom, June 2013

Cisco Catalyst 4500-X Page 27 DR121129 Copyright © 2013 Miercom 20June2013
4.0 RFC 2889
Performance testing was conducted in accordance with RFC 2889 and consisted of loading each switch with traffic in a full mesh configuration. In this test, all interfaces are transmitting to and receiving from each other. Each port out of “N” ports sends bidirectional traffic to the rest of “N-1” ports in round robin fashion, with no two ports sending traffic to a single port at the same time.
Testing was conducted for 64-byte, 128-byte, 256-byte, 512-byte, 1024-byte, 1280-byte and 1518-byte frame sizes. Switch performance metrics recorded for this testing included the maximum throughput, observed frame loss and latency.
4.1 Layer 2 Full Mesh Throughput
Description The full mesh throughput test verifies cross processor throughput. Each port on the traffic generator sends traffic to the 4500-X, while receiving traffic from other ports, as shown in the following diagram.
Configuration
Purpose
The purpose of this test is to determine the maximum throughput the switch is capable of without any frame loss with 40 10GE fiber ports loaded when running a standard series of frame sizes, starting at 64-byte frames.
Source: Miercom, June 2013
RFC 2889 Throughput
4500-X
X 40 ports
Cisco Catalyst 4500-X Page 28 DR121129 Copyright © 2013 Miercom 20June2013
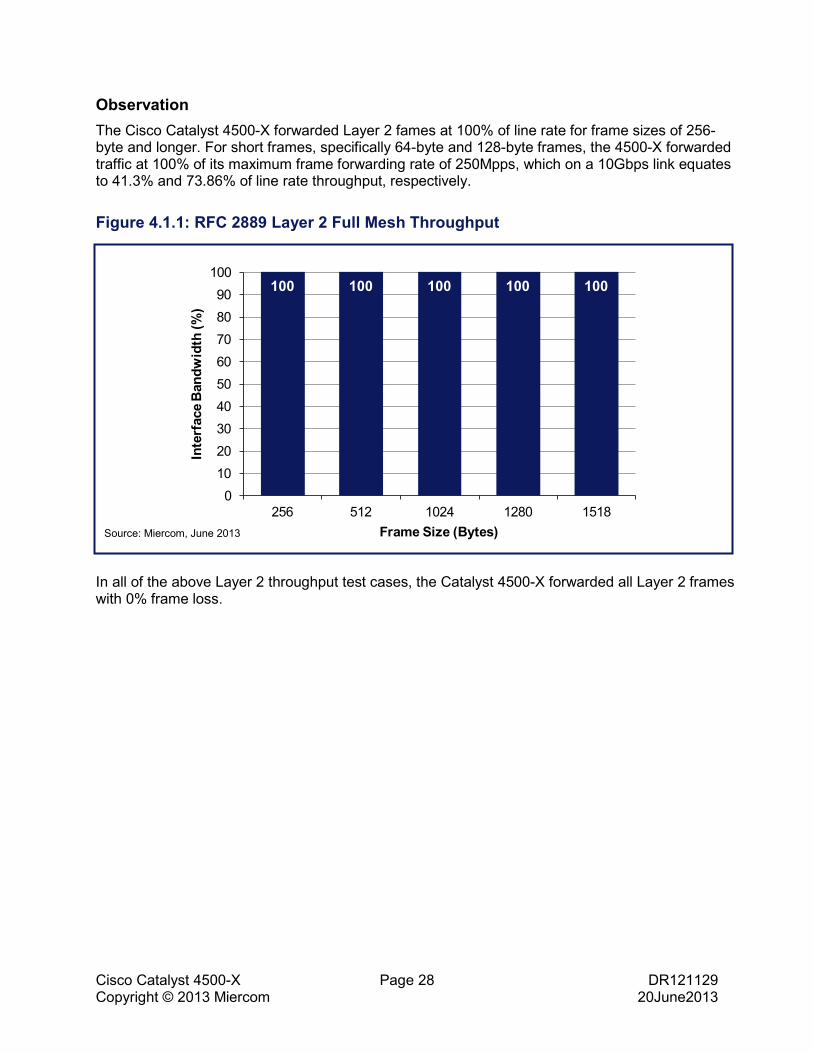
Observation The Cisco Catalyst 4500-X forwarded Layer 2 fames at 100% of line rate for frame sizes of 256-byte and longer. For short frames, specifically 64-byte and 128-byte frames, the 4500-X forwarded traffic at 100% of its maximum frame forwarding rate of 250Mpps, which on a 10Gbps link equates to 41.3% and 73.86% of line rate throughput, respectively.
Figure 4.1.1: RFC 2889 Layer 2 Full Mesh Throughput
In all of the above Layer 2 throughput test cases, the Catalyst 4500-X forwarded all Layer 2 frames with 0% frame loss.
100 100 100 100 100
0102030405060708090
100
256 512 1024 1280 1518
Inte
rfac
e B
andw
idth
(%)
Frame Size (Bytes)Source: Miercom, June 2013
Cisco Catalyst 4500-X Page 29 DR121129 Copyright © 2013 Miercom 20June2013
4.2 Layer 3 IPv6 Full Mesh Throughput
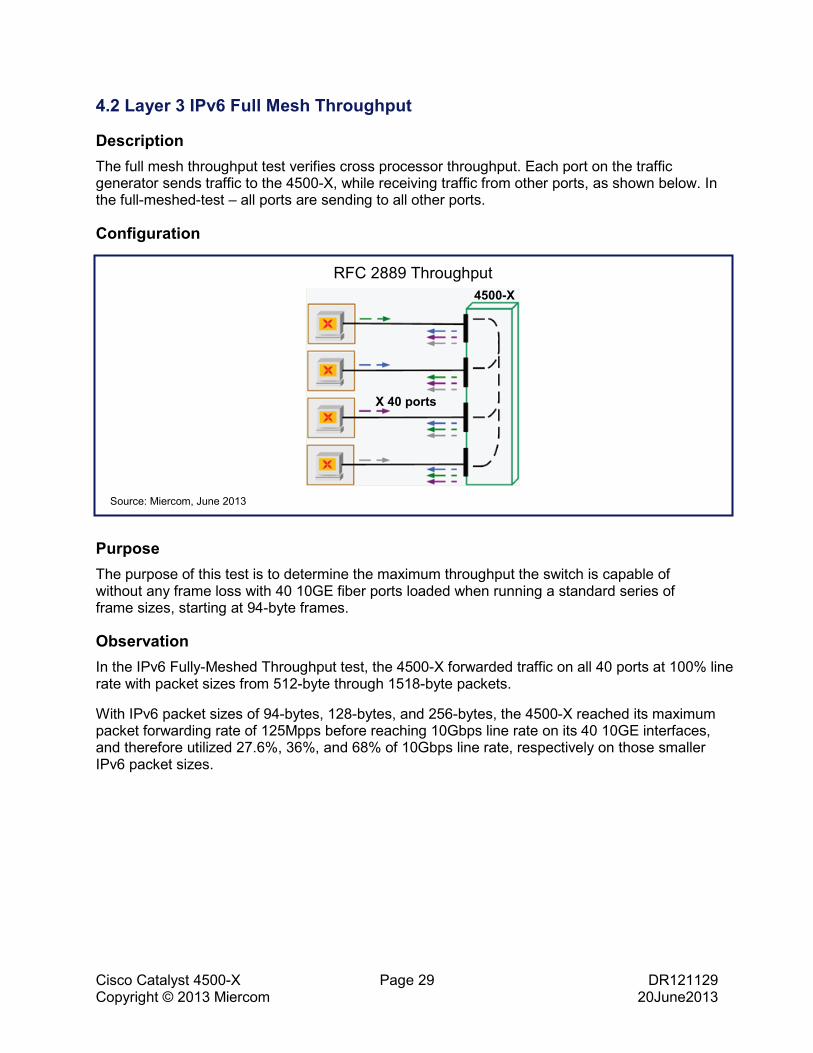
Description The full mesh throughput test verifies cross processor throughput. Each port on the traffic generator sends traffic to the 4500-X, while receiving traffic from other ports, as shown below. In the full-meshed-test – all ports are sending to all other ports.
Configuration
Purpose The purpose of this test is to determine the maximum throughput the switch is capable of without any frame loss with 40 10GE fiber ports loaded when running a standard series of frame sizes, starting at 94-byte frames.
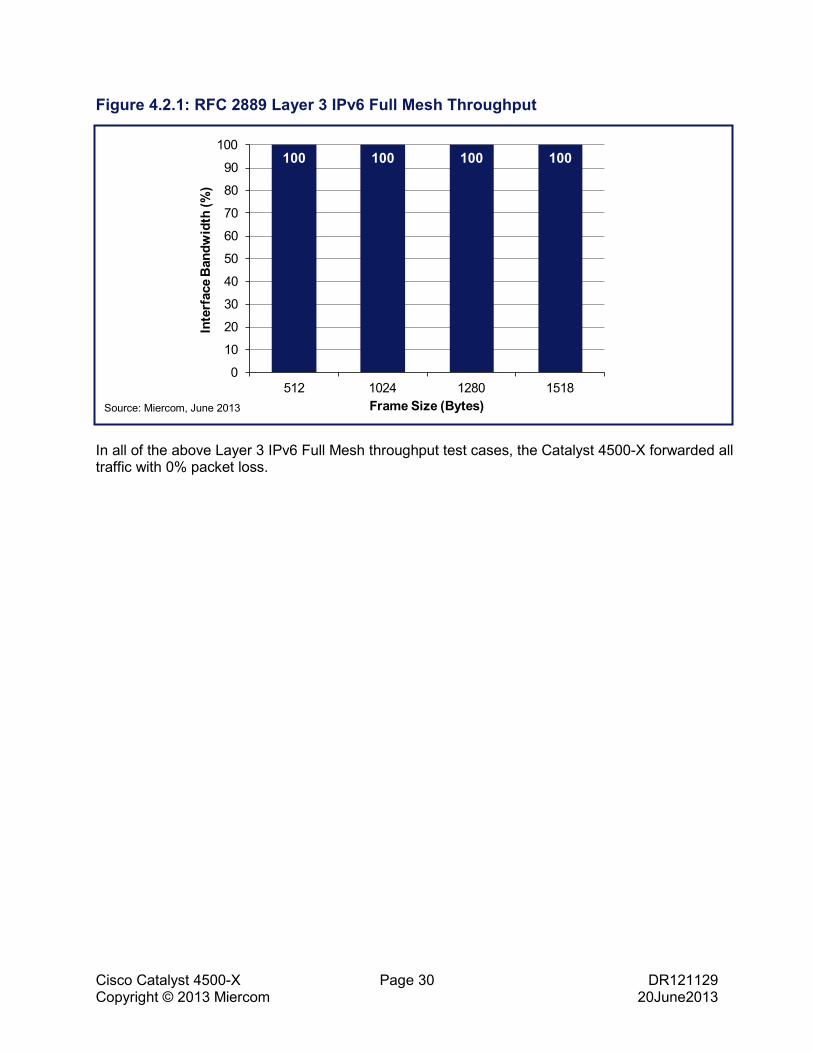
Observation In the IPv6 Fully-Meshed Throughput test, the 4500-X forwarded traffic on all 40 ports at 100% line rate with packet sizes from 512-byte through 1518-byte packets.
With IPv6 packet sizes of 94-bytes, 128-bytes, and 256-bytes, the 4500-X reached its maximum packet forwarding rate of 125Mpps before reaching 10Gbps line rate on its 40 10GE interfaces, and therefore utilized 27.6%, 36%, and 68% of 10Gbps line rate, respectively on those smaller IPv6 packet sizes.
Source: Miercom, June 2013
RFC 2889 Throughput 4500-X
X 40 ports
Cisco Catalyst 4500-X Page 30 DR121129 Copyright © 2013 Miercom 20June2013
Figure 4.2.1: RFC 2889 Layer 3 IPv6 Full Mesh Throughput
In all of the above Layer 3 IPv6 Full Mesh throughput test cases, the Catalyst 4500-X forwarded all traffic with 0% packet loss.
100 100 100 100
0
10
20
30
40
50
60
70
80
90
100
512 1024 1280 1518
Inte
rfac
e B
andw
idth
(%)
Frame Size (Bytes)Source: Miercom, June 2013

Cisco Catalyst 4500-X Page 31 DR121129 Copyright © 2013 Miercom 20June2013
4.3 Layer 2 One-to-Many Throughput
Description The test was configured to send unicast traffic at line rate to one 10GE port, and then the switch will distribute/forward that traffic stream to 39 different hosts. The test was to measure how much of the 10Gbps stream is distributed to the 39 downstream ports. This test determines the maximum rate at which the 4500-X receives a multiplexed traffic stream, with single source and multiple destination MAC addresses and forwards frames from the ingress interface to all other interfaces without any frame loss.
Configuration
One-to-Many 4500-X Test Bed
Source: Cisco, June 2013
IXIA stream generator: One repeating 10GE unicast stream, composed of 39 frames: each has the same source MAC and one of 39 unique destination MACs.
19 Ixia receiver ports have unique MAC addresses learned by DUT
4500X: 39 “fan-out” ports. Each port should send 1/39th of the 10GE Source stream, or 256.4Mbps (2.564% of 10Gbps)
20 Ixia receiver ports have unique MAC addresses learned by DUT
One- to- Many unicast “Fan-Out” test
4500X: One port receives 10G
unicast stream
Cisco Catalyst 4500-X Page 32 DR121129 Copyright © 2013 Miercom 20June2013
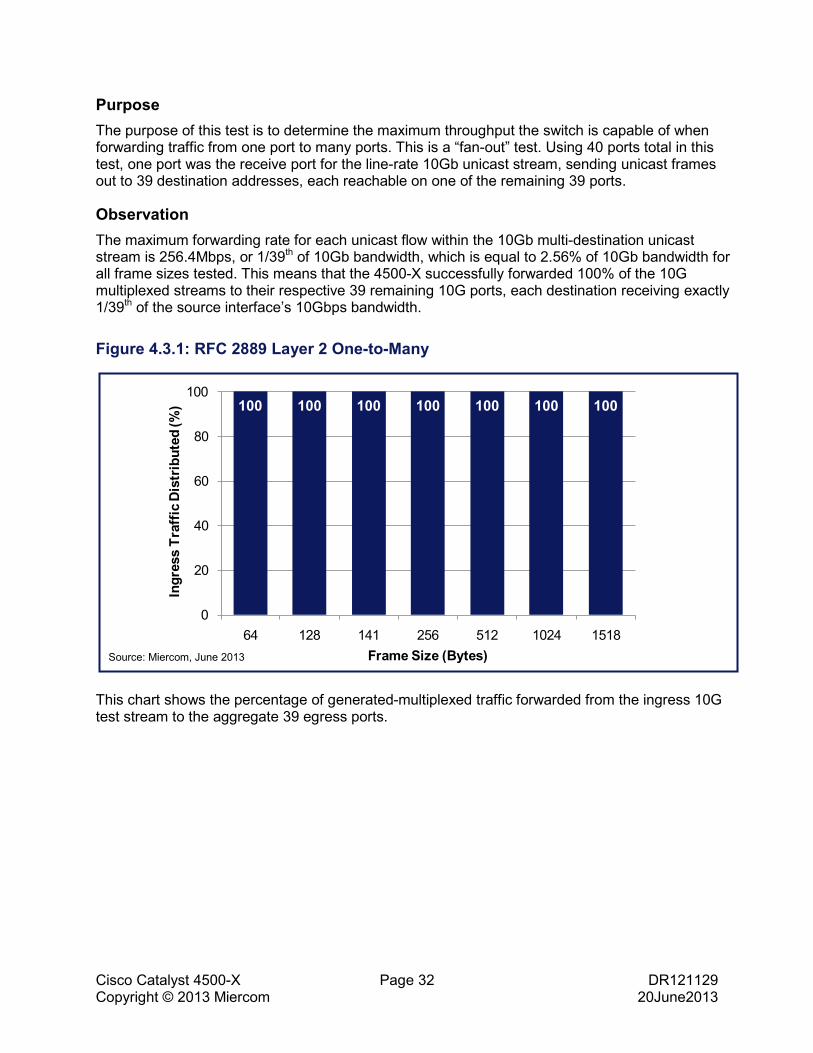
Purpose The purpose of this test is to determine the maximum throughput the switch is capable of when forwarding traffic from one port to many ports. This is a “fan-out” test. Using 40 ports total in this test, one port was the receive port for the line-rate 10Gb unicast stream, sending unicast frames out to 39 destination addresses, each reachable on one of the remaining 39 ports.
Observation The maximum forwarding rate for each unicast flow within the 10Gb multi-destination unicast stream is 256.4Mbps, or 1/39th of 10Gb bandwidth, which is equal to 2.56% of 10Gb bandwidth for all frame sizes tested. This means that the 4500-X successfully forwarded 100% of the 10G multiplexed streams to their respective 39 remaining 10G ports, each destination receiving exactly 1/39th of the source interface’s 10Gbps bandwidth.
Figure 4.3.1: RFC 2889 Layer 2 One-to-Many
This chart shows the percentage of generated-multiplexed traffic forwarded from the ingress 10G test stream to the aggregate 39 egress ports.
100 100 100 100 100 100 100
0
20
40
60
80
100
64 128 141 256 512 1024 1518
Ingr
ess
Traf
fic D
istr
ibut
ed (%
)
Frame Size (Bytes)Source: Miercom, June 2013

Cisco Catalyst 4500-X Page 33 DR121129 Copyright © 2013 Miercom 20June2013
5.0 RFC 3918
The RFC 3918 multicast tests in the following sections were tested using 10GE fiber ports with a total of 32 ports loaded. The traffic mapping is configured to send from one port to the remaining thirty one ports.
5.1 Layer 3 Multicast IPv4 Throughput
Description The Throughput No Drop Rate test calculates the maximum 4500-X throughput for IP Multicast traffic using either a binary search or a linear search.
Configuration All RFC 3918 Multicast tests were executed using 10Gb Ixia test ports and all 40 4500-X ports were running with 10Gb optics. The test load generator creates multicast traffic by sending streams to one 4500-X switch port and by sending IGMP joins to the 4500-X switch from all the downstream Ixia (receive) ports. When the 4500-X receives a join from an Ixia downstream port, it should immediately forward the multicast stream to the appropriate port at the rate at which it is received on the ingress port. Using a one-to-many traffic mapping, the 4500-X received a constant stream of 1,000 unique multicasts on one ingress port, then replicated those 1,000 streams and copied them to every downstream port where matching joins were received.
Once protocol sessions were established, traffic was transmitted into the 4500-X, and a binary or linear search was executed to measure maximum throughput.
IP Multicast Throughput No Drop Rate
4500-X
X 40 ports
Source: Miercom, June 2013
Cisco Catalyst 4500-X Page 34 DR121129 Copyright © 2013 Miercom 20June2013
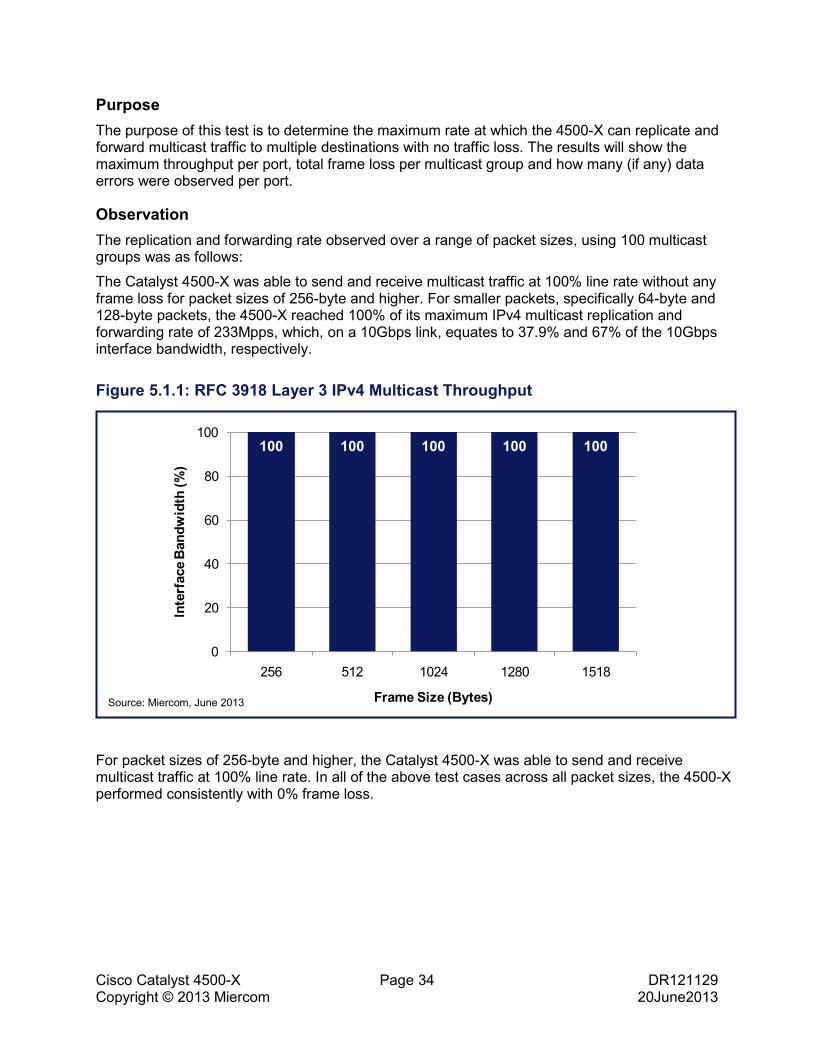
Purpose The purpose of this test is to determine the maximum rate at which the 4500-X can replicate and forward multicast traffic to multiple destinations with no traffic loss. The results will show the maximum throughput per port, total frame loss per multicast group and how many (if any) data errors were observed per port.
Observation The replication and forwarding rate observed over a range of packet sizes, using 100 multicast groups was as follows:
The Catalyst 4500-X was able to send and receive multicast traffic at 100% line rate without any frame loss for packet sizes of 256-byte and higher. For smaller packets, specifically 64-byte and 128-byte packets, the 4500-X reached 100% of its maximum IPv4 multicast replication and forwarding rate of 233Mpps, which, on a 10Gbps link, equates to 37.9% and 67% of the 10Gbps interface bandwidth, respectively.
Figure 5.1.1: RFC 3918 Layer 3 IPv4 Multicast Throughput
For packet sizes of 256-byte and higher, the Catalyst 4500-X was able to send and receive multicast traffic at 100% line rate. In all of the above test cases across all packet sizes, the 4500-X performed consistently with 0% frame loss.
100 100 100 100 100
0
20
40
60
80
100
256 512 1024 1280 1518
Inte
rfac
e B
andw
idth
(%)
Frame Size (Bytes)Source: Miercom, June 2013
Cisco Catalyst 4500-X Page 35 DR121129 Copyright © 2013 Miercom 20June2013
5.2 Layer 3 Multicast IPv4 Latency
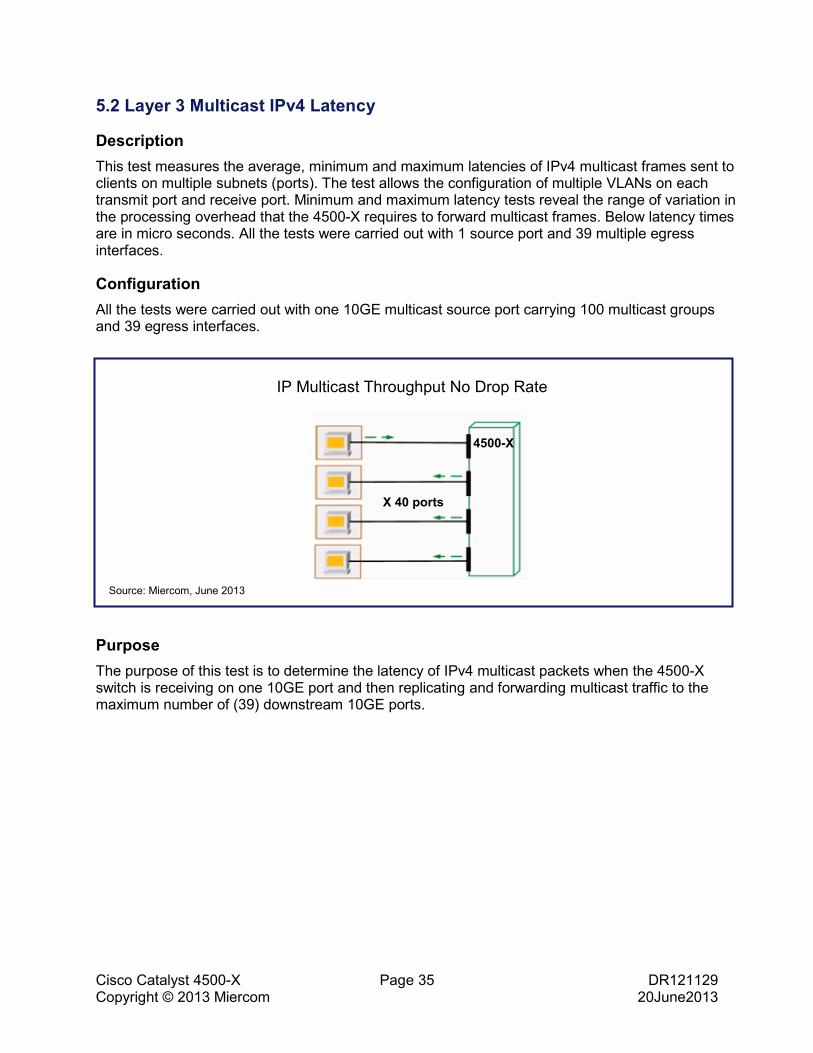
Description This test measures the average, minimum and maximum latencies of IPv4 multicast frames sent to clients on multiple subnets (ports). The test allows the configuration of multiple VLANs on each transmit port and receive port. Minimum and maximum latency tests reveal the range of variation in the processing overhead that the 4500-X requires to forward multicast frames. Below latency times are in micro seconds. All the tests were carried out with 1 source port and 39 multiple egress interfaces.
Configuration All the tests were carried out with one 10GE multicast source port carrying 100 multicast groups and 39 egress interfaces.
Purpose The purpose of this test is to determine the latency of IPv4 multicast packets when the 4500-X switch is receiving on one 10GE port and then replicating and forwarding multicast traffic to the maximum number of (39) downstream 10GE ports.
IP Multicast Throughput No Drop Rate
4500-X
X 40 ports
Source: Miercom, June 2013
Cisco Catalyst 4500-X Page 36 DR121129 Copyright © 2013 Miercom 20June2013
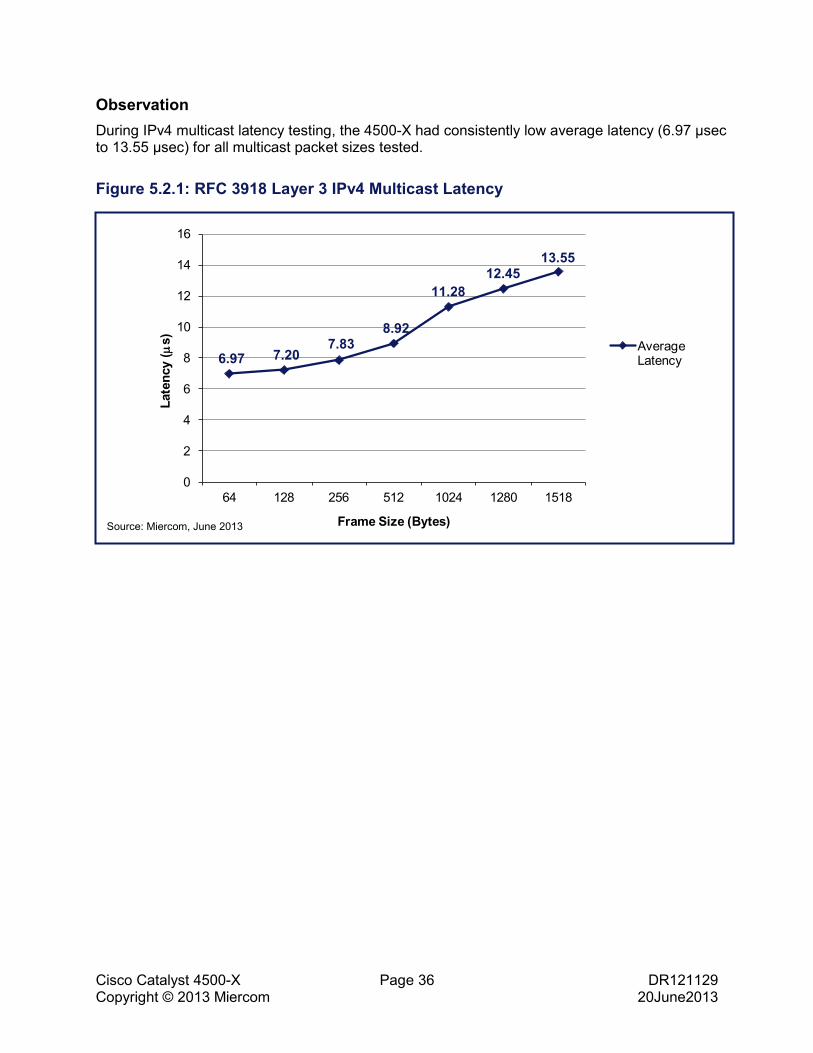
Observation During IPv4 multicast latency testing, the 4500-X had consistently low average latency (6.97 µsec to 13.55 µsec) for all multicast packet sizes tested.
Figure 5.2.1: RFC 3918 Layer 3 IPv4 Multicast Latency
6.97 7.207.83
8.92
11.2812.45
13.55
0
2
4
6
8
10
12
14
16
64 128 256 512 1024 1280 1518
Late
ncy
(µs)
Frame Size (Bytes)
Average Latency
Source: Miercom, June 2013
Cisco Catalyst 4500-X Page 37 DR121129 Copyright © 2013 Miercom 20June2013
5.3 Layer 3 Multicast IPv4 Frame Loss
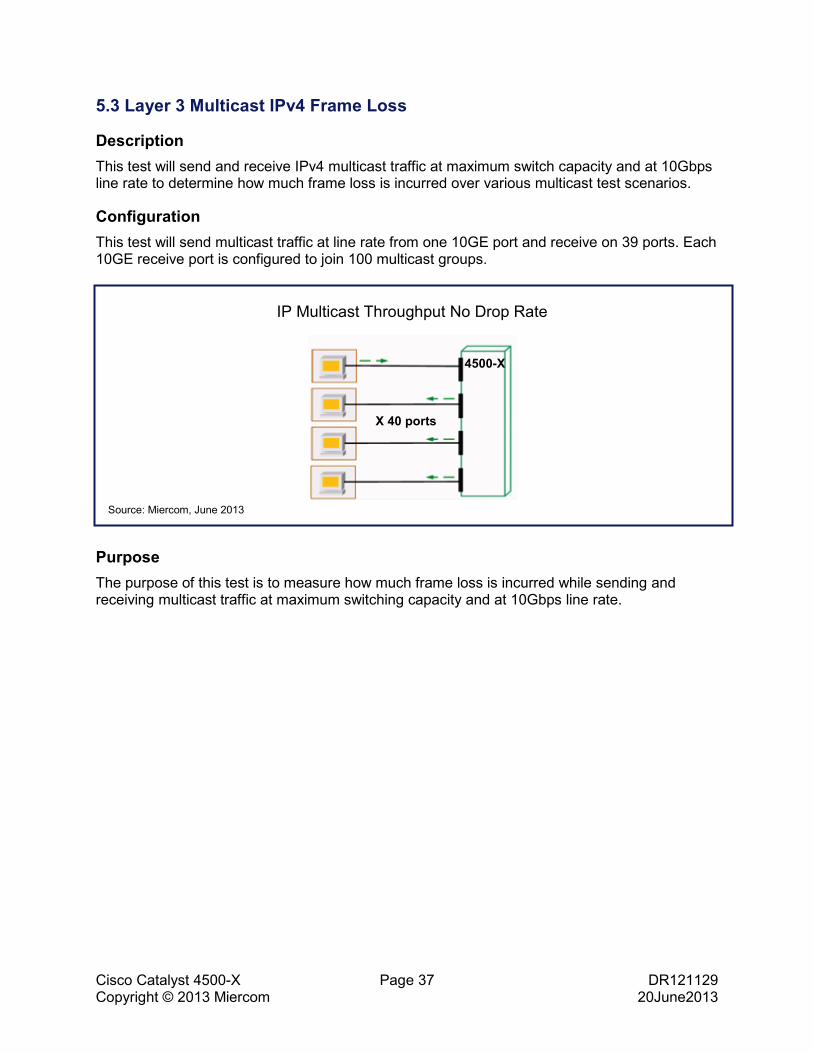
Description This test will send and receive IPv4 multicast traffic at maximum switch capacity and at 10Gbps line rate to determine how much frame loss is incurred over various multicast test scenarios.
Configuration This test will send multicast traffic at line rate from one 10GE port and receive on 39 ports. Each 10GE receive port is configured to join 100 multicast groups.
Purpose The purpose of this test is to measure how much frame loss is incurred while sending and receiving multicast traffic at maximum switching capacity and at 10Gbps line rate.
IP Multicast Throughput No Drop Rate
Source: Miercom, June 2013
4500-X
X 40 ports
Cisco Catalyst 4500-X Page 38 DR121129 Copyright © 2013 Miercom 20June2013
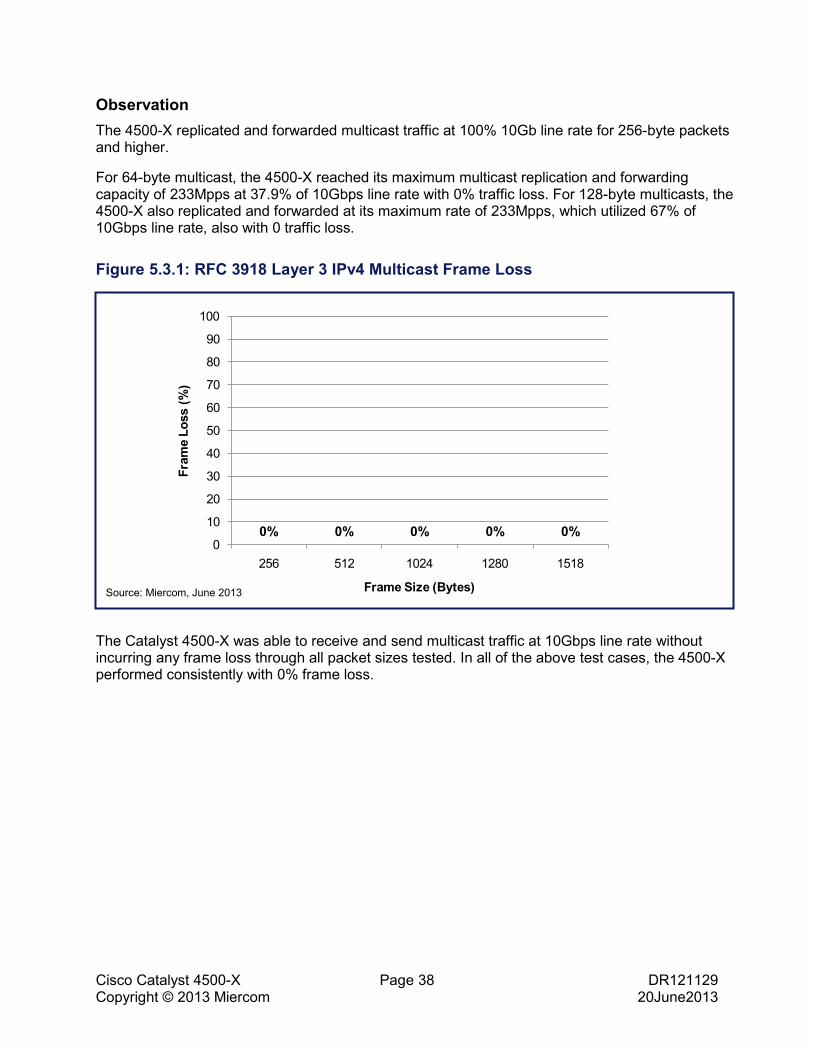
Observation The 4500-X replicated and forwarded multicast traffic at 100% 10Gb line rate for 256-byte packets and higher.
For 64-byte multicast, the 4500-X reached its maximum multicast replication and forwarding capacity of 233Mpps at 37.9% of 10Gbps line rate with 0% traffic loss. For 128-byte multicasts, the 4500-X also replicated and forwarded at its maximum rate of 233Mpps, which utilized 67% of 10Gbps line rate, also with 0 traffic loss.
Figure 5.3.1: RFC 3918 Layer 3 IPv4 Multicast Frame Loss
The Catalyst 4500-X was able to receive and send multicast traffic at 10Gbps line rate without incurring any frame loss through all packet sizes tested. In all of the above test cases, the 4500-X performed consistently with 0% frame loss.
0% 0% 0% 0% 0%0
10
20
30
40
50
60
70
80
90
100
256 512 1024 1280 1518
Fram
e Lo
ss (%
)
Frame Size (Bytes)Source: Miercom, June 2013
Cisco Catalyst 4500-X Page 39 DR121129 Copyright © 2013 Miercom 20June2013
5.4 Layer 3 Multicast IPv6 Throughput
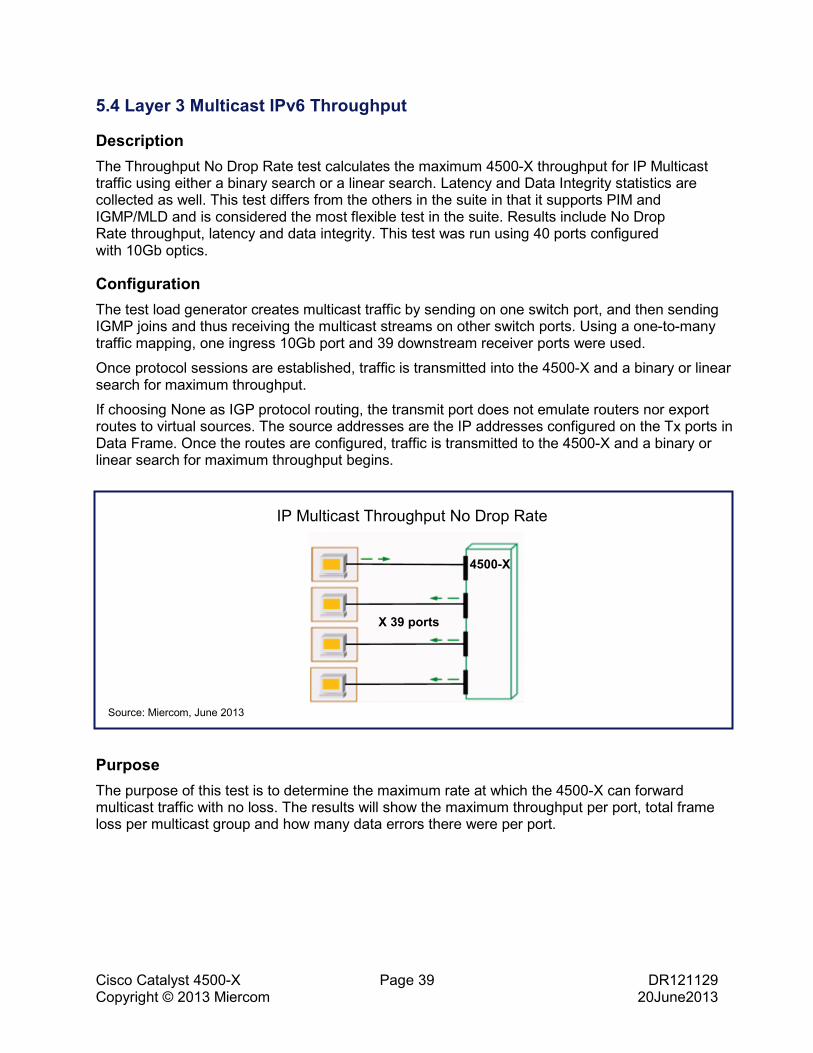
Description The Throughput No Drop Rate test calculates the maximum 4500-X throughput for IP Multicast traffic using either a binary search or a linear search. Latency and Data Integrity statistics are collected as well. This test differs from the others in the suite in that it supports PIM and IGMP/MLD and is considered the most flexible test in the suite. Results include No Drop Rate throughput, latency and data integrity. This test was run using 40 ports configured with 10Gb optics.
Configuration The test load generator creates multicast traffic by sending on one switch port, and then sending IGMP joins and thus receiving the multicast streams on other switch ports. Using a one-to-many traffic mapping, one ingress 10Gb port and 39 downstream receiver ports were used.
Once protocol sessions are established, traffic is transmitted into the 4500-X and a binary or linear search for maximum throughput.
If choosing None as IGP protocol routing, the transmit port does not emulate routers nor export routes to virtual sources. The source addresses are the IP addresses configured on the Tx ports in Data Frame. Once the routes are configured, traffic is transmitted to the 4500-X and a binary or linear search for maximum throughput begins.
Purpose The purpose of this test is to determine the maximum rate at which the 4500-X can forward multicast traffic with no loss. The results will show the maximum throughput per port, total frame loss per multicast group and how many data errors there were per port.
IP Multicast Throughput No Drop Rate
4500-X
X 39 ports
Source: Miercom, June 2013
Cisco Catalyst 4500-X Page 40 DR121129 Copyright © 2013 Miercom 20June2013
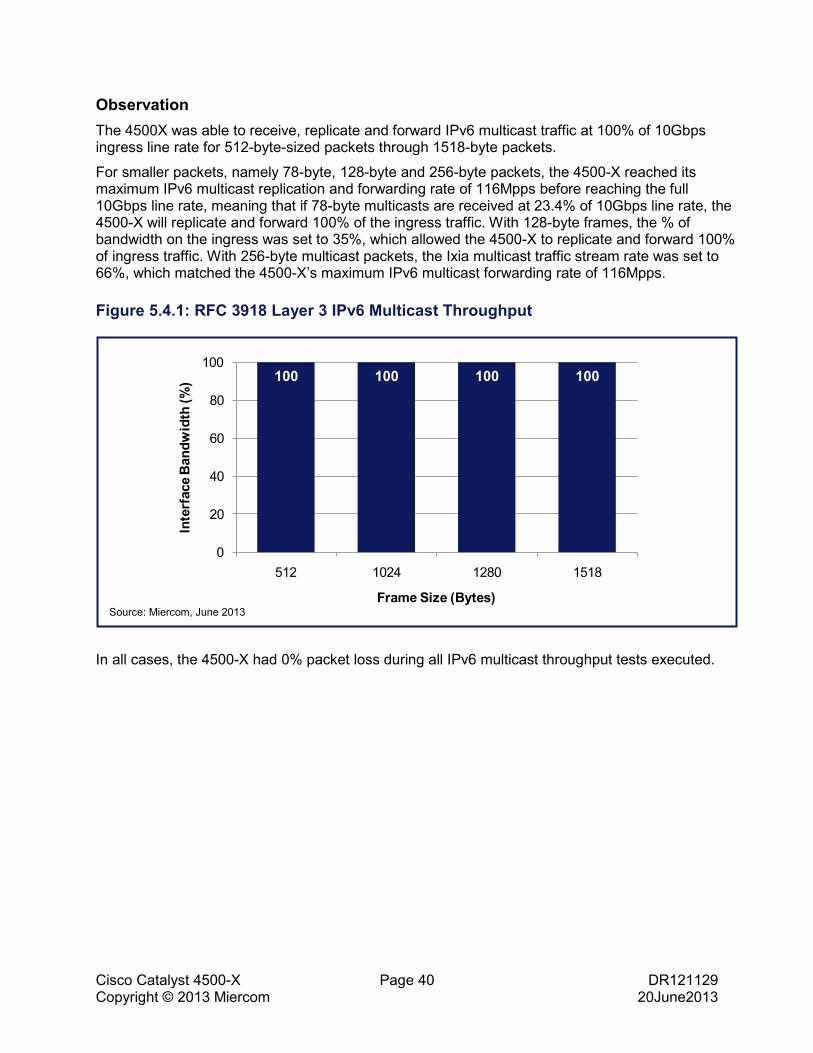
Observation The 4500X was able to receive, replicate and forward IPv6 multicast traffic at 100% of 10Gbps ingress line rate for 512-byte-sized packets through 1518-byte packets.
For smaller packets, namely 78-byte, 128-byte and 256-byte packets, the 4500-X reached its maximum IPv6 multicast replication and forwarding rate of 116Mpps before reaching the full 10Gbps line rate, meaning that if 78-byte multicasts are received at 23.4% of 10Gbps line rate, the 4500-X will replicate and forward 100% of the ingress traffic. With 128-byte frames, the % of bandwidth on the ingress was set to 35%, which allowed the 4500-X to replicate and forward 100% of ingress traffic. With 256-byte multicast packets, the Ixia multicast traffic stream rate was set to 66%, which matched the 4500-X’s maximum IPv6 multicast forwarding rate of 116Mpps.
Figure 5.4.1: RFC 3918 Layer 3 IPv6 Multicast Throughput
In all cases, the 4500-X had 0% packet loss during all IPv6 multicast throughput tests executed.
100 100 100 100
0
20
40
60
80
100
512 1024 1280 1518
Inte
rfac
e B
andw
idth
(%)
Frame Size (Bytes)Source: Miercom, June 2013
Cisco Catalyst 4500-X Page 41 DR121129 Copyright © 2013 Miercom 20June2013
5.5 Layer 3 Multicast IPv6 Latency
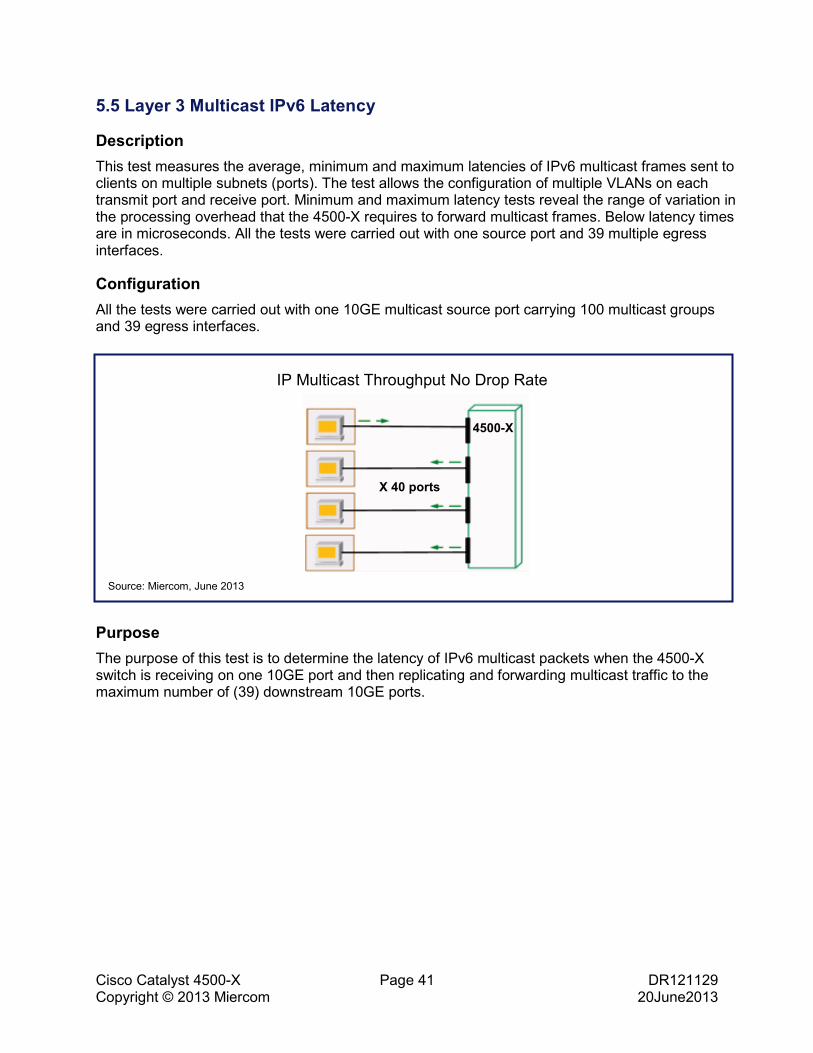
Description This test measures the average, minimum and maximum latencies of IPv6 multicast frames sent to clients on multiple subnets (ports). The test allows the configuration of multiple VLANs on each transmit port and receive port. Minimum and maximum latency tests reveal the range of variation in the processing overhead that the 4500-X requires to forward multicast frames. Below latency times are in microseconds. All the tests were carried out with one source port and 39 multiple egress interfaces.
Configuration All the tests were carried out with one 10GE multicast source port carrying 100 multicast groups and 39 egress interfaces.
Purpose The purpose of this test is to determine the latency of IPv6 multicast packets when the 4500-X switch is receiving on one 10GE port and then replicating and forwarding multicast traffic to the maximum number of (39) downstream 10GE ports.
IP Multicast Throughput No Drop Rate
Source: Miercom, June 2013
4500-X
X 40 ports
Cisco Catalyst 4500-X Page 42 DR121129 Copyright © 2013 Miercom 20June2013
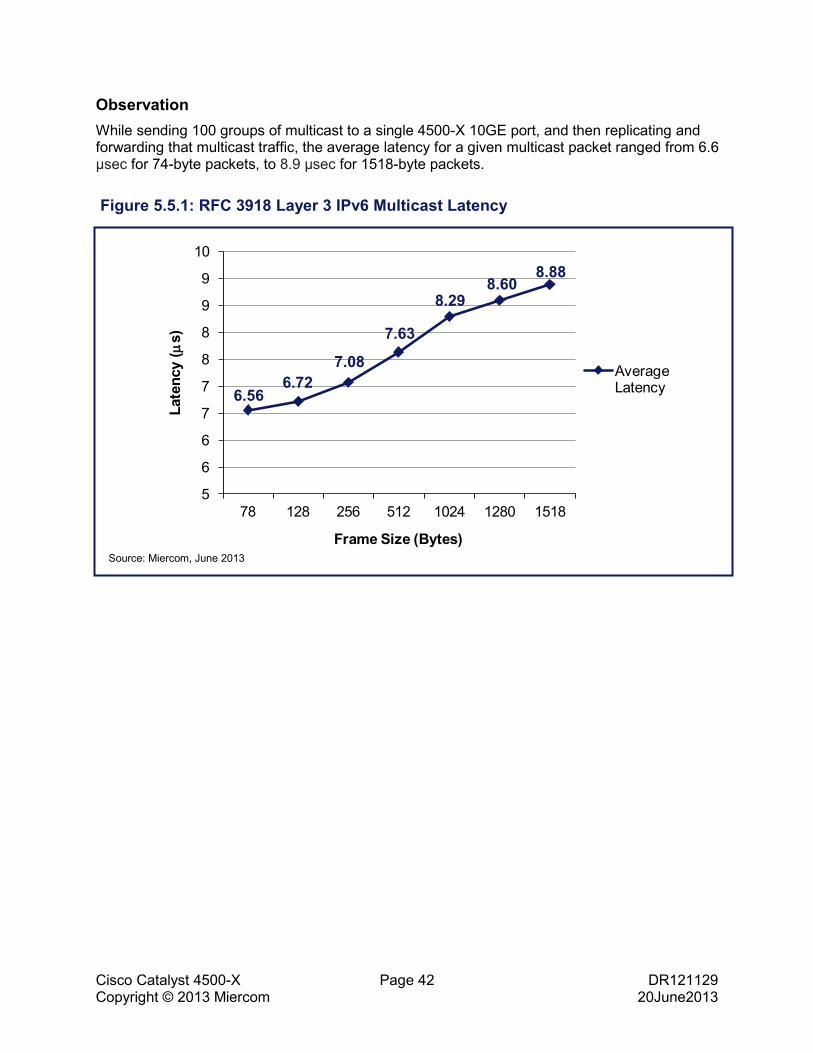
Observation While sending 100 groups of multicast to a single 4500-X 10GE port, and then replicating and forwarding that multicast traffic, the average latency for a given multicast packet ranged from 6.6 µsec for 74-byte packets, to 8.9 µsec for 1518-byte packets.
Figure 5.5.1: RFC 3918 Layer 3 IPv6 Multicast Latency
6.566.72
7.08
7.63
8.298.60
8.88
5
6
6
7
7
8
8
9
9
10
78 128 256 512 1024 1280 1518
Late
ncy
(µs)
Frame Size (Bytes)
Average Latency
Source: Miercom, June 2013
Cisco Catalyst 4500-X Page 43 DR121129 Copyright © 2013 Miercom 20June2013
5.6 Layer 3 Multicast IPv6 Frame Loss
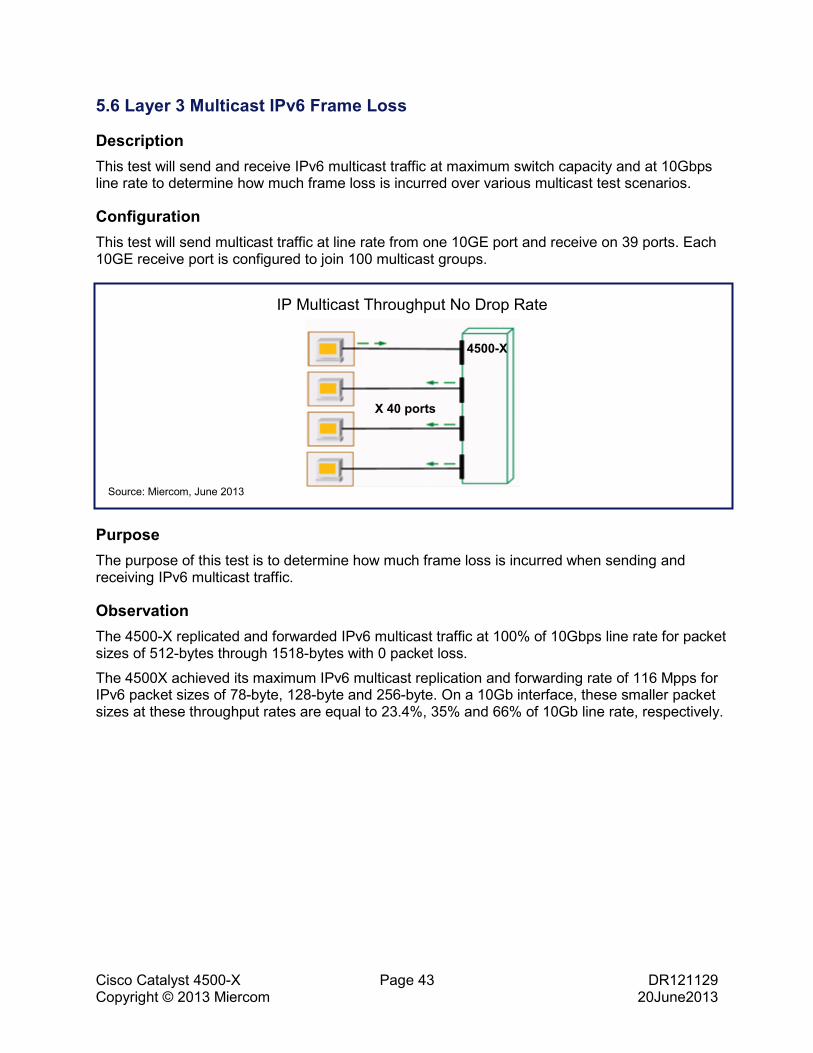
Description This test will send and receive IPv6 multicast traffic at maximum switch capacity and at 10Gbps line rate to determine how much frame loss is incurred over various multicast test scenarios.
Configuration This test will send multicast traffic at line rate from one 10GE port and receive on 39 ports. Each 10GE receive port is configured to join 100 multicast groups.
Purpose The purpose of this test is to determine how much frame loss is incurred when sending and receiving IPv6 multicast traffic.
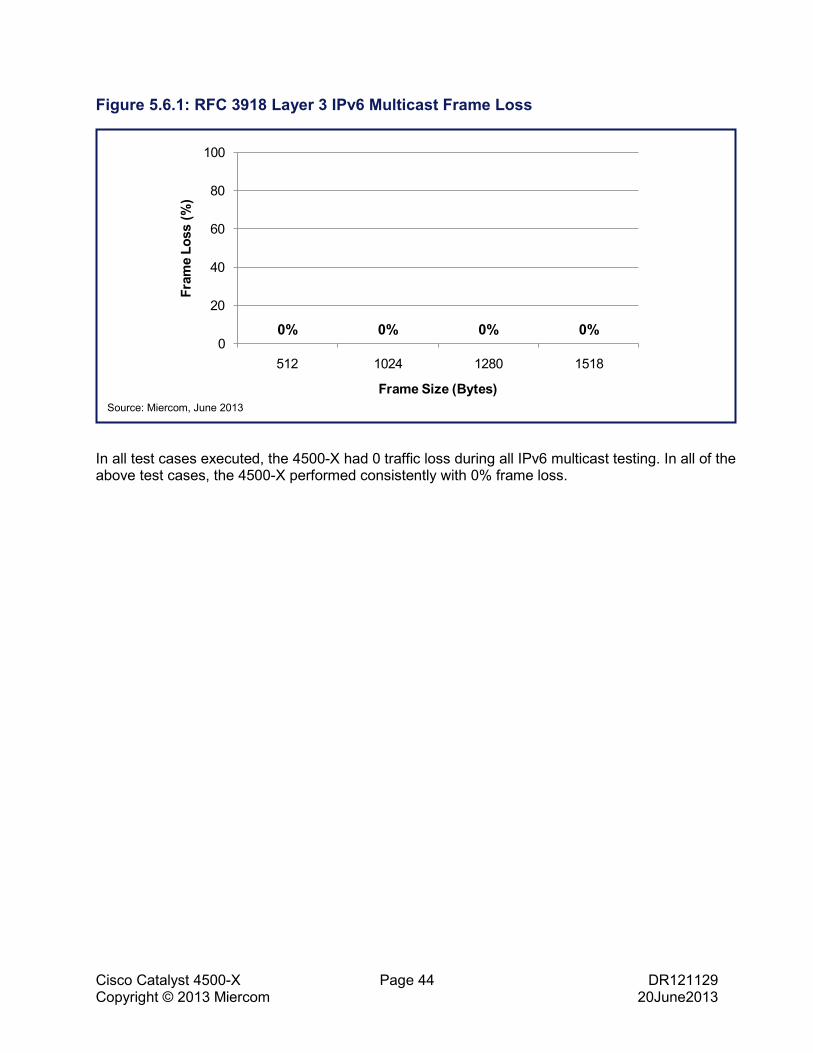
Observation The 4500-X replicated and forwarded IPv6 multicast traffic at 100% of 10Gbps line rate for packet sizes of 512-bytes through 1518-bytes with 0 packet loss.
The 4500X achieved its maximum IPv6 multicast replication and forwarding rate of 116 Mpps for IPv6 packet sizes of 78-byte, 128-byte and 256-byte. On a 10Gb interface, these smaller packet sizes at these throughput rates are equal to 23.4%, 35% and 66% of 10Gb line rate, respectively.
IP Multicast Throughput No Drop Rate
4500-X
X 40 ports
Source: Miercom, June 2013
Cisco Catalyst 4500-X Page 44 DR121129 Copyright © 2013 Miercom 20June2013
Figure 5.6.1: RFC 3918 Layer 3 IPv6 Multicast Frame Loss
In all test cases executed, the 4500-X had 0 traffic loss during all IPv6 multicast testing. In all of the above test cases, the 4500-X performed consistently with 0% frame loss.
0% 0% 0% 0%0
20
40
60
80
100
512 1024 1280 1518
Fram
e Lo
ss (%
)
Frame Size (Bytes)Source: Miercom, June 2013
Cisco Catalyst 4500-X Page 45 DR121129 Copyright © 2013 Miercom 20June2013
6.0 Scalability
6.1 Maximum Multicast MAC Entries
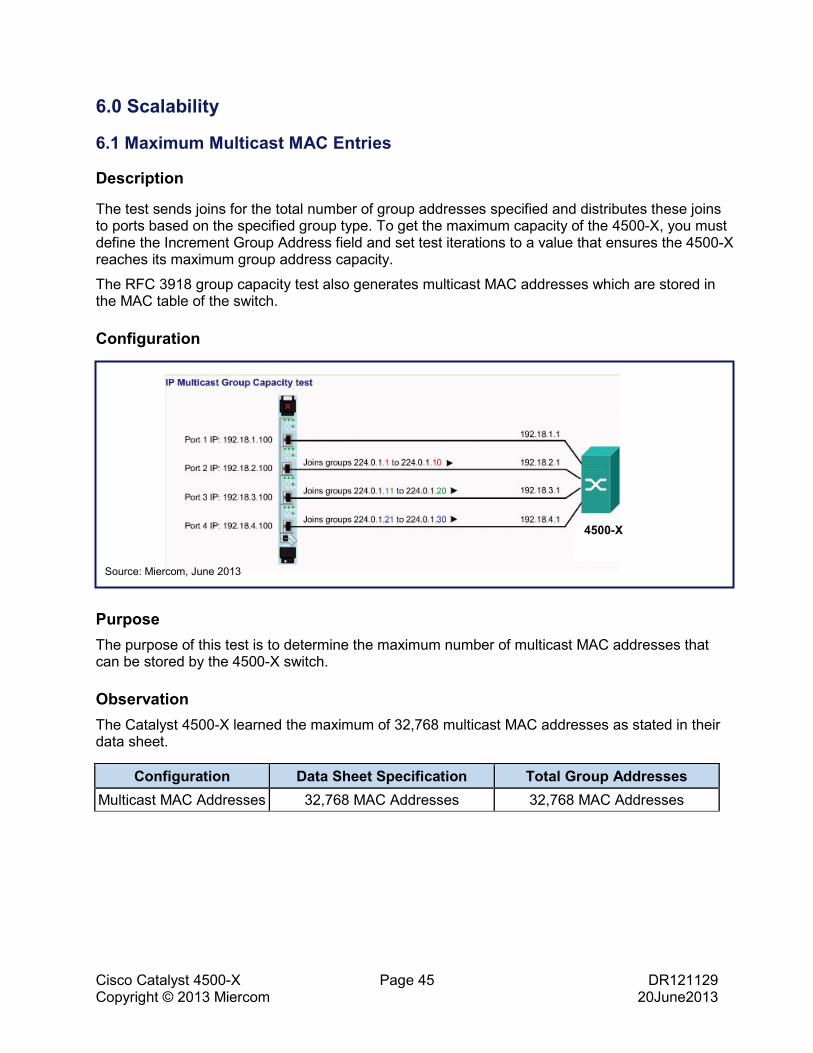
Description
The test sends joins for the total number of group addresses specified and distributes these joins to ports based on the specified group type. To get the maximum capacity of the 4500-X, you must define the Increment Group Address field and set test iterations to a value that ensures the 4500-X reaches its maximum group address capacity.
The RFC 3918 group capacity test also generates multicast MAC addresses which are stored in the MAC table of the switch.
Configuration
Purpose The purpose of this test is to determine the maximum number of multicast MAC addresses that can be stored by the 4500-X switch.
Observation The Catalyst 4500-X learned the maximum of 32,768 multicast MAC addresses as stated in their data sheet.
Configuration Data Sheet Specification Total Group Addresses Multicast MAC Addresses 32,768 MAC Addresses 32,768 MAC Addresses
4500-X
Source: Miercom, June 2013
Cisco Catalyst 4500-X Page 46 DR121129 Copyright © 2013 Miercom 20June2013
6.2 Scalability for Layer 3 Multicast IPv4 and IPv6
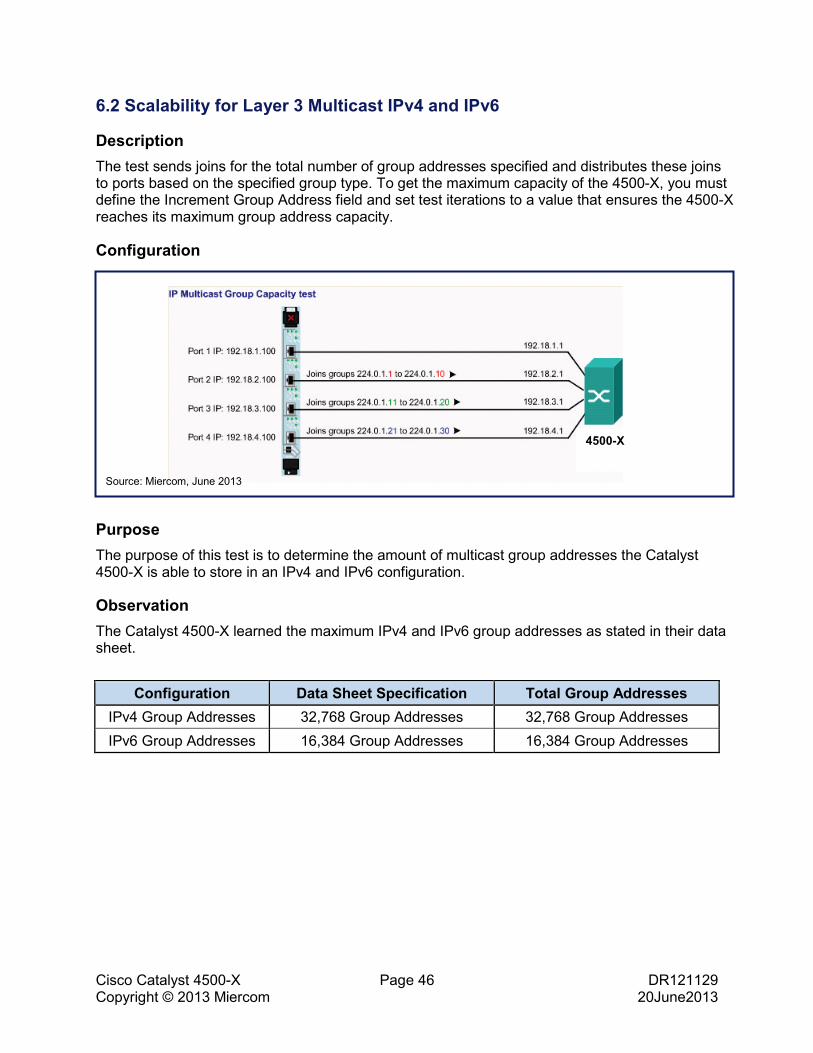
Description The test sends joins for the total number of group addresses specified and distributes these joins to ports based on the specified group type. To get the maximum capacity of the 4500-X, you must define the Increment Group Address field and set test iterations to a value that ensures the 4500-X reaches its maximum group address capacity.
Configuration
Purpose The purpose of this test is to determine the amount of multicast group addresses the Catalyst 4500-X is able to store in an IPv4 and IPv6 configuration.
Observation The Catalyst 4500-X learned the maximum IPv4 and IPv6 group addresses as stated in their data sheet.
Configuration Data Sheet Specification Total Group Addresses IPv4 Group Addresses 32,768 Group Addresses 32,768 Group Addresses IPv6 Group Addresses 16,384 Group Addresses 16,384 Group Addresses
4500-X
Source: Miercom, June 2013

Cisco Catalyst 4500-X Page 47 DR121129 Copyright © 2013 Miercom 20June2013
6.3 Maximum Unicast MAC Entries
Description The Address Cache Size test uses a binary search to determine the size of the address table for each port or for an entire switch. Beginning at half the size of the initial user-specified table size, frames are transmitted at a user-specified frame rate to see if the 4500-X has properly learned all of the addresses. If no frame loss and no flooding are detected, the address table size is increased and the test is repeated in a binary fashion until the address table size is determined. Results include maximum number of MAC addresses supported by 4500-X.
Configuration The test generator creates random MAC addresses and forwards them to directly connected switch ports. Layer 2 frames are transmitted to each port starting at half the size of the initial user-specified table size. Learning frames are transmitted between each iteration for the switch to learn and store, to build the Mac learned table. Generic frames are then sent at a user-specified frame rate to see if the 4500-X has properly learned all the addresses.
If no frame loss and no flooding are detected, the address table size is increased and the test is repeated in a binary fashion until the address table size is determined. The binary search algorithm ends when the difference between the best iteration and the searched-for maximum iteration is less than or equal to the number of addresses set for the Resolution parameter.
If there is one address table for the entire switch, then the test needs to be run only on one transmit port to all receive ports on the switch; if there is one address table per port, then this test should be run for each port. The port mapping used is one-to-many, with three ports minimum. Unidirectional traffic is used in this test.
Purpose The results will show the maximum MAC address cache size the 4500-X is able to learn.
Source: Miercom, June 2013
RFC 2889 Address Cache Size 4500-X
Cisco Catalyst 4500-X Page 48 DR121129 Copyright © 2013 Miercom 20June2013
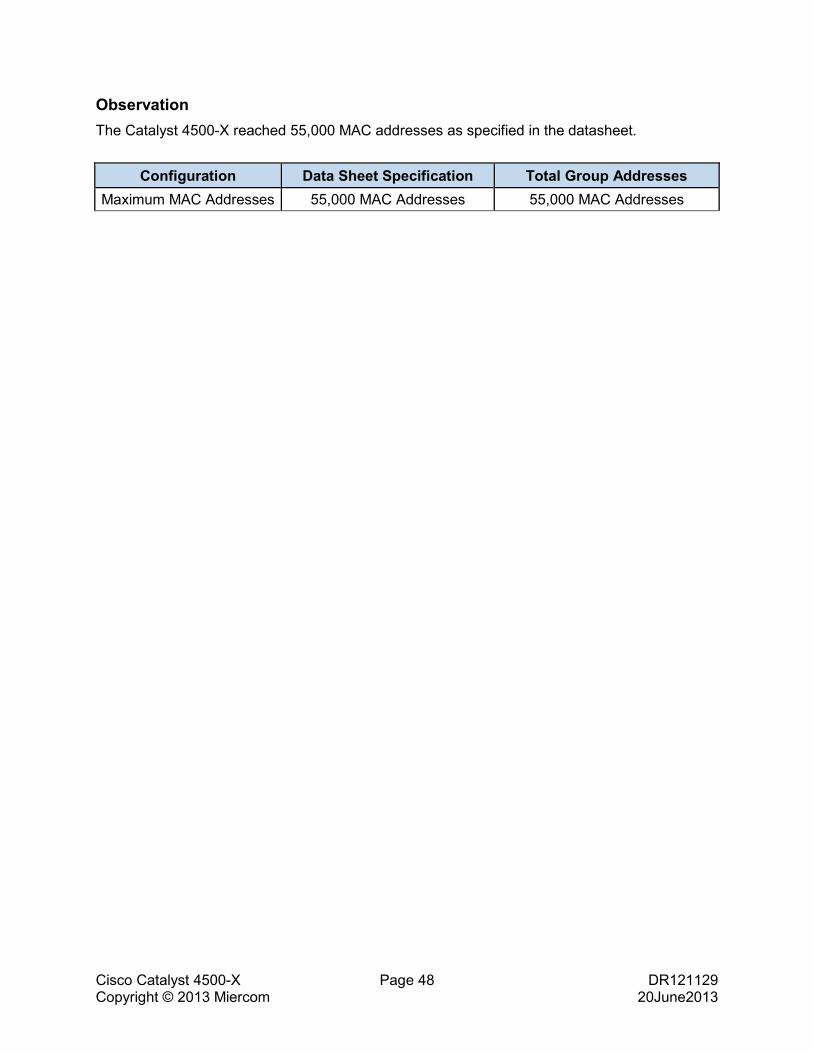
Observation The Catalyst 4500-X reached 55,000 MAC addresses as specified in the datasheet.
Configuration Data Sheet Specification Total Group Addresses Maximum MAC Addresses 55,000 MAC Addresses 55,000 MAC Addresses
Cisco Catalyst 4500-X Page 49 DR121129 Copyright © 2013 Miercom 20June2013
6.4 Layer 3 Maximum FIB Entries IPv4 and IPv6
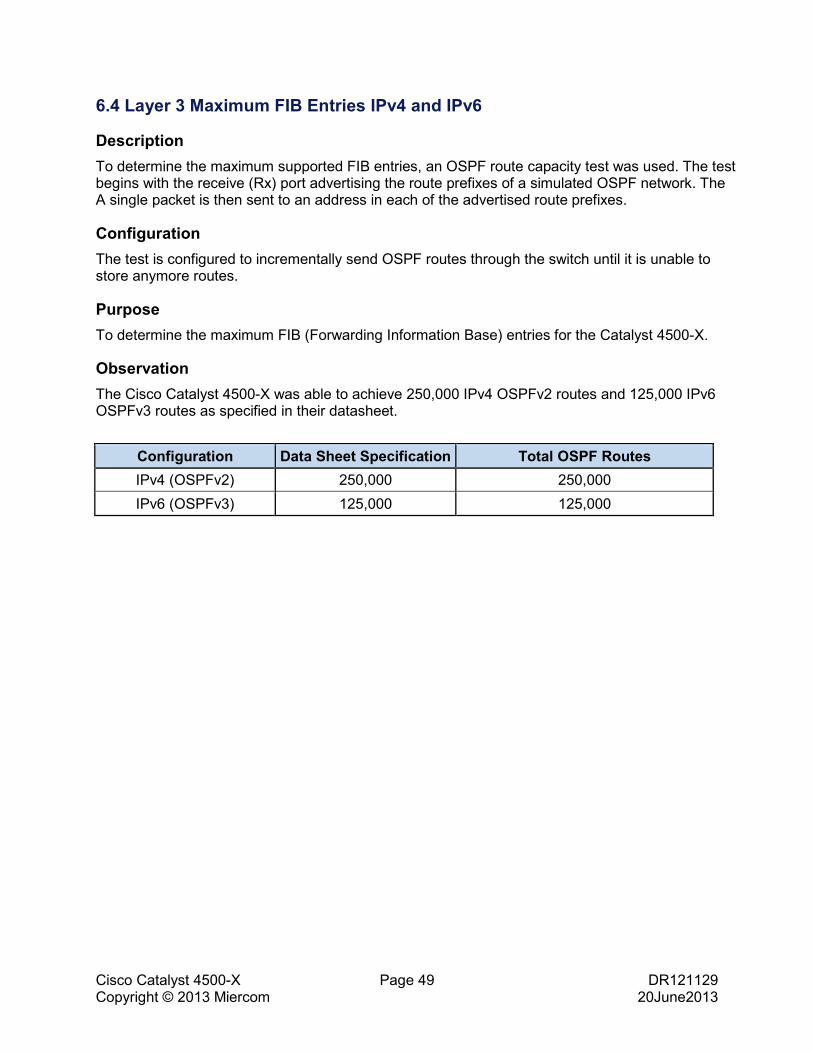
Description To determine the maximum supported FIB entries, an OSPF route capacity test was used. The test begins with the receive (Rx) port advertising the route prefixes of a simulated OSPF network. The A single packet is then sent to an address in each of the advertised route prefixes.
Configuration The test is configured to incrementally send OSPF routes through the switch until it is unable to store anymore routes.
Purpose To determine the maximum FIB (Forwarding Information Base) entries for the Catalyst 4500-X.
Observation The Cisco Catalyst 4500-X was able to achieve 250,000 IPv4 OSPFv2 routes and 125,000 IPv6 OSPFv3 routes as specified in their datasheet.
Configuration Data Sheet Specification Total OSPF Routes IPv4 (OSPFv2) 250,000 250,000 IPv6 (OSPFv3) 125,000 125,000
Cisco Catalyst 4500-X Page 50 DR121129 Copyright © 2013 Miercom 20June2013
7.0 Flexible NetFlow Collection
Flexible NetFlow offers enhanced application monitoring and allows administrators to collect, cache and export flows to an external collector for further analysis. Flexible NetFlow can be configured to record specific types of flows including source/destination MAC/IPv4/IPv6 addresses, source/destination TCP/UDP ports, and protocols.
Description The test was configured to generate unique flows to validate whether the switch is capable of storing 128,000 NetFlow entries.
Configuration The switch was configured to tag the unique NetFlows and export them to a collector port.
Purpose The purpose of this test is to determine how many Flexible NetFlows can be stored and what is the CPU utilization while the 4500-X is collecting and storing entries.
Observation While sending NetFlow traffic at 1 Gbps, the CPU on the switch never exceeded 25%. There were a total of 128,000 NetFlow entries recorded and 2,000,000 records stored. The switch CLI was responsive for the duration of the test.
Data Sheet Specification Total NetFlow Entries 128,000 128,000
128,000 NetFlow entries can be stored in the NetFlow Cache on the switch.
Cisco Catalyst 4500-X Page 51 DR121129 Copyright © 2013 Miercom 20June2013
8.0 Wireshark Integration
Description Wireshark is a feature that Cisco integrated into the Catalyst 4500-X switches allowing administrators to capture and analyze network traffic. Packet captures can be saved as standard ‘pcap’ files and viewed either in the switch CLI or exported to any external application that understands the standard ‘pcap’ file format.
Wireshark captures are defined by using filters, either capturing a broad variety of traffic or specific types of traffic. Additional filters include duration, packets, packet-length, and file size.
Configuration The Ixia was used to generate traffic to the monitor port of the switch. The monitor port captures traffic and buffers the captured traffic to an internal buffer, or saves the captured packets or frames to a pcap file, either to boot flash or to a USB drive.
Traffic was transmitted at 10% of 1 Gbps.
Purpose The purpose of this test is to validate the Wireshark capture function and determine the CPU utilization while the switch performs the packet capture.
Observation The Catalyst 4500-X successfully captured network traffic on the monitor port to a pcap file located in the boot flash of the switch. Once the monitor capture was complete, the pcap file was opened in boot flash. Within the switch CLI we were able to drill down into each packet for analysis. The pcap file was then transferred to a TFTP server, and the pcap file was successfully opened with Wireshark and it allowed us to drill down into each packet for further analysis. During the packet capture, CPU utilization ranged from 4% to 10%. The CLI was responsive during the test.

Cisco Catalyst 4500-X Page 52 DR121129 Copyright © 2013 Miercom 20June2013
9.0 VSS Layer 2 Throughput, Latency and Frame Loss
Description Maintaining optimal throughput performance while in VSS mode is important to ensure traffic is properly load balanced and hashed across the network. This test will verify throughput performance, measure latency and frame loss from the north access switch to the south access switch through the VSS pair.
VSS Configuration Topology
Configuration The test bed includes four Cisco Catalyst 4500-X switches. Two switches are configured as a VSS pair and the remaining two are access switches. Traffic was sent using two north-to-south and two south-to-north streams. Each test port is configured with 100 MAC addresses, with a total of 400 MAC addresses learned by the 4500-X VSS.
Source: Cisco, June 2013
MEC 1 = 2 x 10G
LACP port-channel
PAgP port-channel
Edge Switch North
Edge Switch South
IxiaTraffic
Generator
IxiaTraffic
Generator
VSS Pair: 2 x 4500-X
4500XVSS
VSS- SW1 VSS-SW2
VSL= 2 x 10G
MEC 2 = 2 x 10G
4500XEDGE
4500XVSS
4500XEDGE
Src-D
est flo
ws 1-5
Src-Dest flows 1-5
Src-D
est f
lows 6
-10
Src-Dest flows 6-10
Etherchannels load-balance mutiple src-dest flows evenly due to src-dest hashing algortithm, and remain “bi-directional switch+port faithful,” which keeps traffic flows in a straight line, and off the VSL.

Cisco Catalyst 4500-X Page 53 DR121129 Copyright © 2013 Miercom 20June2013
Purpose The purpose of this test is to determine the throughput, latency and frame loss when sending and receiving traffic from one north and one south access switches, where each edge switch is receiving traffic from and forwarding traffic to its four locally connected Ixia test set ports.
Observation While the VSS traffic test was running, we verified through “show interface counters” that traffic from the Ixia ports was being load-balanced to both ports in both EtherChannels. Additionally, we verified that the VSS switch contained 400 MAC addresses (100 each learned from each Ixia port) in its MAC table. The Catalyst 4500-X VSS achieved 100% line rate at 10 Gbps with zero packet loss. The average end-to-end latency through both edge switches and the core VSS-pair ranged from 14 to 22 microseconds. The Catalyst 4500-X achieved a maximum of 77.1 Gbps at the 1518-byte frame size.
Figure 9.1: VSS Layer 2 - Line Rate and End-to-End (3-hop) Average Latency
The 4500-X VSS achieved 100% line rate with the average end-to-end latency ranging from 14 µsec to 21 µsec. Note that this latency is about three-times higher than the 4500-X standalone 2544 Latency testing in sections above, and this is expected since, as is shown in the VSS test bed diagram, there are actually three 4500-X switch hops between sending and receiving Ixia ports. See Table 9.2 on the next page for standalone 4500-X average latency values corresponding to the end-to-end latency values observed in the above test result.
100 100 100 100 100 100 100
14.7 14.8 15.917.5
19.7 20.3 21.1
0
5
10
15
20
25
0
20
40
60
80
100
64 128 256 512 1024 1280 1516A
vg L
aten
cy (µ
s)
Inte
rfac
e B
andw
idth
(%)
Frame Size (Bytes)
Interface Bandwidth (%)
Average Latency (us)
Source: Miercom, June 2013
Cisco Catalyst 4500-X Page 54 DR121129 Copyright © 2013 Miercom 20June2013
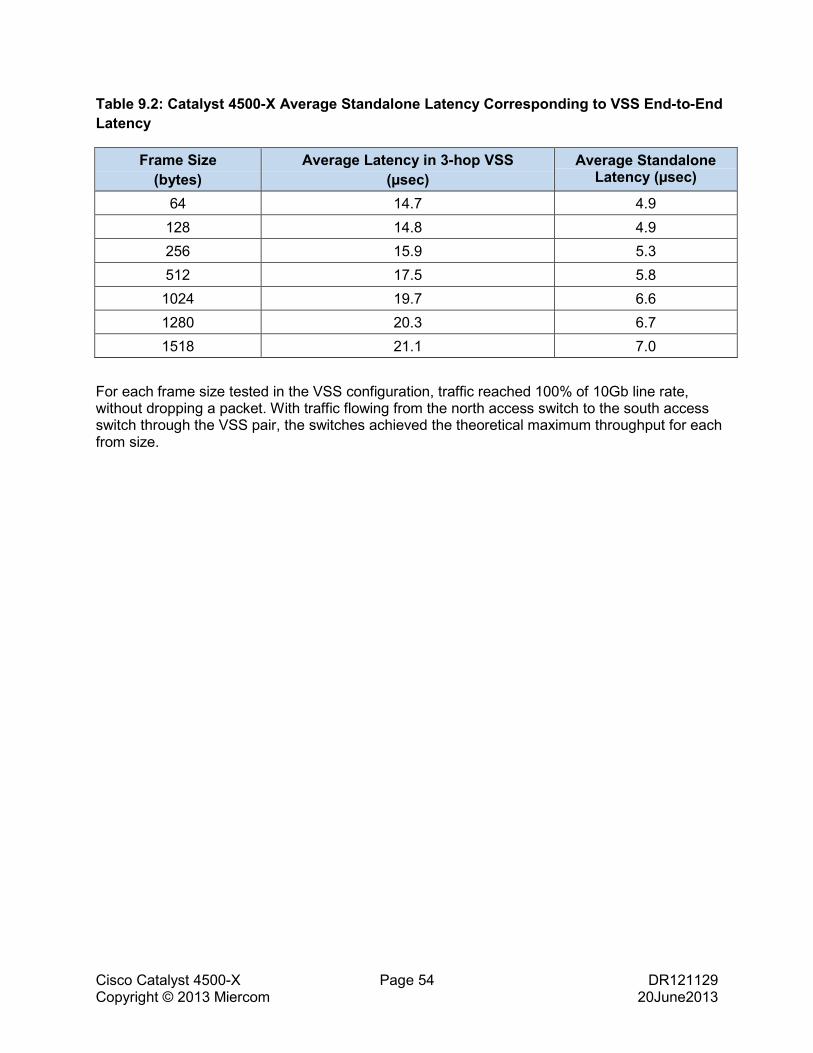
Table 9.2: Catalyst 4500-X Average Standalone Latency Corresponding to VSS End-to-End Latency
Frame Size (bytes)
Average Latency in 3-hop VSS (µsec)
Average Standalone Latency (µsec)
64 14.7 4.9 128 14.8 4.9 256 15.9 5.3 512 17.5 5.8 1024 19.7 6.6 1280 20.3 6.7 1518 21.1 7.0
For each frame size tested in the VSS configuration, traffic reached 100% of 10Gb line rate, without dropping a packet. With traffic flowing from the north access switch to the south access switch through the VSS pair, the switches achieved the theoretical maximum throughput for each from size.
Cisco Catalyst 4500-X Page 55 DR121129 Copyright © 2013 Miercom 20June2013
10.0 VSS Resiliency during MEC Link Failure
Description Ethernet switches need to provide High Availability during outages and accidental link failures. To measure the switches HA abilities, we simulated a link failure on each Multichassis Ether Channel (MEC), then reconnected the link after a certain time had passed. It is expected that the link failure will experience sub-second traffic recovery.
VSS Configuration See VSS Configuration Topology diagram on page 52.
Configuration The test bed included four Cisco Catalyst 4500-X switches. Two switches were configured as a VSS pair and the remaining two 4500-Xs were access switches. Traffic was sent using two north and south streams.
The test was configured with two test port streams sending/receiving from the Ixia to the north access switch and two port streams sending/receiving on two Ixia ports to the south access switch (destined for addresses on the north Ixia test ports). Traffic was sent from both the two northbound and two southbound streams from a total of four Ixia traffic generating test ports.
After traffic was started on the Ixia, a VSS-to-edge MEC link was removed after 50,000,000 frames were sent. Next, after 100,000,000 frames had been sent, the MEC (Ether Channel) link was reconnected. The test traffic was finally stopped after 150,000,000 frames had been sent. The traffic rate for each stream was 2,349,624 fps. The point of the test was to determine the overall impact of removing and then reinserting a link.
Purpose The purpose of this test is to measure the frame loss when a MEC link is removed then reconnected.
Cisco Catalyst 4500-X Page 56 DR121129 Copyright © 2013 Miercom 20June2013
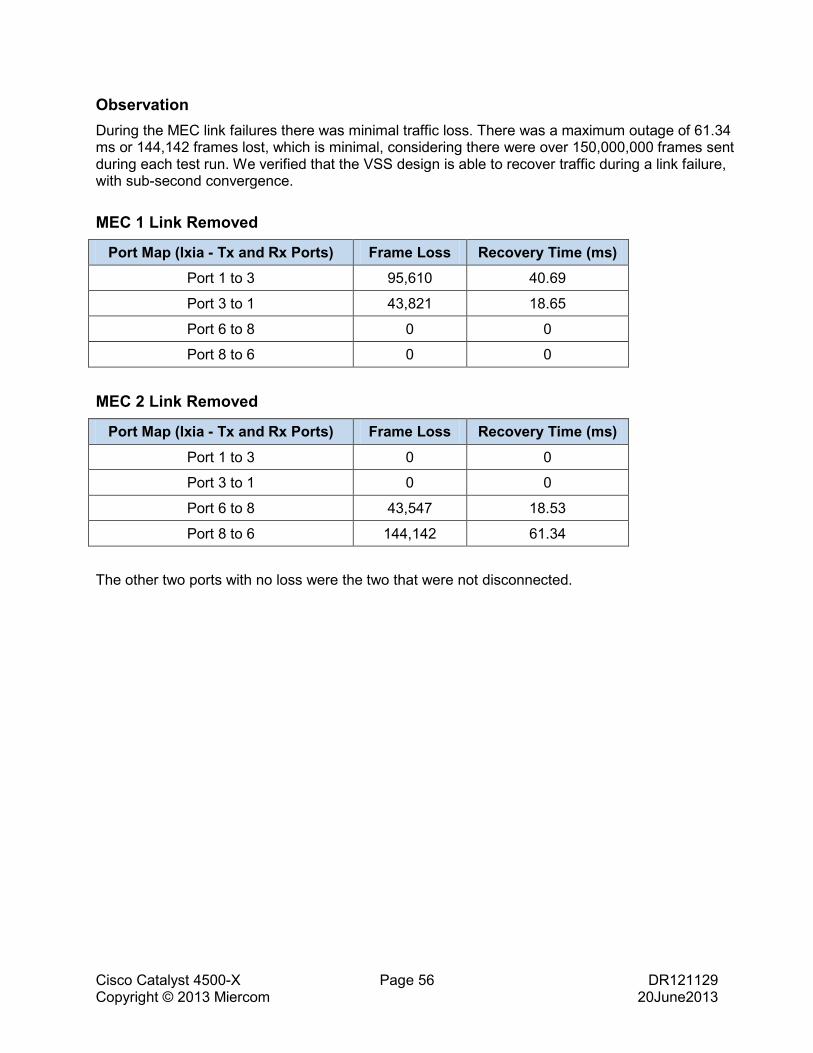
Observation During the MEC link failures there was minimal traffic loss. There was a maximum outage of 61.34 ms or 144,142 frames lost, which is minimal, considering there were over 150,000,000 frames sent during each test run. We verified that the VSS design is able to recover traffic during a link failure, with sub-second convergence.
MEC 1 Link Removed
Port Map (Ixia - Tx and Rx Ports) Frame Loss Recovery Time (ms) Port 1 to 3 95,610 40.69
Port 3 to 1 43,821 18.65
Port 6 to 8 0 0
Port 8 to 6 0 0
MEC 2 Link Removed
Port Map (Ixia - Tx and Rx Ports) Frame Loss Recovery Time (ms)
Port 1 to 3 0 0
Port 3 to 1 0 0
Port 6 to 8 43,547 18.53
Port 8 to 6 144,142 61.34
The other two ports with no loss were the two that were not disconnected.
Cisco Catalyst 4500-X Page 57 DR121129 Copyright © 2013 Miercom 20June2013
11.0 Resiliency during VSS Active to Standby Switchover
Description High Availability is important during VSS active to standby switchover. This process requires the active switch to be restarted, and the standby switch should instantly become the active switch, maintaining all switch configurations. We were curious to see how much frame loss is present during a VSS SSO (Stateful Switchover).
Configuration The test bed includes four Cisco Catalyst 4500-X switches. Two switches are configured as a VSS pair and the remaining two are access switches. Traffic was sent using two north and south streams. See VSS Configuration Topology diagram on page 52.
The test was configured with two port streams sending/receiving from the Ixia to the north access switch and two port streams sending/receiving on the south access switch from the Ixia. The two port streams are sending traffic bi-directionally.
After traffic was started on the Ixia, the active-to-standby switchover was initiated once 50,000,000 frames were sent.
The traffic rate for each stream is 2,349,624 fps.
Purpose The purpose of this test is to measure the frame loss when an active to standby switch over occurs. The test also validates whether the VSS SSO causes any outages during the process.
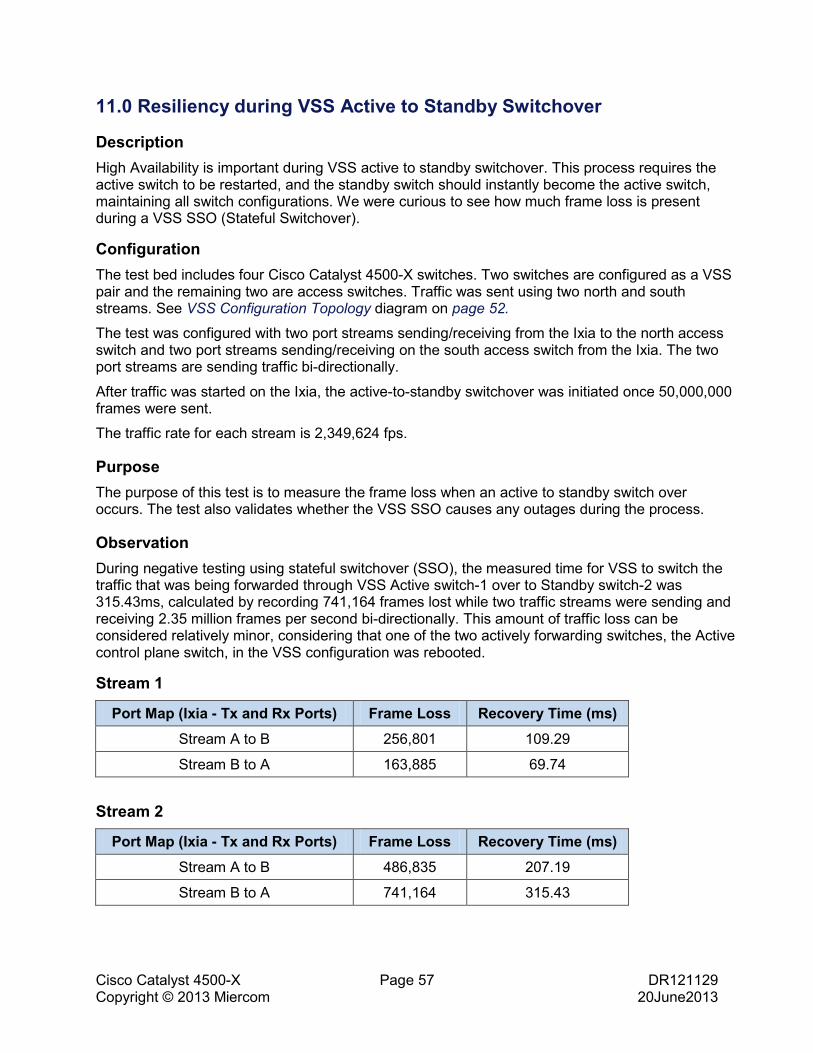
Observation During negative testing using stateful switchover (SSO), the measured time for VSS to switch the traffic that was being forwarded through VSS Active switch-1 over to Standby switch-2 was 315.43ms, calculated by recording 741,164 frames lost while two traffic streams were sending and receiving 2.35 million frames per second bi-directionally. This amount of traffic loss can be considered relatively minor, considering that one of the two actively forwarding switches, the Active control plane switch, in the VSS configuration was rebooted.
Stream 1
Port Map (Ixia - Tx and Rx Ports) Frame Loss Recovery Time (ms) Stream A to B 256,801 109.29
Stream B to A 163,885 69.74
Stream 2
Port Map (Ixia - Tx and Rx Ports) Frame Loss Recovery Time (ms) Stream A to B 486,835 207.19
Stream B to A 741,164 315.43
Cisco Catalyst 4500-X Page 58 DR121129 Copyright © 2013 Miercom 20June2013
12.0 Resiliency during ISSU
Description An ISSU (In-Service Software Upgrade) upgrades the software version on a switch in the VSS configuration. During the ISSU, VSS should maintain maximum uptime and only have minimal traffic loss for the duration of the ISSU. A software upgrade or downgrade can be performed one at a time.
Configuration The test bed includes four Cisco Catalyst 4500-X switches. Two switches are configured as a VSS pair and the remaining two are access switches. Traffic was sent using two north and south streams. See VSS Configuration Topology diagram on page 52.
The test was configured with two port streams sending/receiving from the Ixia to the north access switch and two port streams sending/receiving on the south access switch from the Ixia. The traffic rate for each stream is 2,349,624 fps.
Purpose To determine how much frame loss and downtime occurs during an ISSU.
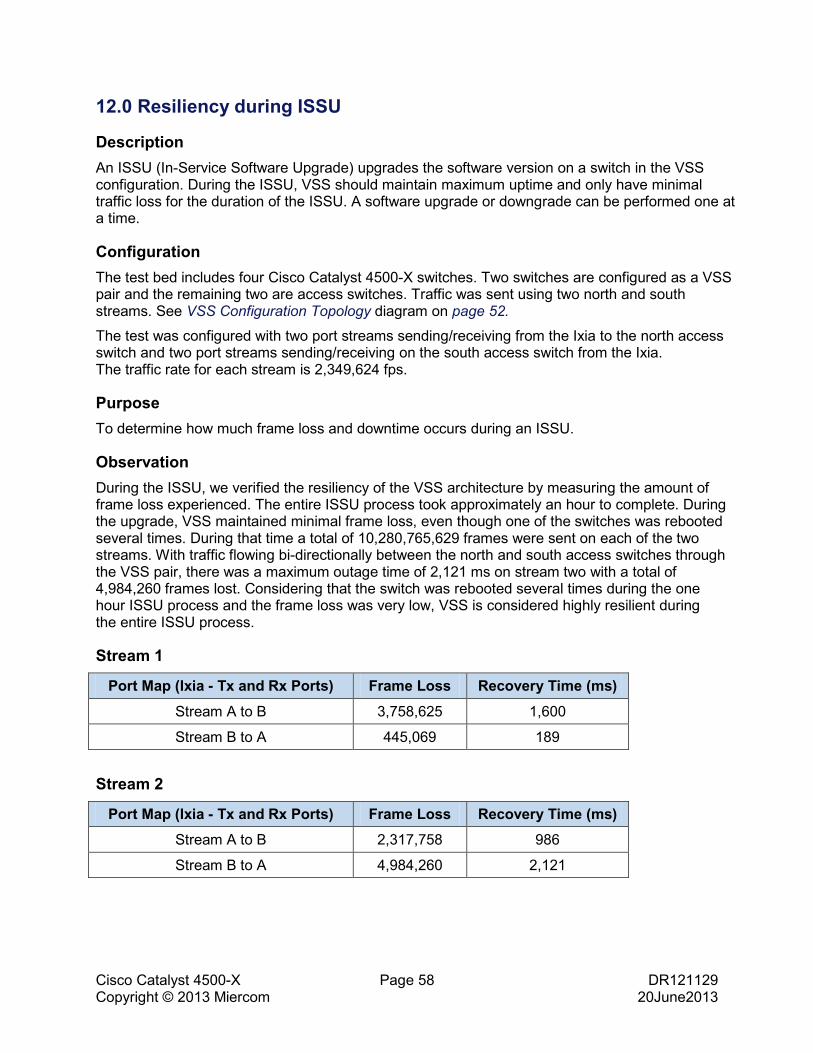
Observation During the ISSU, we verified the resiliency of the VSS architecture by measuring the amount of frame loss experienced. The entire ISSU process took approximately an hour to complete. During the upgrade, VSS maintained minimal frame loss, even though one of the switches was rebooted several times. During that time a total of 10,280,765,629 frames were sent on each of the two streams. With traffic flowing bi-directionally between the north and south access switches through the VSS pair, there was a maximum outage time of 2,121 ms on stream two with a total of 4,984,260 frames lost. Considering that the switch was rebooted several times during the one hour ISSU process and the frame loss was very low, VSS is considered highly resilient during the entire ISSU process.
Stream 1
Port Map (Ixia - Tx and Rx Ports) Frame Loss Recovery Time (ms)
Stream A to B 3,758,625 1,600
Stream B to A 445,069 189
Stream 2
Port Map (Ixia - Tx and Rx Ports) Frame Loss Recovery Time (ms) Stream A to B 2,317,758 986
Stream B to A 4,984,260 2,121
Cisco Catalyst 4500-X Page 59 DR121129 Copyright © 2013 Miercom 20June2013
13.0 SPAN Performance
Description SPAN is a built-in feature that allows an administrator to analyze network traffic. SPAN essentially copies traffic from one port to another port.
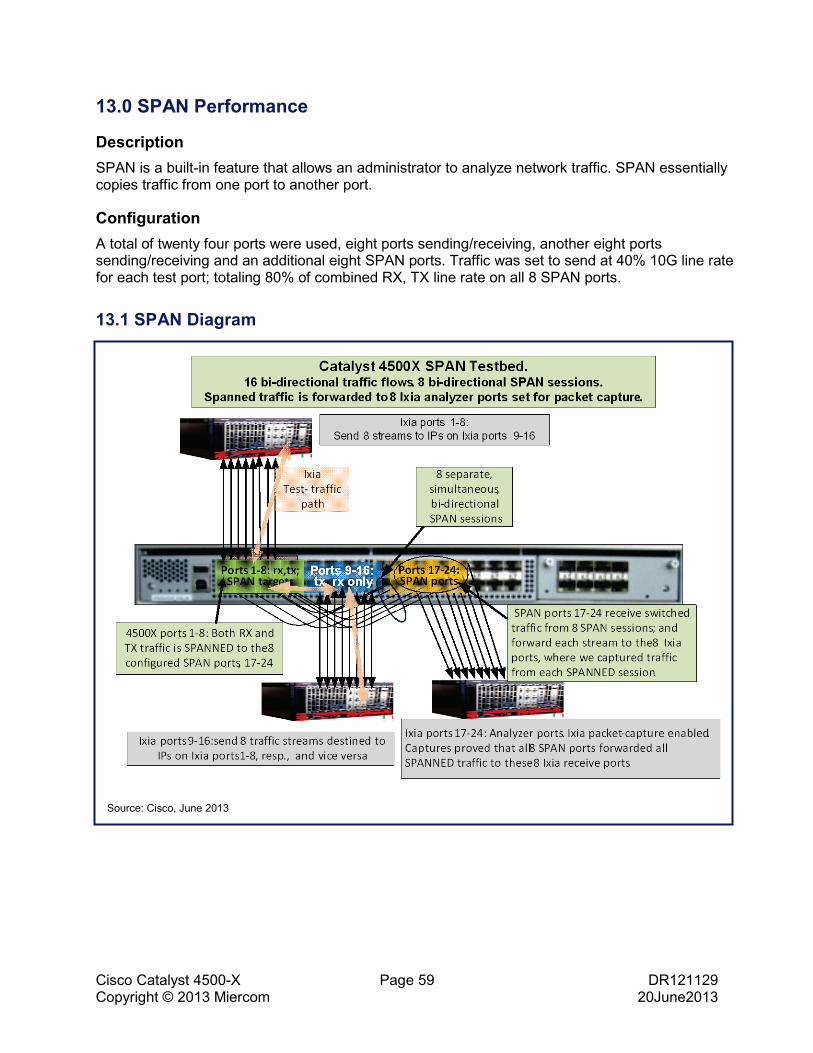
Configuration A total of twenty four ports were used, eight ports sending/receiving, another eight ports sending/receiving and an additional eight SPAN ports. Traffic was set to send at 40% 10G line rate for each test port; totaling 80% of combined RX, TX line rate on all 8 SPAN ports.
13.1 SPAN Diagram
Source: Cisco, June 2013
Cisco Catalyst 4500-X Page 60 DR121129 Copyright © 2013 Miercom 20June2013
Purpose To determine the maximum number and maximum capacity of simultaneous bi-directional SPAN sessions the Catalyst 4500-X is able to support. SPAN is a Cisco pseudo-acronym which stands for “Switched Port Analyzer.” Cisco claims that the 4500-X can simultaneously SPAN (monitor/copy) both ingress and egress traffic on 8 different SPAN-target ports to 8 separate SPAN ports, with very little CPU impact.
Observation We successfully validated that the Catalyst 4500-X is capable of 8 simultaneous bi-directional SPAN sessions, and capable of monitoring the 8 SPANNED ports at 80% of 10 Gbps. All packets sent by the 16 Ixia traffic generator ports – in both directions, were SPANNED from their intersecting ports 1-8 to the 8 SPAN ports, and received by the 8 Ixia capture test ports. While forwarding and copying traffic, the CPU utilization averaged 5.5% and never exceeded 10%. This is due to an integrated packet replication module and replication engine embedded in the 4500-X forwarding ASIC.


