Detailed Modeling of Soot Formation from Solid Fuels Alexander J. Josephson 1,2 Rodman R. Linn 2 David O. Lignell 1 9 th FM Global Open Source CFD Fire Modeling Workshop 9 May – 10 May, 2017 Norwood, Massachusetts 1 Department of Chemical Engineering, Brigham Young University, Provo, Utah 2 Earth and Environmental Sciences Division, Los Alamos National Lab, Los Alamos, New Mexico
Transcript
Detailed Modeling of Soot Formation from Solid Fuels
Alexander J. Josephson1,2
Rodman R. Linn2
David O. Lignell1
9th FM Global Open Source CFD Fire Modeling Workshop9 May – 10 May, 2017
Norwood, Massachusetts
1Department of Chemical Engineering, Brigham Young University, Provo, Utah2Earth and Environmental Sciences Division, Los Alamos National Lab, Los Alamos, New Mexico
Acknowledgements/Background
• Work began as part of the CCMSC’s PSAAP II project § Demonstrate exascale computing with V&V/UQ to more rapidly deploy new technologies for providing
low cost, low emission electric power generation§ Full-scale simulation of an oxy-coal boiler§ Work supported by the Department of Energy, National Nuclear Security Administration, under Award
Number(s) DE-NA0002375
• Work continued through the EES division at LANL§ HIGRAD/FIRETEC- combines physics models that represent combustion, heat transfer, aerodynamic
drag and turbulence. Designed to simulate the constantly changing, interactive relationship between fire and its environment.
§ Predicting solid particle emissions from wildfires§ Work supported by
Soot Introduction
Soot
• Particles heavily impact radiative heat transfer
• Changes flame chemistry
• Health and environmental impacts
Gaseous Fuels
• Rate largely determined by formation of precursors and time in fuel-rich environment
• Soot precursors are PAHs
Soot Precursors
Gas-Phase Molecules
Nucleation Coagulation
Growth
Aggregation
Growth
Consumption
Solid Fuels
• Parent fuel gives off tar during primary pyrolysis
• Tar is primary soot precursor
Solid Fuel
Light Gases CharTar
Devolatilization
Primary Soot Aggregates
Nucleation
Aggregation
Consumption
Soot Challenges
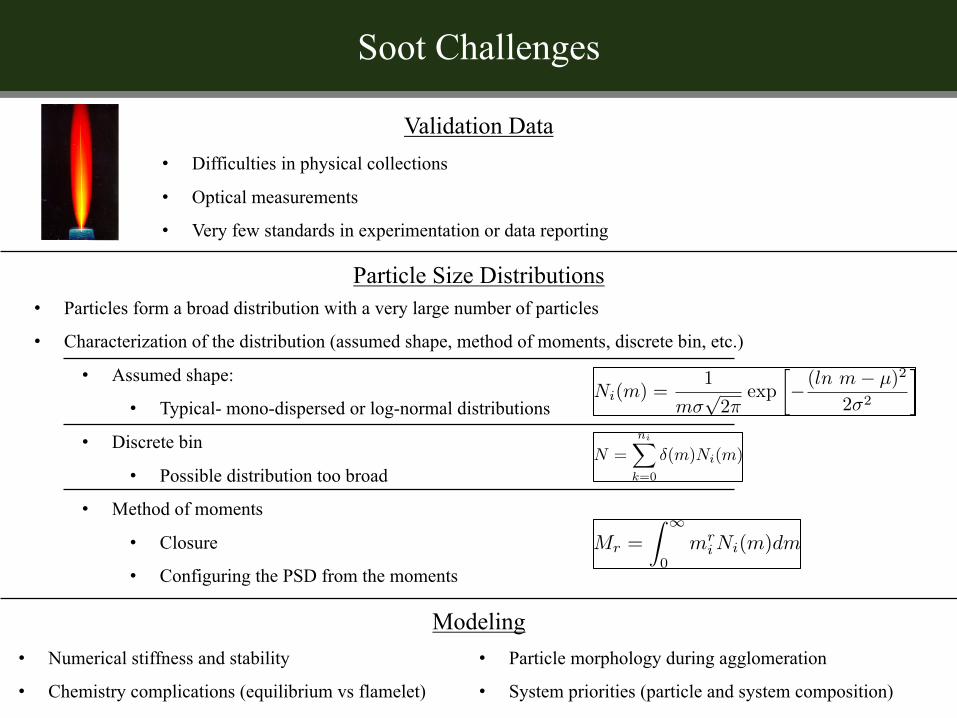
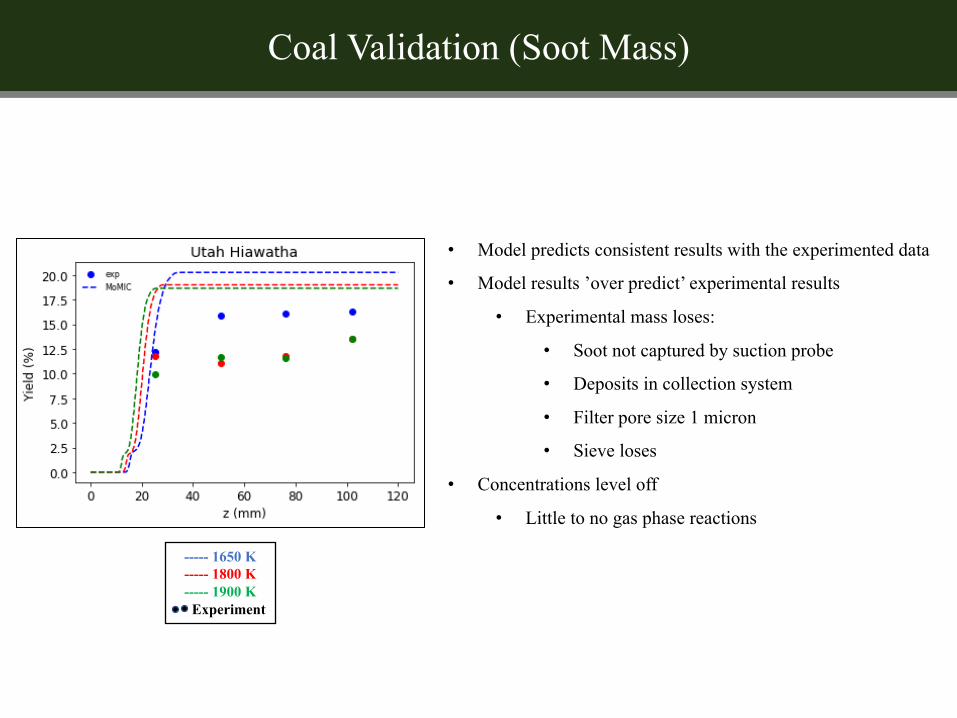
Validation Data• Difficulties in physical collections
• Optical measurements
• Very few standards in experimentation or data reporting
Particle Size Distributions• Particles form a broad distribution with a very large number of particles
• Characterization of the distribution (assumed shape, method of moments, discrete bin, etc.)
• Assumed shape:
• Typical- mono-dispersed or log-normal distributions
• Discrete bin
• Possible distribution too broad
• Method of moments
• Closure
• Configuring the PSD from the moments
• Numerical stiffness and stability
• Chemistry complications (equilibrium vs flamelet)
• Particle morphology during agglomeration
• System priorities (particle and system composition)
Ni(m) =
1
m�p2⇡
exp
� (ln m� µ)2
2�2
�
Mr =
Z 1
0mr
iNi(m)dm
N =niX
k=0
�(m)Ni(m)
Modeling
Model Overview
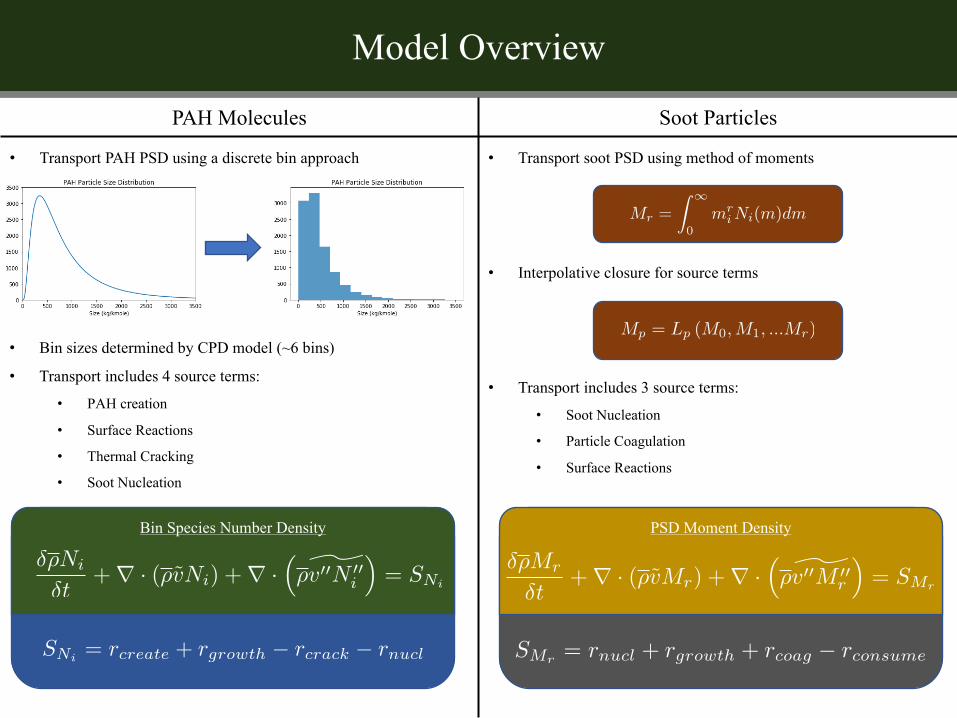
PAH Molecules Soot Particles
• Transport PAH PSD using a discrete bin approach
• Bin sizes determined by CPD model (~6 bins)
• Transport includes 4 source terms:
• PAH creation
• Surface Reactions
• Thermal Cracking
• Soot Nucleation
Bin Species Number Density
�⇢Ni
�t+r · (⇢vNi) +r ·
⇣⇢v00N 00
i
⌘= SNi
SNi = r
create
+ rgrowth
� rcrack
� rnucl
• Transport soot PSD using method of moments
• Interpolative closure for source terms
• Transport includes 3 source terms:
• Soot Nucleation
• Particle Coagulation
• Surface Reactions
Mr =
Z 1
0mr
iNi(m)dm
Mp = Lp (M0,M1, ...Mr)
PSD Moment Density
�⇢Mr
�t+r · (⇢vMr) +r ·
⇣⇢v00M 00
r
⌘= SMr
SMr = r
nucl
+ rgrowth
+ rcoag
� rconsume
PAH Model - Creation
PAH molecules creation from two sources:
1. Release of tar molecules by parent fuel
• Rate determined from results of CPD model (Fletcher, 1992)
• PSD spans broad range (~150 kg/kmole – 3000 kg/kmole)
• Lognormal PSD
• Coal (median ~350 kg/kmole, small variance)
• Biomass (median ~225 kg/kmole, larger variance)
• Varies over time, shifts to higher MWs.
2. Formation of aromatic rings from the gas-phase
• Rate determined by ABF mechanism (Appel, 2000)
• Creation of pyrene added to the PAH bins
• Usually insignificant source of PAH (But not always, Zeng, 2011)
Hypothetical Coal Tar Molecule
Pyrene Molecule
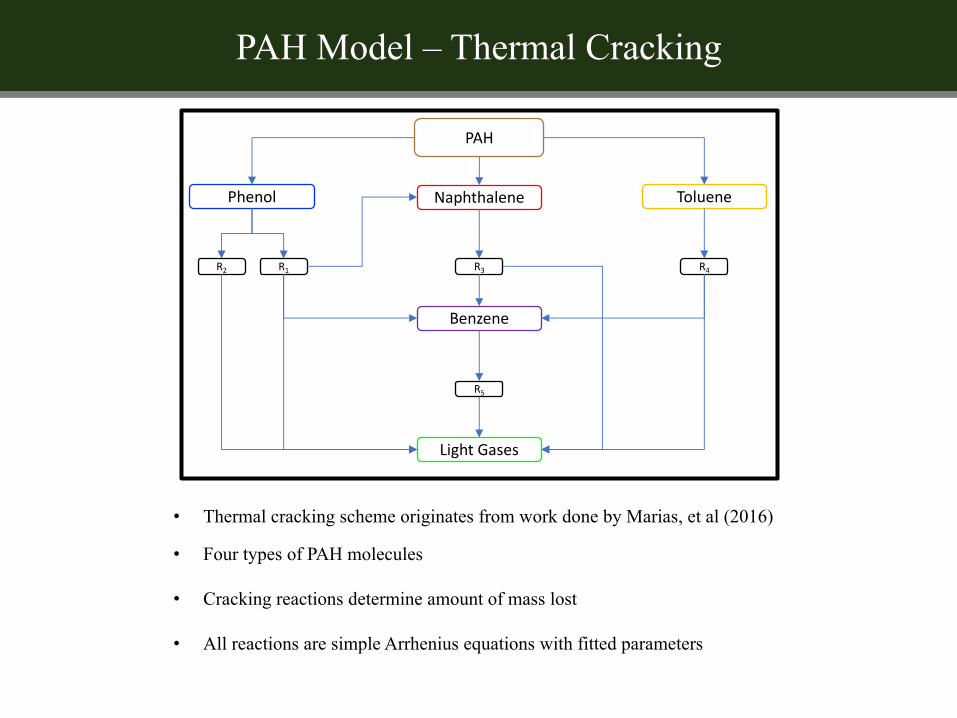
PAH Model – Thermal Cracking
PAH
Phenol Naphthalene Toluene
Benzene
LightGases
R1R2 R3 R4
R5
• Thermal cracking scheme originates from work done by Marias, et al (2016)
• Four types of PAH molecules
• Cracking reactions determine amount of mass lost
• All reactions are simple Arrhenius equations with fitted parameters
PAH Model – Thermal Cracking
PAH
Phenol Naphthalene Toluene
Benzene
LightGases
R1R2 R3 R4
R5
• It is undesirable to transport four species for each PAH bin
• Fraction of each species assumed to be constant
• Fraction estimation
• Maximum tar concentration used
• Equal parts phenol, naphthalene, and toluene
• Phenol and toluene branches established by CNMR and
Elemental analyses of parent fuel
• Cracking scheme applied over time with soot nucleation
until 99% PAH consumed
• Average species fraction computed and used as constants
over long simulation
Change in PAH species
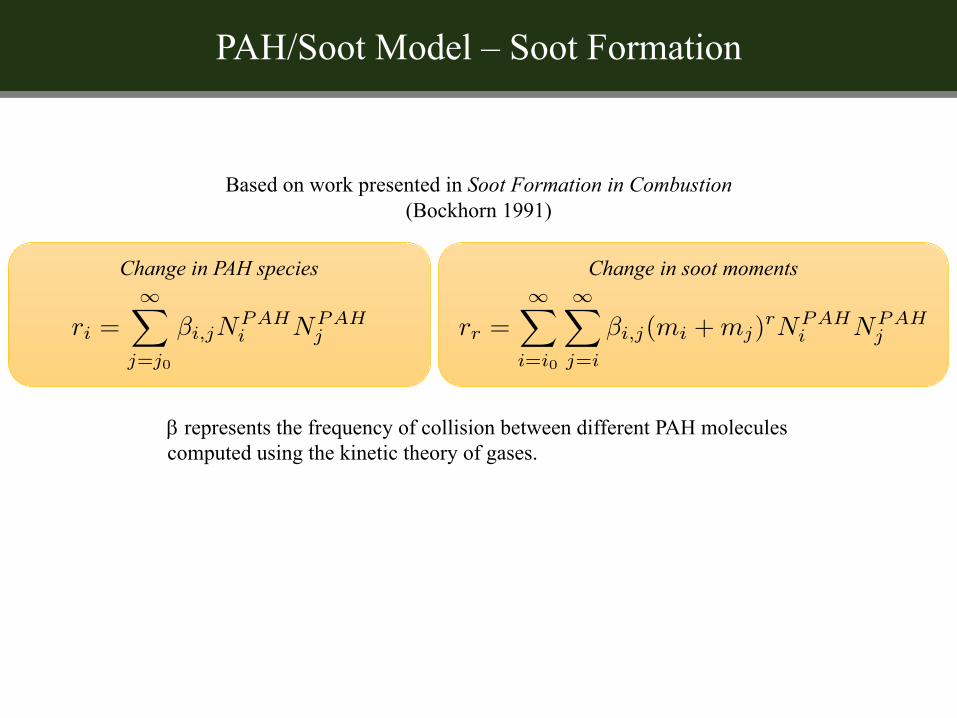
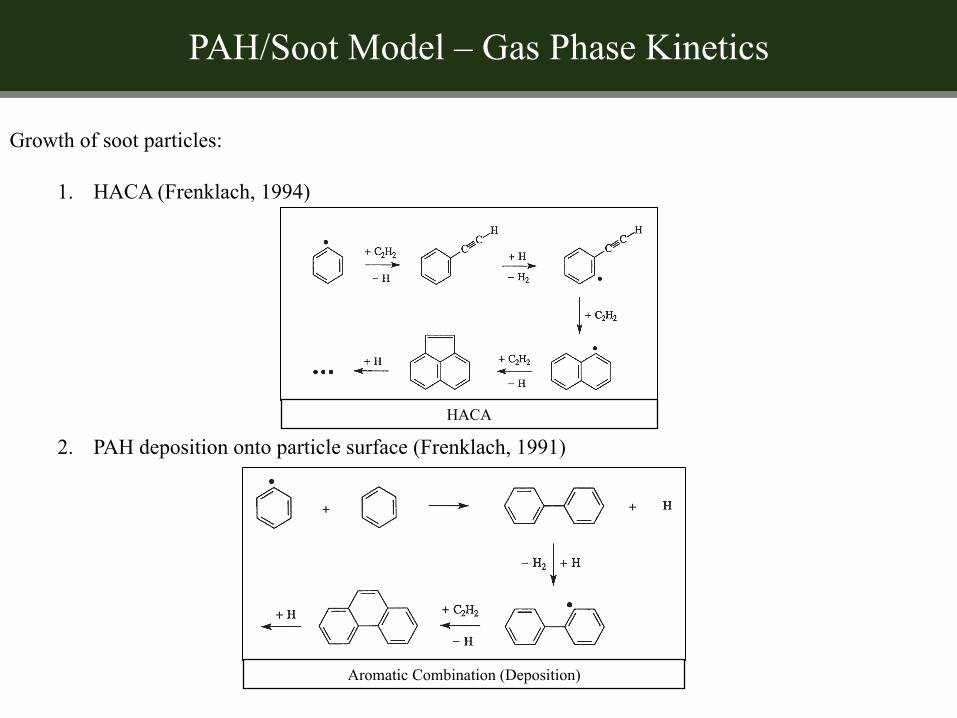
PAH/Soot Model – Soot Formation
Based on work presented in Soot Formation in Combustion(Bockhorn 1991)
ri =1X
j=j0
�i,jNPAHi NPAH
j
Change in soot moments
b represents the frequency of collision between different PAH molecules computed using the kinetic theory of gases.