This is the Accepted Manuscript version of an article accepted for publication in IEEE Transactions on Plasma Science. The Version of Record is available online at https://doi.org/10.1109/TPS.2017.2697005. Detailed Numerical Simulation of Cathode Spots in Vacuum Arcs I M. D. Cunha 1 , H. T. C. Kaufmann 1 , M. S. Benilov 1 , W. Hartmann 2 , and N. Wenzel 2 1 Departamento de Fsica, FCEE, Universidade da Madeira, Largo do Municpio, 9000 Funchal, Portugal, and Instituto de Plasmas e Fusªo Nuclear, IST, Universidade de Lisboa, Portugal 2 Siemens AG, Corporate Technology, Günther-Scharowsky-Strasse 1, 91058 Erlangen, Germany Abstract A model of cathode spots in high-current vacuum arcs is developed with account of the plasma cloud left over from a previously existing spot, all mechanisms of current transfer to the cathode surface, including the contribution of the plasma produced by ionization of the metal vapor emitted in the spot, and the Joule heat generation in the cathode body. The simulation results allow to clearly identify the di/erent phases of life of an individual spot: the ignition, the expansion over the cathode surface, and the thermal explosion. The expansion phase is associated with a nearly constant maximum temperature of the cathode, which occurs at the surface and is approximately 4700 4800 K. Thermal explosion is a result of a thermal instability (runaway), which develops below the cathode surface when the Joule heating comes into play. The development of the spot is interrupted if the plasma cloud has been extinguished: the spot is destroyed by heat removal into the bulk of the cathode due to thermal conduction. Therefore, di/erent scenarios are possible depending on the time of action of the cloud: the spot may be quenched either before having been formed, or during the expansion phase, or even at the initial stage of thermal explosion. Keywords: Vacuum arcs, Electrodes, Arc discharges. 1
Transcript
This is the Accepted Manuscript version of an article accepted for publication in IEEE Transactions on
Plasma Science. The Version of Record is available online at
https://doi.org/10.1109/TPS.2017.2697005.
Detailed Numerical Simulation of Cathode Spots inVacuum Arcs– I
M. D. Cunha1, H. T. C. Kaufmann1, M. S. Benilov1,W. Hartmann2, and N. Wenzel2
1Departamento de Física, FCEE, Universidade da Madeira,Largo do Município, 9000 Funchal, Portugal, and
Instituto de Plasmas e Fusão Nuclear, IST,Universidade de Lisboa, Portugal
A model of cathode spots in high-current vacuum arcs is developed with accountof the plasma cloud left over from a previously existing spot, all mechanisms ofcurrent transfer to the cathode surface, including the contribution of the plasmaproduced by ionization of the metal vapor emitted in the spot, and the Joule heatgeneration in the cathode body. The simulation results allow to clearly identifythe different phases of life of an individual spot: the ignition, the expansion overthe cathode surface, and the thermal explosion. The expansion phase is associatedwith a nearly constant maximum temperature of the cathode, which occurs at thesurface and is approximately 4700 − 4800K. Thermal explosion is a result of athermal instability (runaway), which develops below the cathode surface when theJoule heating comes into play. The development of the spot is interrupted if theplasma cloud has been extinguished: the spot is destroyed by heat removal into thebulk of the cathode due to thermal conduction. Therefore, different scenarios arepossible depending on the time of action of the cloud: the spot may be quenchedeither before having been formed, or during the expansion phase, or even at theinitial stage of thermal explosion.Keywords: Vacuum arcs, Electrodes, Arc discharges.
1
1 Introduction
Erosion of cathode material in vacuum arcs provides the medium for the discharge, thecathode vapor, and the understanding of the plasma-cathode interaction is one of themost important issues in the theory of vacuum arcs. In some cases, current transfer tocathodes of vacuum arcs can occur in the diffuse mode. (This happens when the averagetemperature of the cathode surface is high enough, typically around 2000K; e.g., [1]and references therein. It is interesting to note that the physics of this regime, whilesupposedly being relatively simple, still have not been fully understood; [2] and referencestherein.) On the other hand, in most cases the current on the cathode of a vacuum arc islocalized in bright, narrow regions, or cathode spots. Cathode spots in vacuum arcs havebeen an object of careful experimental investigations; e.g. [3—9] and references therein.At present, the most important mechanisms dominating the physics of cathode spots areassumed to be bombardment of the cathode surface by ions coming from an "external"plasma (plasma generated for the arc triggering, a bulk background plasma, or a plasmacloud left over from a previous spot in the immediate vicinity); vaporization of the cathodematerial in the spot, its subsequent ionization and the interaction of the produced plasmawith the cathode; Joule heating in the cathode body; motion of the molten metal underthe effect of the plasma pressure and the Lorentz force.Several decades of research have resulted in a variety of approaches available in the lit-
erature for modeling cathode spots in vacuum arcs. There are space-resolved descriptionsof spots based on numerical solution of 1D [10—15] and 2D [16—25] differential equations.Many of the available models consider the existence of an external plasma which providesions that enter the cathode sheath with the Bohm speed and impinge on the cathode sur-face. This ion source, with a given spatial and temporal distribution, heats the cathodeand initiates the spot. The development of the spot is computed with the heat conduc-tion equation, taking into account Joule heating and the energy balance at the cathodesurface. In a number of works, such modeling has revealed a fast increase of temperaturein a certain region of the cathode body up to values exceeding the critical temperature ofthe cathode material. This phenomenon may be interpreted as a microexplosion of thecathode and is often called thermal runaway.Most models neglect the hydrodynamic aspects of the problem, such as motion of the
molten metal and convective heat transfer. The exception are works [18—20, 24]. Themodels [19] and [24] employ significantly different approximations and the results differas well. In [19], the hydrodynamic aspects are considered in a simplified way, on the basisof analysis of the pressure balance at the plasma-cathode interface. A stability criteriondetermines whether the molten protrusion remains stable or is removed, thus accountingfor the change in shape of the cathode surface. No thermal runaway was found; theprotrusion is destroyed by melting and under the action of the plasma pressure.In [24], the hydrodynamic aspects were treated in a more accurate way, on the basis of
the Navier-Stokes equations. In contrast, no mechanism of current transfer to the cathodesurface was included and the spatial and temporal distributions of the heat flux densityto and the plasma pressure on the cathode surface were specified as a part of input. Themodeling results reveal the formation of a crater with an axially symmetric liquid-metaljet at the periphery, as a result of displacement of the molten material due to the pressure
2
exerted by the plasma over the cathode surface. Depending on the conditions, the jethead can reach the critical temperature. The formation of droplets does not occur inthe modeling. The authors supposed that this occurs through a breaking of the axialsymmetry of the jet due to the development of a hydrodynamic instability, presumablyof the Rayleigh—Plateau type [26—28], so its simulation would require 3D modeling whichwas not attempted in [24].Note that one of the consequences of current transfer to the cathode surface not being
considered in [24] is the neglect of electron emission cooling, which is a strong effect [23, 29]that can significantly affect simulation results. The other consequence is the neglect ofthe pressure exerted over the cathode surface by ions produced by ionization of the vaporemitted in the spot.Works [18, 20] assumed that the most important features of the physics of cathode
spots of vacuum arcs are a continuous (without an interface) metal-plasma transition andan explosion-like expansion of the cathode material. A nonstationary two-temperaturemagnetohydrodynamic model is used with account of ionization kinetics and a wide-rangeequation of state. Cooling of the cathode due to extraction of the electrons from the metal,which is a strong effect as mentioned above, seems to be neglected. Also neglected arespace charge effects.Thus, although significant advances have been achieved in the last decades, the nu-
merical modeling of cathode spots in vacuum arcs has been inconclusive. The aim of thiswork is to perform modeling with account of all of the relevant mechanisms and thuscome closer to the understanding of the nature of cathode spots of vacuum arcs. In par-ticular, it will be shown that the effect of the plasma produced by ionization of the metalvapor emitted in the spot indeed significantly affects the development of the spot and theformation of jets and can result in a detachment of droplets.In this paper, the thermal development of a spot is considered, with account of the
plasma cloud left over from a previously existing spot, all mechanisms of current transferto the cathode surface, including the contribution of the plasma produced by ionization ofthe metal vapor emitted in the spot, and the Joule heat generation in the cathode body.The effect of the spatial and temporal distributions of the leftover plasma on spot ignitionand development is studied and the temporal evolution of the cathode temperature and ofthe spot current is analyzed. It is found that in the cases where the spot is ignited, it doesnot reach steady-state; either it explodes (thermal runaway) or is destroyed by thermalconduction after the heating by the leftover plasma has been extinguished. Results ofa detailed numerical modeling with an account of hydrodynamic processes (convectiveheat transfer, motion of molten metal and formation of the crater, liquid-metal jet anddroplets) will be reported in the second part of the work.The outline of the paper is as follows. The numerical model is introduced in Sec. 2.
Results of simulation are reported and discussed in Sec. 3. Conclusions are summarizedin Sec. 4.
3
2 The model
The model employed in this work builds upon a self-consistent space-resolved model ofstationary cathode spots in vacuum arcs [23, 30, 31]. It exploits the fact that a significantpower is deposited into the near-cathode space-charge sheath by the arc power supply.Part of this power is transported from the sheath to the cathode surface and the rest istransported by electric current into the arc column. The latter means that the plasma-cathode interaction to the first approximation is not affected by processes in the arccolumn. Note that this approach, which is sometimes called the model of nonlinear surfaceheating, has been used also in the theory and modeling of plasma-cathode interaction inarcs in ambient gases; the recent comparison of models of various levels of complexityof plasma-cathode interaction in atmospheric-pressure arcs [32] has confirmed that themodel of nonlinear surface heating, while being the simplest self-consistent approach, isquite accurate.The thickness of the near-cathode plasma layer is much smaller than the characteristic
radius of the spot, hence current transfer through this layer is locally one-dimensional(1D). Therefore, the problem of plasma-cathode interaction may be solved in two steps.In the first step, characteristics of the near-cathode plasma layer are evaluated usinga 1D model. In particular, the net densities of the energy flux, q = q (Tw, U), andelectric current, j = j (Tw, U), are found, computed as functions of the local cathodesurface temperature Tw and the near-cathode voltage drop U . In the second step, thetemperature T and electric potential ϕ distributions are calculated in the cathode bodyby means of solving the time-dependent heat conduction equation, written with account ofJoule heat generation in the body of the electrode, and the equation of current continuitysupplemented with Ohm’s law:
ρcp∂T
∂t= ∇ · (κ∇T ) + σ(∇ϕ)2, (1)
∇ · (σ∇ϕ) = 0. (2)
The equations (1), (2) are solved under the assumption of axial symmetry in cylindricalcoordinates (r, z). The material properties, mass density ρ, specific heat cp, and thermaland electrical conductivities κ and σ, are treated as functions of the local temperature.Boundary conditions on the cathode surface are written in terms of densities of the energyflux, κ∂T
∂n= q (Tw, U), and electric current, σ
∂ϕ∂n= j (Tw, U), from the plasma to the
surface, calculated in the previous step, where n is a direction normal to the cathodesurface and directed outward. The boundary conditions far away from the spot are T →T∞ and ϕ→ 0, where T∞ is a given parameter (the temperature of the cathode far awayfrom the spot).The model employed in this work takes into account two contributions to the densities
of energy flux q and electric current j from the plasma to the cathode surface, computedindependently of each other: the plasma produced from the metal vapor emitted by thespot and the leftover plasma cloud,
q = q1 + q2, j = j1 + j2. (3)
4
Note that this simple superposition neglects a nonlinear interaction between the leftoverplasma and the freshly-produced vapor from the spot. Contributions q1 = q1 (Tw, U)and j1 = j1 (Tw, U) are obtained by means of the model of near-cathode plasma layersin vacuum arcs [31], based on a numerical simulation of the near-cathode space-chargesheath with ionization of atoms emitted by the cathode surface [30]. Note that whileelectron emission from cathodes of arcs in ambient gas is of thermionic nature and isadequately described by the Richardson-Schottky formula, emission from hot cathodes ofvacuum arcs is of thermo-field nature and can be adequately described by the Hantzschefit formula [33]; see also corrections in [11] and a comparison in [34]. Since, however,this modeling is intended to describe all stages of life of a spot including ones where thecathode is cold, we do not rely on approximate formulas: the code [31] used in this workemploys the Murphy and Good formalism [35]. (More precisely, the electron emissioncurrent density is evaluated by means of the method [34] and the effective work function,which governs the emission-related electron energy flux, by means of the fit formulas [36].)The contribution of the leftover plasma cloud is written as
q2 = q(cl)i f1 (r) f2 (t) , j2 = j
(cl)i f1 (r) f2 (t) , (4)
where q(cl)i and j(cl)i are given parameters and f1 (r) and f2 (t) are given functions charac-terizing the spatial distribution and temporal evolution of the leftover plasma cloud. Thespatial distribution is assumed to be Gaussian: f1(r) = e−(r/a)
2
, where a is a given para-meter characterizing the spatial extension of the cloud. The plasma cloud does not changeappreciably in a time interval τ and then decays with a characteristic time constant τ 0:
f (t) =
1, t 6 τ
exp
(−(t−ττ0
)2), t > τ
, (5)
where τ and τ 0 are given parameters.In order to specify the densities of ion current j(cl)i and energy flux q(cl)i from the leftover
plasma cloud to the cathode surface, we assume that the cold ions enter the near-cathodespace-charge sheath with the Bohm speed and are accelerated by the near-cathode voltagedrop U . Then
j(cl)i = Zeni
√kTemi
, q(cl)i = j
(cl)i U, (6)
where ni, Te, and Z are ion density, electron temperature, and average ion charge numberin the cloud, e is the electron charge, mi is the ion mass, and k is the Boltzmann constant.Contributions q1 = q1 (Tw, U) and j1 = j1 (Tw, U) and all the other characteristics
of the near-cathode plasma are computed by means of a Fortran code implementing the1D model of near-cathode plasma layers in vacuum arcs [31]. The heat conduction andcurrent continuity equations are solved numerically by means of the commercial softwareCOMSOL Multiphysics. The finite-element mesh is strongly non-uniform, in particularin the vicinity of the spot edge, due to a very fast variation of the density of the energyflux coming from the plasma. A free triangular mesh was used, with several successiverefinements in the spot region. The boundary conditions far away from the spot arewritten in the same form as in [23].
5
Simulation results reported in this paper refer to copper cathodes of two geometries:a planar cathode and a cathode with a Gaussian-shaped microprotrusion of the formz = h e−(r/d)
2
, where h and d are given parameters characterizing, respectively, the heightand the radius of the protrusion. The values h = 1µm, d = 0.8µm were assumed. (Notethat the radius of the protrusion at z = 0.1h, given by rprot = d
√ln 10, equals 1.2µm.)
The thermal and electrical conductivities of copper were the same as in [23]. Thespecific heat was the same as in [37]. The function ρ (T ) was evaluated with the use ofexperimental data [38] and estimates [39] for the mass density of liquid copper in thetemperature ranges T = 1358 − 2450K and T = 3000 − 7000K, respectively, and thevalue of the mass density at the critical point from [40] (ρ = 2390 kg/m3 for T = 8390K).The near-cathode voltage drop U was set equal to 20V, which corresponds to initiation
of spots under conditions of high-current vacuum arcs typical for, e.g., high-power circuitbreakers. Values of the ion density ni = 1026m−3, electron temperature Te = 2 eV, andion charge Z = 2 were assumed as characteristic for the dense plasma left over from aprevious spot for copper cathodes (e.g., [41] and references therein). Note that theseparameters result in a value of q(cl)i of approximately 1.1 × 10¹²W/m2, which is in linewith the values considered by previous researchers, e.g. [21, 22, 24, 25]. The characteristictime τ 0 was set equal to 1 ns.
3 Results
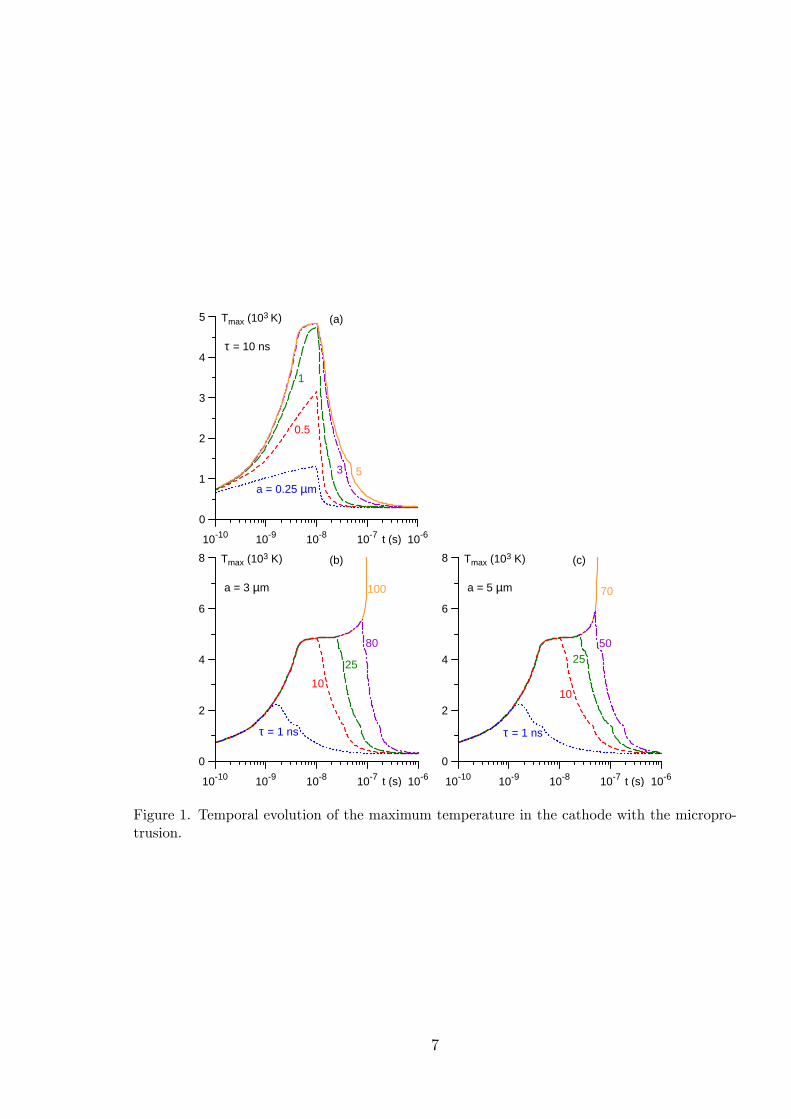
The temporal evolution of the maximum temperature Tmax in the body of the cathodewith the microprotrusion for different values of a and τ is shown in Fig. 1. For τ = 10 ns(Fig. 1a), two scenarios are seen depending on the value of a. Scenario 1 occurs in thecases a = 0.25 and 0.5µm: the maximum temperature of the microprotrusion attains avalue of about 1300K for a = 0.25µm and 3100K for a = 0.5µm, and then abruptlystarts decreasing once the leftover plasma is extinguished (i.e. when t > τ). One can saythat the spot was not formed in these two cases. In the case a = 1µm, the maximumtemperature of the microprotrusion attains a significantly higher value of about 4700Kat t ≈ 10 ns, however also starts decreasing immediately after. It is legitimate to say thatthe spot was not ignited in this case either.Scenario 2 occurs in the cases a = 3µm and a = 5µm: the temperature of the cathode
does not start decreasing immediately after attaining its maximum value (which happensat approximately 5 ns), but rather stays more or less constant around 4700 − 4800K forsome time. It is legitimate to say that the spot was ignited and the ignition time is tig ≈5 ns. The similarity of the temporal evolution of Tmax in these two cases is understandablesince the spatial extension of the leftover plasma cloud exceeds the protrusion radius rprotin both cases. In all the cases, Tmax for t & 100 ns is close to 300K: the energy suppliedby the leftover plasma cloud has been removed by thermal conduction into the bulk ofthe cathode.The cases a = 3µm and a = 5µm for τ exceeding 10 ns should be studied in order to
identify conditions where Tmax reaches the critical temperature of copper, which is 8390K,i.e., thermal explosion (thermal runaway) occurs. The corresponding plots are shown inFigs. 1b,c. Results for τ = 1ns are also shown for comparison. The above-described
6
10610710810910100
1
2
3
4
5 Tmax (103 K)
t (s)
(a)
a = 0.25 µm
0.5
1
3 5
τ = 10 ns
10610710810910100
2
4
6
8 Tmax (103 K)
t (s)
100
80
25
10
τ = 1 ns
(b)
a = 3 µm
10610710810910100
2
4
6
8 Tmax (103 K)
t (s)
τ = 1 ns
10
2550
70
(c)
a = 5 µm
Figure 1. Temporal evolution of the maximum temperature in the cathode with the micropro-trusion.
7
Figure 2. Evolution of temperature distribution in the cathode with the microprotrusion. a =5µm, τ = 70ns. The bar in K.
scenario 1 occurs for τ = 1ns: for both cases a = 3µm (Fig. 1b) and a = 5µm (Fig. 1c),the temperature of the microprotrusion attains a value of about 2200K at approximately1.6 ns and then starts decreasing. The spot was not ignited.The above-described scenario 2 occurs for τ = 10 ns and τ = 25 ns, for both cases
a = 3µm and a = 5µm: the spot was ignited and subsequently destroyed by heatremoval into the bulk of the cathode due to thermal conduction once the leftover plasmacloud has been extinguished.Two further scenarios are seen in Figs. 1b,c. Scenario 3 occurs for τ = 80 ns for
the case a = 3µm and for τ = 50 ns for the case a = 5µm: the thermal explosionstarts developing, with Tmax shifting from the surface into the bulk of the protrusion andreaching 5000 − 6000K, but then it is quenched by heat conduction once t > τ and theleftover plasma cloud has been extinguished.Scenario 4 represents the thermal explosion of the spot. The explosion occurs at
t ≈ 97 ns for the case a = 3µm and at t ≈ 55 ns for a = 5µm. Evolution of the cathodetemperature distribution for the latter case is shown in Fig. 2.Let us proceed to modeling results for the planar cathode. For brevity, we skip the
analog of Fig. 1a and only note that the minimum value of the cloud dimension needed forignition of the spot is a = 3µm and the ignition time is tig ≈ 8 ns. The temporal evolutionof the maximum temperature Tmax in the body of the planar cathode for two values of aand different τ are shown in Fig. 3. The same four scenarios as above may be identified,
8
10610710810910100
2
4
6
8 Tmax (103 K)
t (s)
(a)
10
50
100
125a = 5 µm
τ = 1 ns
10610710810910100
2
4
6
8 Tmax (103 K)
t (s)
10
50
70
(b)
a = 10 µm
τ = 1 ns
Figure 3. Temporal evolution of the maximum temperature in the planar cathode.
although the ignition of the spot and its subsequent explosion develop somewhat slower.Scenario 1 occurs for τ = 1ns in both cases a = 5µm (Fig. 3a) and a = 10µm (Fig. 3b):the cathode temperature reaches a maximum of 1500K at t ≈ 1.5 ns, and immediatelystarts decreasing. Scenario 2 (formation of a transient spot eventually destroyed by heatremoval into the bulk of the cathode due to thermal conduction) occurs for τ = 10 ns andτ = 50 ns, for both cases a = 5µm and a = 10µm, with ignition of the spot at tig ≈ 8 ns.Thermal runaway is initiated but then quenched by thermal conduction (scenario 3) forthe case a = 5µm for τ = 100 ns. Lastly, the thermal explosion (scenario 4) occurs att ≈ 103 ns for a = 5µm and at t ≈ 63 ns for a = 10µm. Similarly to the case of themicroprotrusion, the maximum temperature in the spot is more or less constant after thespot has been ignited, until either the extinction of the leftover plasma cloud (scenario2) or the beginning of thermal runaway (scenarios 3 and 4). Evolution of the cathodetemperature distribution for scenario 4 in the case a = 5µm is shown in Fig. 4.Thus, in both cases of the cathode with the protrusion and the planar cathode there is
a plateau in the temporal evolution of the spot temperature after the ignition and beforethe plasma cloud has been extinguished or thermal runaway develops, whichever happensearlier. This remarkable feature is known from the modeling of cathode spots in arcsin high-pressure ambient gases [29] and may be understood as follows. As the cathodesurface temperature Tw increases with time, so do the different contributions to the densityq1 = q1 (Tw, U) of the energy flux from the plasma produced by ionization of the emittedvapor in the cathode spot. The most relevant contributions to q1 are the heating byincident ions produced by ionization of the vapor, q(v)i , and the cooling by the electronemission, qem. Their dependence on the cathode surface temperature Tw is shown in Fig.5. Also shown in Fig. 5 is q(cl)i the heating by the leftover plasma cloud. The combinedion heating, q(v)i + q
(cl)i , exceeds qem for Tw below approximately 4700K. It is intuitively
clear that 4700− 4800K represents the upper limit of the cathode temperature until theJoule heating comes into play and thermal runaway starts developing. (In mathematicalterms, this is a corollary of the maximum principle for harmonic functions [29].) Notethat while q(v)i is smaller (by approximately a factor of 3) than q(cl)i at such temperatures,
9
Figure 4. Evolution of temperature distribution in the planar cathode. a = 5µm, τ = 125 ns.The bar in K.
10
4 4.2 4.4 4.6 4.8 50
2
4
6
8
10
12
14 q (1011 W/m2)
Tw (103 K)
qem
qi(v)
qi(cl)
Figure 5. qem: energy removed from the cathode surface due to electron emission. q(v)i , q(cl)i :energies delivered to the cathode surface by the ions produced by ionization of the vapor emittedin the spot and by the ions from the leftover plasma cloud, respectively.
its contribution to the surface heating is nevertheless appreciable.Since the spot temperature does not change much after ignition and before the plasma
cloud has been extinguished or thermal runaway develops, plasma parameters inside thespot, including the current density, also experience little variation. One can say thatthe "spot brightness" remains approximately constant. On the other hand, the spotsignificantly expands, as is illustrated by Figs. 2a,b for the cathode with the protrusionand Figs. 4a,b for the planar cathode.The model being used allows one to self-consistently evaluate various spot parameters,
including the current I. The temporal evolution of the current during the spot ignitionand development is shown for the case a = 5µm for the cathode with the microprotrusion(Fig. 6a) and for the planar cathode (Fig. 6b). One can identify the moment of ignitionof the spot, tig ≈ 5 ns for the cathode with the protrusion and tig ≈ 8 ns for the planarcathode, as the instant when the current starts increasing from the constant value ofcurrent supplied by the leftover plasma cloud (approximately 4.4A). This coincides withthe maximum temperature in the cathode attaining a value around 4700 − 4800K; cf.Figs. 1c and 3a. However, the plateau visible in the evolution of Tmax is absent in theevolution of I: the current continually increases from the moment of spot ignition untilthe explosion or the extinction of the leftover plasma cloud. Since there is little variationin the spot temperature after the spot has been ignited and, therefore, in the currentdensity inside the spot, the rise in current is due to the expansion of the spot over thecathode surface seen in Figs. 2a,b and 4a,b.It is of interest to consider also parameters of the near-cathode plasma layer inside the
spot. Several such parameters evaluated by means of the model [31] are shown in Fig. 7in the relevant range of the cathode surface temperatures. The saturated vapor pressurepv, the electric field Ew at the cathode surface, and the current density j1 = j1 (Tw, U) areshown in Fig. 7a; note that pv governs the density of flux of vaporized atoms by meansof the Langmuir formula: Jv = pv/
√2πmikTw. Since Ew exceeds 109V/m, the electron
11
1071081091
10
100 I (A)
t (s)
τ = 1 ns 10
25
50
70
(a)
1071081091
10
100 I (A)
t (s)
(b)
10
50
100
125
τ = 1 ns
Figure 6. Evolution of spot current. (a): cathode with the microprotrusion. (b): planar cathode.a = 5µm.
emission is not of thermionic nature, in agreement to what was expected. Note that theemission-related electron energy flux is always directed into the plasma in the conditionsof Fig. 7a, i.e. electron emission contributes to cooling of the cathode.Other parameters of interest are the sheath thickness d, the time of flight of the ions
across the sheath, ti, and the time scale τ i of ionization of the emitted vapor atoms.Although the asymptotic sheath theory [30], which is the basis of the code [31] used inthis modeling, does not involve any (finite) sheath thickness, representative values of dmay be obtained by means of the Child-Langmuir sheath model evaluated in terms of theion current density and the sheath voltage. The time of flight of the ions across the Child-Langmuir sheath evaluated for copper ions for the sheath voltage of 20V may be writtenas 0.39 d
µmns. In the framework of the asymptotic sheath theory [30], the time scale of
ionization of the emitted vapor atoms may be estimated as τ i = 1/kin(0)a , where ki is the
rate constant of ionization by electron impact and n(0)a is the value of the atomic densityat the point of maximum of electrostatic potential. For the purposes of evaluation, thisexpression may be rewritten as τ i = Naw/kinaw, where naw is the value of atomic densityat the cathode surface evaluated as described in [31] and Naw is given by equation (3) of[31]. The parameters d, ti, and τ i evaluated in this way are shown in Fig. 7b.The assumption of a 1D quasi-stationary near-cathode layer [30, 31] requires that the
sheath thickness d be much smaller than the transversal dimensions (the spot radius anddimensions of protrusions) and that τ i and ti be much smaller than the characteristictime scales of development of the spot. Given the representative values shown in 7b,these requirements are met with a large margin.
4 Concluding discussion
The developed model describes the initiation and development of a cathode spot in ahigh-current vacuum arc, with account of the plasma cloud left over from a previously
12
4 4.2 4.4 4.6 4.8 5
100
200
300
400
0
4
8
12
16
0
2
4
6pv
(bar)
Tw (103 K)
Ew (109 V/m)j1
(1011 A/m2)
Ew
pv
j1
(a)
4 4.2 4.4 4.6 4.8 50
0.002
0.004
0.006
0.008
0.01
0.004
0.006
0.008
0.01ti, τi(ns)
Tw (103 K)
d (µm)
τi
d
ti
(b)
Figure 7. Parameters of the near-cathode plasma layer inside the spot. pv: saturated vaporpressure. j1: density of electric current to the cathode surface due to plasma produced from themetal vapor emitted by the spot. Ew: electric field at the cathode surface. ti: time of flight ofthe ions across the sheath. τ i: time scale of ionization of the emitted vapor atoms. d: sheaththickness.
existing spot or generated at arc triggering, all the mechanisms of current transfer to thecathode surface, and the Joule heat generation in the cathode body.The account of all the mechanisms of current transfer, including the contributions
from both the leftover plasma cloud and the plasma produced by ionization of the metalvapor emitted in the spot, allows one to identify in a natural way the different phases oflife of an individual cathode spot: the ignition, the expansion over the cathode surface,and the thermal explosion or destruction by heat removal into the bulk of the cathodedue to thermal conduction. The states (a) shown in Figs. 2 and 4 exemplify the end ofthe ignition phase; the expansion phase occurs between states (a) and (b); and states (b),(c), and (d) exemplify the thermal runaway development.The ignition phase is characterized by a fast increase of the temperature of the cathode
surface under the effect of the ions coming from the leftover plasma. In the conditions ofFigs. 1c and 3a, this phase terminates at approximately 5 or 8 ns, respectively. In Fig. 6,this phase is associated with the horizontal section of the dependence I (t).After the spot has been ignited, the maximum temperature of the cathode, which
occurs at the surface, does not change much and is approximately 4700 − 4800K. Thisis the surface temperature at which the heating of the cathode surface, which is due tobombardment by the ions originating in the leftover plasma cloud and by the ions producedin the ionization of atoms vaporized from the surface, is balanced by the cooling of thecathode surface, which is due to electron emission. This remarkable feature is known fromthe modeling of cathode spots in arcs in high-pressure ambient gases and manifests itselfas the plateau in the dependence Tmax (t) seen in Figs. 1b, 1c, and 3. One can say that thespot brightness does not change much during this phase. However, this does not meanthat the spot has reached a steady-state: the spot expands over the cathode surface, sothe spot current increases.Eventually, the maximum of the cathode temperature is shifted from the surface into
13
the cathode: the Joule heating comes into play and thermal runaway starts developingbelow the cathode surface, leading to an explosion (thermal runaway). The explosion canoccur not only on a cathode with a microprotrusion, but on a planar cathode as well.The development of the spot is interrupted if the leftover plasma cloud has been
extinguished: the spot is destroyed by heat removal into the bulk of the cathode due tothermal conduction. Therefore, different scenarios are possible depending on the timeof action of the cloud: the spot may be quenched either before having been formed, orduring the expansion phase, or even at the initial stage of thermal explosion. It shouldbe stressed that parameters of the plasma cloud required for the ignition, and eventualexplosion, of the spot on the cathode with a 1µm-scale microprotrusion and on the planarcathode are of the same order of magnitude. Indeed, the minimum spatial extension andthe time of action of the leftover plasma cloud needed for the spot to be ignited area = 3µm, tig = 5ns for the cathode with the microprotrusion and a = 3µm, tig = 8nsfor the planar cathode; the time of action needed for the explosion for a = 5µm is 55 nsfor the cathode with the microprotrusion and 103 ns for the planar cathode. Also of thesame order are the total energies that need to be deposited by the leftover plasma cloudfor the spot to be ignited and eventually exploded, Q = πa2q
(cl)i t; for example, the energy
required for ignition (with a = 3µm) is 0.16µJ for the cathode with the microprotrusionand 0.25µJ for the planar cathode.In all the cases where the spot is ignited, it either explodes or is destroyed by thermal
conduction; a steady state is never reached. This is consistent with results of investigationof stability of stationary cathode spots of vacuum arcs [37]: the spots operating at a fixedvalue of the near-cathode voltage are unstable.Results of simulations with account of motion of the molten metal, convective heat
transfer, and surface deformation will be reported in the second part of this work. Here,we only indicate the following. The account of the hydrodynamic aspects does not af-fect the main features of development of the cathode spot reported in this paper: theabove-described ignition and expansion phases remain clearly identifiable; the plateau inthe cathode temperature evolution during the expansion phase remains present; the de-struction of the spot by thermal conduction (accompanied by solidification of the moltenmetal) occurs after the leftover plasma cloud has been extinguished. Furthermore, themotion of the molten metal comes into play on a time scale longer than the spot ignitiontimes, hence results on the spot ignition time and the initial stage of the expansion phase,computed in this work, remain applicable. As the spot expands further, the hydrodynamiceffects come into play and, in particular, suppress the development of thermal runawayand may cause detachment of droplets.An important question is if parameters of the near-cathode plasma remaining after the
spot extinction are suffi cient to initiate a new spot. This question needs to be consideredwith account of the hydrodynamic aspects and is therefore beyond the scope of this paper.Relevant estimates will be given in the second part of this work.Acknowledgments The work at Universidade da Madeira was partly supported by
FCT - Fundação para a Ciência e a Tecnologia of Portugal (the project Pest-OE/UID/FIS/50010/2013)and by Siemens AG.Biography, Mário D. CunhaMário D. Cunha received the Ph.D. degree in physics from the University of Madeira,
14
Madeira, Portugal, in 2004. His thesis focused on the modeling of the plasma-cathodeinteraction in high-pressure arc discharges.He is an Assistant Professor with the Department of Physics, University of Madeira.
His current research interests include numerical simulation of different modes of currenttransfer to cathodes of high-pressure arc discharges, and also spots on vacuum arc cath-odes.Biography, Helena T. C. KaufmannHelena T. C. Kaufmann received the Master in Science (M.Sci.) degree (incorporating
Bachelor’s level study) in physics from the Imperial College of Science, Technology andMedicine, London, United Kingdom, in 2012. She is currently pursuing the Ph.D. degreein physics with the Department of Physics, University of Madeira. Her work focuses onthe plasma-cathode interaction in vacuum arcs, in particular, the numerical modeling ofspots on vacuum arc cathodes.Biography, Mikhail S. BenilovMikhail S. Benilov received the Diploma degree (Hons.) and the C.Sc. (Ph.D.) degree
in physics from the Moscow Institute for Physics and Technology, Moscow, Russia, in 1974and 1978, respectively, and the Doctor of Physical and Mathematical Sciences degree fromthe Institute for High Temperatures, USSR Academy of Sciences, Moscow, in 1990. Histhesis focuses on theory of electrostatic probes and electrodes in high-pressure flowingplasmas.He had been with the Institute for High Temperatures, USSR Academy of Sciences,
Moscow, where he led a group working in plasma and nonlinear physics, numerical model-ing, and fluid dynamics, after completing postgraduate courses with the Moscow Institutefor Physics and Technology and Institute for Mechanics of Lomonosov Moscow State Uni-versity, Moscow, in 1977. Since 1993, he has been a Professor with the Department ofPhysics, University of Madeira. His current research interests include plasma physics, inparticular, plasma-electrode interaction, nonlinear physics, and numerical modeling.Dr. Benilov received the Alexander von Humboldt Research Fellowship in 1990 and
stayed for two years with the Ruhr-Universität Bochum, Germany, working on the theoryand simulation of near-electrode phenomena.Biography, Werner HartmannWerner Hartmann received the M.S. degree in physics in 1981 from the University of
Erlangen, Erlangen, Germany, where he received the Ph.D. degree in 1986.He has been with Siemens Corporate Technology, as a Researcher, Research Group
Leader, Project Manager, and as a Program Manager, since 1991. He was a Researchand Teaching Assistant with the University of Erlangen, Physics Department, from 1986to 1991, and with the University of Southern California, Los Angeles, CA, USA, in 1987and 1988, where he conducted research on cold cathode thyratrons/pseudosparks and fastdynamic z-pinches as EUV light sources. He was responsible for fundamental and appliedresearch into vacuum switching arc physics and devices at the Corporate Technology ofSiemens, being involved in the development of low voltage contactors, low voltage circuitbreakers up to 130 kA breaking capacity, medium voltage vacuum circuit breakers, andthe successful development of high voltage vacuum circuit breakers for 72 and 145 kV.He was involved in the development of a fully 3-D, fully transient software code for thesimulation of low voltage switching arcs in air as a Project Manager. He developed envi-
15
ronmental and environmentally friendly technologies for industrial applications, mainly inthe areas of clean water, clean air, and electroporation. Since 2006, his research interestshave been in the field of mining applications, particularly in the field of flotation andmagnetic separation. Currently, he holds the position of a Senior Key Expert in the areaof environmental technologies.Biography, Norbert WenzelNorbert Wenzel received his M.Ed. degree in Physics and Mathematics in 1979 from
the University of Heidelberg /Germany and his Ph.D. degree in Physics in 1985 from thesame institution. Since 1985 he has been working for Siemens Corporate Technology asresearcher, test laboratory head, project leader, and as radiation protection offi cer.From 1978 to 1985 he was a research and teaching assistant at the Universities of
Heidelberg, Applied Physics Dept., and Stuttgart, Plasma Research Institute, mainlyon fusion-oriented plasma physics and plasma diagnostics. In 1982 he held a EURATOMfellowship at the nuclear fusion research center of the Association ENEA in Frascati /Italy.From 1985 to 1992 he applied non-linear Raman spectroscopy to industrial processes, suchas low voltage air breakers and gas lasers. He developed sealed-off carbon dioxide slablasers excited by radio-waves and microwaves.Since 1992 he is working in the field of fundamental and applied research of switching
arcs at Siemens Corporate Technology. As head of a synthetic test laboratory he wasinvolved in the development of low, medium, and high voltage vacuum interrupters. Since2006 he has extended his activities to physical modeling and numerical simulation ofvacuum arc plasmas taking into account cathode surface phenomena. Currently he holdsthe position of a Senior Key Expert Research Scientist in the area of Vacuum SwitchingTechnologies.
References
[1] R. Kh. Amirov, N. A. Vorona, A. V. Gavrikov, G. D. Liziakin, V. P. Polistchook,I. S. Samoylov, V. P. Smirnov, R. A. Usmanov, and I. M. Yartsev, “Vacuum arcwith a distributed cathode spot as a plasma source for plasma separation of spentnuclear fuel and radioactive waste,”Plasma Phys. Rep., vol. 41, no. 10, pp. 808—813,2015. [Online]. Available: http://dx.doi.org/10.1134/S1063780X15100013
[2] M. S. Benilov and L. G. Benilova, “Physics of spotless mode of current transferto cathodes of metal vapor arcs,” IEEE Trans. Plasma Sci., vol. 43, no. 8, pp.2247—2252, 2015. [Online]. Available: http://dx.doi.org/10.1109/TPS.2015.2445093
[3] V. F. Puchkarev, “Cathode spots (chapter summary),”in Handbook of Vacuum ArcScience and Technology: Fundamentals and Applications, R. L. Boxman, D. M.Sanders, and P. J. Martin, Eds. Park Ridge, N.J., U.S.A.: Noyes Publications,1995, pp. 256—264.
[4] B. Jüttner, “Cathode spots of electric arcs,”J. Phys. D: Appl. Phys., vol. 34, no. 17,pp. R103—123, 2001. [Online]. Available: http://iopscience.iop.org/0022-3727/34/17/202
[5] A. Batrakov, S. Popov, N. Vogel, B. Juettner, and D. Proskurovsky, “Plasma para-meters of an arc cathode spot at the low-current vacuum discharge,” IEEE Trans.Plasma Sci., vol. 31, no. 5, pp. 817—821, 2003.
[6] A. Anders, E. M. Oks, G. Y. Yushkov, K. P. Savkin, I. G. Brown, and A. G. Nikolaev,“Measurements of the total ion flux from vacuum arc cathode spota,” IEEE Trans.Plasma Sci., vol. 33, pp. 1532—1536, 2005.
[7] A. Anders, Cathodic Arcs: From Fractal Spots to Energetic Condensation, ser.Springer Series on Atomic, Optical, and Plasma Physics. New York: Springer,2008.
[8] A. M. Chaly and S. M. Shkol’nik, “Low-current vacuum arcs with short arc lengthin magnetic fields of different orientations: A review,” IEEE Trans. Plasma Sci.,vol. 39, no. 6, pp. 1311—1318, 2011.
[9] S. Jia, Z. Shi, and L. Wang, “Vacuum arc under axial magnetic fields: experimentaland simulation research,”J Phys. D: Appl. Phys., vol. 47, p. 403001, 2014. [Online].Available: http://dx.doi.org/10.1088/0022-3727/47/40/403001
[10] J. Prock, “Time-dependent description of cathode crater formation in vacuum arcs,”IEEE Trans. Plasma Sci., vol. 14, no. 4, pp. 482—491, 1986. [Online]. Available:http://ieeexplore.ieee.org/stamp/stamp.jsp?tp=&arnumber=4316578
[11] J. Mitterauer and P. Till, “Computer simulation of the dynamics of plasma-surfaceinteractions in vacuum arc cathode spots,”IEEE Trans. Plasma Sci., vol. 15, no. 5,pp. 488—501, 1987. [Online]. Available: http://ieeexplore.ieee.org/stamp/stamp.jsp?tp=&arnumber=4316742
[12] T. Klein, J. Paulini, and G. Simon, “Time-resolved description of cathode spotdevelopment in vacuum arcs,”J. Phys. D: Appl. Phys., vol. 27, no. 9, p. 1914, 1994.[Online]. Available: http://stacks.iop.org/0022-3727/27/i=9/a=015
[13] I. I. Beilis, “The nature of high voltage initiation of an electrical arc in avacuum,” Appl. Phys. Lett., vol. 97, no. 12, p. 121501, 2010. [Online]. Available:http://link.aip.org/link/?APL/97/121501/1
[14] – – , “Cathode spot development on a bulk cathode in a vacuum arc,”IEEE Trans.Plasma Sci., vol. 41, no. 8, pp. 1979—1986, 2013.
[15] D. L. Shmelev and S. A. Barengolts, “Modeling of cathode plasma flare expansion,”IEEE Trans. Plasma Sci., vol. 41, no. 8, pp. 1964—1968, 2013.
[16] M. S. Benilov, “Nonlinear heat structures and arc-discharge electrode spots,”Phys. Rev. E, vol. 48, no. 1, pp. 506—515, 1993. [Online]. Available:http://pre.aps.org/abstract/PRE/v48/i1/p506_1
[17] Z.-J. He and R. Haug, “Cathode spot initiation in different external conditions,”J. Phys. D: Appl. Phys., vol. 30, no. 4, pp. 603—613, 1997. [Online]. Available:http://stacks.iop.org/0022-3727/30/603
[18] D. L. Shmelev and E. A. Litvinov, “The computer simulation of the vacuumarc emission center,” IEEE Trans. Plasma Sci., vol. 25, no. 4, pp. 533—537,aug 1997. [Online]. Available: http://ieeexplore.ieee.org/xpl/articleDetails.jsp?arnumber=640661
[19] R. Schmoll, “Analysis of the interaction of cathode microprotrusions withlow-temperature plasmas,” J. Phys. D: Appl. Phys., vol. 31, no. 15, p. 1841, 1998.[Online]. Available: http://stacks.iop.org/0022-3727/31/i=15/a=012
[20] D. L. Shmelev and E. A. Litvinov, “Computer simulation of ecton in a vacuumarc,” IEEE Trans. Dielectrics Elect. Insulation, vol. 6, no. 4, pp. 441—444,aug 1999. [Online]. Available: http://ieeexplore.ieee.org/xpl/articleDetails.jsp?arnumber=788741
[21] I. V. Uimanov, “A two-dimensional nonstationary model of the initiation ofan explosive center beneath the plasma of a vacuum arc cathode spot,” IEEETrans. Plasma Sci., vol. 31, no. 5, pp. 822—826, 2003. [Online]. Available:http://ieeexplore.ieee.org/stamp/stamp.jsp?tp=&arnumber=1240022
[22] S. A. Barengolts, G. A. Mesyats, and M. M. Tsventoukh, “Initiation ofecton processes by interaction of a plasma with a microprotrusion on a metalsurface,” JETP, vol. 107, no. 6, pp. 1039—1048, 2008. [Online]. Available:http://dx.doi.org/10.1134/S1063776108120133
[23] M. S. Benilov, M. D. Cunha, W. Hartmann, S. Kosse, A. Lawall, andN. Wenzel, “Space-resolved modelling of stationary spots on copper vacuumarc cathodes and on composite CuCr cathodes with large grains,” IEEETrans. Plasma Sci., vol. 41, no. 8, pp. 1950—1958, 2013. [Online]. Available:http://dx.doi.org/10.1109/TPS.2013.2263255
[24] G. A. Mesyats and I. V. Uimanov, “Hydrodynamics of the molten metal during thecrater formation on the cathode surface in a vacuum arc,” IEEE Transactions onPlasma Science, vol. 43, no. 8, pp. 2241—2246, Aug 2015.
[25] S. A. Barengolts, D. L. Shmelev, and I. V. Uimanov, “Pre-explosion phenomenabeneath the plasma of a vacuum arc cathode spot,” IEEE Transactions on PlasmaScience, vol. 43, no. 8, pp. 2236—2240, 2015.
[26] G. A. Mesyats and N. M. Zubarev, “The rayleigh-plateau instability and jetformation during the extrusion of liquid metal from craters in a vacuum arc cathodespot,”Journal of Applied Physics, vol. 117, no. 4, p. 043302, 2015. [Online]. Available:http://scitation.aip.org/content/aip/journal/jap/117/4/10.1063/1.4906559
[27] M. A. Gashkov, N. M. Zubarev, O. V. Zubareva, G. A. Mesyats, and I. V. Uimanov,“Model of liquid-metal splashing in the cathode spot of a vacuum arc discharge,”Journal of Experimental and Theoretical Physics, vol. 122, no. 4, pp. 776—786, 2016.
[28] M. A. Gashkov, N. M. Zubarev, G. A. Mesyats, and I. V. Uimanov, “The mechanismof liquid metal jet formation in the cathode spot of vacuum arc discharge,”TechnicalPhysics Letters, vol. 42, no. 8, pp. 852—855, 2016.
[29] M. S. Benilov and M. D. Cunha, “Heating of refractory cathodes by high-pressurearc plasmas: II,”J. Phys. D: Appl. Phys., vol. 36, no. 6, pp. 603—614, 2003. [Online].Available: http://stacks.iop.org/0022-3727/36/i=6/a=301
[30] M. S. Benilov and L. G. Benilova, “The double sheath on cathodes of dischargesburning in cathode vapour,”J. Phys. D: Appl. Phys., vol. 43, no. 34, p. 345204 (12pp),2010. [Online]. Available: http://stacks.iop.org/0022-3727/43/i=34/a=345204
[31] N. A. Almeida, M. S. Benilov, L. G. Benilova, W. Hartmann, and N. Wenzel,“Near-cathode plasma layer on CuCr contacts of vacuum arcs,” IEEE Trans.Plasma Sci., vol. 41, no. 8, pp. 1938—1949, 2013. [Online]. Available:http://dx.doi.org/10.1109/TPS.2013.2260832
[32] M. S. Benilov, N. A. Almeida, M. Baeva, M. D. Cunha, L. G. Benilova, andD. Uhrlandt, “Account of near-cathode sheath in numerical models of high-pressurearc discharges,”J. Phys. D: Appl. Phys., vol. 49, no. 21, p. 215201, 2016. [Online].Available: http://stacks.iop.org/0022-3727/49/i=21/a=215201
[33] E. Hantzsche, “The thermo-field emission of electrons in arc discharges,”Beitr. Plasmaphys., vol. 22, no. 4, pp. 325—346, 1982. [Online]. Available:http://dx.doi.org/10.1002/ctpp.19820220403
[34] M. S. Benilov and L. G. Benilova, “Field to thermo-field to thermionic electronemission: A practical guide to evaluation and electron emission from arccathodes,” J. Appl. Phys., vol. 114, no. 6, p. 063307, 2013. [Online]. Available:http://link.aip.org/link/?JAP/114/063307/1
[35] E. L. Murphy and R. H. Good, “Thermionic emission, field emission, and thetransition region,” Phys. Rev., vol. 102, no. 6, pp. 1464—1473, 1956. [Online].Available: http://link.aps.org/doi/10.1103/PhysRev.102.1464
[36] J. Paulini, T. Klein, and G. Simon, “Thermo-field emission and the Nottinghameffect,” J. Phys. D: Appl. Phys., vol. 26, no. 8, pp. 1310—1315, 1993. [Online].Available: http://stacks.iop.org/0022-3727/26/1310
[37] M. S. Benilov, M. D. Cunha, W. Hartmann, and N. Wenzel, “Numerical investigationof the stability of stationary solutions in the theory of cathode spots in arcs invacuum and ambient gas,”Plasma Sources Sci. Technol., vol. 23, no. 5, p. 054007,2014. [Online]. Available: http://stacks.iop.org/0963-0252/23/i=5/a=054007
[38] M. J. Assael, A. E. Kalyva, K. D. Antoniadis, R. M. Banish, I. Egry,J. Wu, E. Kaschnitz, and W. A. Wakeham, “Reference data for the densityand viscosity of liquid copper and liquid tin,” Journal of Physical andChemical Reference Data, vol. 39, no. 3, pp. —, 2010. [Online]. Available:http://scitation.aip.org/content/aip/journal/jpcrd/39/3/10.1063/1.3467496
[39] J. A. Cahill and A. D. Kirshenbaum, “The density of liquid copper from its meltingpoint (1356k) to 2500k and an estimate of its critical constants,”Journal of PhysicalChemistry, vol. 66, no. 6, p. 1080, 1962.
[40] V. E. Fortov, I. T. Iakubov, and A. G. Khrapak, Physics of Strongly Coupled Plasma.Oxford: Oxford University Press, 2007.
[41] G. A. Mesyats and S. A. Barengol’ts, “Generation mechanism of anomalous ions invacuum arcs,” Physics - Uspekhi, vol. 45, no. 10, pp. 1001—1018, 2002. [Online].Available: http://iopscience.iop.org/1063-7869/45/10/R01