31
Detailed profile of facts and statistics regarding SPEEDING

Detailed profileof facts and statistics regarding
SPEEDINGSPEEDING
2Detailed profile of facts and statistics regarding SPEEDING | MAY 2015
SPEEDINGSPEEDING
Detailed profile of facts and statistics regarding
Note: In this document, “accident caused by speeding” refers to any
accident for which one of the probable causes, as indicated on the
supplemental accident report, is the inadequate speed of one of the
vehicles involved.

SPEEDINGSPEEDING
Detailed profile of facts and statistics regardingWhat?
3Detailed profile of facts and statistics regarding SPEEDING | MAY 2015
Speeding is one of the leading causes of accidents and has major consequences on the severity of an accident.
Driving is a complex task, and speed reduction improves road safety.
Speeding is one of the leading causes of accidents in Québec and is a worrying
phenomenon. An overview of all the causes listed on accident reports in
2012 reveals that speeding is mentioned in 50% of fatalities. Comparing the
distribution of accidents resulting in bodily injuries caused by speeding with all
accidents resulting in bodily injuries reveals that the distributions differ.
The proportion of fatal accidents (2.8%) among accidents resulting in bodily
injuries caused by speeding is greater than among all accidents resulting in
bodily injuries (1.3%).
Furthermore, the proportion of accidents resulting in serious injuries (8.4%) is
greater among accidents resulting in bodily injuries caused by speeding than
among all accidents resulting in bodily injuries (5.5%).
We can therefore conclude that accidents caused by speeding have more
serious consequences.
Source: Accident reports, 2012.
Accidents resulting in bodily injuries caused by speeding
Fatal accidents 72.8%
Accidents resulting 58.4% in serious injuries
Accidents resulting 88.8% in minor injuries
All accidents resulting in bodily injuries
Fatal accidents 7 1.3%
Accidents resulting 5.5% in serious injuries
Accidents resulting 93.2% in minor injuries

What?
4
SPEEDING
Detailed profile of facts and statistics regarding
SPEEDING
Detailed profile of facts and statistics regarding SPEEDING | MAY 2015
Speeding has multiple effects and contributes to making roads less safe.
The principles of physics that apply to a body in motion (kinetic energy) also
apply to a vehicle in motion. Too great a speed has multiple effects and
contributes to making roads less safe for all types of users. High speed causes:
• a decreased field of vision;
• a decrease in the time available to react to avoid impact;
• limitations in the ability to perform avoidance manoeuvres;
• an increased risk of skidding; and
• an increased stopping distance.
Source: Road safety fact sheet on speeding, SAAQ, 2014.
A very large proportion of offences committed under the Highway Safety Code concern speeding.
Evolution (2005-2012) of the number of offences
400,000
600,000
800,000
1,000,000
1,200,000
Speeding All offences
20122011201020092008200720062005
631,763
829,999
1,035,031
978,2021,004,038 989,535
952,080902,076
662,443705,559718,431711,774
783,816
589,481
436,363
616,875
Nu
mb
er
of
off
en
ce
s
The graph above shows the evolution in the annual number of speeding offences
and all offences under the Highway Safety Code that result in demerit points.
After peaking in 2007 (783,816), speeding offences decreased to 616,875 in 2012.
This graph illustrates the relative importance of speeding among all offences
under the Highway Safety Code. Speeding offences represent approximately
70% of all offences
Source: Statistical report entitled Les infractions et les sanctions reliées à la conduite d’un véhicule, 2003-2012.

What?
5
SPEEDING
Detailed profile of facts and statistics regarding
SPEEDING
Detailed profile of facts and statistics regarding SPEEDING | MAY 2015
Speeding is a widespread phenomenon.
Surveys conducted by the Ministère des Transports in 2007 showed that:
• more than 50% of drivers drive over the speed limit;
• more than 65% of drivers drive over the speed limit on main roads; and
• 80% of drivers drive over the speed limit on interurban highways, and this
proportion reaches 90% in 50 km/h zones in rural areas.
Other speed surveys conducted in 2010 in urban areas where the speed limit is
equal to or below 50 km/h showed that the 85th percentile (speed under which
85% of motorists drive) of speeds was below the speed limit in only 16% of places.
Source: Surveys by the Ministère des Transports, 2007.
Drivers adjust their speed according to their perception of the risk of conflict rather than the speed limit.
A study conducted by Bellalite and colleagues showed that speeds on national
and regional road networks going through urban areas were also high.
According to this study, on roads with a 50 km/h speed limit, the average
speed was 56 km/h and the 85th percentile was 66 km/h.
The speed driven when crossing small towns, which is over the speed limit, is
influenced by the general appearance of the roadside. In dense urban areas,
motorists drive at moderate speeds because they spot several potential
conflict areas generated by human activity. In rural areas, even where the
posted speed limit is 50 km/h, motorists drive at high speeds because the
perceived risks are lower due to the low density of occupation along the
roadside, which allows them to anticipate traffic conditions.
Source: BELLALITE, L., and M. D’AMOURS. Évaluation de l’impact du profil en travers sur les vitesses pratiquées au sein des traversées des petites agglomérations, 2002.

What?
6
SPEEDING
Detailed profile of facts and statistics regarding
SPEEDING
Detailed profile of facts and statistics regarding SPEEDING | MAY 2015
A higher proportion of drivers admit to going over the speed limit in 90 km/h zones than in 50 km/h zones. However, these proportions are on the rise in both zones.
As part of surveys to assess the speeding campaigns deployed by the SAAQ,
respondents are always asked the same two questions:
• Generally speaking, what do you estimate is your average speed in urban
areas in 50 km/h zones?
• Generally speaking, what do you estimate is your average speed in 90 km/h
zones on secondary roads in Québec?
These surveys show that over the past two years, the proportions of drivers
driving over the speed limit in 50 and 90 km/h zones has increased and is over
60% in 50 km/h zones and nearly 70% in 90 km/h zones.
These statistics clearly show that the situation is worse in 90 km/h zones than
in 50 km/h zones. Moreover, since we know that declared speed
underestimates actual speed, we can assume that the situation concerning
actual speed is worse than the one illustrated in the graph below.
Source: Survey to assess speeding campaigns from 2009 to 2014, SAAQ..
0%
20%
40%
60%
80%
100%
20142013201220112010200920142013201220112010
50 km/h zone (urban areas) 90 km/h zone (secondary roads)
2009
9% 9% 13% 13% 10% 11% 10% 8% 12% 12% 7% 9%
46% 47% 49% 44% 28% 26%34% 35% 37% 29% 21% 19%
44% 43% 38% 42% 62% 61% 55% 56% 51% 58% 69% 69%
Below the speed limit
Equal to the speed limit
Over the speed limit
Assessment by drivers of their average speed, according to area

What?
7
SPEEDING
Detailed profile of facts and statistics regarding
SPEEDING
Detailed profile of facts and statistics regarding SPEEDING | MAY 2015
The greater the difference between actual speed and the speed limit, the more the offence is perceived as serious by all drivers.
Québec drivers who drive 10 km/h or more over the speed limit (in urban areas
and on secondary roads) mainly justify speeding by stating that they are
following traffic or that they speed due to habit or distraction. These drivers
still consider that a speeding offence is more serious when the difference with
the speed limit is greater:
• In urban areas, nearly a third of drivers surveyed in 2012 consider that
speeding at 10 km/h over the limit is a serious or very serious offence,
whereas speeding at 20 km/h over the limit is considered a very serious or
serious offence by 80% of respondents.
• On secondary roads, a quarter of drivers view speeding at 15 km/h over the
limit as inconsequential, whereas speeding at 30 km/h over the limit is
considered a very serious or serious offence by 85% of respondents.
Source: Survey to assess the 2012 speeding campaign, SAAQ.
Drivers believe that the risk of being pulled over for speeding in a 50 km/h zone is low.
Perception of the risk of being pulled over for speeding in an urban area in a 50 km/h zone
Very low 45%
Quite low 37%
Quite high 16%
Very high 2%
Although three out of four Québec drivers (73%) disagree that speeding saves
time, it is clear that actual speeds are above speed limits. This might stem from
the perception that the risk of being pulled over for speeding is quite low. In a
survey, drivers were asked to qualify the risk of being pulled over for speeding
in urban areas in 50 km/h zones. Fewer than one out of five drivers (18%)
perceives this risk as high, and only 2% perceive this risk as very high.
Lastly, 84% of drivers agree with the following statement: “It is very important
to encourage people to drive more slowly in 50 km/h zones.”
Source: Survey to assess the 2012 speeding campaign, SAAQ.

What?
8
SPEEDING
Detailed profile of facts and statistics regarding
SPEEDING
Detailed profile of facts and statistics regarding SPEEDING | MAY 2015
Whether through increased police surveillance, stiffer penalties or the use of photo radar devices, the vast majority of Quebecers support these measures to reduce speed.
The majority of drivers believe that the various speed limits on Québec roads
are adequate. Approval rates are 88% in urban areas, 77% for 90 km/h zones
and 63% on highways. Despite this, a significant number of drivers still admit to
driving over the limit.
Several speed reduction strategies are possible, and although some are more
popular than others, a vast majority of respondents agree with them.
According to the survey:
• 80% of respondents are favourable to increased police surveillance
to enforce speed limits;
• 65% of respondents agree with stiffer penalties for speeding; and
• 88% of respondents approve the use of photo radar devices in Québec,
and 94% of respondents agree to their use in school zones.
Sources: Survey to assess the 2012 speeding campaign, SAAQ.
Survey on the perception of photo radar devices among driver’s licence holders, MTQ, 2013.
A 1 km/h increase in the average actual speed results in a 3% increase in the number of accidents resulting in bodily injuries.
The effects of speed on road safety differ according to the severity of
accidents and road category. Generally speaking, a 1 km/h increase in the
average actual speed results in a 3% increase in the number of accidents
resulting in bodily injuries. Based on this general estimate, we can assume that
if all drivers decreased their average speed by 5 km/h, the number of people
killed or injured on Québec roads would decrease by 15%.
Source: RANTA, S., and V.P. KALLBERG. Analysis of Statistical Studies of the Effects of Speed on Safety, 1996.

What?
9
SPEEDING
Detailed profile of facts and statistics regarding
SPEEDING
Detailed profile of facts and statistics regarding SPEEDING | MAY 2015
Speeding causes a much more rapid increase in the risk of accident in urban areas than in rural areas.
Kloeden and colleagues conducted studies whose main objectives were to
quantify the relationship between travelling speed and the relative risk of crash
involvement. They concluded that the relationship between speed and the risk
of accident varies depending on area. More specifically, it was estimated that:
• the risk of being involved in an accident doubles for every 5 km/h over the
speed limit in urban areas;
• the risk of being involved in an accident is double at 10 km/h over the speed
limit, nearly six times greater at 20 km/h over the limit and nearly eighteen
times greater at 30 km/h over the limit in rural areas.
Sources: KLOEDEN, C.N., et al. Travelling Speed and the Risk of Crash Involvement, volumes 1 and 2, 1997.
KLOEDEN, C.N., et al. Travelling Speed and the Risk of Crash Involvement on Rural Roads, 2001.
Increase in the risk of accident according to the speed over the limit, by area – roads with a 70 km/h limit
0
10
20
30
40
50
60
70
100959085807570
Rural
Urban
Speed (km/h)
Re
lati
ve
ris
k

What?
10
SPEEDING
Detailed profile of facts and statistics regarding
SPEEDING
Detailed profile of facts and statistics regarding SPEEDING | MAY 2015
Where they are located, the use of photo radar devices (stationary or mobile) results in:
• a significant decrease in actual speeds; and
• a significant decrease in accidents resulting in bodily injuries.
The use of automated control devices on Québec roads has led to a reduction
in speed and a decrease in accidents, especially with regards to accidents
resulting in bodily injuries.
The assessment conducted for 2013 shows that stationary photo radar devices
lead to a 15% reduction in speed, and mobile devices lead to a 7% reduction
(see graph on the right). The assessment also reveals a marked decrease in the
average number of accidents per month, i.e. a 58% decrease with stationary
devices and a 41% decrease with mobile devices.
Source: Evaluation report entitled Cinémomètres photographiques et systèmes photographiques de contrôle de circulation aux feux rouges, MTQ, 2013.
Before
After
Mobile photo radar devices
Stationary photo radar devices
Mobile photo radar devices
Stationary photo radar devices
Moyenne mensuel d’accident Vitesse pratiquée (km/h)
3.3
1.4
3.4
2.0
76.8
65.0
80.675.1
Ave rage number of accidents per month
Actual speed (km/h)
Impact of photo radar devices on speed and accidents, according to the type of device

What?
11
SPEEDING
Detailed profile of facts and statistics regarding
SPEEDING
Detailed profile of facts and statistics regarding SPEEDING | MAY 2015
The relative risk of being involved in an accident when speeding at 10 km/h above the limit in a 60 km/h zone is comparable to the risk taken by a driver with blood alcohol concentration of 80 mg/100 ml.
A study by Mclean and Kloeden (2002) compared the relative risk of being
involved in an accident according to the driver’s blood alcohol concentration
and the speed of the vehicle in a 60 km/h zone. They concluded that the risk
curves are similar (see graph on the right).
The relative risk of accident for vehicles travelling at 10 km/h over the speed
limit 20 is nearly comparable to the relative risk of accident for drivers with an
blood alcohol concentration (BAC) of 80 mg/100 ml, and the relative risk of
accident for vehicles travelling at 20 km/h over the speed limit is comparable
to the relative risk of drivers with a BAC of 210 mg/100 ml.
Source: MCLEAN, A.J., and C. KLOEDEN. Alcohol, Travelling Speed and the Risk of Crash Involvement, Proceedings of the 16th International Conference on Alcohol, Drugs and Traffic Safety, Montréal, 2002.
0
5
10
15
20
25
30
35
40
8580757065
Alcohol
Speed
Blood alcohol concentration (mg/100ml)
Speed (km/h)
0.250.200.150.100.050
60R
ela
tive
ris
k
Relative risk of being involved in an accident according to speed in a 60 km/h zone, and according to the driver’s
blood alcohol concentration
What?
12
SPEEDING
Detailed profile of facts and statistics regarding
SPEEDING
Detailed profile of facts and statistics regarding SPEEDING | MAY 2015
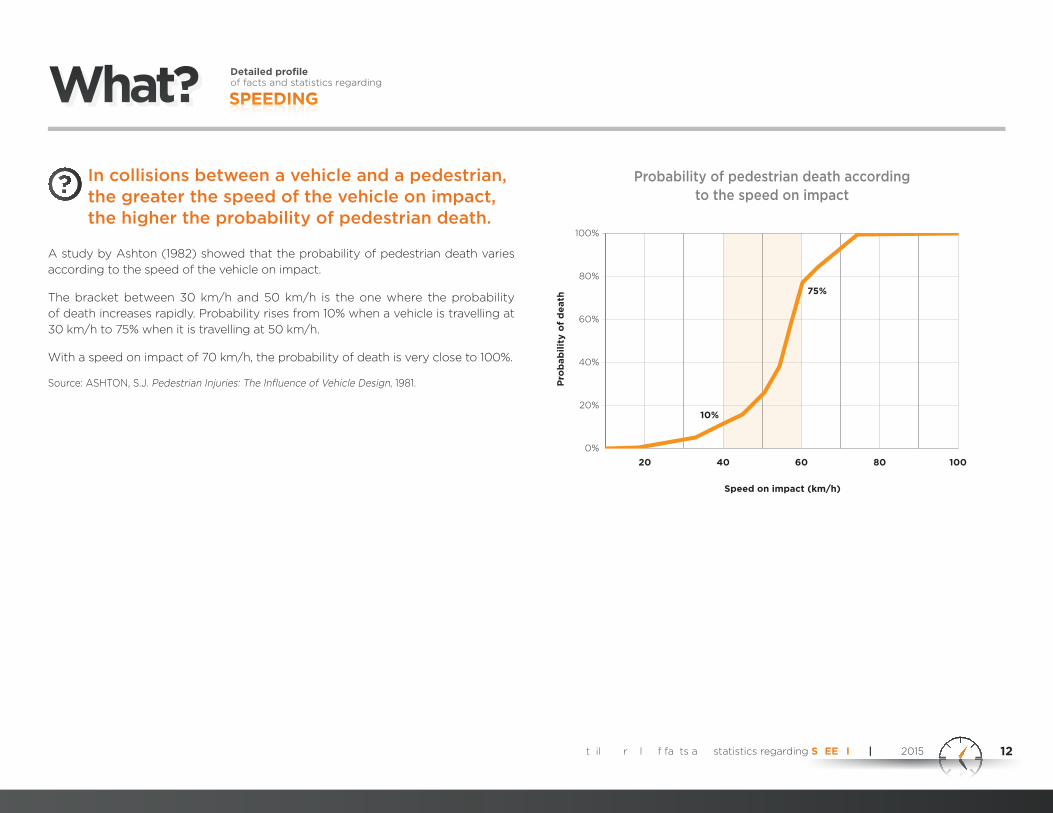
In collisions between a vehicle and a pedestrian, the greater the speed of the vehicle on impact, the higher the probability of pedestrian death.
A study by Ashton (1982) showed that the probability of pedestrian death varies
according to the speed of the vehicle on impact.
The bracket between 30 km/h and 50 km/h is the one where the probability
of death increases rapidly. Probability rises from 10% when a vehicle is travelling at
30 km/h to 75% when it is travelling at 50 km/h.
With a speed on impact of 70 km/h, the probability of death is very close to 100%.
Source: ASHTON, S.J. Pedestrian Injuries: The Influence of Vehicle Design, 1981.
0%
20%
40%
60%
80%
100%
10080604020
10%
75%
Speed on impact (km/h)
Pro
bab
ilit
y o
f d
eath
Probability of pedestrian death according to the speed on impact

What?
13
SPEEDING
Detailed profile of facts and statistics regarding
SPEEDING
Detailed profile of facts and statistics regarding SPEEDING | MAY 2015
In collisions between a vehicle and a pedestrian, the greater the speed of the vehicle on impact, the higher the risk of serious injuries.
The impact of speed on the severity of injuries of vulnerable road users, such
as pedestrians and cyclists, is very significant. These users are very poorly
protected in case of a collision with an automobile, and the severity of injuries
increases rapidly.
A study conducted by the AAA (Tefft, 2011) showed that the greater the speed
on impact, the higher the risk of serious injuries. The risk is also greater for
older pedestrians. The graph on the right shows that the average normalized
risk of serious injuries for a pedestrian aged 70 is approximately equal to the
risk to a pedestrian aged 30 when struck by a vehicle travelling at a speed that
is greater by 9.3 mph (≈ 15 km/h).
Source: TEFFT, B.C., et al. Impact Speed and a Pedestrian’s Risk of Severe Injury or Death, Foundation for Traffic Safety, AAA, 2011.
Risk of serious injury according to the speed of the vehicle and age of the pedestrian
Speed on impact (mph)
Ris
k o
f se
rio
us
inju
ry
Age 70
Age 30
50 6040302010
0%
20%
40%
60%
80%
100%

What?
14
SPEEDING
Detailed profile of facts and statistics regarding
SPEEDING
Detailed profile of facts and statistics regarding SPEEDING | MAY 2015
A majority of respondents admit to speeding and justify their behaviour mainly by arguing that they are following traffic and that police officers tolerate driving over the limit.
A survey conducted by the SAAQ asked drivers to list the three main reasons
for speeding. 17% of respondents indicated that they do not drive above the
speed limit. The main answers given by the other respondents to justify
speeding are:
Reasons given by Québec drivers to justify driving over the speed limit
Furthermore, respondents consider that:
• the risk of being pulled over by a police officer is low (76% in urban areas
and 83% on secondary roads);
• driving “slightly” over the speed limit is not a serious offence:
• 21% of respondents believe that driving 10 km/h over the limit in
a 50 km/h zone is a serious offence; and
• 27% of respondents believe that driving 15 km/h over the limit in
a 90 km/h zone is a serious offence.
• the risk of being involved in an accident when driving “slightly” over the speed
limit is low:
• 71% of respondents believe that the risk for driving 10 km/h over the
limit in a 50 km/h zone is low; and
• 65% of respondents believe that the risk for driving 15 km/h over the
limit in a 90 km/h zone is low.
Source: Survey to assess the 2014 Speeding campaign, SAAQ.
0%
56%
32%
27%
20%
19%
17%
17%
10% 20% 30% 40% 50% 60%
No reason, does not drive over the limit
The weather is clear, road conditions are good
Does not realize that he or she is over the limit
There is little traffic or few pedestrians
To adopt a comfortable speed
Police tolerate driving over the limit
To follow traffic

Who?
15
SPEEDINGSPEEDING
Detailed profile of facts and statistics regarding
Detailed profile of facts and statistics regarding SPEEDING | MAY 2015
Younger drivers (aged 16 to 44) are overrepresented among people convicted of a speeding offence, and drivers aged 16 to 34 are overrepresented among people convicted of an excessive speeding offence.
Driver’s age
Proportion of offenders by age in 2012 Proportion of driver’s licence holders in 2012
Speeding Excessive speeding
Under 16 0.0% 0.0% 0.1%
16-19 4.5% 11.2% 2.9%
20-24 10.9% 21.1% 7.0%
25-34 21.3% 27.7% 16.1%
35-44 21.0% 17.8% 17.3%
45-54 21.0% 13.2% 21.3%
55-64 13.7% 6.1% 18.5%
65-74 5.9% 2.4% 11.4%
75 and older 1.6% 0.5% 5.2%
A comparison of the distribution of speeding and excessive speeding offences
by age with the distribution of all driver’s licence holders by age shows that
younger drivers (excluding those younger than 16) are overrepresented ().
With respect to speeding offences, drivers aged 16 to 44 are overrepresented.
This group committed 57.7% of speeding offences resulting in demerit points,
whereas they represented only 43.3% of driver’s licence holders. In the case of
excessive speeding offences, the group of drivers aged 16 to 34 committed
60.0% of offences, whereas they represented only 26.0% of licence holders.
Sources: Les infractions pour grands excès de vitesse et pour l’utilisation d’un téléphone cellulaire pendant la conduite d’un véhicule routier, 2008-2011.
Les infractions et les sanctions reliées à la conduite d’un véhicule, 2003-2012.
Who?
16
SPEEDING
Detailed profile of facts and statistics regarding
SPEEDING
Detailed profile of facts and statistics regarding SPEEDING | MAY 2015
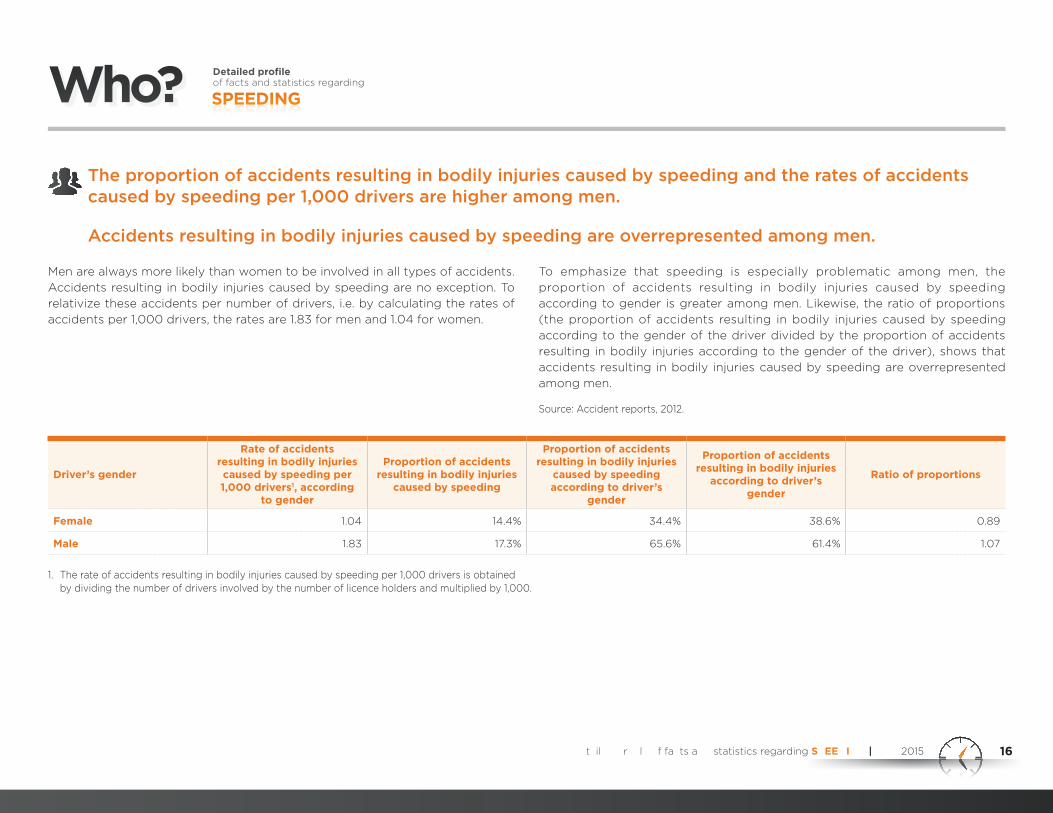
The proportion of accidents resulting in bodily injuries caused by speeding and the rates of accidents caused by speeding per 1,000 drivers are higher among men.
Accidents resulting in bodily injuries caused by speeding are overrepresented among men.
Men are always more likely than women to be involved in all types of accidents.
Accidents resulting in bodily injuries caused by speeding are no exception. To
relativize these accidents per number of drivers, i.e. by calculating the rates of
accidents per 1,000 drivers, the rates are 1.83 for men and 1.04 for women.
To emphasize that speeding is especially problematic among men, the
proportion of accidents resulting in bodily injuries caused by speeding
according to gender is greater among men. Likewise, the ratio of proportions
(the proportion of accidents resulting in bodily injuries caused by speeding
according to the gender of the driver divided by the proportion of accidents
resulting in bodily injuries according to the gender of the driver), shows that
accidents resulting in bodily injuries caused by speeding are overrepresented
among men.
Source: Accident reports, 2012.
Driver’s gender
Rate of accidents resulting in bodily injuries caused by speeding per 1,000 drivers1, according
to gender
Proportion of accidents resulting in bodily injuries
caused by speeding
Proportion of accidents resulting in bodily injuries
caused by speeding according to driver’s
gender
Proportion of accidents resulting in bodily injuries
according to driver’s gender
Ratio of proportions
Female 1.04 14.4% 34.4% 38.6% 0.89
Male 1.83 17.3% 65.6% 61.4% 1.07
1. The rate of accidents resulting in bodily injuries caused by speeding per 1,000 drivers is obtained by dividing the number of drivers involved by the number of licence holders and multiplied by 1,000.

Who?
17
SPEEDING
Detailed profile of facts and statistics regarding
SPEEDING
Detailed profile of facts and statistics regarding SPEEDING | MAY 2015
Among drivers aged 16 to 34:
• the proportions of accidents caused by speeding are greatest;
• accidents caused by speeding are overrepresented;
• the ratios of accidents resulting in bodily injuries caused by speeding are greatest.
Driver’s ageProportion of accidents resulting in bodily injuries caused by speeding according to
driver’s age
Proportion of accidents resulting in bodily injuries according to driver’s age
Ratio of proportions
Under 16 0.4% 0.6% 0.67
16-19 11.3% 8.8% 1.28
20-24 17.5% 13.3% 1.32
25-34 21.6% 19.7% 1.10
35-44 16.3% 17.0% 0.96
45-54 15.9% 17.8% 0.89
55-64 9.9% 12.3% 0.80
65-74 4.9% 6.6% 0.74
75-84 1.8% 3.2% 0.56
85-89 0.3% 0.6% 0.50
90 and older 0.1% 0.1% 1.00
The comparison of the distribution of drivers involved in accidents resulting in
bodily injuries caused by speeding according to age and the distribution of all
accidents resulting in bodily injuries according to age shows that certain age
brackets are overrepresented ().
The 16-19, 20-24 and 25-34 age brackets are all overrepresented. Furthermore,
the 20-24 and 25-34 age brackets are the ones with the highest proportions.
However, these distributions only illustrate one aspect of the important part that
a driver’s age plays in accidents resulting in bodily injuries caused by speeding.

Who?
18
SPEEDING
Detailed profile of facts and statistics regarding
SPEEDING
Detailed profile of facts and statistics regarding SPEEDING | MAY 2015
To determine which age brackets are problematic by eliminating the effects
of volumes of licence holders, we calculated, for each bracket, the proportion
of accidents resulting in bodily injuries caused by speeding (the number of
accidents resulting in bodily injuries caused by speeding over the total number
of accidents resulting in bodily injuries per age bracket).
The 16-34 age brackets (25-34 [17.8%], 16-19 [20.7%] and 20-24 [21.3%]) are
those with the highest proportions of accidents resulting in bodily injuries
caused by speeding.
Source: Accident reports, 2012.
Proportion of accidents resulting in bodily injuries caused by speeding according to age
0% 5% 10% 15% 20% 25%
85-89
75-84
90 and older
Under 16
65-74
55-64
45-54
35-44
25-34
16-19
20-24 21.3%
20.7%
17.8%
15.5%
14.5%
12.9%
12%
10.2%
10.2%
9.3%
7.9%

Who?
19
SPEEDING
Detailed profile of facts and statistics regarding
SPEEDING
Detailed profile of facts and statistics regarding SPEEDING | MAY 2015
Men are overrepresented among drivers convicted of a speeding offence.
GenderProportion of offenders
for speeding, by gender
Proportion of driver’s licence holders
Female 32.6% 47.3%
Male 67.4% 52.7%
Men are overrepresented with respect to speeding offences. A comparison
of the proportion of drivers convicted of speeding by gender and the proportion
of driver’s licence holders by gender shows that men represent 67.4% of
offenders even though they represent 52.7% of licence holders.
Source: Les infractions et les sanctions reliées à la conduite d’un véhicule, 2003-2012.
Young drivers are much more frequently involved in accidents where speeding is a factor.
Young drivers are much more frequently involved in accidents where speeding
is a factor. Between 2008 and 2012. speeding was a factor for 50% of drivers
aged 16 to 24 involved in a fatal accident. This proportion was 36% for drivers
aged 25 or older. This situation was similar for all accidents resulting in bodily
injuries, since speeding was a factor for 26% of drivers aged 16 to 24, whereas
it was a factor in 18% of cases for drivers aged 25 or older.
Source: Accident reports, 2012.
The typical offender convicted of a speeding offence is aged 25 to 34, male, with a household income of $100,000 or more, who travels 25,000 km or more on average per year, and whose average speed in urban areas is over the speed limit.
The typical driver at greatest risk of speeding, i.e. a driver travelling at more
than 100 km/h on roads with a 90 km/h limit is:
• aged between 25 and 34;
• male;
• with a household income of $100,000 or more;
• who travels 25,000 km or more on average per year; and
• whose average speed in urban areas is over the speed limit.
Source: Survey to assess the 2012 speeding campaign, SAAQ.

Who?
20
SPEEDING
Detailed profile of facts and statistics regarding
SPEEDING
Detailed profile of facts and statistics regarding SPEEDING | MAY 2015
Drivers aged 16 to 34 are the most overrepresented in accidents caused by speeding in both rural and urban areas.
The distribution of accidents resulting in bodily injuries caused by speeding
and the distribution of accidents of all causes, in both rural and urban areas,
according to the age of drivers, shows that younger drivers are
overrepresented in accidents caused by speeding, regardless of area.
Source: Accident reports, 2012.
Distribution of accidents according to driver’s age and area
0
5%
10%
15%
20%
25%
75 and older65-7455-6445-5435-4424-3420-2416-19Under 16
Rural area, caused by speeding
Rural area all causes
Urban area all causes
Urban area, caused by speeding

21
When? SPEEDINGSPEEDING
Detailed profile of facts and statistics regarding
Detailed profile of facts and statistics regarding SPEEDING | MAY 2015
Accidents resulting in bodily injuries caused by speeding are particularly overrepresented between 9 p.m. and 6 a.m.
A comparison of the distribution of accidents resulting in bodily injuries and
the distribution of accidents resulting in bodily injuries caused by speeding
shows that more accidents occur between noon and 5:59 p.m. in both cases.
However, the time periods where accidents resulting in bodily injuries caused
by speeding are most overrepresented are from 9 p.m. to 11:59 p.m., midnight
to 2:59 a.m. and 3 a.m. to 5:59 a.m.
Source: Accident reports, 2012.
0%
5%
10%
15%
20%
25%
30%
All accidents resulting in bodily injuries
Accidents resulting in bodily injuries caused by speeding
9–11:59 p.m.6–8:59 p.m.3–5:59 p.m.Noon–2:59 p.m.9–11:59 a.m.6–8:59 a.m.3–5:59 a.m.Midnight–2:59 a.m.
7.7%
4.6%
6.8%
4.4%
13.3%12.3% 12.3%
13.0%
15.4%
18.3%
21.3%
25.5%
13.5% 13.6%
9.7%8.2%
Distribution of accidents in time

When?
22
SPEEDING
Detailed profile of facts and statistics regarding
SPEEDING
Detailed profile of facts and statistics regarding SPEEDING | MAY 2015
Accidents resulting in bodily injuries caused by speeding are more frequent and overrepresented in December and January.
MonthAccidents resulting
in bodily injuries caused by speeding
All accidents resulting in bodily injuries
January 11.0% 7.8%
February 7.2% 6.8%
March 7.1% 6.7%
April 7.4% 6.5%
May 6.9% 8.5%
June 8.2% 9.3%
July 8.4% 9.8%
August 8.9% 9.7%
September 7.8% 9.2%
October 7.4% 8.4%
November 8.3% 8.6%
December 11.4% 8.8%
The months during which there are more accidents resulting in bodily injuries
caused by speeding are January (11.0%) and December (11.4%), which are the
only two months with more than 10%, compared to 7.8% and 8.8% respectively
for all accidents resulting in bodily injuries.
The winter period (December to April) is the one where accidents resulting in
bodily injuries caused by speeding are overrepresented.
During this period, the percentages of accidents resulting in bodily injuries
caused by speeding are greater than all accidents resulting in bodily injuries.
Source: Accident reports, 2012.
Accidents resulting in bodily injuries caused by speeding are more frequent and overrepresented on weekends (Saturday and Sunday).
DayAccidents resulting
in bodily injuries caused by speeding
All accidents resulting in bodily injuries
Monday 13.4% 13.4%
Tuesday 11.0% 13.5%
Wednesday 12.5% 14.2%
Thursday 13.3% 15.7%
Friday 17.1% 17.2%
Saturday 17.4% 14.0%
Sunday 15.4% 12.0%
Accidents resulting in bodily injuries caused by speeding occur in greater
proportion on Fridays (17.1%), Saturdays (17.4%) and Sundays (15.4%).
In addition to being days where accidents resulting in bodily injuries caused by
speeding occur more frequently, Saturdays and Sundays are the only days
where accidents resulting in bodily injuries caused by speeding are
overrepresented compared with all accidents resulting in bodily injuries.
The proportion of average daily accidents resulting in bodily injuries caused by
speeding is 16.4% on weekends (Saturday and Sunday) and 13.4% on weekdays.
For all accidents resulting in bodily injuries, these statistics are 13.0% and 14.8%
respectively.
Source: Accident reports, 2012.

Where?
23
SPEEDINGSPEEDING
Detailed profile of facts and statistics regarding
Detailed profile of facts and statistics regarding SPEEDING | MAY 2015
Accidents resulting in bodily injuries caused by speeding are more frequent and overrepresented in rural areas.
AreaAccidents resulting
in bodily injuries caused by speeding
All accidents resulting in bodily injuries
Residential 17.1% 25.4%
Commercial 20.2% 39.1%
Rural 56.2% 29.1%
Other1 6.5% 6.4%
1. The “Other” category includes school zones and industrial, forest and recreational areas.
A greater proportion of accidents resulting in bodily injuries caused by
speeding occur in rural areas (56.2%).
It is only in this area that accidents resulting in bodily injuries caused
by speeding are overrepresented compared to all accidents resulting in bodily
injuries.
Source: Accident reports, 2012.
Accidents resulting in bodily injuries caused by speeding are more frequent and overrepresented on numbered roads.
Road categoriesAccidents resulting
in bodily injuries caused by speeding
All accidents resulting in bodily
injuries
Highway, service road and collector lane 5.0% 2.9%
Numbered road 56.0% 37.0%
Main road 10.2% 31.0%
Residential street 8.5% 15.3%
Rural road 16.2% 9.0%
Other1 4.0% 5.0%
1. The “Other” category includes alleys, parking lots, private properties, private roads, forestry roads, marked trails and others.
Nearly three out of four accidents resulting in bodily injuries caused by speeding
(72.2%) occur on numbered roads (56.0%) and on rural roads (16.2%).
Furthermore, three road catetories are overrepresented for accidents resulting in
bodily injuries caused by speeding: Numbered roads, Rural roads and Highways,
service roads and collector lanes.
The ratio of proportions for these three overrepresented categories are:
• 1.51 for Numbered roads;
• 1.72 for Highways, service roads and collector lanes;
• 1.80 for Rural roads.
Source: Accident reports, 2012.

Where?
24
SPEEDING
Detailed profile of facts and statistics regarding
SPEEDING
Detailed profile of facts and statistics regarding SPEEDING | MAY 2015
Accidents resulting in bodily injuries caused by speeding are more frequent and overrepresented between intersections.
LocationAccidents resulting
in bodily injuries caused by speeding
All accidents resulting in bodily injuries
At an intersection (less than 5 m)
17.8% 39.7%
Between intersections (100 m or more)
59.9% 36.4%
Near an intersection or roundabout
11.3% 14.1%
Other 11.1% 9.9%
Approximately 60% of accidents resulting in bodily injuries caused by speeding
occur 100 m or more away from an intersection (59.9%), whereas 36.4% of all
accidents resulting in bodily injuries occur there. Accidents resulting in bodily
injuries caused by speeding are therefore overrepresented between
intersections, where this type of accident most frequently occurs.
It would seem that accidents resulting in bodily injuries caused by speeding
occur when drivers have enough space to accelerate.
Source: Accident reports, 2012
Accidents resulting in bodily injuries caused by speeding are more frequent and overrepresented where there are no traffic signs or signals.
Traffic signs and signalsAccidents resulting
in bodily injuries caused by speeding
All accidents resulting in bodily injuries
No signs or signals 83.0% 65.0%
Presence of signs or signals 17.0% 35.0%
Accidents resulting in bodily injuries caused by speeding are more frequent
where there are no traffic signs or signals (83.0% versus 17.0%). Furthermore,
these types of accidents are overrepresented in areas without traffic signs or
signals compared to all accidents resulting in bodily injuries that occur in this
type of environment (proportion of 83.0% versus 65.0%).
Source: Accident reports, 2012.

Where?
25
SPEEDING
Detailed profile of facts and statistics regarding
SPEEDING
Detailed profile of facts and statistics regarding SPEEDING | MAY 2015
Accidents resulting in bodily injuries caused by speeding are more frequent and are overrepresented on roads with a speed limit of 90 km/h.
Half of all accidents resulting in bodily injuries caused by speeding (49.1%) occur in 50 km/h or 90 km/h zones.
Speed limitProportion of accidents resulting
in bodily injuries caused by speeding
Proportion of all accidents resulting in bodily injuries
Ratio of proportions
Below 50 km/h 2.3% 5.7% 0.40
50 km/h 24.0% 50.6% 0.47
60 km/h 0.7% 1.0% 0.70
70 ou 75 km/h 17.5% 13.0% 1.34
80 km/h 10.8% 5.7% 1.89
90 km/h 25.1% 15.3% 1.64
100 km/h 19.5% 8.7% 2.24
Accidents resulting in bodily injuries caused by speeding occur most
frequently on roads with a 90 km/h speed limit. The proportion of these types
of accidents (25.1%) is higher on these roads than all accidents resulting in
bodily injuries (15.3%) that occur on these roads, which indicates that these
accidents are overrepresented. Furthermore, 24% of accidents caused by
speeding occur in 50 km/h zones.
As of 70 km/h, proportions of accidents resulting in bodily injuries caused
by speeding are greater than proportions of all accidents resulting in bodily
injuries. There is therefore overrepresentation in these categories.
Overrepresentation is greatest on roads with a 100 km/h speed limit.
Source: Accident reports, 2012.
Where?
26
SPEEDING
Detailed profile of facts and statistics regarding
SPEEDING
Detailed profile of facts and statistics regarding SPEEDING | MAY 2015
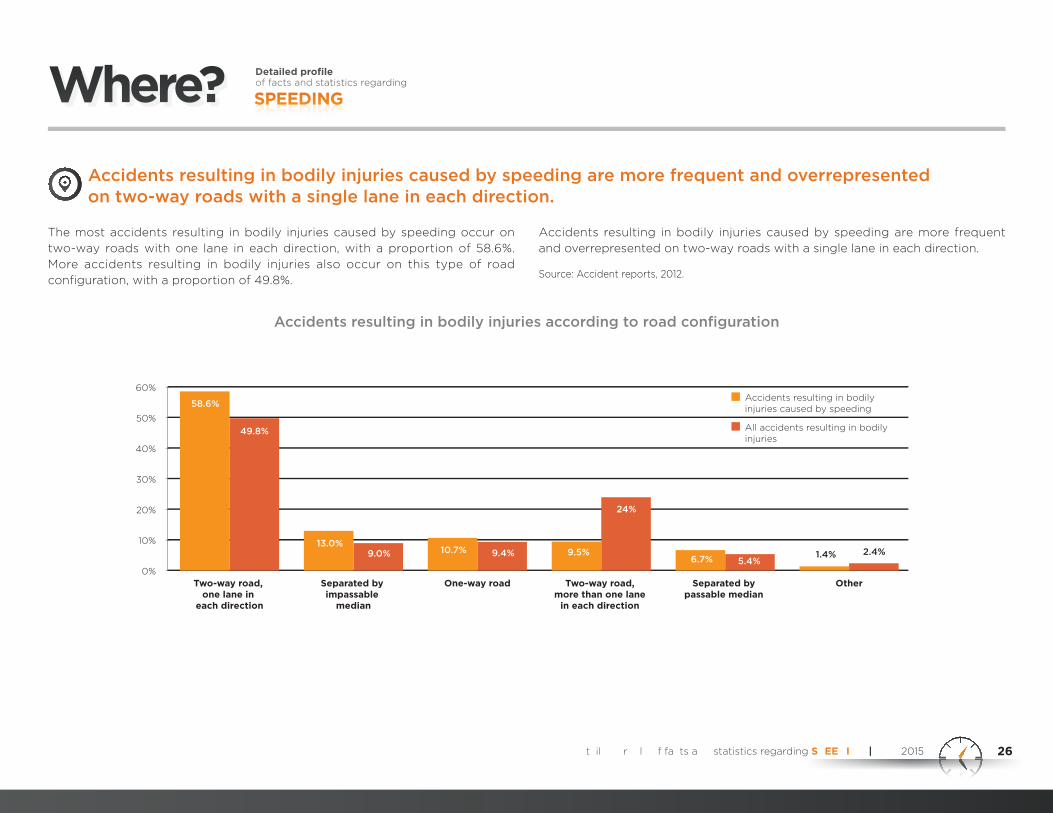
Accidents resulting in bodily injuries caused by speeding are more frequent and overrepresented on two-way roads with a single lane in each direction.
The most accidents resulting in bodily injuries caused by speeding occur on
two-way roads with one lane in each direction, with a proportion of 58.6%.
More accidents resulting in bodily injuries also occur on this type of road
configuration, with a proportion of 49.8%.
Accidents resulting in bodily injuries caused by speeding are more frequent
and overrepresented on two-way roads with a single lane in each direction.
Source: Accident reports, 2012.
Accidents resulting in bodily injuries according to road configuration
0%
10%
20%
30%
40%
50%
60%Accidents resulting in bodily injuries caused by speeding
All accidents resulting in bodily injuries
OtherSeparated by passable median
Two-way road, more than one lane
in each direction
One-way roadSeparated by impassable
median
Two-way road, one lane in
each direction
58.6%
49.8%
13.0%9.0% 10.7% 9.4% 9.5%
24%
6.7% 5.4%1.4% 2.4%

Where?
27
SPEEDING
Detailed profile of facts and statistics regarding
SPEEDING
Detailed profile of facts and statistics regarding SPEEDING | MAY 2015
Speeding is of particular concern is less populated administrative regions, particularly in the Gaspésie–Îles-de-la-Madeleine, Côte-Nord and Bas-Saint-Laurent regions.
Administrative regionProportion of accidents resulting in bodily injuries caused by speeding
Gaspésie–Îles-de-la-Madeleine 37.7%
Côte-Nord 32.5%
Bas-Saint-Laurent 30.7%
Chaudière-Appalaches 29.8%
Nord-du-Québec 29.8%
Centre-du-Québec 28.2%
Abitibi-Témiscamingue 27.3%
Lanaudière 22.3%
Saguenay–Lac-Saint-Jean 21.5%
Capitale-Nationale 21.4%
Estrie 19.9%
Montérégie 19.8%
All of Québec 19.1%
Mauricie 19.0%
Laurentides 18.2%
Outaouais 13.2%
Laval 10.6%
Montréal 9.2%
he proportion of accidents resulting in bodily injuries caused by speeding per
region is obtained by dividing the number of accidents resulting in bodily
injuries caused by speeding by all accidents resulting in bodily injuries whose
causes are known. The table on the left lists the administrative regions in
decreasing order of this proportion.
The proportion of accidents resulting in bodily injuries caused by speeding is
especially concerning in the less populated regions of Québec. This
proportion represents more than one out of three accidents in the most
affected region (37.7%) and less than one out of ten accidents in the less
affected region (9.2%).
The highest proportions of accidents resulting in bodily injuries caused by
speeding occur in the Gaspésie–Îles-de-la-Madeleine (37.7%), Côte-Nord
(32.5%) and Bas-Saint-Laurent (30.7%) regions. The proportions by region
show that a relationship exists between the low population density of a
region (lower population and greater area) and the significance of its
proportion of accidents resulting in bodily injuries caused by speeding
(correlation coefficient r = - 0.6).
The regions where this proportion is lowest are: Montréal (9.2%), Laval (10.6%)
and Outaouais (13.2%). These regions are the only three where proportions are
below 15%.
Source: Accident reports, 2012.

Where?
28
SPEEDING
Detailed profile of facts and statistics regarding
SPEEDING
Detailed profile of facts and statistics regarding SPEEDING | MAY 2015
Accidents resulting in bodily injuries caused by speeding are more numerous in the Montréal and Montérégie regions.
However, these types of accidents are most overrepresented in the Gaspésie–Îles-de-la-Madeleine and Nord-du-Québec regions.
Administrative region
Distribution of accidents by region
RatioAccidents
resulting in bodily injuries
caused by speeding
Accidents resulting in
bodily injuries
Gaspésie–Îles-de-la-Madeleine 2.7% 1.3% 2.09
Nord-du-Québec 0.7% 0.4% 1.97
Bas-Saint-Laurent 4.8% 2.8% 1.71
Côte-Nord 2.3% 1.4% 1.68
Centre-du-Québec 5.4% 3.5% 1.55
Chaudière-Appalaches 8.8% 5.8% 1.52
Abitibi-Témiscamingue 3.3% 2.2% 1.50
Lanaudière 8.6% 7.0% 1.23
Saguenay–Lac-Saint-Jean 4.5% 3.8% 1.18
Capitale-Nationale 9.0% 8.1% 1.10
Estrie 4.4% 4.0% 1.09
Montérégie 18.8% 17.7% 1.06
Mauricie 4.5% 4.3% 1.05
Laurentides 7.5% 7.8% 0.97
Outaouais 2.9% 4.5% 0.65
Laval 2.8% 4.9% 0.58
Montréal 9.2% 20.8% 0.44
The table on the left presents the distribution of accidents by region of Québec
for accidents resulting in bodily injuries caused by speeding and accidents
resulting in bodily injuries.
The proportions of accidents resulting in bodily injuries caused by speeding are
greatest in the Montérégie (18.8%) and Montréal (9.2%) regions. However, the
magnitude of these proportions is certainly related to the high population in
these regions.
To illustrate the significance of speeding as a factor in accidents resulting in
bodily injuries by region, we calculated the ratio of these proportions. This
indicator reveals that the Gaspésie–Îles-de-la-Madeleine (2.09) and Nord-du-
Québec (1.97) regions are the ones where accidents resulting in bodily injuries
caused by speeding are most overrepresented.
Source: Accident reports, 2012.

Where?
29
SPEEDING
Detailed profile of facts and statistics regarding
SPEEDING
Detailed profile of facts and statistics regarding SPEEDING | MAY 2015
The regions where speeding offence rates are highest are Nord-du-Québec and Laurentides, and excessive speeding offences are highest in Laval and Montréal.
Administrative region
Rates of offences per 100,000 driver’s licence holders - 2012
for speedingfor excessive
speeding
Nord-du-Québec 16,627 191
Laurentides 15,518 188
Laval 14,387 240
Lanaudière 13,364 203
Outaouais 13,300 115
Estrie 13,150 129
Montérégie 13,059 163
Saguenay–Lac-Saint-Jean 12,161 109
Mauricie 12,132 84
All of Québec 11,875 166
Abitibi-Témiscamingue 11,615 135
Gaspésie–Îles-de-la-Madeleine 11,484 157
Chaudière-Appalaches 11,142 117
Centre-du-Québec 10,749 122
Côte-Nord 10,713 133
Bas-Saint-Laurent 9,955 108
Montréal 9,457 238
Capitale-Nationale 8,750 104
Although the number of offences is partly due to resources attributed by
police forces for control activities, it remains a reliable statistic to understand
the magnitude of the phenomenon. The number of statements of offence
served in 2012 was 616,875 for speeding and 8,625 for excessive speeding.
Because the distribution of the number of offences per region is also partly
a function of the number of driver’s licence holders in those regions, we have
used the rates of offences per 100,000 driver’s licence holders to reduce the
effects of population size. The distribution of rates is presented in the table on
the left.
Two regions stand out because of high rates of offences (above 15,000) for
speeding per 100,000 driver’s licence holders: the Nord-du-Québec region,
with a rate of 16,627, and the Laurentides region, with a rate of 15,518, are by far
the regions with the highest rates.
With respect to excessive speeding offences, two regions have rates that stand
out compared to others: Laval (240) and Montréal (238).
Sources: Les infractions pour grands excès de vitesse et pour l’utilisation d’un téléphone cellulaire pendant la conduite d’un véhicule routier, 2008-2011.
Les infractions et les sanctions reliées à la conduite d’un véhicule, 2003-2012.

Where?
30
SPEEDING
Detailed profile of facts and statistics regarding
SPEEDING
Detailed profile of facts and statistics regarding SPEEDING | MAY 2015
Speeding in road work areas is a major concern.
Lanaudière and Nord-du-Québec are the regions where rates of offences for speeding in or near road work areas are greatest.
Distribution of accidents in or near road work areas
0%
1%
2%
3%Near a road work area
In a road work area
All accidents resulting in bodily injuries
Accidents resulting in bodily injuries caused by speeding
1.1%
2.7%
0.9%
1.7%
Road work areas are special when it comes to speed limits, as limits are lower
than usual because of narrower roadways or the presence of workers. Accident
reports reveal whether an accident occurred in or near a road work area.
The graph above shows that the proportion of accidents resulting in bodily
injuries caused by speeding in or near road work areas is greater than for all
accidents resulting in bodily injuries. There is therefore overrepresentation.
However, caution is necessary when interpreting these proportions, because
these events remain rare and data is based on a small number of accidents.
Administrative regionRates of offences for speeding
during road work - 20121
Lanaudière 494
Nord-du-Québec 401
Laurentides 377
Bas-Saint-Laurent 359
Mauricie 346
Capitale-Nationale 345
Outaouais 331
Chaudière-Appalaches 326
Centre-du-Québec 312
All of Québec 280
Montérégie 273
Saguenay–Lac-Saint-Jean 266
Laval 244
Gaspésie–Îles-de-la-Madeleine 236
Côte-Nord 219
Estrie 218
Montréal 134
Abitibi-Témiscamingue 121
1. Rate calculated for 100,000 driver’s licence holders according to the region of residence

Where?
31
SPEEDING
Detailed profile of facts and statistics regarding
SPEEDING
Detailed profile of facts and statistics regarding SPEEDING | MAY 2015
Speeding offences committed in road work areas result in doubled fines. In the
case of an excessive speeding offence, special penalties apply.
In 2012, driver’s licence holders were convicted of 14,562 speeding offences in
or near road work areas. Offence rates per region are presented in the table on
the previous page.
Two regions stand out because of their high rates of speeding offences in or
near road work areas (more than 400) per 100,000 driver’s licence holders.
These regions are Lanaudière, with a rate of 494, and Nord-du-Québec, with a
rate of 401.
Conversely, the Montréal (134) and Abitibi-Témiscamingue (121) regions have
the lowest rates, and are the only regions with a rate below 200.
Sources: Les infractions pour grands excès de vitesse et pour l’utilisation d’un téléphone cellulaire pendant la conduite d’un véhicule routier, 2008-2013.
Accident reports, 2012.
C-6
08
6-A
(15
-04
)
Legal deposit – 2nd quarter of 2015 Bibliothèque et Archives nationales du Québec ISBN (PDF) 978-2-550-73879-4 © 2015, Société de l’assurance automobile du Québec Original text in French


