40
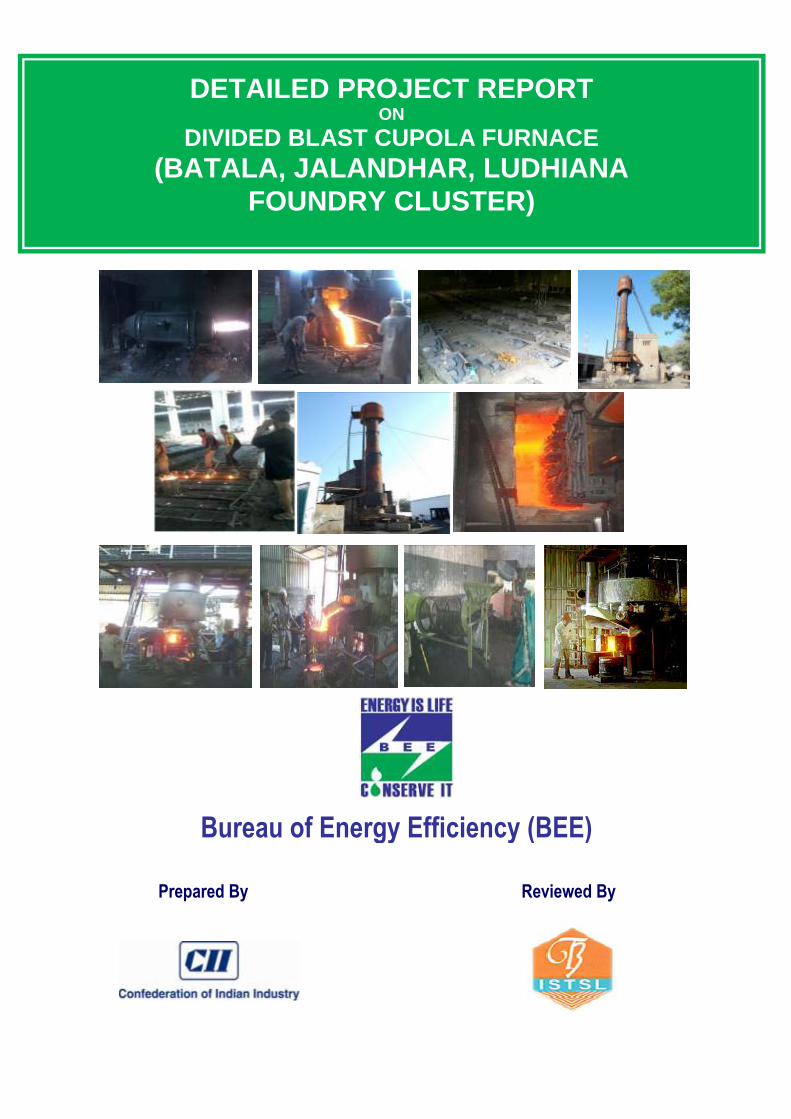
Bureau of Energy Efficiency (BEE) Prepared By Reviewed By DETAILED PROJECT REPORT ON DIVIDED BLAST CUPOLA FURNACE (BATALA, JALANDHAR, LUDHIANA FOUNDRY CLUSTER)
ETAILED PROJECT REPORT
ON
ENERGY COST REDUCTION WITH ENERGY
EFFI.IENT MR
(ALWAR OIL MILL CLUSTER)
Bureau of Energy Efficiency (BEE)
Prepared By Reviewed By
DETAILED PROJECT REPORT ON
DIVIDED BLAST CUPOLA FURNACE
(BATALA, JALANDHAR, LUDHIANA
FOUNDRY CLUSTER)
DIVIDED BLAST CUPOLA FURNACE
BATALA, JALANDHAR, LUDHIANA FOUNDRY CLUSTER
BEE, 2011
Detailed Project Report on Divided Blast Cupola Furnace Foundry SME Cluster, Batala, Jalandhar , Ludhiana (Punjab) (India) New Delhi: Bureau of Energy Efficiency Detail Project Report No.: BJL/FUR/DBC/01
For more information please contact
Bureau of Energy Efficiency (BEE)
(Ministry of Power, Government of India)
4th Floor, Sewa Bhawan
R. K. Puram, New Delhi – 110066
Telephone+91-11-26179699
Fax+91-11-26178352
Website: www.bee-india.nic.in

Acknowledgement
We are sincerely thankful to the Bureau of Energy Efficiency, Ministry of Power, for
giving us the opportunity to implement the „BEE SME project in “BJL Foundry Cluster,
Batala, Jalandhar & Ludhiana”. We express our sincere gratitude to all concerned
officials for their support and guidance during the conduct of this exercise.
Dr. Ajay Mathur, Director General, BEE
Smt. Abha Shukla, Secretary, BEE
Shri Jitendra Sood, Energy Economist, BEE
Shri Pawan Kumar Tiwari, Advisor (SME), BEE
Shri Rajeev Yadav, Project Economist, BEE
CII – AVANTHA Centre for Competitiveness for SMEs, Confederation of Indian Industry
(CII) is also thankful to Industry Associations for their valuable inputs, cooperation,
support and facilitating the implementation of BEE SME program in BJL Foundry
Cluster.
We take this opportunity to express our appreciation for the excellent support provided
by Foundry Unit Owners, Local Service Providers, and Equipment Suppliers for their
active involvement and their valuable inputs in making the program successful and in
completion of the Detailed Project Report (DPR).
CII – AVANTHA Centre for Competitiveness for SMEs, Confederation of Indian Industry
(CII) is also thankful to all the SME owners, plant in charges and all workers of the SME
units for their support during the energy use and technology audit studies and in
implementation of the project objectives.
CII – AVANTHA Centre for Competitiveness for SMEs
Confederation of Indian Industry
Chandigarh
Contents
List of Annexure vii
List of Tables vii
List of Figures viii
List of Abbreviation viii
Executive summary ix
About BEE’S SME program xi
1. INTRODUCTION ................................................................................................ 1
1.1. Brief Introduction about the cluster ...................................................................... 1
1.1.1. Energy usage Pattern ......................................................................................... 1
1.1.2. Classification of Units .......................................................................................... 1
1.1.3. Production wise unit breakup .............................................................................. 2
1.1.4. Products Manufactured ....................................................................................... 2
1.2. Process Flow Diagram of A Foundry Cluster ...................................................... 2
1.3. Energy Performance in Existing Situation ........................................................... 4
1.3.1. Average Production ............................................................................................ 4
1.3.2. Energy Consumption .......................................................................................... 4
1.3.3. Specific Energy Consumption ............................................................................. 5
1.4. Proposed Technology/Equipment ....................................................................... 5
1.4.1. Description about the Existing Technology ......................................................... 5
1.5. Establishing the Baseline for the Proposed Technology ...................................... 6
1.6. Barriers in adoption of Proposed Technology ..................................................... 6
1.6.1. Technological Barrier .......................................................................................... 6
1.6.2. Financial Barrier .................................................................................................. 6
1.6.3. Skilled Manpower ............................................................................................... 7
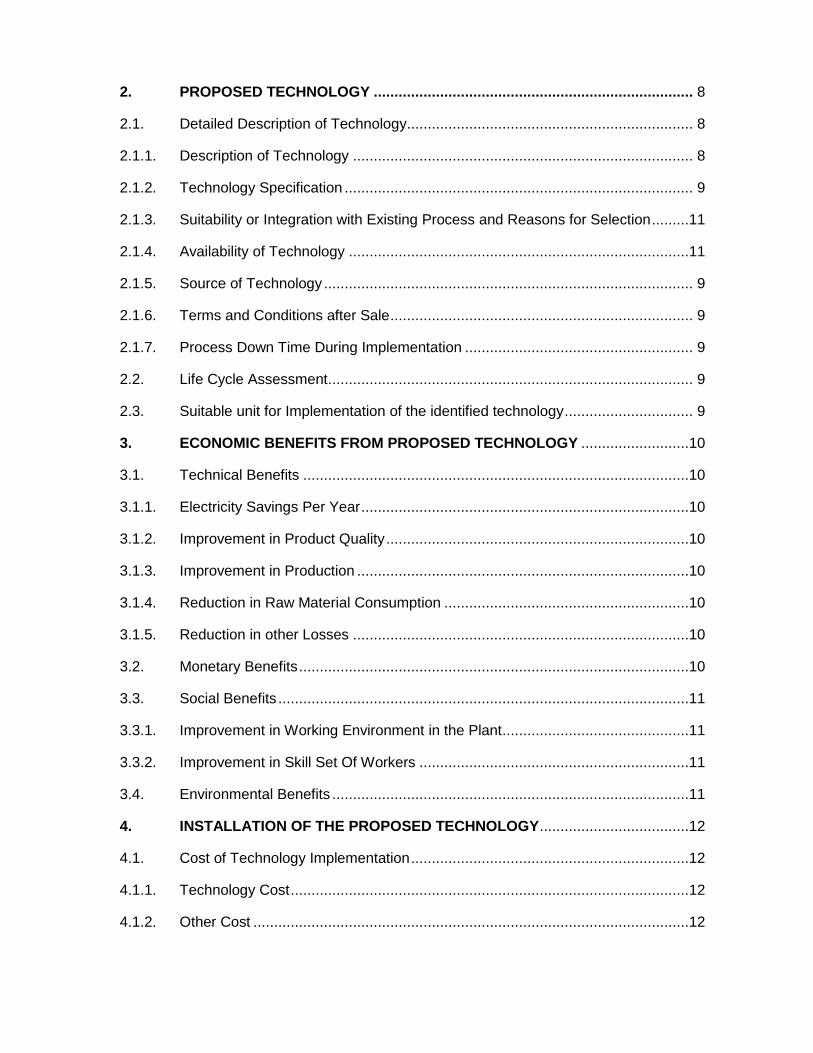
2. PROPOSED TECHNOLOGY ............................................................................. 8
2.1. Detailed Description of Technology ..................................................................... 8
2.1.1. Description of Technology .................................................................................. 8
2.1.2. Technology Specification .................................................................................... 9
2.1.3. Suitability or Integration with Existing Process and Reasons for Selection .........11
2.1.4. Availability of Technology ..................................................................................11
2.1.5. Source of Technology ......................................................................................... 9
2.1.6. Terms and Conditions after Sale ......................................................................... 9
2.1.7. Process Down Time During Implementation ....................................................... 9
2.2. Life Cycle Assessment ........................................................................................ 9
2.3. Suitable unit for Implementation of the identified technology ............................... 9
3. ECONOMIC BENEFITS FROM PROPOSED TECHNOLOGY ..........................10
3.1. Technical Benefits .............................................................................................10
3.1.1. Electricity Savings Per Year ...............................................................................10
3.1.2. Improvement in Product Quality .........................................................................10
3.1.3. Improvement in Production ................................................................................10
3.1.4. Reduction in Raw Material Consumption ...........................................................10
3.1.5. Reduction in other Losses .................................................................................10
3.2. Monetary Benefits ..............................................................................................10
3.3. Social Benefits ...................................................................................................11
3.3.1. Improvement in Working Environment in the Plant .............................................11
3.3.2. Improvement in Skill Set Of Workers .................................................................11
3.4. Environmental Benefits ......................................................................................11
4. INSTALLATION OF THE PROPOSED TECHNOLOGY ....................................12
4.1. Cost of Technology Implementation ...................................................................12
4.1.1. Technology Cost ................................................................................................12
4.1.2. Other Cost .........................................................................................................12
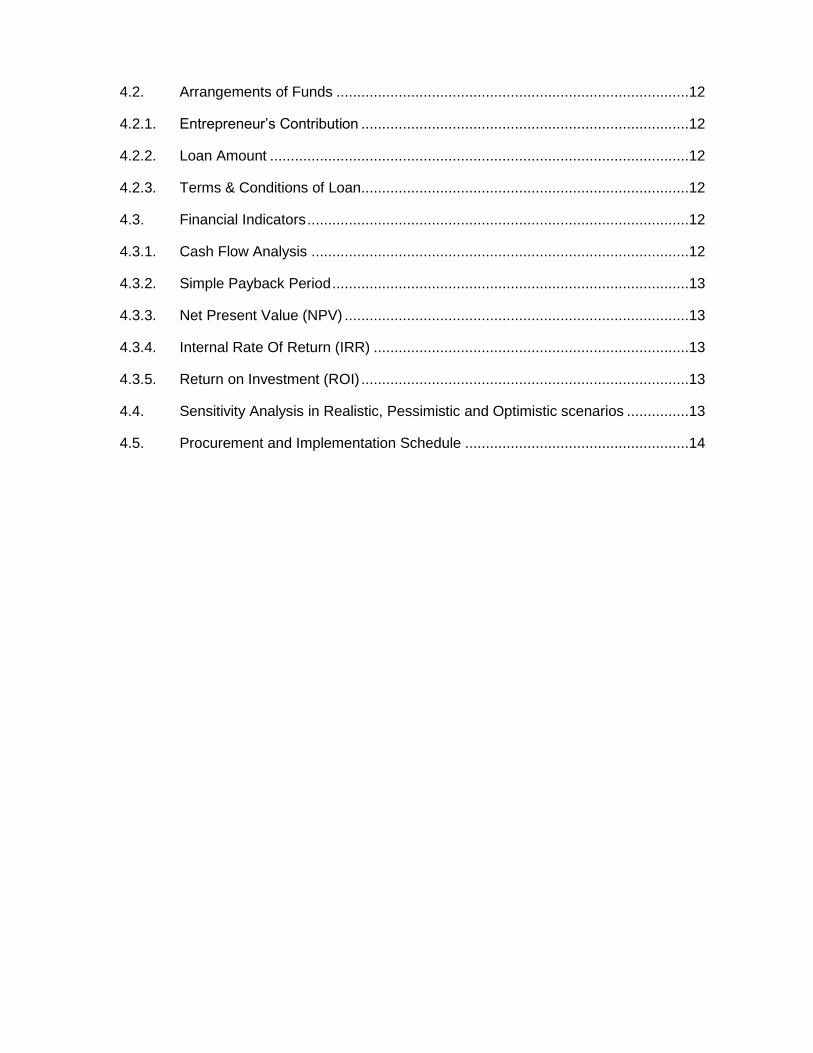
4.2. Arrangements of Funds .....................................................................................12
4.2.1. Entrepreneur‟s Contribution ...............................................................................12
4.2.2. Loan Amount .....................................................................................................12
4.2.3. Terms & Conditions of Loan ...............................................................................12
4.3. Financial Indicators ............................................................................................12
4.3.1. Cash Flow Analysis ...........................................................................................12
4.3.2. Simple Payback Period ......................................................................................13
4.3.3. Net Present Value (NPV) ...................................................................................13
4.3.4. Internal Rate Of Return (IRR) ............................................................................13
4.3.5. Return on Investment (ROI) ...............................................................................13
4.4. Sensitivity Analysis in Realistic, Pessimistic and Optimistic scenarios ...............13
4.5. Procurement and Implementation Schedule ......................................................14

vii
List of Annexure
Annexure 1: Energy audit data Used for baseline establishment .............................15
Annexure 2: Detailed Technology Assessment Report ............................................16
Annexure 3: Detailed Financial Calculations ...........................................................17
Annexure 4: Procurement and Implementation Schedule ........................................20
Annexure 5: Break-Up of Process Down Time ........................................................21
Annexure 6: Details of Technology Service Providers .............................................22
Annexure 7: Quotations or Techno-Commercial Bids for New Technology /
Equipment ...........................................................................................23
vii
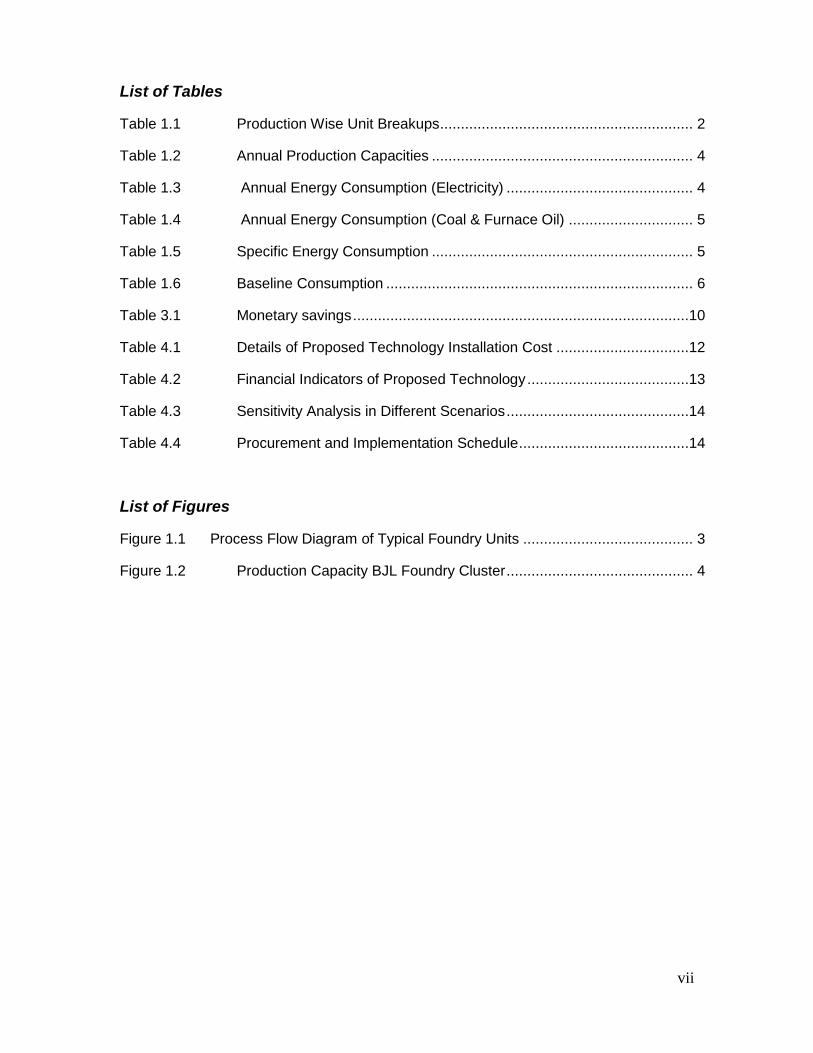
List of Tables
Table 1.1 Production Wise Unit Breakups ............................................................. 2
Table 1.2 Annual Production Capacities ............................................................... 4
Table 1.3 Annual Energy Consumption (Electricity) ............................................. 4
Table 1.4 Annual Energy Consumption (Coal & Furnace Oil) .............................. 5
Table 1.5 Specific Energy Consumption ............................................................... 5
Table 1.6 Baseline Consumption .......................................................................... 6
Table 3.1 Monetary savings .................................................................................10
Table 4.1 Details of Proposed Technology Installation Cost ................................12
Table 4.2 Financial Indicators of Proposed Technology .......................................13
Table 4.3 Sensitivity Analysis in Different Scenarios ............................................14
Table 4.4 Procurement and Implementation Schedule .........................................14
List of Figures
Figure 1.1 Process Flow Diagram of Typical Foundry Units ......................................... 3
Figure 1.2 Production Capacity BJL Foundry Cluster ............................................. 4
vii
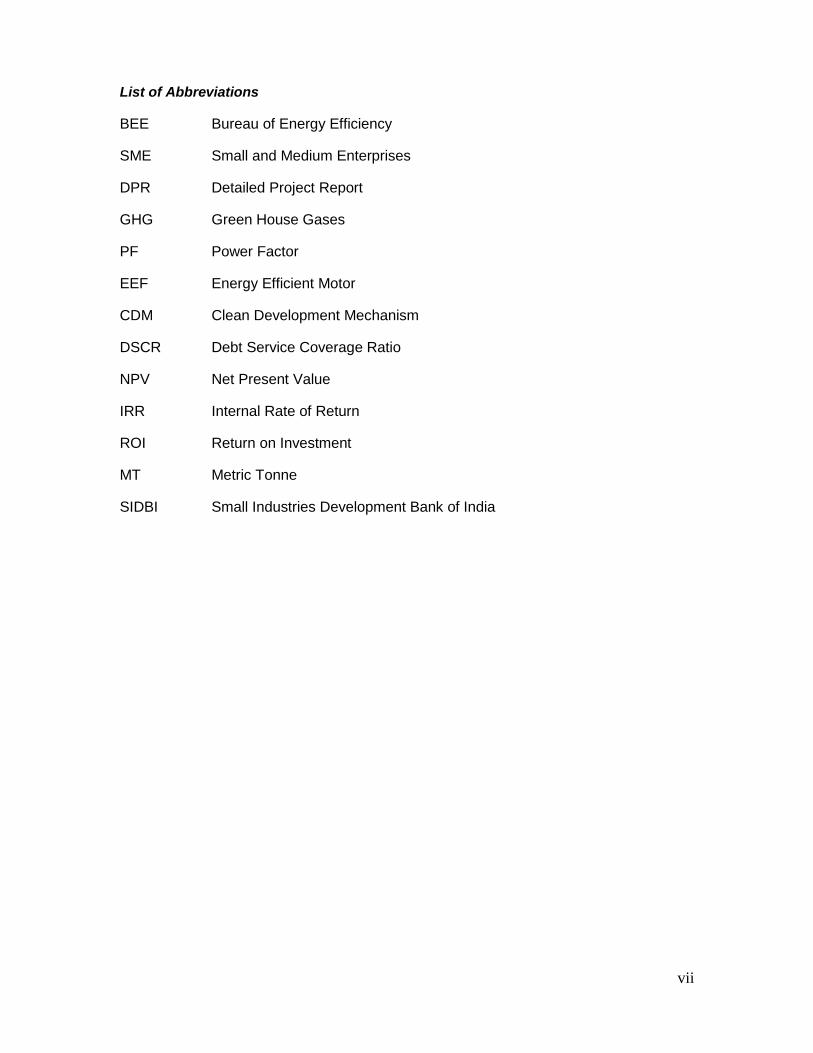
List of Abbreviations
BEE Bureau of Energy Efficiency
SME Small and Medium Enterprises
DPR Detailed Project Report
GHG Green House Gases
PF Power Factor
EEF Energy Efficient Motor
CDM Clean Development Mechanism
DSCR Debt Service Coverage Ratio
NPV Net Present Value
IRR Internal Rate of Return
ROI Return on Investment
MT Metric Tonne
SIDBI Small Industries Development Bank of India
viii
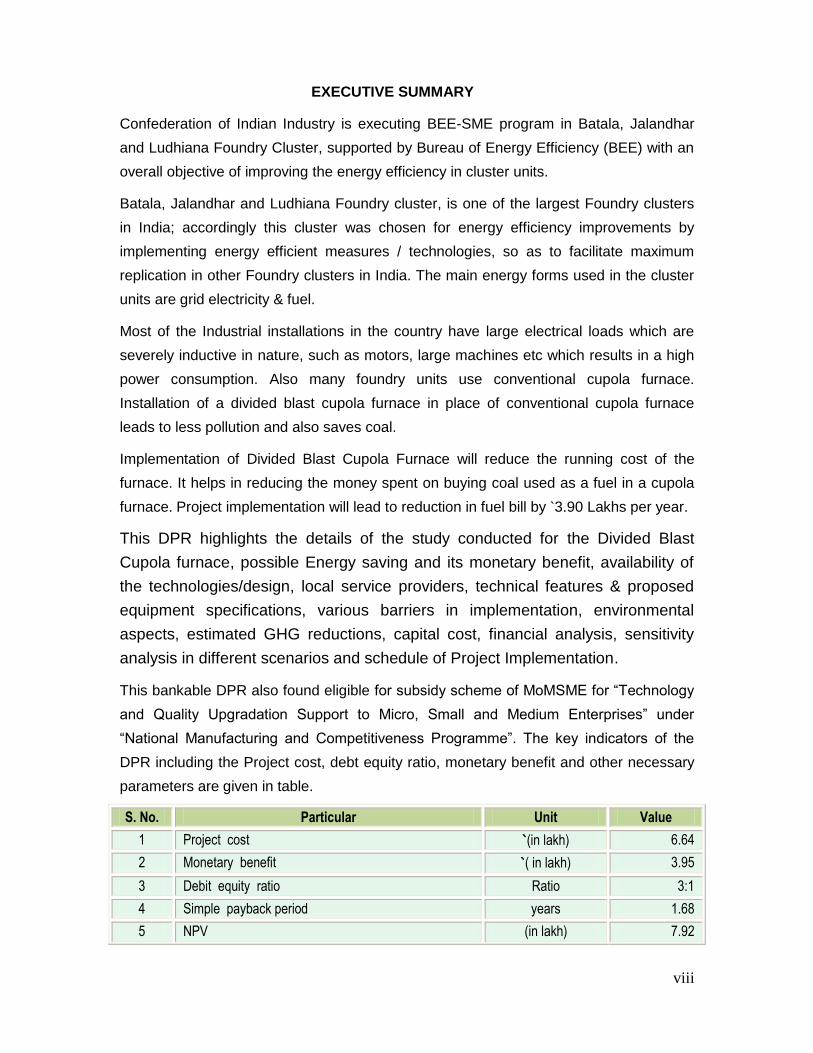
EXECUTIVE SUMMARY
Confederation of Indian Industry is executing BEE-SME program in Batala, Jalandhar
and Ludhiana Foundry Cluster, supported by Bureau of Energy Efficiency (BEE) with an
overall objective of improving the energy efficiency in cluster units.
Batala, Jalandhar and Ludhiana Foundry cluster, is one of the largest Foundry clusters
in India; accordingly this cluster was chosen for energy efficiency improvements by
implementing energy efficient measures / technologies, so as to facilitate maximum
replication in other Foundry clusters in India. The main energy forms used in the cluster
units are grid electricity & fuel.
Most of the Industrial installations in the country have large electrical loads which are
severely inductive in nature, such as motors, large machines etc which results in a high
power consumption. Also many foundry units use conventional cupola furnace.
Installation of a divided blast cupola furnace in place of conventional cupola furnace
leads to less pollution and also saves coal.
Implementation of Divided Blast Cupola Furnace will reduce the running cost of the
furnace. It helps in reducing the money spent on buying coal used as a fuel in a cupola
furnace. Project implementation will lead to reduction in fuel bill by `3.90 Lakhs per year.
This DPR highlights the details of the study conducted for the Divided Blast
Cupola furnace, possible Energy saving and its monetary benefit, availability of
the technologies/design, local service providers, technical features & proposed
equipment specifications, various barriers in implementation, environmental
aspects, estimated GHG reductions, capital cost, financial analysis, sensitivity
analysis in different scenarios and schedule of Project Implementation.
This bankable DPR also found eligible for subsidy scheme of MoMSME for “Technology
and Quality Upgradation Support to Micro, Small and Medium Enterprises” under
“National Manufacturing and Competitiveness Programme”. The key indicators of the
DPR including the Project cost, debt equity ratio, monetary benefit and other necessary
parameters are given in table.
S. No. Particular Unit Value
1 Project cost `(in lakh) 6.64
2 Monetary benefit `( in lakh) 3.95
3 Debit equity ratio Ratio 3:1
4 Simple payback period years 1.68
5 NPV (in lakh) 7.92
ix
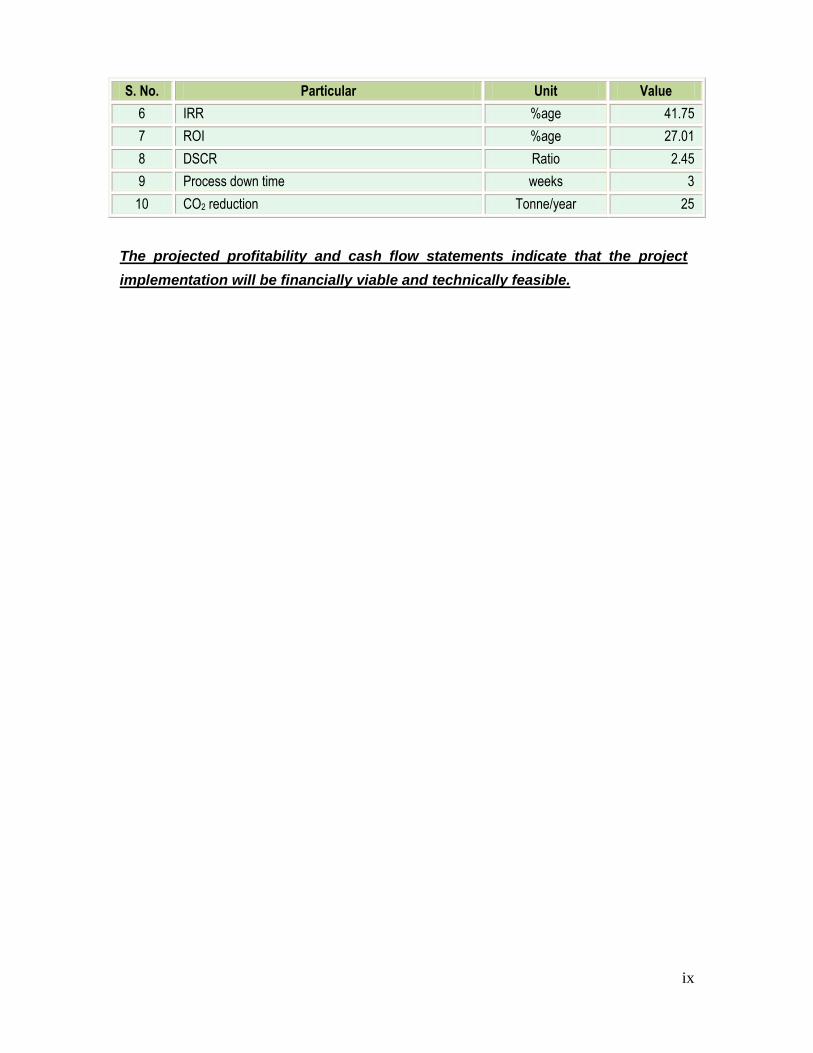
S. No. Particular Unit Value
6 IRR %age 41.75
7 ROI %age 27.01
8 DSCR Ratio 2.45
9 Process down time weeks 3
10 CO2 reduction Tonne/year 25
The projected profitability and cash flow statements indicate that the project
implementation will be financially viable and technically feasible.
x
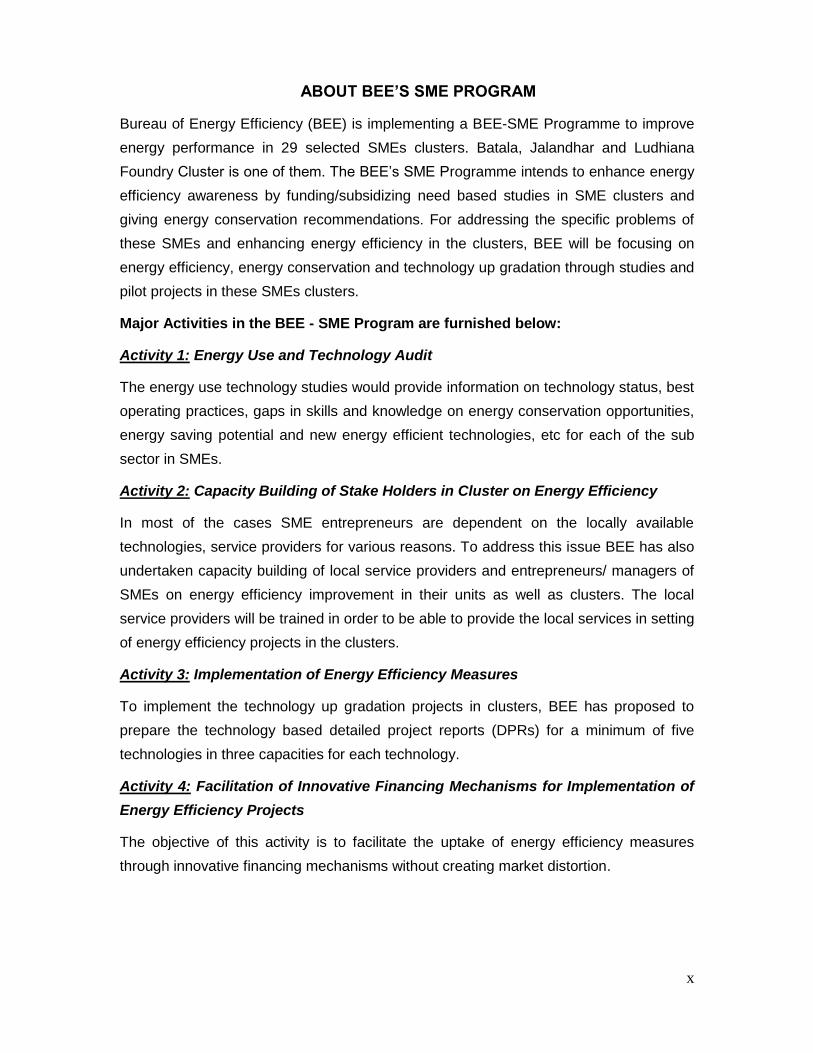
ABOUT BEE’S SME PROGRAM
Bureau of Energy Efficiency (BEE) is implementing a BEE-SME Programme to improve
energy performance in 29 selected SMEs clusters. Batala, Jalandhar and Ludhiana
Foundry Cluster is one of them. The BEE‟s SME Programme intends to enhance energy
efficiency awareness by funding/subsidizing need based studies in SME clusters and
giving energy conservation recommendations. For addressing the specific problems of
these SMEs and enhancing energy efficiency in the clusters, BEE will be focusing on
energy efficiency, energy conservation and technology up gradation through studies and
pilot projects in these SMEs clusters.
Major Activities in the BEE - SME Program are furnished below:
Activity 1: Energy Use and Technology Audit
The energy use technology studies would provide information on technology status, best
operating practices, gaps in skills and knowledge on energy conservation opportunities,
energy saving potential and new energy efficient technologies, etc for each of the sub
sector in SMEs.
Activity 2: Capacity Building of Stake Holders in Cluster on Energy Efficiency
In most of the cases SME entrepreneurs are dependent on the locally available
technologies, service providers for various reasons. To address this issue BEE has also
undertaken capacity building of local service providers and entrepreneurs/ managers of
SMEs on energy efficiency improvement in their units as well as clusters. The local
service providers will be trained in order to be able to provide the local services in setting
of energy efficiency projects in the clusters.
Activity 3: Implementation of Energy Efficiency Measures
To implement the technology up gradation projects in clusters, BEE has proposed to
prepare the technology based detailed project reports (DPRs) for a minimum of five
technologies in three capacities for each technology.
Activity 4: Facilitation of Innovative Financing Mechanisms for Implementation of
Energy Efficiency Projects
The objective of this activity is to facilitate the uptake of energy efficiency measures
through innovative financing mechanisms without creating market distortion.
Divided Blast Cupola Furnace
1
1. INTRODUCTION
1.1. Brief Introduction about the Cluster
Indian foundry industry is very energy intensive. The energy input to the furnaces and
the cost of energy play an important role in determining the cost of production of
castings. Major energy consumption in medium and large scale foundry industry is the
electrical energy for induction and Arc furnaces. Furnace oil is used in rotary furnaces. In
Small foundry industry, coal is used for metal melting in Cupola furnaces. The energy
costs contribute about 25 - 30% of the manufacturing cost in Indian foundry industry.
There are approximately 450 units, engaged in Foundry Cluster (automobile parts,
agricultural implements, machine tools, diesel engine components, manhole covers,
sewing machine stands, pump-sets, decorative gates and valves) production. The major
locations wherein the units are spread are G.T. Road, Industrial area, Focal Point in
Batala. In Jalandhar Dada Colony Industrial Area, Focal point, Focal Point Extn, Udyog
Nagar, I.D.C, Kapurthala Road & Preet Nagar. In Ludhiana Focal Point Phase 5 to 8,
Janta Nagar, Bhagwan Chowk Area & Industrial area – A/B. .
Availability of Electricity in Batala – across Dhir Road, GT Road is an issue; power is
available from the grid for maximum 12/14 hours a day. There are some units in
Jalandhar and Ludhiana having induction furnace in the range of 500 kg to 1 ton
capacity whereas other units which are using local scrap as well as have high melting
temperatures are having cupola and rotary furnace and has a capacity of minimum 5 ton
per day.
The foundry produces a wide variety of castings such as manhole covers, pipe and pipe
fittings, sanitary items, tube well body, metric weights, automobile components, railway
parts, electric motor, fan body etc. 90% of the castings produced are from the SSI
sector.
1.1.1. Energy Usage Pattern
Major energy sources being used in foundry cluster are electricity and fuels such as
Coal, Furnace Oil, and Diesel. Electrical energy is being used in melting of iron in
induction furnaces, operation of electrical utilities and thermal energy is being used in
cupola furnaces operation.
1.1.2. Classification of Units
Broadly units are classified with respect to production capacity;
Large Scale Units

Divided Blast Cupola Furnace
2
Medium Scale Units
Small Scale Units
1.1.3. Production Wise Unit Breakup
Foundry cluster at Batala, Jalandhar and Ludhiana can be broken into three categories
viz. small, medium and large size unit. Table 1.2 shows that production wise breakup of
Foundry cluster.
Table 1.1 Production Wise Unit Breakups
S. No. Type of Unit Production Capacity
1 Large scale unit More than 1500 MT
2 Medium scale unit 250 to 1500 MT
3 Small scale unit Less than 250 MT
1.1.4. Products Manufactured
Foundry SME cluster at Batala, Jalandhar and Ludhiana produces a wide variety of
castings such as manhole covers, pipe and pipe fittings, sanitary items, tube well body,
metric weights, automobile components, railway parts, electric motor, fan body etc.
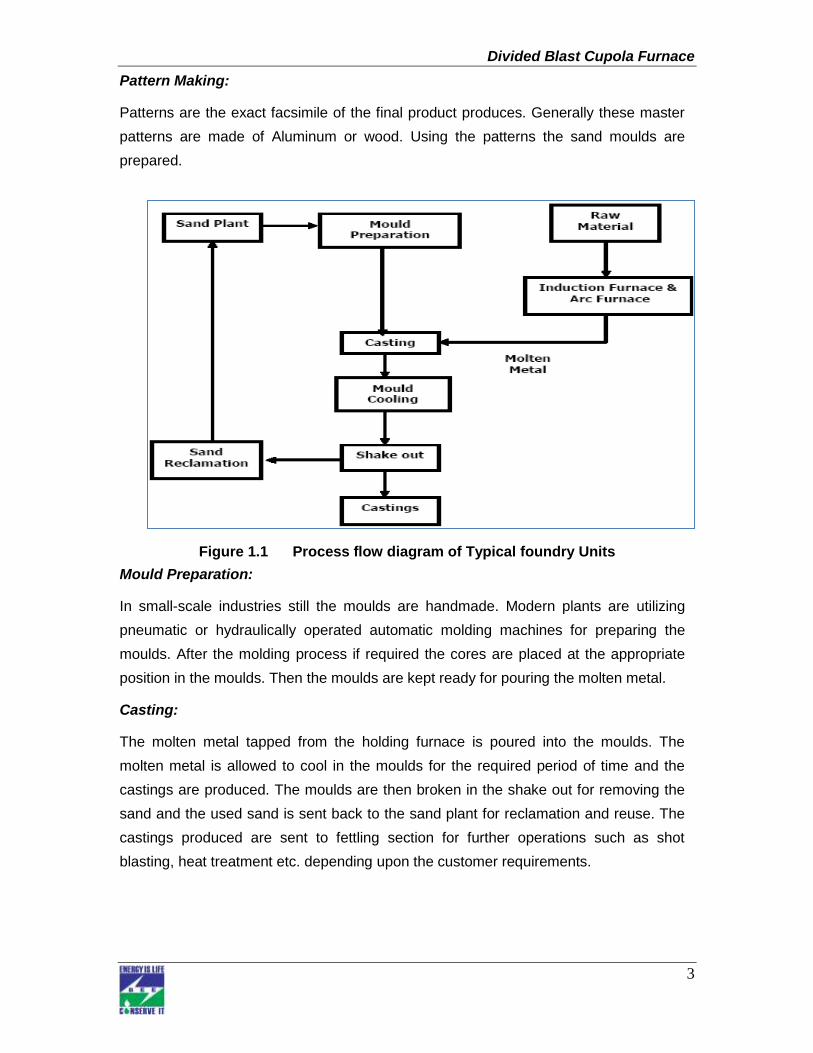
1.2. Process Flow diagram of a Foundry Cluster
The manufacturing process is described as below;
Melting Section:
The raw material is melted in melting furnace. The melting furnace can be an induction
furnace or rotary or arc furnace or cupola furnace. Molten metal from the melting
furnace is tapped in Ladles and then transferred to the holding furnaces. Typically the
holding furnaces are induction furnaces. The holding furnace is used to maintain the
required molten metal temperature and also acts as a buffer for storing molten metal
for casting process. The molten metal is tapped from the holding furnace whenever it is
required for casting process.
Sand Plant:
Green sand preparation is done in the sand plant. Return sand from the molding
section is also utilized again after the reclamation process. Sand Muller‟s are used for
green sand preparation. In the sand millers, green sand, additives and water are mixed
in appropriate proportion. Then the prepared sand is stored in bunkers for making
moulds.
Divided Blast Cupola Furnace
3
Pattern Making:
Patterns are the exact facsimile of the final product produces. Generally these master
patterns are made of Aluminum or wood. Using the patterns the sand moulds are
prepared.
Figure 1.1 Process flow diagram of Typical foundry Units
Mould Preparation:
In small-scale industries still the moulds are handmade. Modern plants are utilizing
pneumatic or hydraulically operated automatic molding machines for preparing the
moulds. After the molding process if required the cores are placed at the appropriate
position in the moulds. Then the moulds are kept ready for pouring the molten metal.
Casting:
The molten metal tapped from the holding furnace is poured into the moulds. The
molten metal is allowed to cool in the moulds for the required period of time and the
castings are produced. The moulds are then broken in the shake out for removing the
sand and the used sand is sent back to the sand plant for reclamation and reuse. The
castings produced are sent to fettling section for further operations such as shot
blasting, heat treatment etc. depending upon the customer requirements.
Divided Blast Cupola Furnace
4
1.3. Energy performance in existing situation
Major energy sources being used in foundry cluster are electricity and fuels such as
Coal, Furnace Oil, and Diesel. Electrical energy is being used in melting of iron in
induction furnaces, operation of electrical utilities and thermal energy is being used in
cupola furnaces operation.
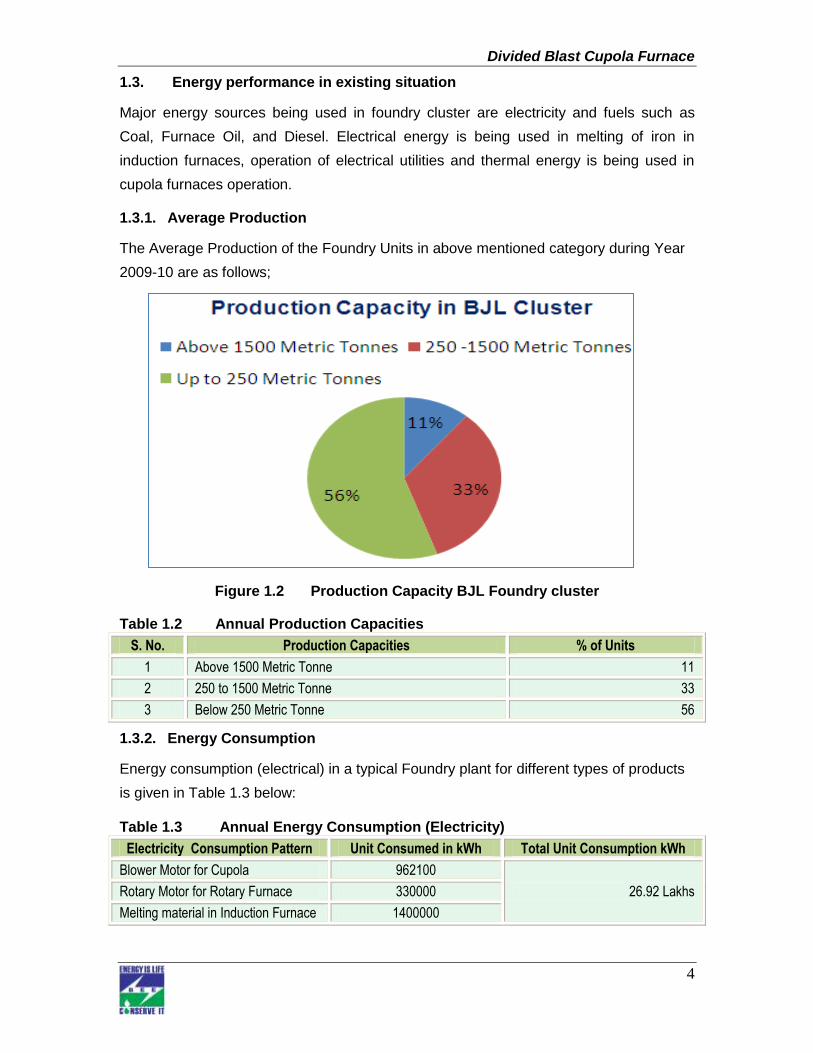
1.3.1. Average Production
The Average Production of the Foundry Units in above mentioned category during Year
2009-10 are as follows;
Figure 1.2 Production Capacity BJL Foundry cluster
Table 1.2 Annual Production Capacities
S. No. Production Capacities % of Units
1 Above 1500 Metric Tonne 11
2 250 to 1500 Metric Tonne 33
3 Below 250 Metric Tonne 56
1.3.2. Energy Consumption
Energy consumption (electrical) in a typical Foundry plant for different types of products
is given in Table 1.3 below:
Table 1.3 Annual Energy Consumption (Electricity)
Electricity Consumption Pattern Unit Consumed in kWh Total Unit Consumption kWh
Blower Motor for Cupola 962100
26.92 Lakhs Rotary Motor for Rotary Furnace 330000
Melting material in Induction Furnace 1400000

Divided Blast Cupola Furnace
5
Table 1.4 Annual Energy Consumption (Coal & Furnace Oil)
Thermal Energy Consumption Pattern Consumption per Year
Coal for Cupola 5000 Metric Tonnes
Furnace Oil for Rotary Furnace 17.8 Lakhs Litter
1.3.3. Specific Energy Consumption
Specific energy consumption of Foundry units depends upon the production capacity &
their corresponding power consumption. Specific energy consumption also depends on
type of furnace. A brief summary of specific energy consumption depending upon type of
furnace is shown in below table;
Table 1.5 Specific Energy Consumption
S. No Types of Furnace Types of Fuel Specific Fuel Consumption /
One kg Molten Material Cost of Fuel
in `
1 Cupola Coal 0.2 kg 3.0
2 Rotary Furnace Furnace Oil 0.15 Lt 4.20
3 Arc / Induction Furnace Electricity 0.72 kWh 3.6
*Assuming Coal rate ` 15.0 /kg
*Assuming F.O rate ` 28.0 /Lt.
*Assuming electricity rate ` 5.0/kWh
1.4. Proposed Technology/Equipment
1.4.1. Description about the existing technology
During energy audit in the foundry units at Batala, Jalandhar and Ludhiana region, it
was found that maximum units are using Blast Copula for melting. Usually the units in
the cluster process one batch per day in 8 to 10 hours shift and 250 days across the
year. The installed furnace is utilized for melting the material (Cast Iron) of about an
average of 2.14 tonne per batch at temperature of 1300 to 1500oC in about 5 to 7
hours per batch. Cupola is the most common type of melting furnace used for the
production of grey iron castings in all foundries. Some of the contributing factors that
were identified for this poor energy performance are listed below.
Incorrect blast rate
Lower blast air pressure
Incorrect distribution of air between the top and lower tuyeres
Turbulent (non-linear) entry of air into the cupola
Incorrect sizing of cupola parameters such as tuyere area, well depth,
and stack height among others
Divided Blast Cupola Furnace
6
Poor operating and maintenance practices
Poor control of feed materials (shape, size, weight, sequence)
1.5. Establishing the Baseline for the Proposed Technology
Presently all the Foundry units in Batala, Jalandhar and Ludhiana are operating with
conventional cupola furnace. The existing energy consumption profile of the Cupola
furnace is tabulated below:
Table 1.6 Baseline Consumption
S. No. Parameters Units Existing System
1. Raw Material Tonne / batch 2.14
2. Coal Consumption Kg/batch 500
3. Raw Material rejection Kg/batch 140
4. Cost per batch `/ batch 7500
5. Output per batch Tonne / batch 2.0
6. Annual Production Tonne/ year 500
7. Annual Production Cost `( in lakh)/ year 18.75
1.6. Barriers in adoption of proposed technology
1.6.1. Technological Barrier
Lack of awareness and information of the loss in terms of coal consumption of
conventional cupola and a divided blast cupola furnace
Due to lack of technical knowledge and expertise, conventional cupola furnaces
are used in the Foundry units.
In this cluster, like many others, there is lack of leadership to take up the energy
efficiency projects in the plant.
1.6.2. Financial Barrier
Availing finance is not the major issue. Among the SMEs, the larger units, if
convinced they are capable of either financing it themselves or get the finance from
their banks. The smaller units will require competitive loan and other support to raise
the loan. However as most of them have been able to expand their setup and grow,
there is readiness to spend for energy efficiency technologies which have good
returns. Energy Efficiency Financing Schemes such as SIDBI‟s, if focused on the
cluster, will play a catalytic role in implementation of identified energy conservation
projects & technologies.

Divided Blast Cupola Furnace
7
1.6.3. Skilled Manpower
In Foundry cluster at Batala, Jalandhar and Ludhiana, the availability of skilled
manpower is one of the limitations; this issue gets further aggravated due to more
number of Foundry units as compared to the availability of skilled manpower. For
major equipments of Foundry units like Cupola furnace for maintenance or the repair
works of these equipments take care by the equipment suppliers itself.

Divided Blast Cupola Furnace
8
2. PROPOSED TECHNOLOGY
2.1. Detailed Description of Technology
2.1.1. Description of Technology
Divided blast cupola (DBC) or twin blast cupola is a proven technology for improving the
energy performance at a modest investment. As, is evident from its name, a DBC
supplies blast air to the cupola furnace at two levels through a double row of tuyeres.
Poorly designed cupolas lead to high consumption of coke, thus increasing input costs of
melting. Most Indian foundries use conventional cupolas - cupolas having a single row of
tuyeres. Further, several designs versions of cupola, which split or divide the blast air to
the furnace are also in use. Dividing the blast air has benefits in terms of energy savings.
However, to realize the full benefits of energy efficiency, optimal design of the divided
blast system is crucial.
In order to popularize the correct design of DBC among Indian foundries, TERI has set-
up a demonstration Divided Blast Cupola (DBC), at a foundry unit in Howrah, in the year
1988. The Indian Foundry Association nominated the demonstration unit. The design of
the DBC was provided by BCIRA foundry experts. The DBC is equipped with skip-bucket
charger and a high-efficiency pollution control system. The coke consumption in the DBC
was reduced by 35% in comparison to the sub-optimal designed DBC being operated by
the foundry unit earlier. Subsequently, TERI has been providing design of DBC and
commissioning assistance to several foundry units in different foundry clusters in India.
Features of the DBC Technology:
Divided blast cupola (DBC) is a well-proven technology for improving the energy
performance at a modest investment. As is evident from its name, a DBC supplied blast
air to the cupola furnace at two levels metal tapping temperature.
Initially Blast Furnace operation, Warm /Hot Blast Cupola and Oxygen Enriched Cupola
were developed which were not much successful, particularly in small and medium size
units. In Divided Blast Cupola, air is supplied through two sets of blast pipe, tuyeres and
wind box. The pressure and volume of each air supply can be separately controlled.
The advantages of a DBC, compared to a conventional cupola, are as follows.
A higher metal tapping temperature and higher carbon pick-up are obtained for a
given charge- coke consumption.
Charge-coke consumption is reduced as high as 30% and the melting rate is
increased, while maintaining the same metal tapping temperature.
Divided Blast Cupola Furnace
9
Following advantages can be achieved with DBC;
Optimum well capacity
Higher stack height
Mechanical charging system
Stringent material specifications
Optimum blower specifications (quantity and pressure)
Optimum ratio of the air delivered to the top and bottom tuyeres
Minimum pressure drop and turbulence of the combustion air
Separate wind-belts for top and bottom tuyeres
Correct tuyere area, number of tuyeres, and distance between the two rows of
tuyeres
Advantages of DBC
Divided blast cupola (DBC) is a well-proven technology for improving the energy
performance at a modest investment. As is evident from its name, DBC supplies blast
air to the cupola furnace at two levels through a double row of tuyeres. The blast air is
almost equally divided between the top and bottom row of tuyeres, and the spacing
between the tuyeres is about one meter apart, irrespective of the diameter of the cupola.
Some comparative advantages of a DBC, as found in studies conducted by BCIRA, are
given below:
A higher metal tapping temperature (approximately 45-500C more) and higher
carbon pick-up (approximately 0.06%) are obtained for a given charge-coke
consumption
Charge-coke consumption is reduced by 20-32% and the melting rate is
increased by 11-23%, while maintaining the same metal tapping temperature.
However, in the initial survey conducted at Agra and Howrah foundry clusters, it was
found that conventional cupolas are commonly used by Indian foundry units and DBCs,
where ever adopted, are of sub-optimal designs. Hence the intervention aims to
demonstrate and disseminate the benefits of a well -designed DBC among Indian
foundries.
2.1.2. Technology Specification
For implementation of the proposed project, conventional cupola furnace should be
replaced with divided blast cupola furnace. The DBC was developed & designed by
Divided Blast Cupola Furnace
10
TERI (The Energy & Resource Institute). And the successful implementation of DBC has
been done by TERI at many places like Rajkot, Kolkata etc. Fabrication design drawings
of the DBC are provided by TERI & its authorized vendors.
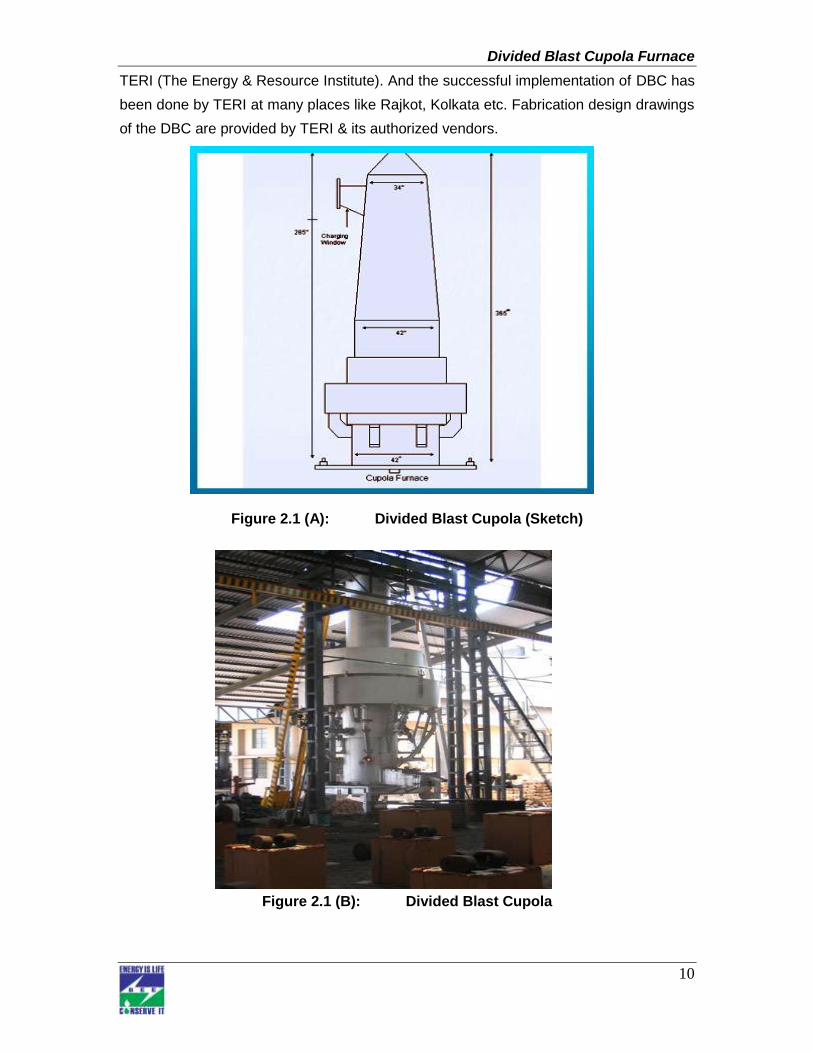
Figure 2.1 (A): Divided Blast Cupola (Sketch)
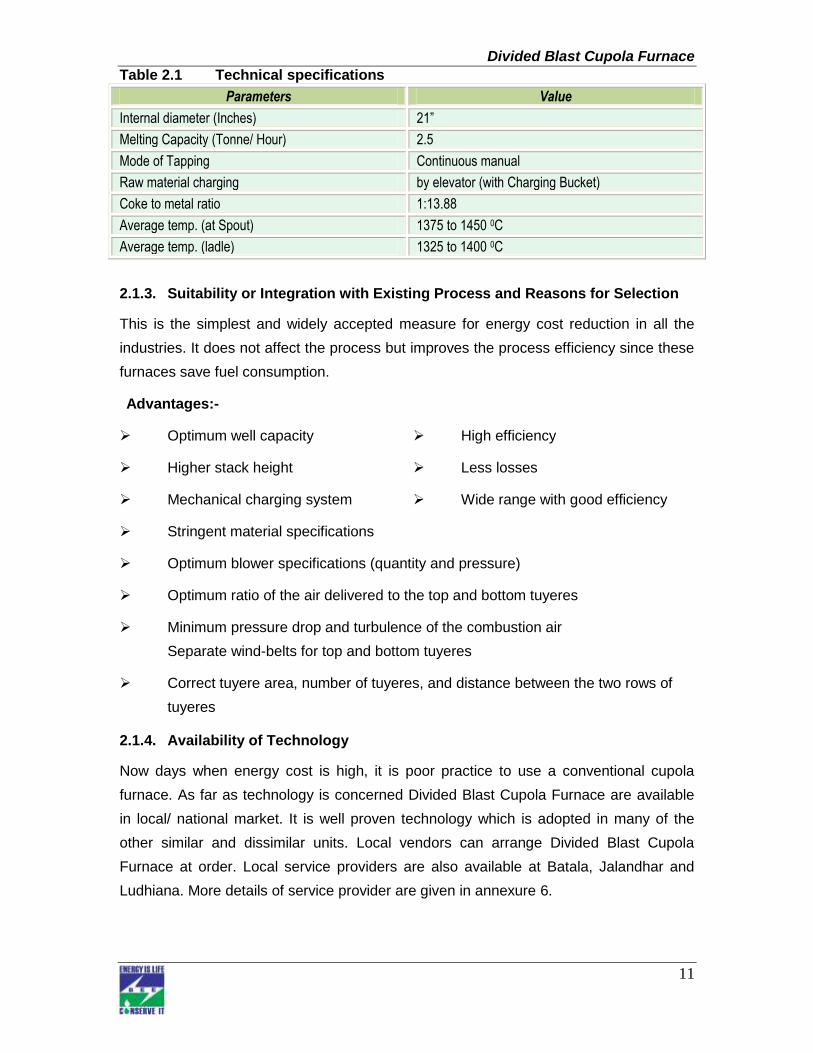
Figure 2.1 (B): Divided Blast Cupola
Divided Blast Cupola Furnace
11
Table 2.1 Technical specifications
Parameters Value
Internal diameter (Inches) 21”
Melting Capacity (Tonne/ Hour) 2.5
Mode of Tapping Continuous manual
Raw material charging by elevator (with Charging Bucket)
Coke to metal ratio 1:13.88
Average temp. (at Spout) 1375 to 1450 0C
Average temp. (ladle) 1325 to 1400 0C
2.1.3. Suitability or Integration with Existing Process and Reasons for Selection
This is the simplest and widely accepted measure for energy cost reduction in all the
industries. It does not affect the process but improves the process efficiency since these
furnaces save fuel consumption.
Advantages:-
Optimum well capacity
Higher stack height
Mechanical charging system
Stringent material specifications
High efficiency
Less losses
Wide range with good efficiency
Optimum blower specifications (quantity and pressure)
Optimum ratio of the air delivered to the top and bottom tuyeres
Minimum pressure drop and turbulence of the combustion air
Separate wind-belts for top and bottom tuyeres
Correct tuyere area, number of tuyeres, and distance between the two rows of
tuyeres
2.1.4. Availability of Technology
Now days when energy cost is high, it is poor practice to use a conventional cupola
furnace. As far as technology is concerned Divided Blast Cupola Furnace are available
in local/ national market. It is well proven technology which is adopted in many of the
other similar and dissimilar units. Local vendors can arrange Divided Blast Cupola
Furnace at order. Local service providers are also available at Batala, Jalandhar and
Ludhiana. More details of service provider are given in annexure 6.
Divided Blast Cupola Furnace
9
2.1.5. Source of Technology
The DBC was developed & designed by TERI (The Energy & Resource Institute). And
the successful implementation of DBC has been done by TERI at many places like
Rajkot, Kolkata etc. Fabrication design drawings of the DBC are provided by TERI & its
authorized vendors.
2.1.6. Terms and Conditions after Sale
Warranty period of one year will be provided from the date of invoice against any
manufacturing defects. Details are provided in Annexure 7.
2.1.7. Process down Time during Implementation
Technology provider will bring the complete setup for the proposed project from their site
and make all the arrangements for implementation at the client‟s site. And the process
will be effected for a period of 2 to 3 weeks, when all the required is at the client‟s site.
2.2. Life Cycle Assessment
Life of the proposed divided blast cupola furnace will be around 10 to 15 years which
depends on the operating conditions and maintenance at client‟s side.
2.3. Suitable Unit for Implementation of the Identified Technology
For estimation of the saving potential on implementation of this project, here the Foundry
units engaged in making castings, having conventional cupola furnace can be
considered.
Divided Blast Cupola Furnace
10
3. ECONOMIC BENEFITS FROM PROPOSED TECHNOLOGY
3.1. Technical Benefits
3.1.1. Electricity savings per year
Project of Installation of Divided Blast Cupola Furnace in place of conventional Cupola
Furnace will not result in savings of electricity consumption but will lead to reduction in
the fuel consumption. Total coal saving would be 25 tonne per year.
3.1.2. Improvement in product quality
This project is not contributing to any improvement in product quality.
3.1.3. Improvement in production
This project is not contributing for increasing in production in Foundry units. But it
reduces the fuel consumption by 25 tonne of coal per year for producing the same
casting.
3.1.4. Reduction in raw material consumption
Raw material consumption will reduce by 10 tonne per year after the implementation of
the proposed project.
3.1.5. Reduction in other losses
This project does not contribute to any reduction in any loss.
3.2. Monetary Benefits
Annual monetary savings with installation of Divided Blast Cupola Furnace will be `3.95
Lakhs per year with reduction in coal consumption by 25 tonne per year.
Table 3.1 Monetary savings
S. No. Parameters Units Existing System Proposed System
1. Raw Material Tonne / batch 2.14 2.10
2. Coal Consumption (` 15/Kg) Kg/batch 500 400
3. Raw Material rejection Kg/batch 140 100
4. Energy Cost Savings on rejected Raw Material (@ `2/kg)
`/ Batch -- 80
5. Cost per batch `/ batch 7500 5920
6. Total batch per year Batch/year 250 250
7. Annual Production Cost `( in lakh)/ year 18.75 14.80
8. Annual Production Tonne/ year 500
9 Monetary savings `( in lakh)/ year 3.95
Divided Blast Cupola Furnace
11
3.3. Social Benefits
3.3.1. Improvement in Working Environment in the Plant
The proposed system will burn the fuel efficiently, so less fuel would be required every
batch thus working environment in the plant will be cleaner when compared to the
existing system.
3.3.2. Improvement in Skill Set of Workers
The technical skills of workers will definitely improve. Training on the regular
maintenance will help in improving the technical understanding of the workers.
3.4. Environmental Benefits
The major GHG reduction would be in CO2 reduction. Emission reductions are estimated
around 25 tons of CO2 per annum.
(Tonnes of CO2/yr = 2.1 x Tons of fuel savings/yr – source: www.epa.gov)
Divided Blast Cupola Furnace
12
4. INSTALLATION OF THE PROPOSED TECHNOLOGY
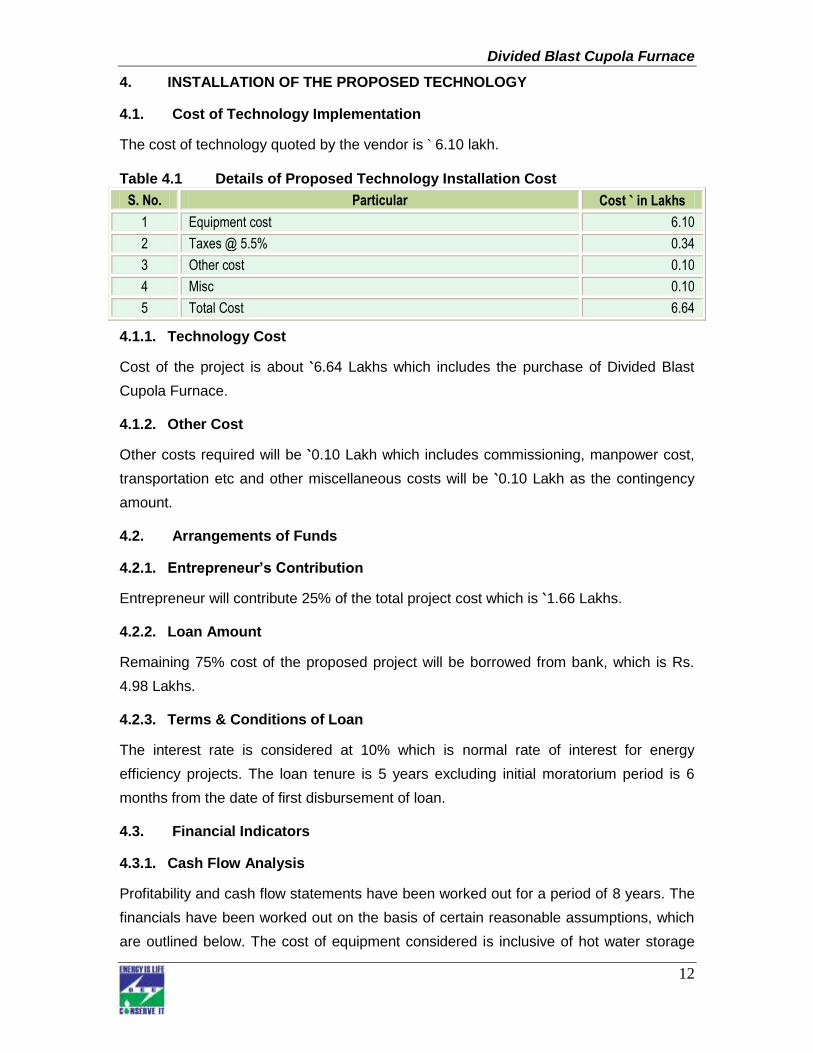
4.1. Cost of Technology Implementation
The cost of technology quoted by the vendor is ` 6.10 lakh.
Table 4.1 Details of Proposed Technology Installation Cost
S. No. Particular Cost ` in Lakhs
1 Equipment cost 6.10
2 Taxes @ 5.5% 0.34
3 Other cost 0.10
4 Misc 0.10
5 Total Cost 6.64
4.1.1. Technology Cost
Cost of the project is about `6.64 Lakhs which includes the purchase of Divided Blast
Cupola Furnace.
4.1.2. Other Cost
Other costs required will be `0.10 Lakh which includes commissioning, manpower cost,
transportation etc and other miscellaneous costs will be `0.10 Lakh as the contingency
amount.
4.2. Arrangements of Funds
4.2.1. Entrepreneur’s Contribution
Entrepreneur will contribute 25% of the total project cost which is `1.66 Lakhs.
4.2.2. Loan Amount
Remaining 75% cost of the proposed project will be borrowed from bank, which is Rs.
4.98 Lakhs.
4.2.3. Terms & Conditions of Loan
The interest rate is considered at 10% which is normal rate of interest for energy
efficiency projects. The loan tenure is 5 years excluding initial moratorium period is 6
months from the date of first disbursement of loan.
4.3. Financial Indicators
4.3.1. Cash Flow Analysis
Profitability and cash flow statements have been worked out for a period of 8 years. The
financials have been worked out on the basis of certain reasonable assumptions, which
are outlined below. The cost of equipment considered is inclusive of hot water storage
Divided Blast Cupola Furnace
13
tanks also.
The Operation and Maintenance cost is estimated at 4 % of cost of total project
with 5 % increase in every year as escalations.
Interest on term loan is estimated at 10 %.
Depreciation is provided as per the rates provided in the companies Act.
Based on the above assumptions, profitability and cash flow statements have been
prepared and calculated in Annexure-3.
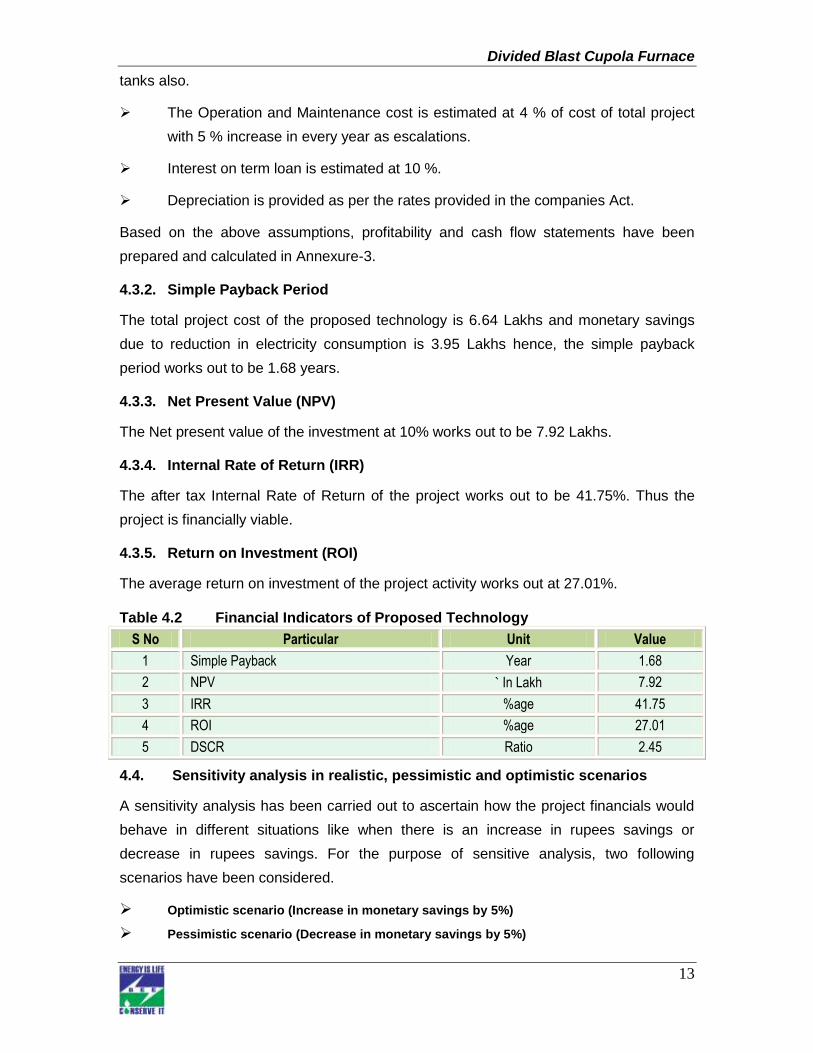
4.3.2. Simple Payback Period
The total project cost of the proposed technology is 6.64 Lakhs and monetary savings
due to reduction in electricity consumption is 3.95 Lakhs hence, the simple payback
period works out to be 1.68 years.
4.3.3. Net Present Value (NPV)
The Net present value of the investment at 10% works out to be 7.92 Lakhs.
4.3.4. Internal Rate of Return (IRR)
The after tax Internal Rate of Return of the project works out to be 41.75%. Thus the
project is financially viable.
4.3.5. Return on Investment (ROI)
The average return on investment of the project activity works out at 27.01%.
Table 4.2 Financial Indicators of Proposed Technology
S No Particular Unit Value
1 Simple Payback Year 1.68
2 NPV ` In Lakh 7.92
3 IRR %age 41.75
4 ROI %age 27.01
5 DSCR Ratio 2.45
4.4. Sensitivity analysis in realistic, pessimistic and optimistic scenarios
A sensitivity analysis has been carried out to ascertain how the project financials would
behave in different situations like when there is an increase in rupees savings or
decrease in rupees savings. For the purpose of sensitive analysis, two following
scenarios have been considered.
Optimistic scenario (Increase in monetary savings by 5%)
Pessimistic scenario (Decrease in monetary savings by 5%)

Divided Blast Cupola Furnace
14
In each scenario, other inputs are assumed as a constant. The financial indicators in
each of the above situation are indicated along with standard indicators.
Table 4.3 Sensitivity Analysis in Different Scenarios
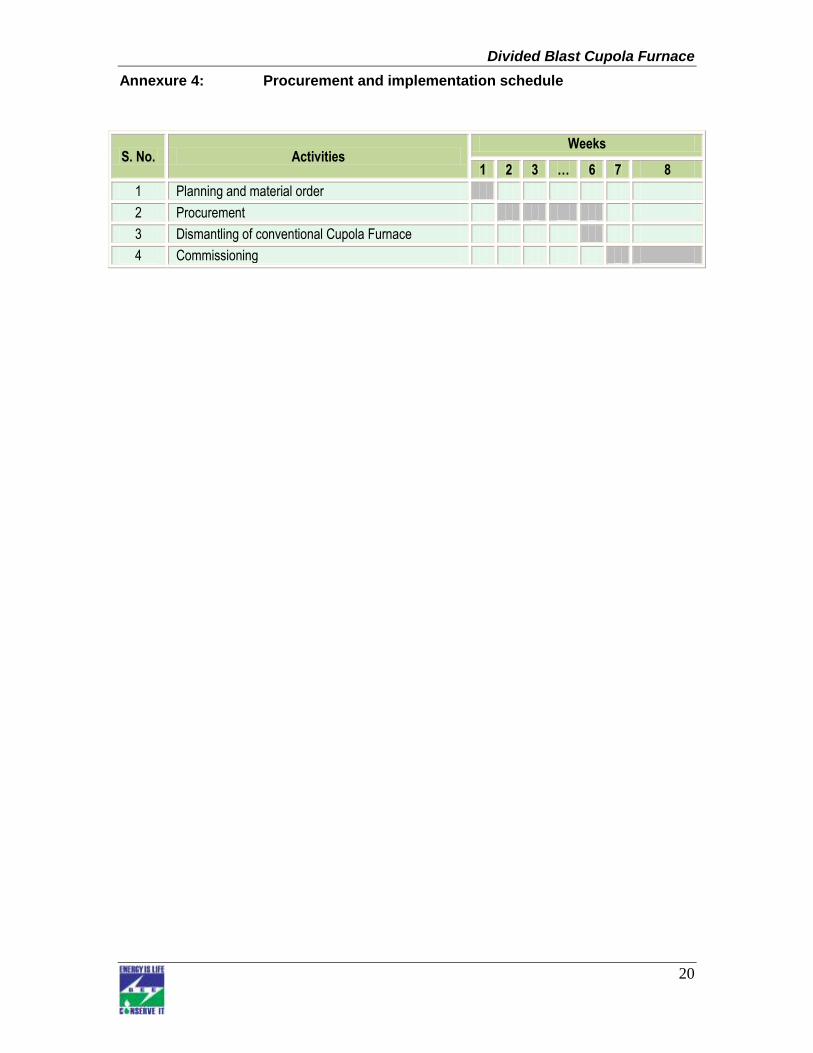
4.5. Procurement and Implementation Schedule
Procurement and implementation schedule required for implementation of this
technology is about 8 weeks and 2 to 3 weeks required as a process break
down. Details of procurement and implementation schedules are shown in Table 4.4
below
Table 4.4 Procurement and Implementation Schedule
S. No. Activities Weeks
1 2 3 … 6 7 8
1 Planning and material order
2 Procurement
3 Dismantling of conventional Cupola Furnace
4 Commissioning
Scenario Monetary Benefit( `Lakh/year) IRR (%) NPV(in Lakh) ROI (%) DSCR
Pessimistic 3.75 38.93 7.16 26.81 2.32
Base 3.95 41.75 7.92 27.01 2.45
Optimistic 4.15 44.56 8.68 27.18 2.58
Divided Blast Cupola Furnace
15
ANNEXURES
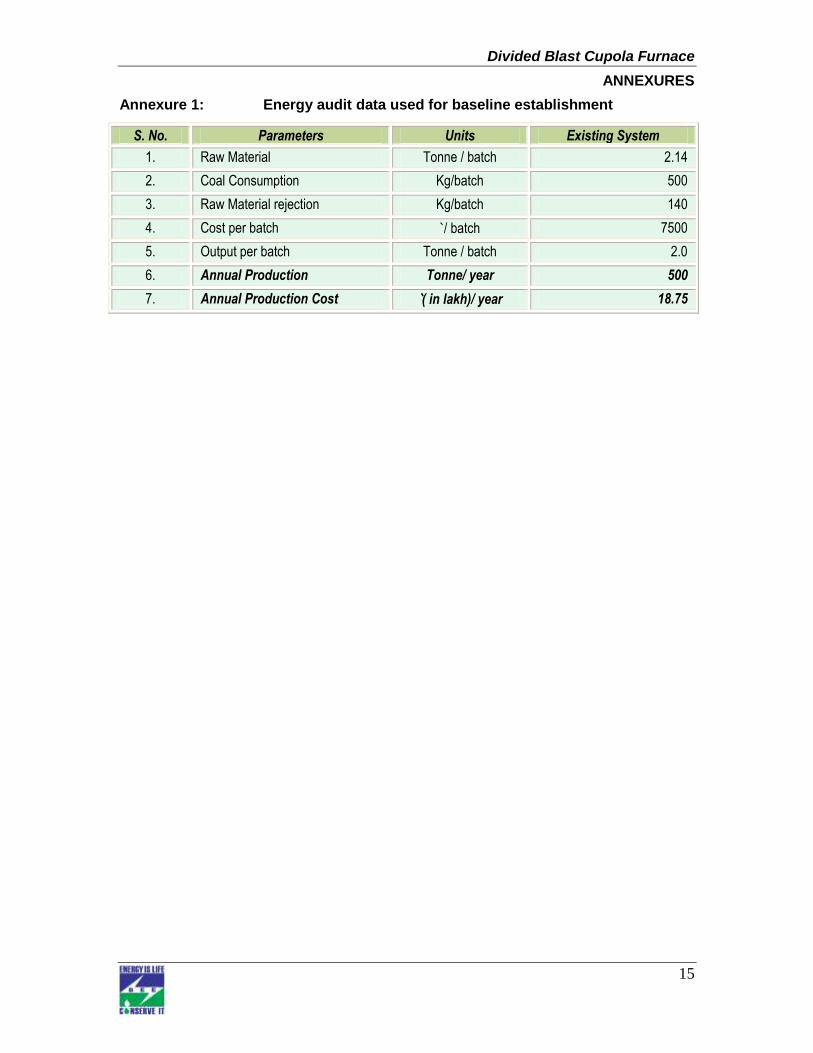
Annexure 1: Energy audit data used for baseline establishment
S. No. Parameters Units Existing System
1. Raw Material Tonne / batch 2.14
2. Coal Consumption Kg/batch 500
3. Raw Material rejection Kg/batch 140
4. Cost per batch `/ batch 7500
5. Output per batch Tonne / batch 2.0
6. Annual Production Tonne/ year 500
7. Annual Production Cost `( in lakh)/ year 18.75
Divided Blast Cupola Furnace
16
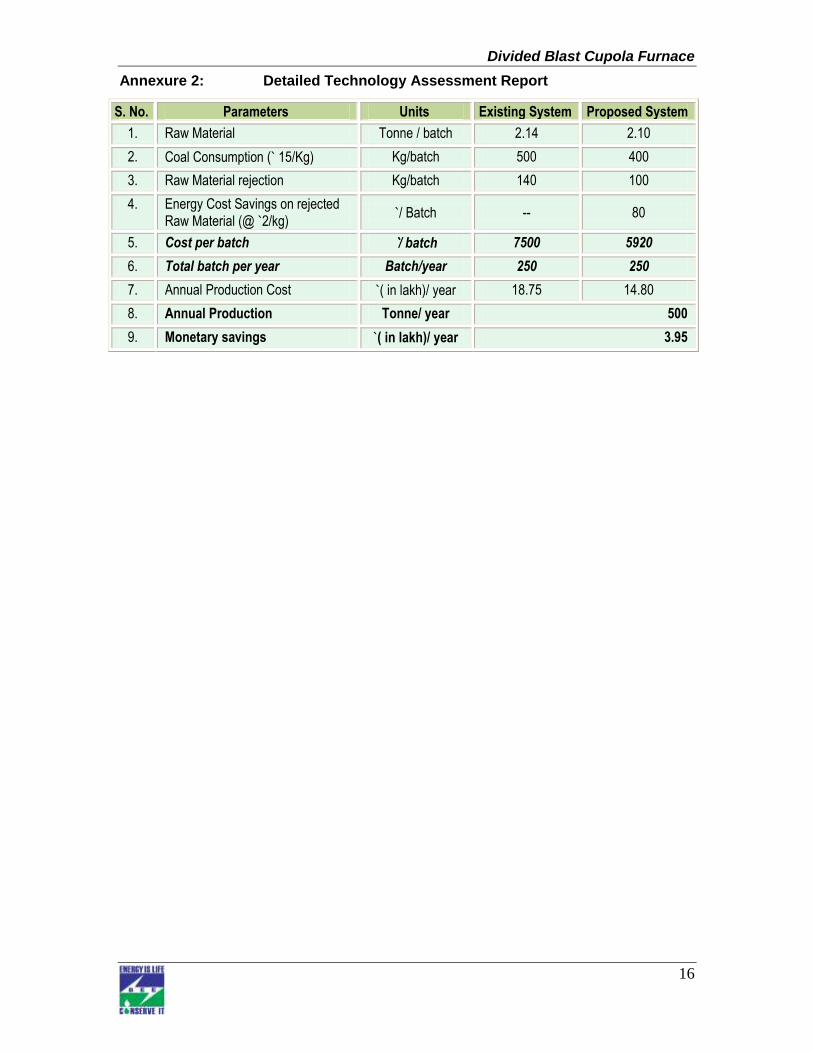
Annexure 2: Detailed Technology Assessment Report
S. No. Parameters Units Existing System Proposed System
1. Raw Material Tonne / batch 2.14 2.10
2. Coal Consumption (` 15/Kg) Kg/batch 500 400
3. Raw Material rejection Kg/batch 140 100
4. Energy Cost Savings on rejected Raw Material (@ `2/kg)
`/ Batch -- 80
5. Cost per batch `/ batch 7500 5920
6. Total batch per year Batch/year 250 250
7. Annual Production Cost `( in lakh)/ year 18.75 14.80
8. Annual Production Tonne/ year 500
9. Monetary savings `( in lakh)/ year 3.95
Divided Blast Cupola Furnace
17
Annexure 3: Detailed Financial Calculations
Name of the Technology Divided Blast Ventilator Rated Capacity 2 TPB
Details Unit Value Basis
Installed Capacity TPB 2
No. of Operating Days Days 250
No. of Shifts/ Hours No. / Hours 1 / 8 Proposed Investment
Plant & Machinery ` (in lakh) 6.44
Civil Work ` (in lakh) 0.00
Erection & Commissioning ` (in lakh) 0.10
Misc. Cost ` (in lakh) 0.10
Total Investment ` (in lakh) 6.64 Financing pattern
Own Funds (Equity) ` (in lakh) 1.66 Feasibility Study Loan Funds (Term Loan) ` (in lakh) 4.98 Feasibility Study Loan Tenure Years 5.00 Assumed Moratorium Period Months 6.00 Assumed Repayment Period Months 66.00 Assumed Interest Rate %age 10.00%
Estimation of Costs O & M Costs % on Plant & Equip 4.00 Feasibility Study Annual Escalation %age 5.00 Feasibility Study Estimation of Revenue
Coal Savings Tonne/Year 25
Cost of Coal `/Tonne 15000
Energy Cost Savings on Rejected Raw Material `/Batch 80
No. of batches Batches/ year 250 St. line Depn. %age 5.28 Indian Companies Act IT Depreciation %age 80.00 Income Tax Rules Income Tax %age 33.99 Income Tax Estimation of Interest on Term Loan ` (in lakh)
Years Opening Balance Repayment Closing Balance Interest
1 4.98 0.25 4.73 0.58
2 4.73 0.75 3.98 0.44
3 3.98 1.00 2.99 0.35
4 2.99 1.24 1.74 0.24
5 1.74 1.24 0.50 0.12 6 0.50 0.50 0.00 0.01
4.98 WDV Depreciation ` (in lakh)
Particulars / years 1 2
Plant and Machinery
Cost 6.64 1.33 Depreciation 5.31 1.06 WDV 1.33 0.27
Divided Blast Cupola Furnace
18
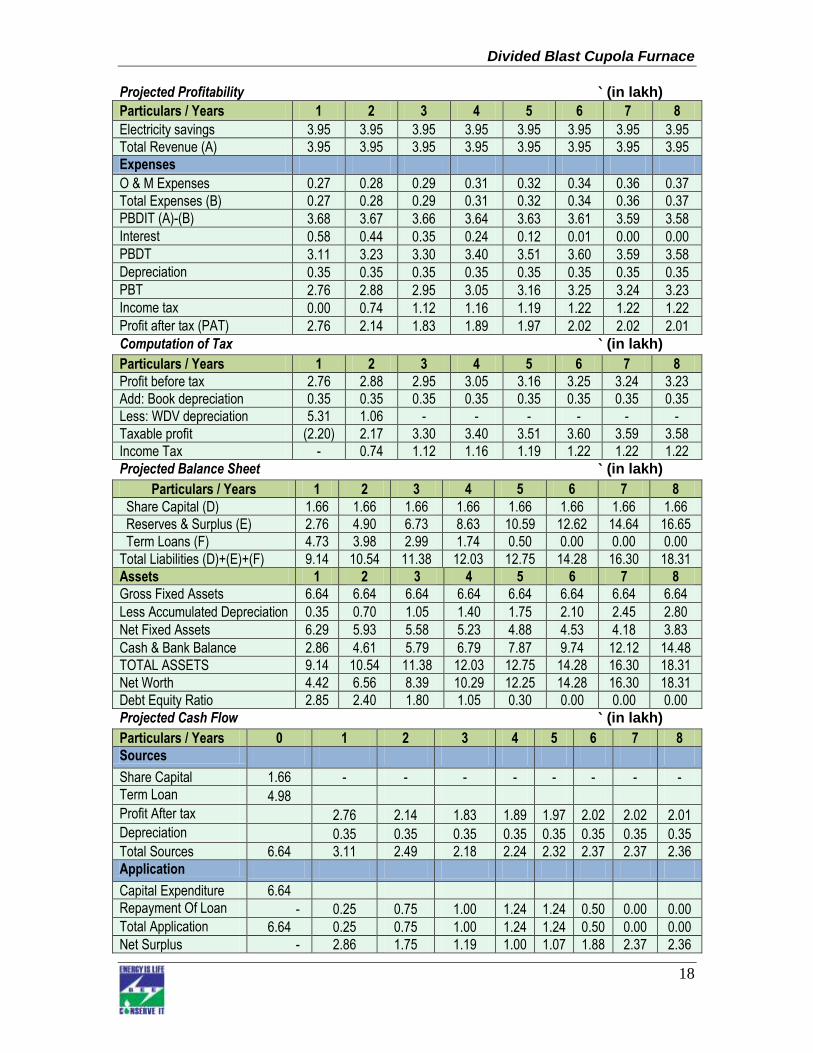
Projected Profitability ` (in lakh)
Particulars / Years 1 2 3 4 5 6 7 8 Electricity savings 3.95 3.95 3.95 3.95 3.95 3.95 3.95 3.95 Total Revenue (A) 3.95 3.95 3.95 3.95 3.95 3.95 3.95 3.95 Expenses O & M Expenses 0.27 0.28 0.29 0.31 0.32 0.34 0.36 0.37 Total Expenses (B) 0.27 0.28 0.29 0.31 0.32 0.34 0.36 0.37 PBDIT (A)-(B) 3.68 3.67 3.66 3.64 3.63 3.61 3.59 3.58 Interest 0.58 0.44 0.35 0.24 0.12 0.01 0.00 0.00 PBDT 3.11 3.23 3.30 3.40 3.51 3.60 3.59 3.58 Depreciation 0.35 0.35 0.35 0.35 0.35 0.35 0.35 0.35 PBT 2.76 2.88 2.95 3.05 3.16 3.25 3.24 3.23 Income tax 0.00 0.74 1.12 1.16 1.19 1.22 1.22 1.22 Profit after tax (PAT) 2.76 2.14 1.83 1.89 1.97 2.02 2.02 2.01 Computation of Tax ` (in lakh)
Particulars / Years 1 2 3 4 5 6 7 8 Profit before tax 2.76 2.88 2.95 3.05 3.16 3.25 3.24 3.23 Add: Book depreciation 0.35 0.35 0.35 0.35 0.35 0.35 0.35 0.35 Less: WDV depreciation 5.31 1.06 - - - - - - Taxable profit (2.20) 2.17 3.30 3.40 3.51 3.60 3.59 3.58 Income Tax - 0.74 1.12 1.16 1.19 1.22 1.22 1.22 Projected Balance Sheet ` (in lakh)
Particulars / Years 1 2 3 4 5 6 7 8 Share Capital (D) 1.66 1.66 1.66 1.66 1.66 1.66 1.66 1.66 Reserves & Surplus (E) 2.76 4.90 6.73 8.63 10.59 12.62 14.64 16.65 Term Loans (F) 4.73 3.98 2.99 1.74 0.50 0.00 0.00 0.00 Total Liabilities (D)+(E)+(F) 9.14 10.54 11.38 12.03 12.75 14.28 16.30 18.31 Assets 1 2 3 4 5 6 7 8 Gross Fixed Assets 6.64 6.64 6.64 6.64 6.64 6.64 6.64 6.64 Less Accumulated Depreciation 0.35 0.70 1.05 1.40 1.75 2.10 2.45 2.80 Net Fixed Assets 6.29 5.93 5.58 5.23 4.88 4.53 4.18 3.83 Cash & Bank Balance 2.86 4.61 5.79 6.79 7.87 9.74 12.12 14.48 TOTAL ASSETS 9.14 10.54 11.38 12.03 12.75 14.28 16.30 18.31 Net Worth 4.42 6.56 8.39 10.29 12.25 14.28 16.30 18.31 Debt Equity Ratio 2.85 2.40 1.80 1.05 0.30 0.00 0.00 0.00 Projected Cash Flow ` (in lakh)
Particulars / Years 0 1 2 3 4 5 6 7 8 Sources
Share Capital 1.66 - - - - - - - - Term Loan 4.98 Profit After tax 2.76 2.14 1.83 1.89 1.97 2.02 2.02 2.01 Depreciation 0.35 0.35 0.35 0.35 0.35 0.35 0.35 0.35 Total Sources 6.64 3.11 2.49 2.18 2.24 2.32 2.37 2.37 2.36 Application
Capital Expenditure 6.64 Repayment Of Loan - 0.25 0.75 1.00 1.24 1.24 0.50 0.00 0.00 Total Application 6.64 0.25 0.75 1.00 1.24 1.24 0.50 0.00 0.00 Net Surplus - 2.86 1.75 1.19 1.00 1.07 1.88 2.37 2.36
Divided Blast Cupola Furnace
19
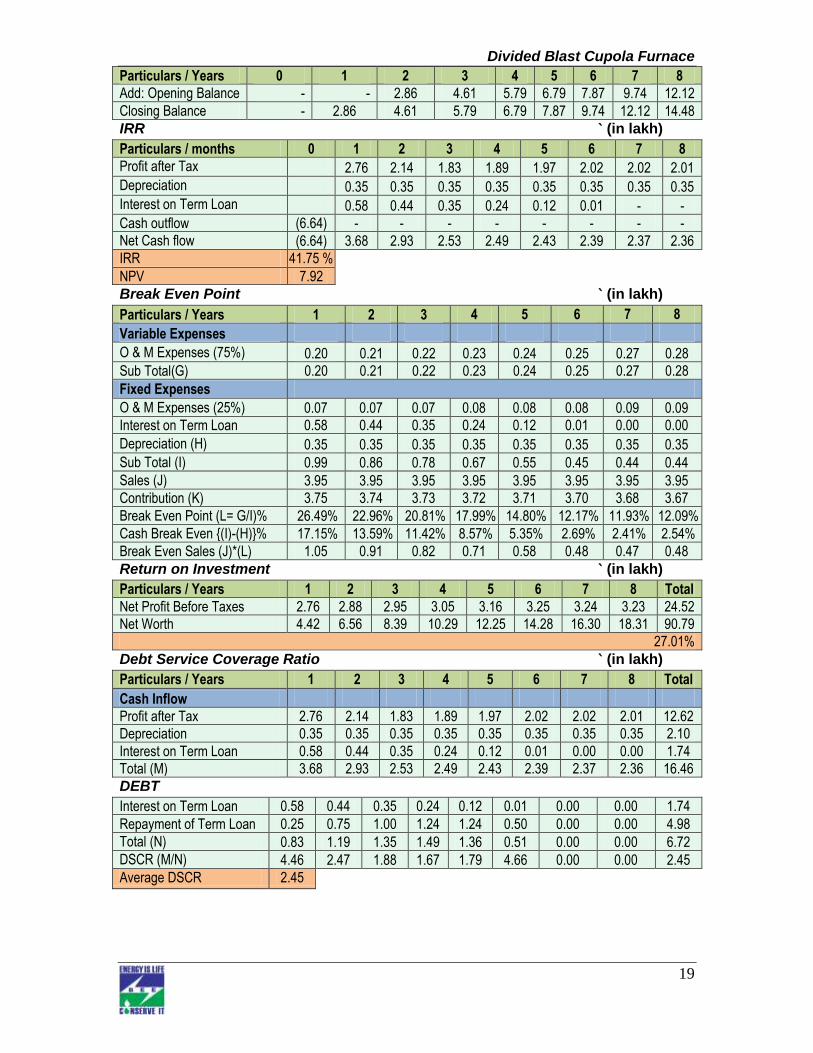
Particulars / Years 0 1 2 3 4 5 6 7 8 Add: Opening Balance - - 2.86 4.61 5.79 6.79 7.87 9.74 12.12 Closing Balance - 2.86 4.61 5.79 6.79 7.87 9.74 12.12 14.48 IRR ` (in lakh)
Particulars / months 0 1 2 3 4 5 6 7 8 Profit after Tax 2.76 2.14 1.83 1.89 1.97 2.02 2.02 2.01 Depreciation 0.35 0.35 0.35 0.35 0.35 0.35 0.35 0.35 Interest on Term Loan 0.58 0.44 0.35 0.24 0.12 0.01 - - Cash outflow (6.64) - - - - - - - - Net Cash flow (6.64) 3.68 2.93 2.53 2.49 2.43 2.39 2.37 2.36 IRR 41.75 % NPV 7.92 Break Even Point ` (in lakh)
Particulars / Years 1 2 3 4 5 6 7 8
Variable Expenses
O & M Expenses (75%) 0.20 0.21 0.22 0.23 0.24 0.25 0.27 0.28 Sub Total(G) 0.20 0.21 0.22 0.23 0.24 0.25 0.27 0.28 Fixed Expenses O & M Expenses (25%) 0.07 0.07 0.07 0.08 0.08 0.08 0.09 0.09 Interest on Term Loan 0.58 0.44 0.35 0.24 0.12 0.01 0.00 0.00 Depreciation (H) 0.35 0.35 0.35 0.35 0.35 0.35 0.35 0.35 Sub Total (I) 0.99 0.86 0.78 0.67 0.55 0.45 0.44 0.44 Sales (J) 3.95 3.95 3.95 3.95 3.95 3.95 3.95 3.95 Contribution (K) 3.75 3.74 3.73 3.72 3.71 3.70 3.68 3.67 Break Even Point (L= G/I)% 26.49% 22.96% 20.81% 17.99% 14.80% 12.17% 11.93% 12.09% Cash Break Even {(I)-(H)}% 17.15% 13.59% 11.42% 8.57% 5.35% 2.69% 2.41% 2.54% Break Even Sales (J)*(L) 1.05 0.91 0.82 0.71 0.58 0.48 0.47 0.48 Return on Investment ` (in lakh)
Particulars / Years 1 2 3 4 5 6 7 8 Total Net Profit Before Taxes 2.76 2.88 2.95 3.05 3.16 3.25 3.24 3.23 24.52 Net Worth 4.42 6.56 8.39 10.29 12.25 14.28 16.30 18.31 90.79
27.01% Debt Service Coverage Ratio ` (in lakh)
Particulars / Years 1 2 3 4 5 6 7 8 Total
Cash Inflow Profit after Tax 2.76 2.14 1.83 1.89 1.97 2.02 2.02 2.01 12.62 Depreciation 0.35 0.35 0.35 0.35 0.35 0.35 0.35 0.35 2.10 Interest on Term Loan 0.58 0.44 0.35 0.24 0.12 0.01 0.00 0.00 1.74 Total (M) 3.68 2.93 2.53 2.49 2.43 2.39 2.37 2.36 16.46 DEBT
Interest on Term Loan 0.58 0.44 0.35 0.24 0.12 0.01 0.00 0.00 1.74 Repayment of Term Loan 0.25 0.75 1.00 1.24 1.24 0.50 0.00 0.00 4.98 Total (N) 0.83 1.19 1.35 1.49 1.36 0.51 0.00 0.00 6.72 DSCR (M/N) 4.46 2.47 1.88 1.67 1.79 4.66 0.00 0.00 2.45 Average DSCR 2.45
Divided Blast Cupola Furnace
20
Annexure 4: Procurement and implementation schedule
S. No. Activities Weeks
1 2 3 … 6 7 8
1 Planning and material order
2 Procurement
3 Dismantling of conventional Cupola Furnace
4 Commissioning
Divided Blast Cupola Furnace
21
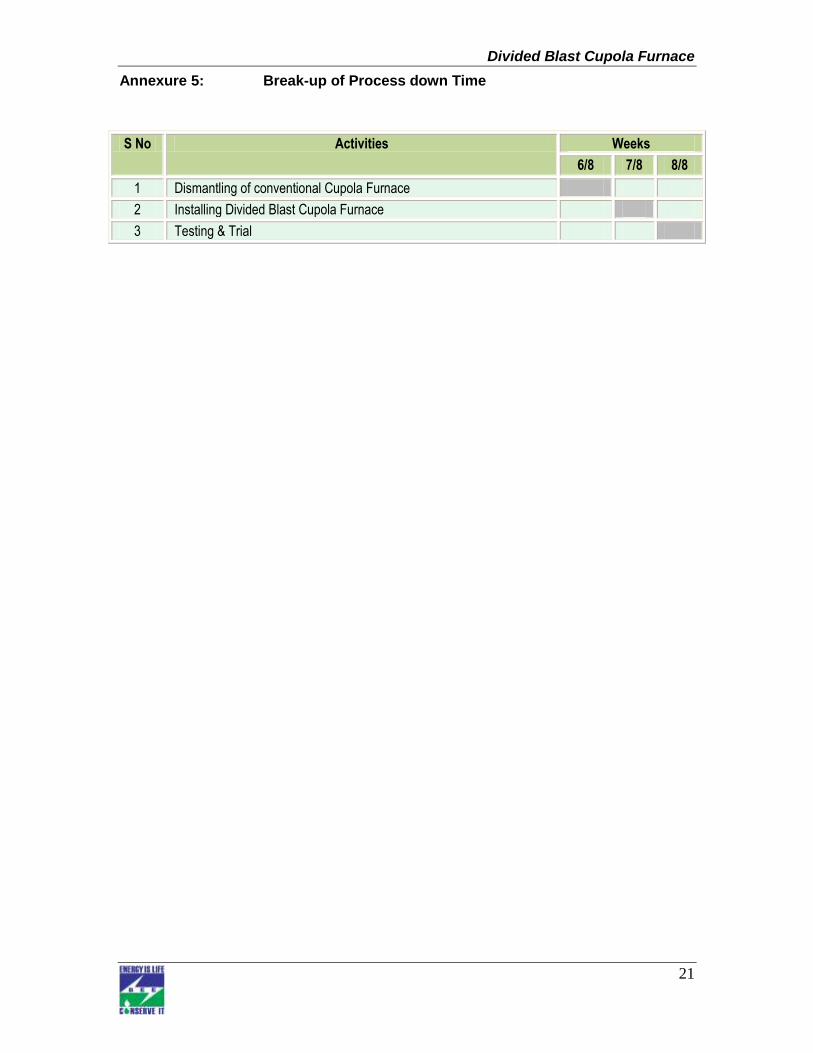
Annexure 5: Break-up of Process down Time
S No Activities Weeks
6/8 7/8 8/8
1 Dismantling of conventional Cupola Furnace
2 Installing Divided Blast Cupola Furnace
3 Testing & Trial
Divided Blast Cupola Furnace
22
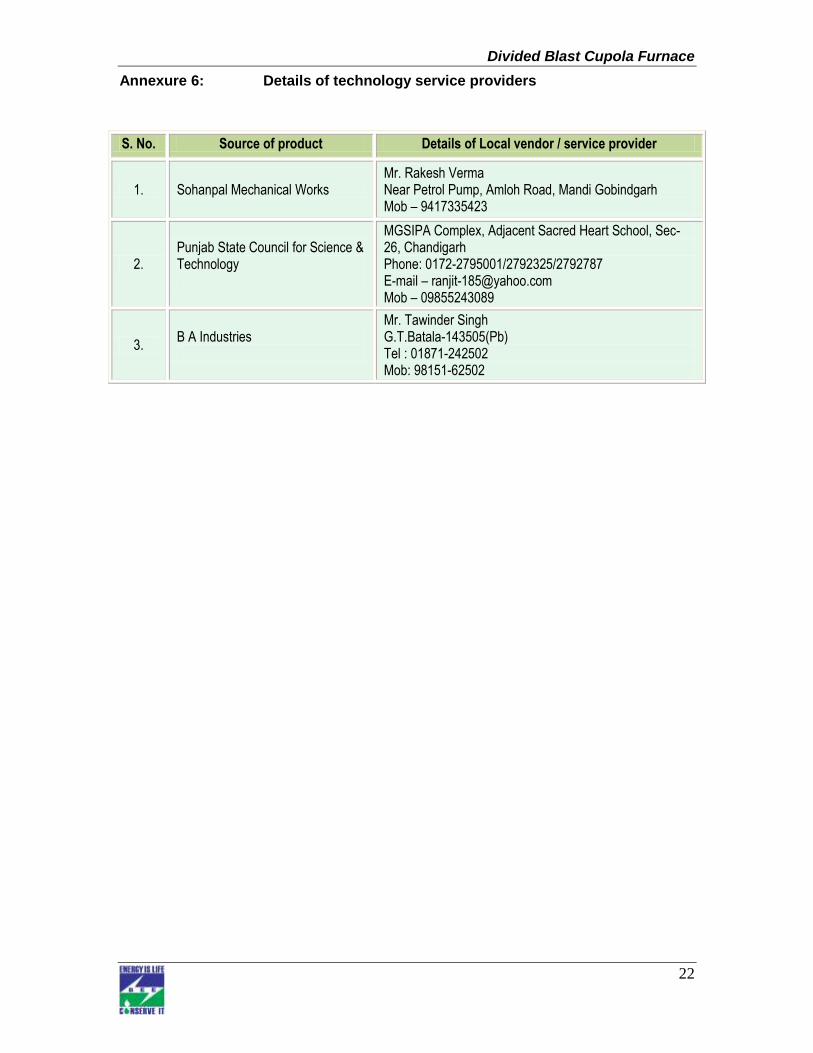
Annexure 6: Details of technology service providers
S. No. Source of product Details of Local vendor / service provider
1. Sohanpal Mechanical Works Mr. Rakesh Verma Near Petrol Pump, Amloh Road, Mandi Gobindgarh Mob – 9417335423
2. Punjab State Council for Science & Technology
MGSIPA Complex, Adjacent Sacred Heart School, Sec-26, Chandigarh Phone: 0172-2795001/2792325/2792787 E-mail – [email protected] Mob – 09855243089
3. B A Industries
Mr. Tawinder Singh G.T.Batala-143505(Pb) Tel : 01871-242502 Mob: 98151-62502
Divided Blast Cupola Furnace
23
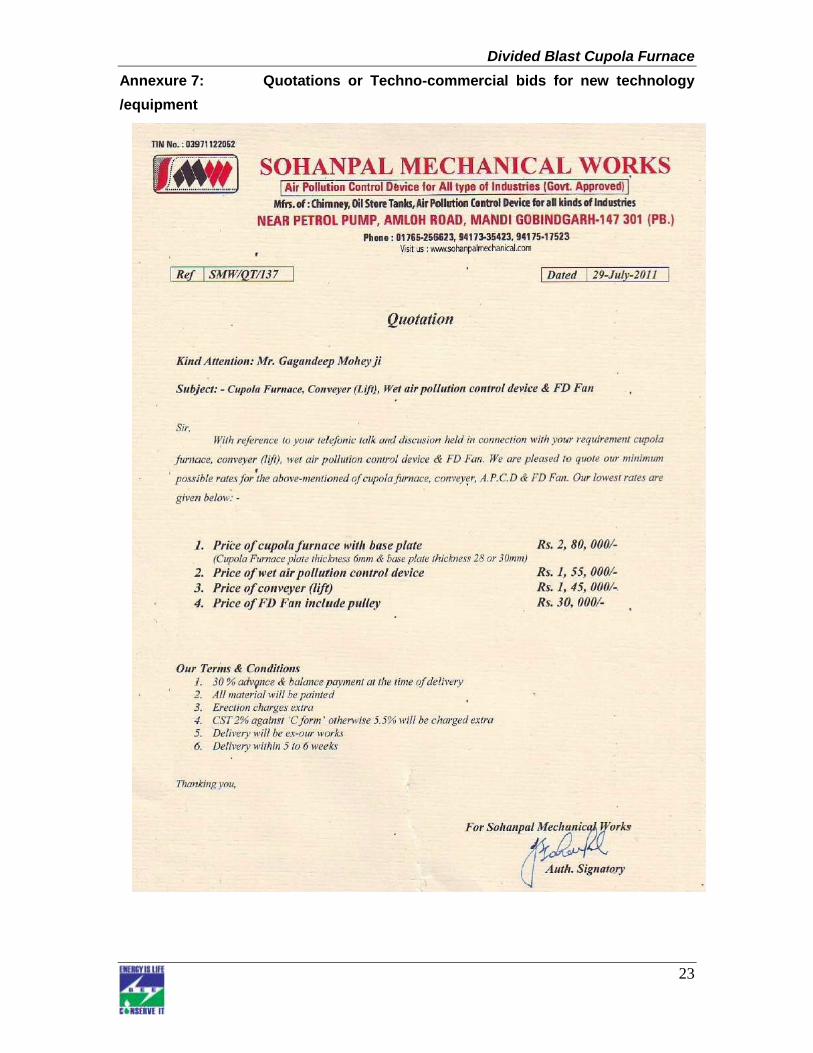
Annexure 7: Quotations or Techno-commercial bids for new technology
/equipment
Bureau of Energy Efficiency (BEE) (Ministry of Power, Government of India) 4th Floor, Sewa Bhawan, R. K. Puram, New Delhi – 110066 Ph.: +91 – 11 – 26179699 (5 Lines), Fax: +91 – 11 – 26178352
Websites: www.bee-india.nic.in, www.energymanagertraining.com
India SME Technology Services Ltd
DFC Building, Plot No.37-38, D-Block, Pankha Road, Institutional Area, Janakpuri, New Delhi-110058 Tel: +91-11-28525534, Fax: +91-11-28525535 Website: www.techsmall.com
Confederation of Indian Industry
CII – AVANTHA Centre for Competitiveness Block No.3, Dakshin Marg Sector 31-A, Chandigarh - 160030 Tel: 0172-5080784 (D) / 2666517-19 Fax: 0172-2606259 / 2614974 E-mail: [email protected] Website: www.ciicfc.org


