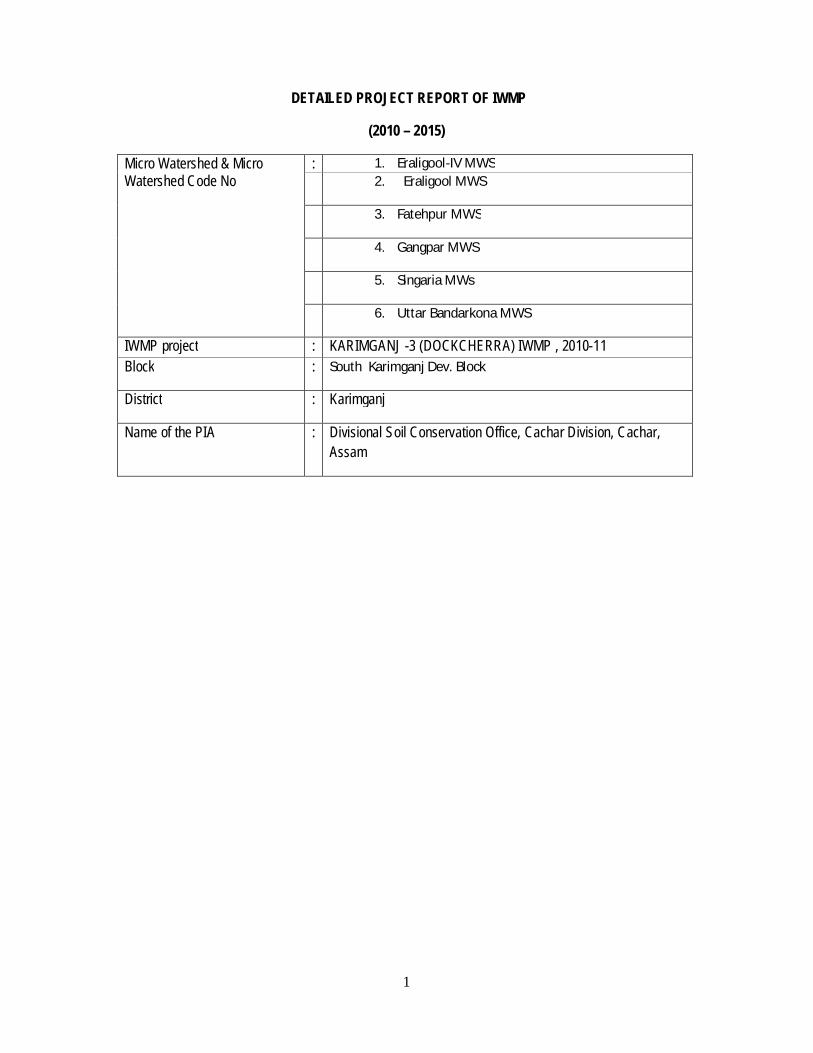
Name of the PIA : Divisional Soil Conservation Office, Cachar Division, Cachar, Assam
1
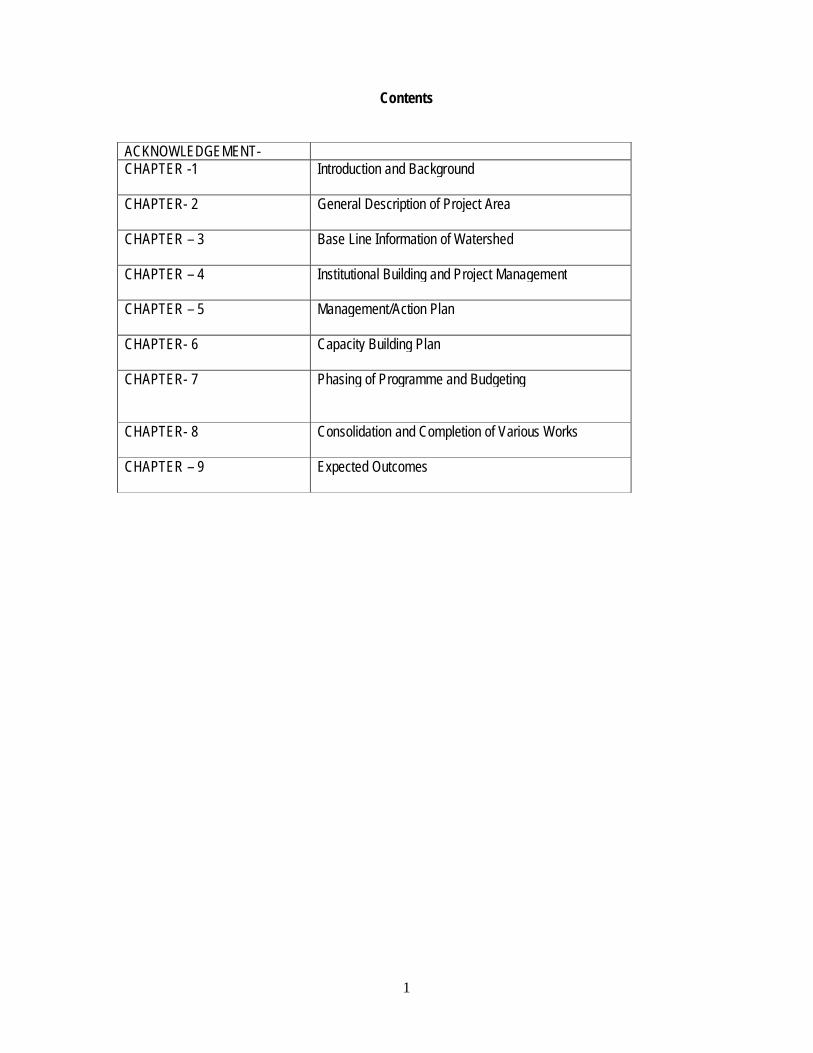
Contents
ACKNOWLEDGEMENT- CHAPTER -1
Introduction and Background
CHAPTER- 2
General Description of Project Area
CHAPTER – 3
Base Line Information of Watershed
CHAPTER – 4
Institutional Building and Project Management
CHAPTER – 5
Management/Action Plan
CHAPTER- 6
Capacity Building Plan
CHAPTER- 7
Phasing of Programme and Budgeting
CHAPTER- 8
Consolidation and Completion of Various Works
CHAPTER – 9
Expected Outcomes
2
A C K N O W L E D G E M E N T
The undersigned, on behalf of all members of M/s Eastern Envo Protect, Guwahati, expressed gratitude towards State Level Nodal Agency, Assam under IWMP for entrusting the responsibility in preparing of Detail Project Report for Integrated Watershed Management Programme.
We also express our gratitude to Dr. Prem Charan, earlier Chairman, SLNA, IWMP, Assam and Ms. N. Hazarika, Secretary, Soil Conservation Department, Govt. of Assam for providing their valuable suggestions, guidance for preparing the DPR.
We are also indebted to the CEO, SLNA, IWMP, Assam, Mr. F. Haque Choudhry, Deputy Secretary, Soil Conservation Department, Govt. of Assam and other officials of SLNA, IWMP, Assam for their help and support in every stage of preparing the DPR.
We are expressing our sincere gratitude to the Deputy Commissioner, Cachar District and Mr. B. Goala, Divisional Officer, Soil Conservation Division, Cachar, Assam for their help, suggestions and constant inspiration and supervision for preparing the DPR. We also sincerely acknowledged the help and cooperation extended by all the Goan Burahs and other community members during the conduction of PRA exercises and household survey.
For Eastern Envo. Protech
(S.I.Zaman)
3
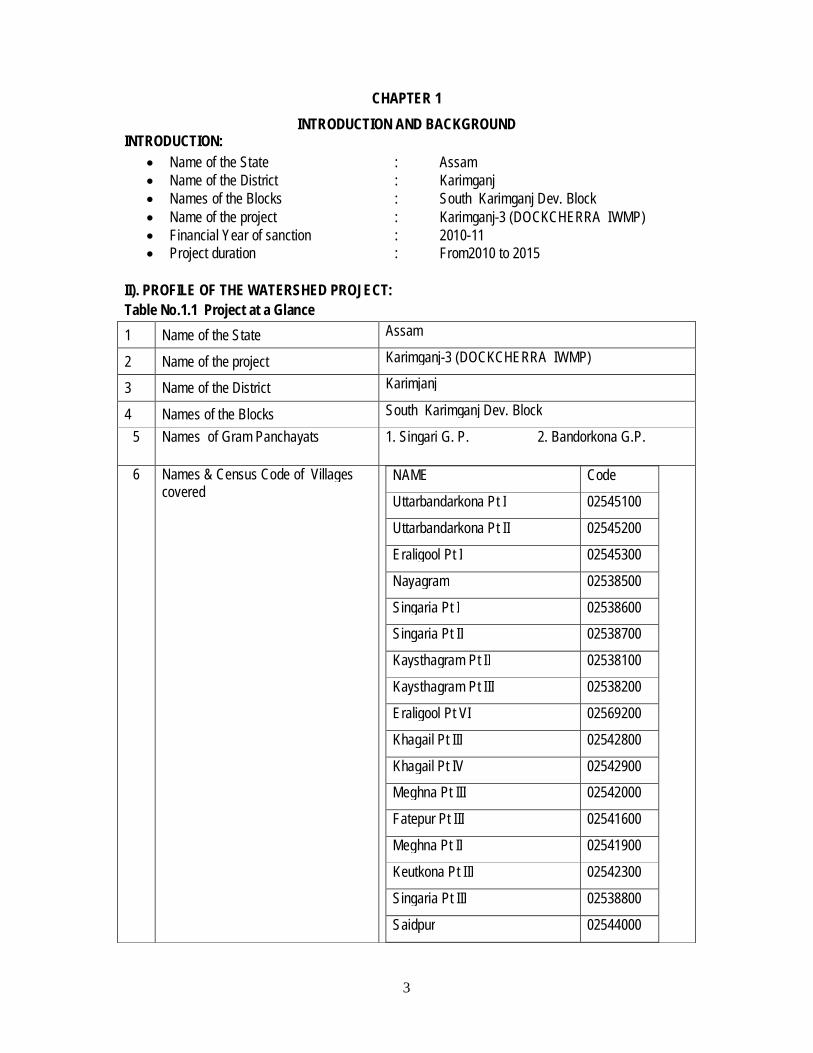
CHAPTER 1 INTRODUCTION AND BACKGROUND
INTRODUCTION: Name of the State : Assam Name of the District : Karimganj Names of the Blocks : South Karimganj Dev. Block Name of the project : Karimganj-3 (DOCKCHERRA IWMP) Financial Year of sanction : 2010-11 Project duration : From2010 to 2015
II). PROFILE OF THE WATERSHED PROJECT: Table No.1.1 Project at a Glance 1 Name of the State Assam
2 Name of the project Karimganj-3 (DOCKCHERRA IWMP)
3 Name of the District Karimjanj
4 Names of the Blocks South Karimganj Dev. Block
5 Names of Gram Panchayats 1. Singari G. P. 2. Bandorkona G.P.
6 Names & Census Code of Villages covered
NAME Code
Uttarbandarkona Pt I 02545100
Uttarbandarkona Pt II 02545200
Eraligool Pt I 02545300
Nayagram 02538500
Singaria Pt I 02538600
Singaria Pt II 02538700
Kaysthagram Pt II 02538100
Kaysthagram Pt III 02538200
Eraligool Pt VI 02569200
Khagail Pt III 02542800
Khagail Pt IV 02542900
Meghna Pt III 02542000
Fatepur Pt III 02541600
Meghna Pt II 02541900
Keutkona Pt III 02542300
Singaria Pt III 02538800
Saidpur 02544000
4
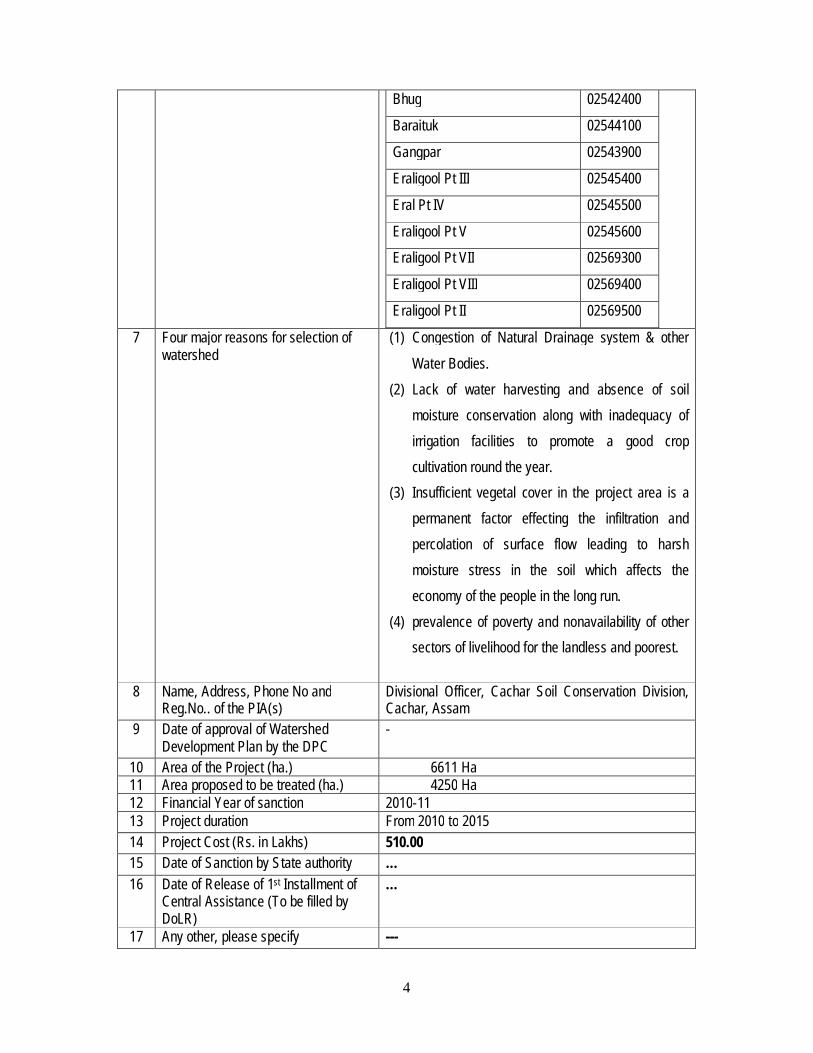
Bhug 02542400
Baraituk 02544100
Gangpar 02543900
Eraligool Pt III 02545400
Eral Pt IV 02545500
Eraligool Pt V 02545600
Eraligool Pt VII 02569300
Eraligool Pt VIII 02569400
Eraligool Pt II 02569500
7 Four major reasons for selection of watershed
(1) Congestion of Natural Drainage system & other
Water Bodies. (2) Lack of water harvesting and absence of soil
moisture conservation along with inadequacy of irrigation facilities to promote a good crop cultivation round the year.
(3) Insufficient vegetal cover in the project area is a permanent factor effecting the infiltration and percolation of surface flow leading to harsh moisture stress in the soil which affects the economy of the people in the long run.
(4) prevalence of poverty and nonavailability of other sectors of livelihood for the landless and poorest.
8 Name, Address, Phone No and Reg.No.. of the PIA(s)
9 Date of approval of Watershed Development Plan by the DPC
-
10 Area of the Project (ha.) 6611 Ha 11 Area proposed to be treated (ha.) 4250 Ha 12 Financial Year of sanction 2010-11 13 Project duration From 2010 to 2015 14 Project Cost (Rs. in Lakhs) 510.00 15 Date of Sanction by State authority … 16 Date of Release of 1st Installment of
Central Assistance (To be filled by DoLR)
…
17 Any other, please specify ---
5
Project Background: The National Rainfed Area Authority (NRAA) was set up in the year 2006. In coordination with
the Planning Commission of India, NRAA formulated the Common Guideline on Watershed Management Programme in 2008 for all watershed development projects in all Ministries and Departments of Govt. of India. Under this Guideline, Ministry of Rural Development, GoI has launched Integrated Watershed Management Programme (IWMP) as the successive one of its earlier programme like IWDP/Hariyali. Integrated Watershed Management Programme (IWMP) is a modified programme of previous Drought Prone Areas Programme (DPAP), Desert Development Programme (DDP) and Integrated Wastelands Development Programme (IWDP) of the Department of Land Resources, Government of India. The scheme was launched during 2009-10. The main objectives of the IWMP are to restore the ecological balance by harnessing, conserving and developing degraded natural resources such as soil, vegetative cover and water. The outcomes are prevention of soil erosion, regeneration of natural vegetation, rain water harvesting and recharging of the ground water table. This enables multi-cropping and the introduction of diverse agro-based activities, which help to provide sustainable livelihoods to the people residing in the watershed area.
The main objectives of the IWMP are to restore the ecological balance by harnessing, conserving and developing degraded natural resources such as soil, vegetative cover and water. The outcomes are prevention of soil erosion, regeneration of natural vegetation, rain water harvesting and recharging of the ground water table. These allow multi-cropping and the introduction of diverse agro-based activities, which help to provide sustainable livelihoods to the people living in the watershed area.
Watershed approach has conveniently aimed at treating degraded lands with the help of low cost and locally available technologies such as in-situ soil and moisture conservation measures, afforestation etc,. through a participatory approach that seeks to secure close involvement of the user community. The broad objective of the watershed development programme was the promotion of the overall development of socio-economic conditions of the resourceless poor sections of the people inhabiting with in the watershed.
Integrated Watershed management implies rational utilization of natural resources for optimal and sustained production with minimum hazard to environment. It requires collection and analysis of information from multiple services to ensure sustainable economic and social progress of a watershed.
6
The integrated watershed management essentially involves the following principles:
Land and water resources are interactive ports of natural ecosystem and should be managed on catchment basis;
Catchments are continually changing and need to be managed by considering these changes
Management of land and water resources must be coordinated, with decision based on the best available information
Sound land and water management is best achieved through the information action of
individual users and managers of these resources
A balance of economic development and conservation of land and water resources must be maintained.
Problems:
The project area of Karimganj-3 (Dockcherra) IWMP falls under South Karimganj Dev. Block of Karimganj District. About 90% of the population of this area is fully dependent on Agriculture. The area has been facing many problems right from very low ground water table to perennial flesh flood. Due to erratic climatic character, the project area has to face occasional drought like situation also. Adverse climatic conditions, poor mobilization of the resources and inadequate agricultural infrastructure are some of the factors responsible for the underdeveloped state of the area. Hence, it is anticipated that the project area of over 5952 ha would undoubtedly boost the living standards of the people of the area through the improvement in agriculture and allied activities.
The vital problem of the watershed is degradation of natural water bodies like wetland & rivers. Due to annual, the natural drainages become very shallow and thereby water holding capacity has been reduced and because of biotic interference and environmental degradation, congestion of the drainage system & wetlands has become very sensitive. Most of the wetlands in the watershed have become very shallow and the whole area is covered with thick weeds and infested with wild aquatic fauna and thereby water holding capacity has been reduced up to a great extent. The degradation of the natural wetland & drainages has also created the problem of water logging in the catchment areas.
Besides above, the uneven rainfall, damage caused by pest and diseases in agricultural production, lack of knowledge and technologies and facilities for cash crops, nonavailability of safe drinking water, lack of acquired skills for artisans and weavers for producing better quality products insufficiency of other infrastructural developments are also important problems in the project area.
7
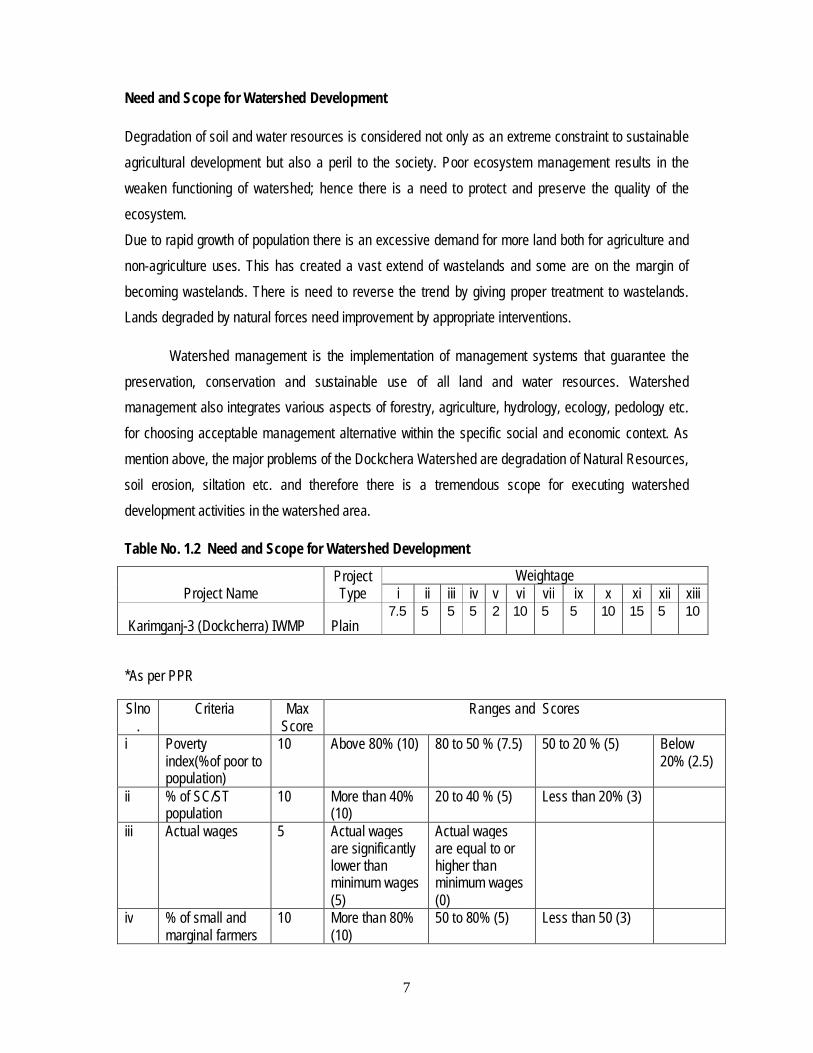
Need and Scope for Watershed Development
Degradation of soil and water resources is considered not only as an extreme constraint to sustainable agricultural development but also a peril to the society. Poor ecosystem management results in the weaken functioning of watershed; hence there is a need to protect and preserve the quality of the ecosystem. Due to rapid growth of population there is an excessive demand for more land both for agriculture and non-agriculture uses. This has created a vast extend of wastelands and some are on the margin of becoming wastelands. There is need to reverse the trend by giving proper treatment to wastelands. Lands degraded by natural forces need improvement by appropriate interventions.
Watershed management is the implementation of management systems that guarantee the preservation, conservation and sustainable use of all land and water resources. Watershed management also integrates various aspects of forestry, agriculture, hydrology, ecology, pedology etc. for choosing acceptable management alternative within the specific social and economic context. As mention above, the major problems of the Dockchera Watershed are degradation of Natural Resources, soil erosion, siltation etc. and therefore there is a tremendous scope for executing watershed development activities in the watershed area.
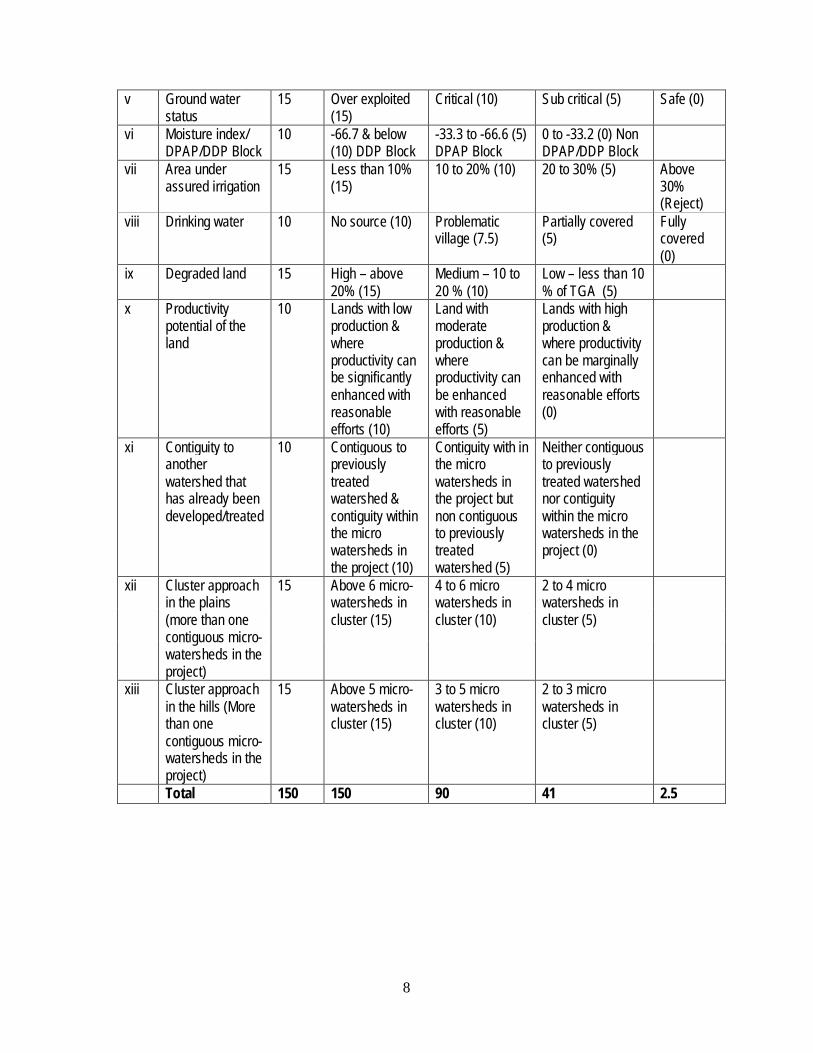
Table No. 1.2 Need and Scope for Watershed Development
10 Above 80% (10) 80 to 50 % (7.5) 50 to 20 % (5) Below 20% (2.5)
ii % of SC/ST population
10 More than 40% (10)
20 to 40 % (5) Less than 20% (3)
iii Actual wages 5 Actual wages are significantly lower than minimum wages (5)
Actual wages are equal to or higher than minimum wages (0)
iv % of small and marginal farmers
10 More than 80% (10)
50 to 80% (5) Less than 50 (3)
8
v Ground water status
15 Over exploited (15)
Critical (10) Sub critical (5) Safe (0)
vi Moisture index/ DPAP/DDP Block
10 -66.7 & below (10) DDP Block
-33.3 to -66.6 (5) DPAP Block
0 to -33.2 (0) Non DPAP/DDP Block
vii Area under assured irrigation
15 Less than 10% (15)
10 to 20% (10) 20 to 30% (5) Above 30% (Reject)
viii Drinking water 10 No source (10) Problematic village (7.5)
Partially covered (5)
Fully covered (0)
ix Degraded land 15 High – above 20% (15)
Medium – 10 to 20 % (10)
Low – less than 10 % of TGA (5)
x Productivity potential of the land
10 Lands with low production & where productivity can be significantly enhanced with reasonable efforts (10)
Land with moderate production & where productivity can be enhanced with reasonable efforts (5)
Lands with high production & where productivity can be marginally enhanced with reasonable efforts (0)
xi Contiguity to another watershed that has already been developed/treated
10 Contiguous to previously treated watershed & contiguity within the micro watersheds in the project (10)
Contiguity with in the micro watersheds in the project but non contiguous to previously treated watershed (5)
Neither contiguous to previously treated watershed nor contiguity within the micro watersheds in the project (0)
xii Cluster approach in the plains (more than one contiguous micro-watersheds in the project)
15 Above 6 micro-watersheds in cluster (15)
4 to 6 micro watersheds in cluster (10)
2 to 4 micro watersheds in cluster (5)
xiii Cluster approach in the hills (More than one contiguous micro- watersheds in the project)
15 Above 5 micro-watersheds in cluster (15)
3 to 5 micro watersheds in cluster (10)
2 to 3 micro watersheds in cluster (5)
Total 150 150 90 41 2.5
9
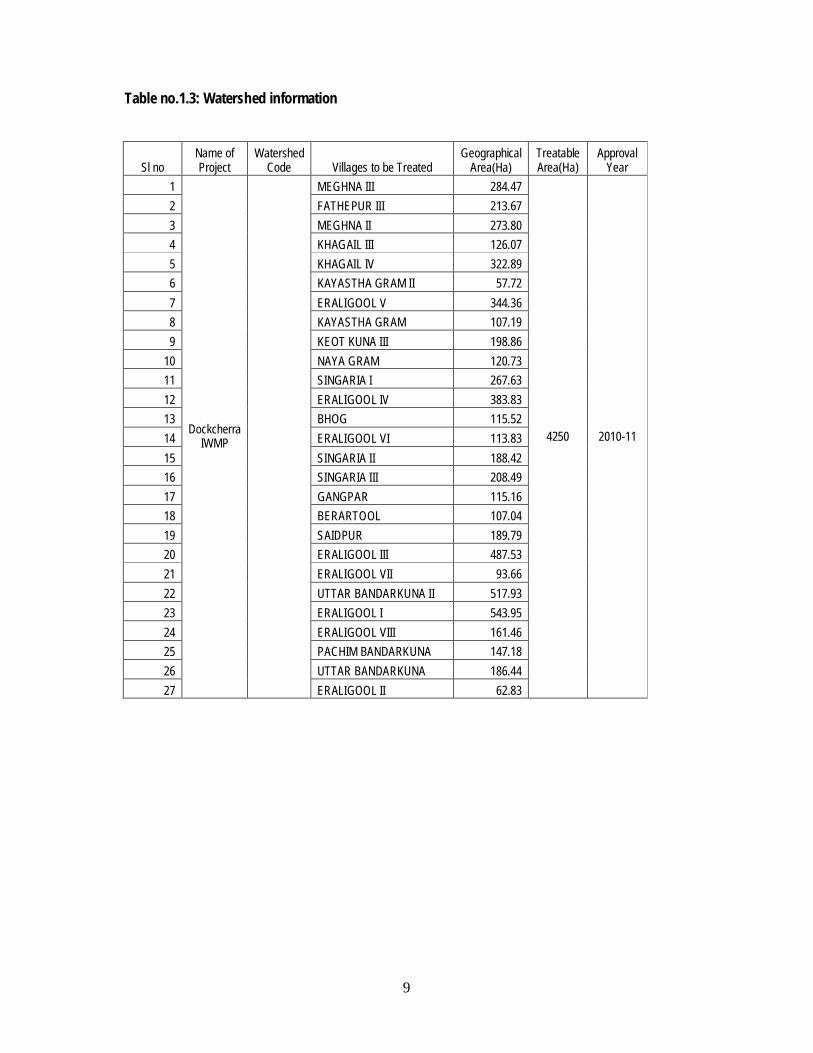
Table no.1.3: Watershed information
Sl no Name of Project
Watershed Code Villages to be Treated
Geographical Area(Ha)
Treatable Area(Ha)
Approval Year
1
Dockcherra IWMP
MEGHNA III 284.47
4250 2010-11
2 FATHEPUR III 213.67 3 MEGHNA II 273.80 4 KHAGAIL III 126.07 5 KHAGAIL IV 322.89 6 KAYASTHA GRAM II 57.72 7 ERALIGOOL V 344.36 8 KAYASTHA GRAM 107.19 9 KEOT KUNA III 198.86
10 NAYA GRAM 120.73 11 SINGARIA I 267.63 12 ERALIGOOL IV 383.83 13 BHOG 115.52 14 ERALIGOOL VI 113.83 15 SINGARIA II 188.42 16 SINGARIA III 208.49 17 GANGPAR 115.16 18 BERARTOOL 107.04 19 SAIDPUR 189.79 20 ERALIGOOL III 487.53 21 ERALIGOOL VII 93.66 22 UTTAR BANDARKUNA II 517.93 23 ERALIGOOL I 543.95 24 ERALIGOOL VIII 161.46 25 PACHIM BANDARKUNA 147.18 26 UTTAR BANDARKUNA 186.44 27 ERALIGOOL II 62.83
10
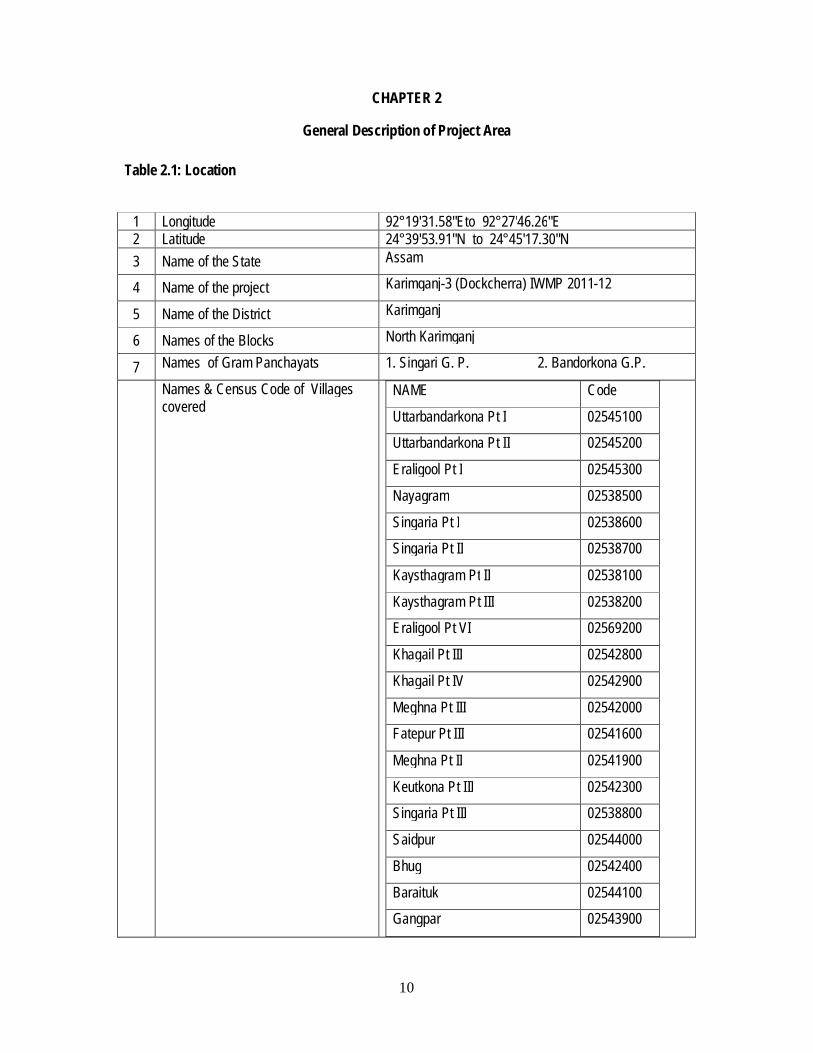
CHAPTER 2
General Description of Project Area Table 2.1: Location
1 Longitude 92°19'31.58"Eto 92°27'46.26"E 2 Latitude 24°39'53.91"N to 24°45'17.30"N 3 Name of the State Assam
4 Name of the project Karimganj-3 (Dockcherra) IWMP 2011-12
5 Name of the District Karimganj
6 Names of the Blocks North Karimganj
7 Names of Gram Panchayats 1. Singari G. P. 2. Bandorkona G.P.
Names & Census Code of Villages covered
NAME Code
Uttarbandarkona Pt I 02545100
Uttarbandarkona Pt II 02545200
Eraligool Pt I 02545300
Nayagram 02538500
Singaria Pt I 02538600
Singaria Pt II 02538700
Kaysthagram Pt II 02538100
Kaysthagram Pt III 02538200
Eraligool Pt VI 02569200
Khagail Pt III 02542800
Khagail Pt IV 02542900
Meghna Pt III 02542000
Fatepur Pt III 02541600
Meghna Pt II 02541900
Keutkona Pt III 02542300
Singaria Pt III 02538800
Saidpur 02544000
Bhug 02542400
Baraituk 02544100
Gangpar 02543900
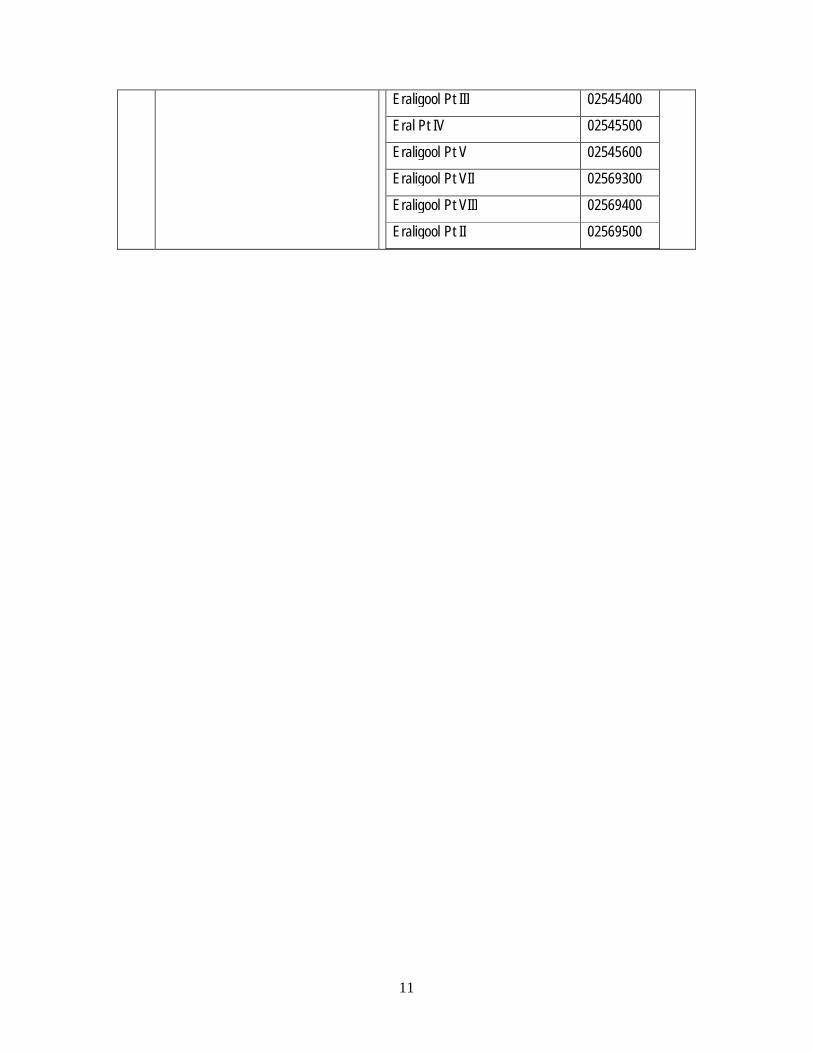
11
Eraligool Pt III 02545400
Eral Pt IV 02545500
Eraligool Pt V 02545600
Eraligool Pt VII 02569300
Eraligool Pt VIII 02569400
Eraligool Pt II 02569500
12
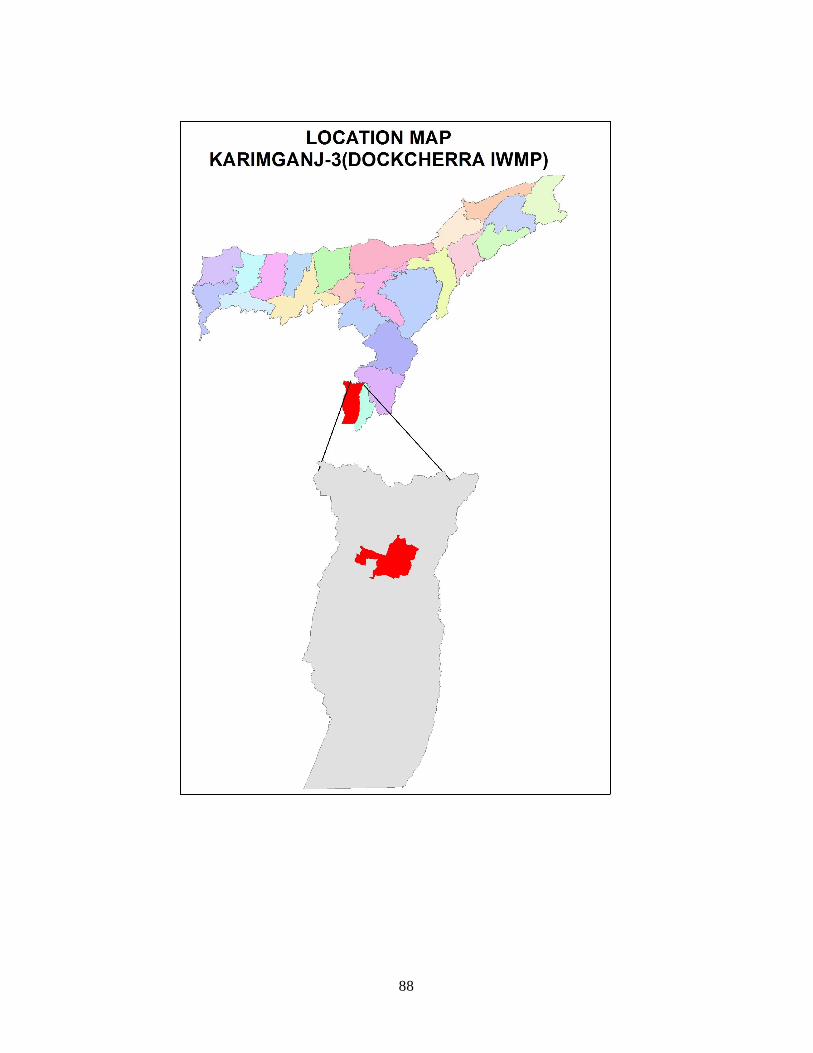
Location Map
13
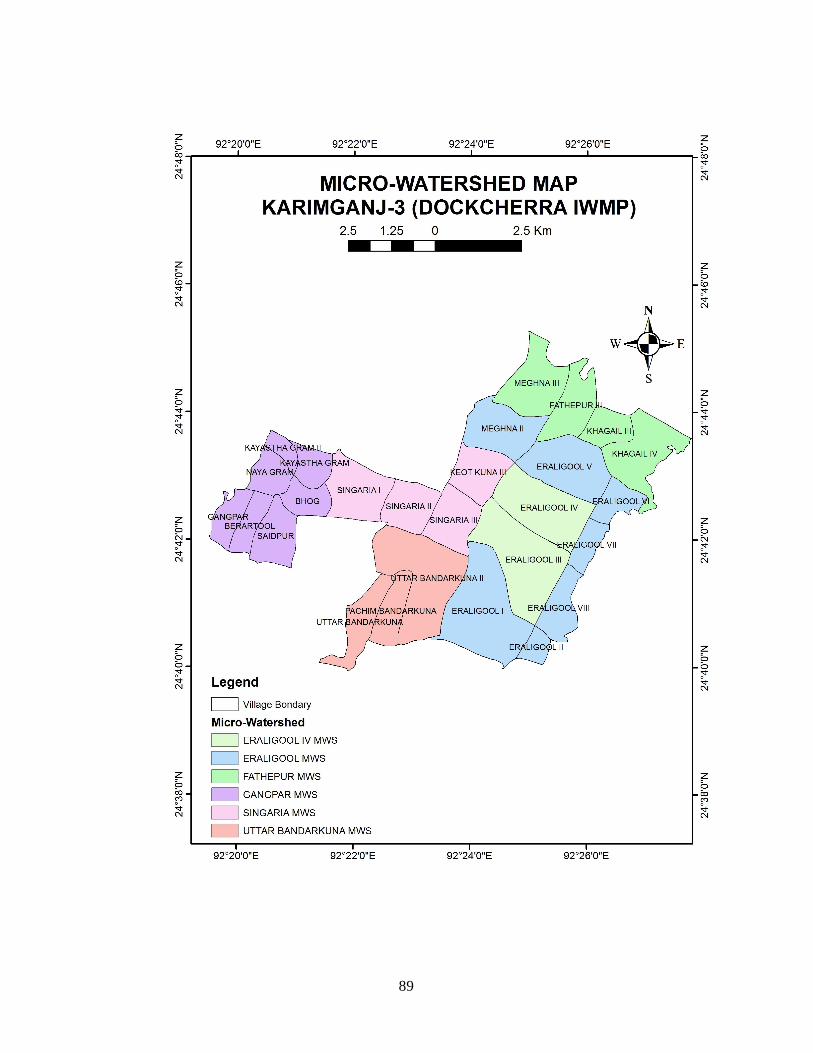
Micro Watershed Map
14
Location of Watershed:
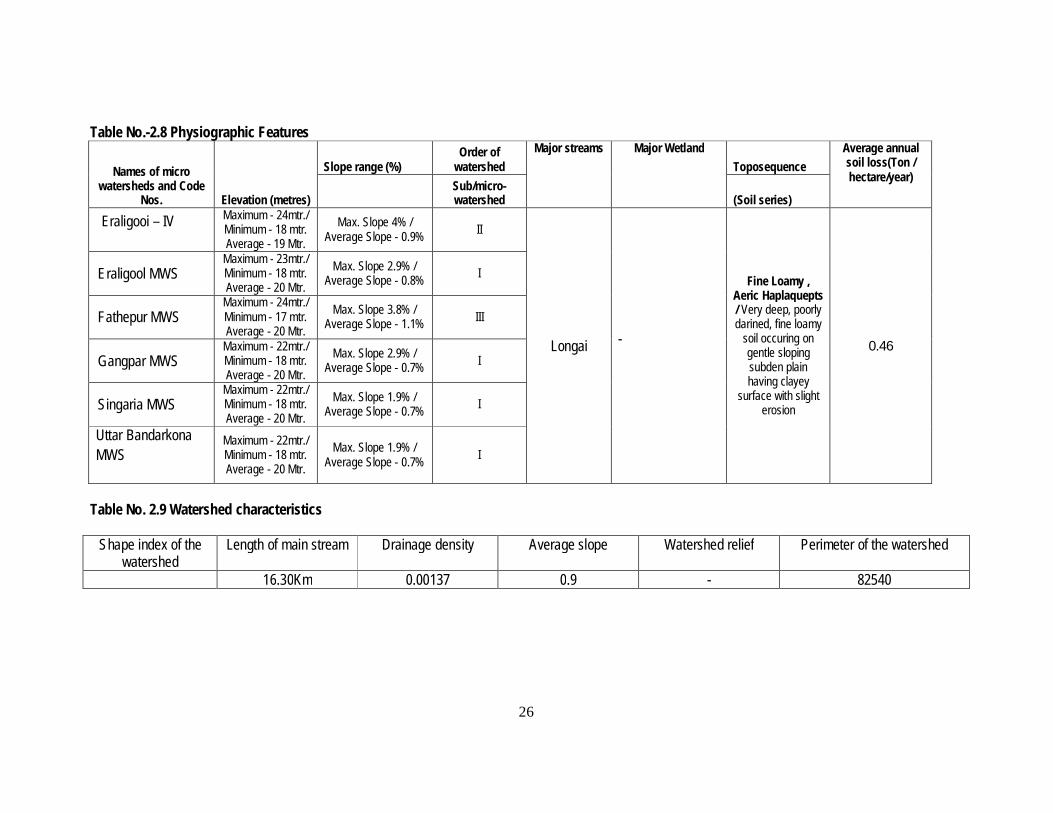
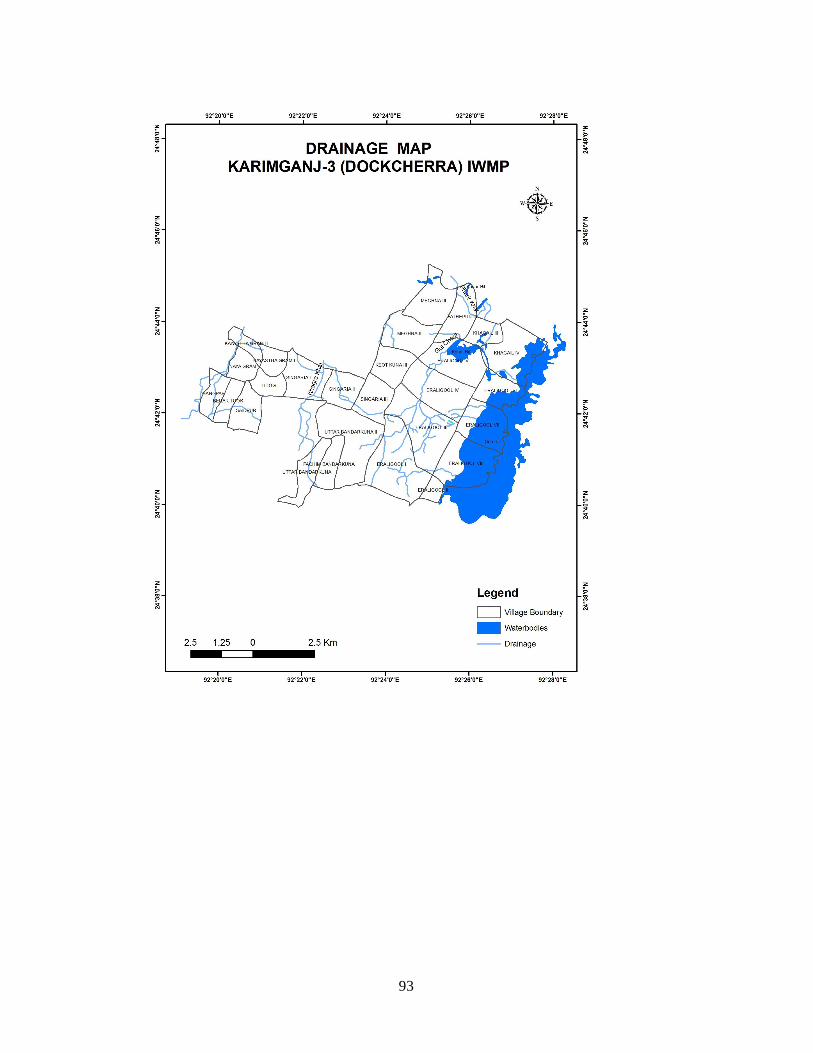
The Dockcherra Watershed is located in Central part of Karimganj District. The project area is located between 92°19'31.58"Eto 92°27'46.26"E longitude and 24°39'53.91"N to 24°45'17.30"N latitude.The watershed area coveres 26 numbers of revenue villages under South Karimganj Dev. Block. The total project area of the watershed is about 6611Ha. Physiography: The physiography of the project area is characterized by undulating plain with numbers of streams. The ecology of the watershed is unique and there is a constant threat of flood and erosion. The watershed area is gifted with vast water resources like wetlands, drainage/stream etc. Due to its location closed to the both eastern and western bank of the Longai River the area is inundated by flood
every year. A number of swamps/ marshy lands are found in the area. The physical make-up of the area represents younger flood plain, younger alluvial plain and
old alluvial plain. Proportionately larger area is covered by old younger alluvium. Climate:
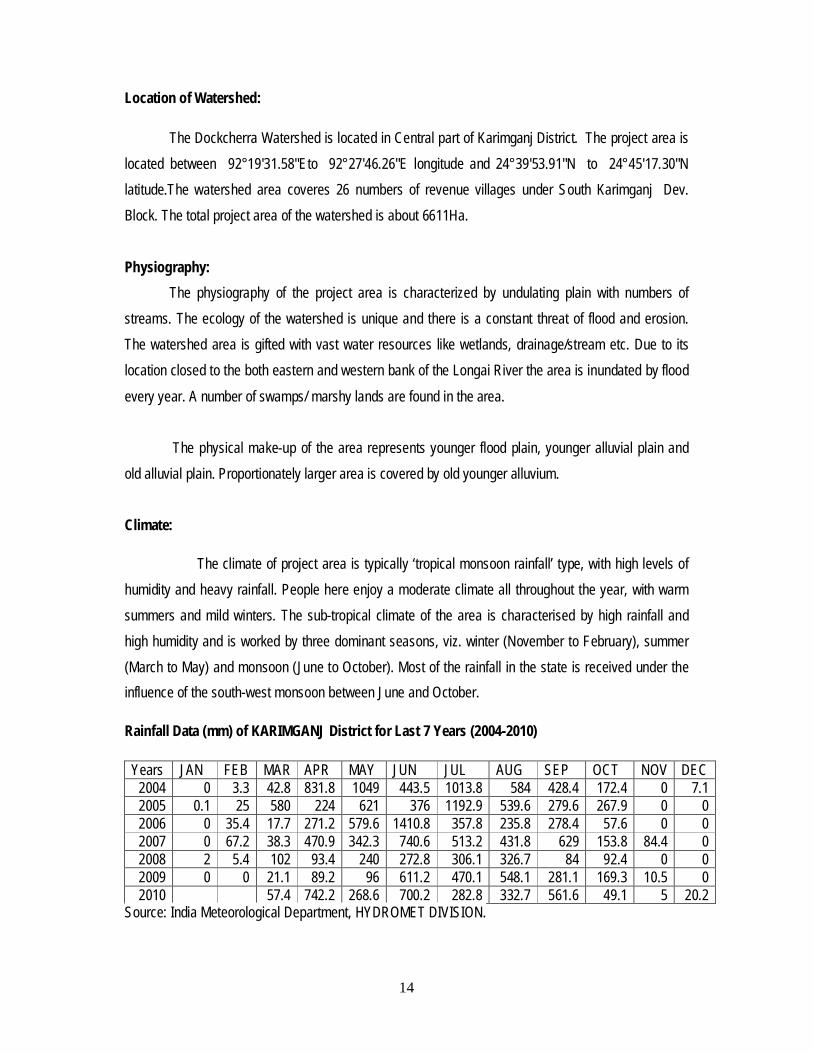
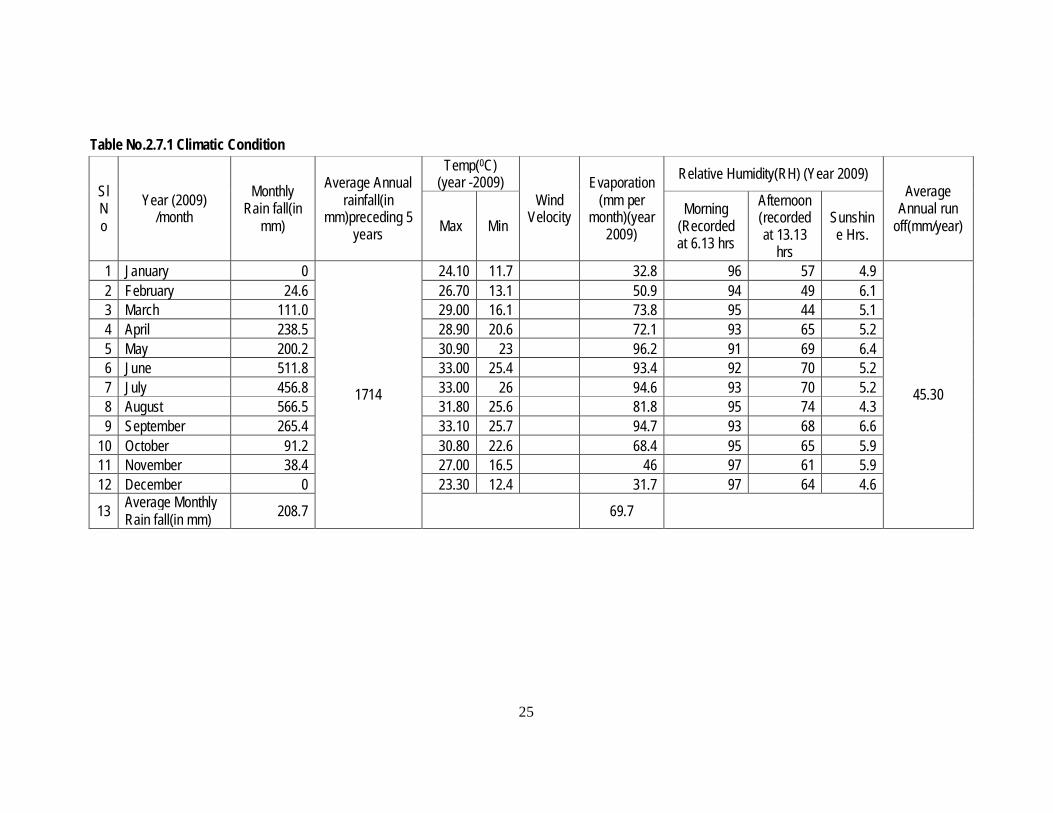
The climate of project area is typically ‘tropical monsoon rainfall’ type, with high levels of humidity and heavy rainfall. People here enjoy a moderate climate all throughout the year, with warm summers and mild winters. The sub-tropical climate of the area is characterised by high rainfall and high humidity and is worked by three dominant seasons, viz. winter (November to February), summer (March to May) and monsoon (June to October). Most of the rainfall in the state is received under the influence of the south-west monsoon between June and October.
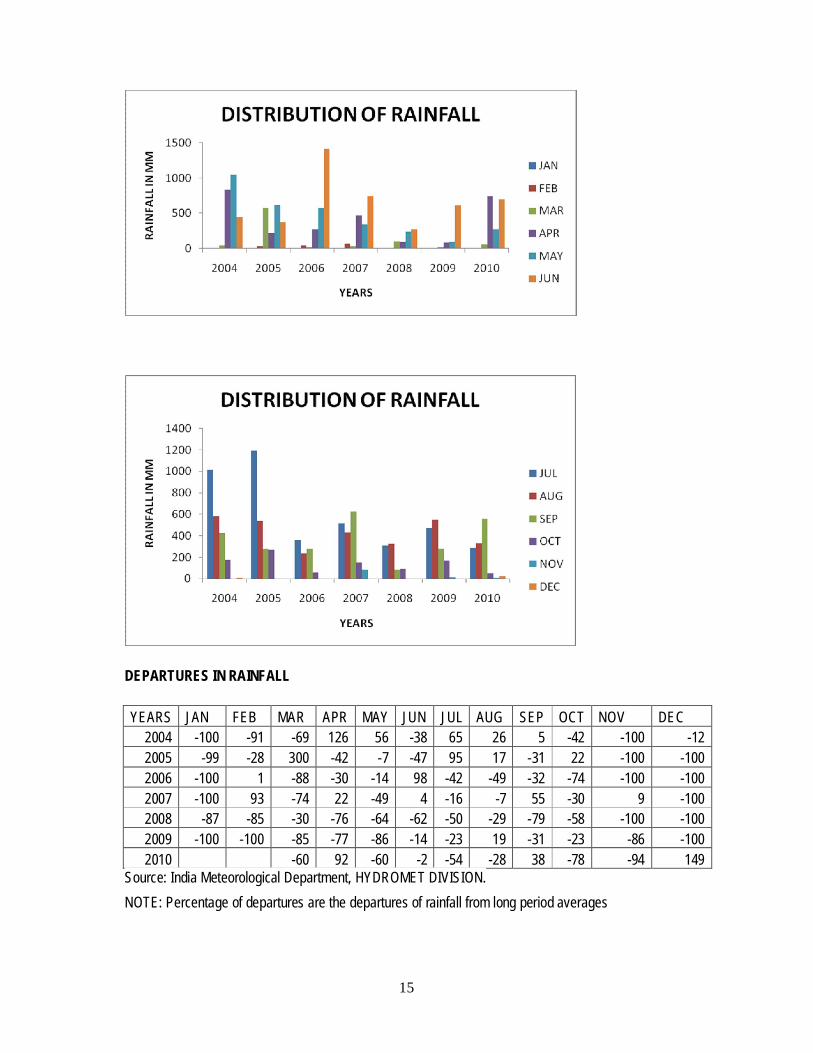
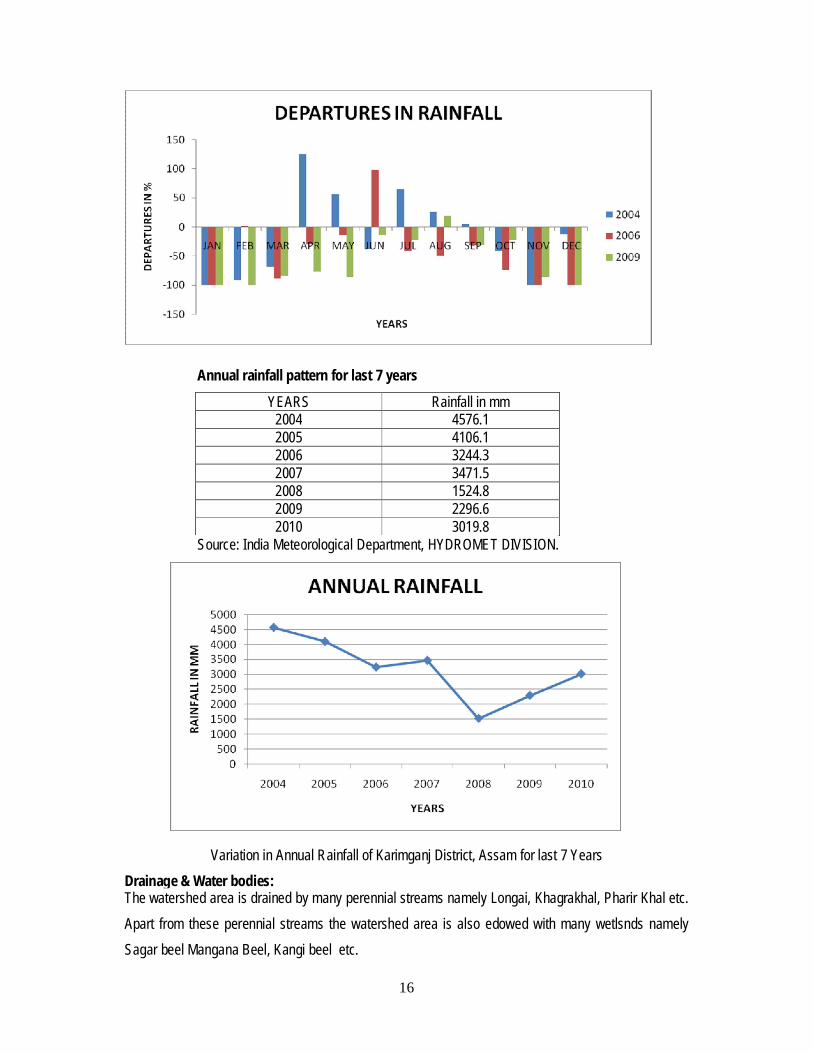
Rainfall Data (mm) of KARIMGANJ District for Last 7 Years (2004-2010)
Source: India Meteorological Department, HYDROMET DIVISION.
Variation in Annual Rainfall of Karimganj District, Assam for last 7 Years Drainage & Water bodies: The watershed area is drained by many perennial streams namely Longai, Khagrakhal, Pharir Khal etc. Apart from these perennial streams the watershed area is also edowed with many wetlsnds namely Sagar beel Mangana Beel, Kangi beel etc.
17
Drainage Map
18
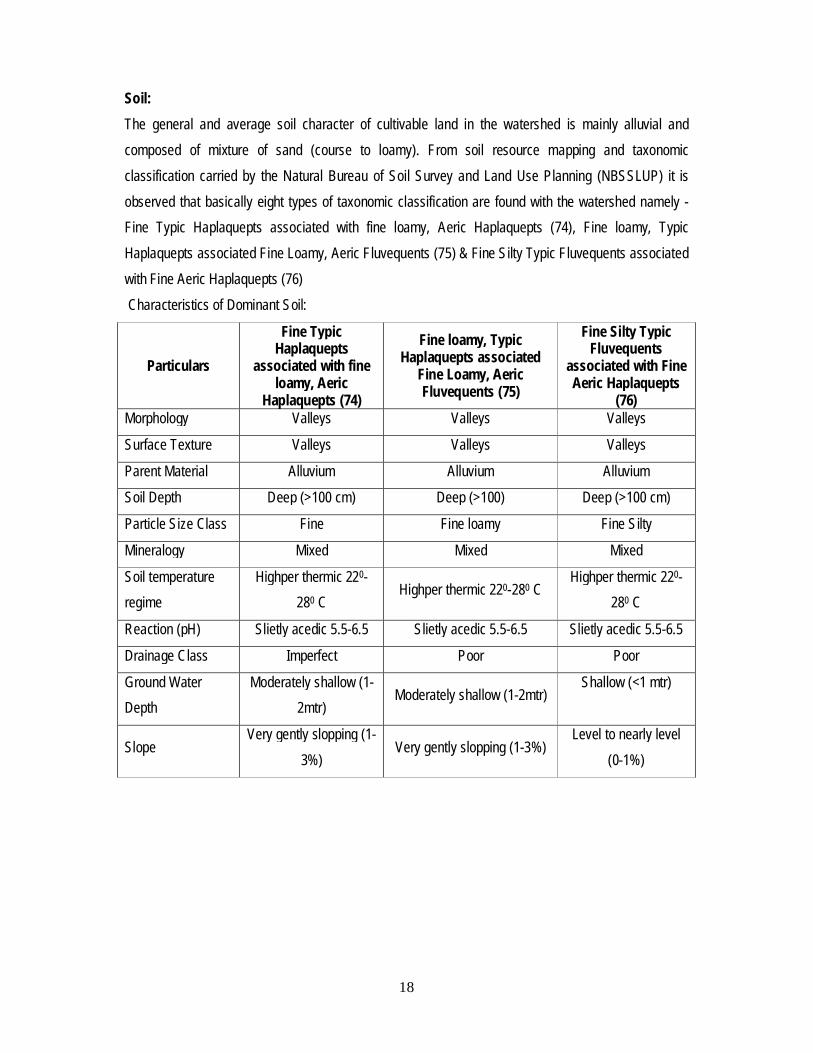
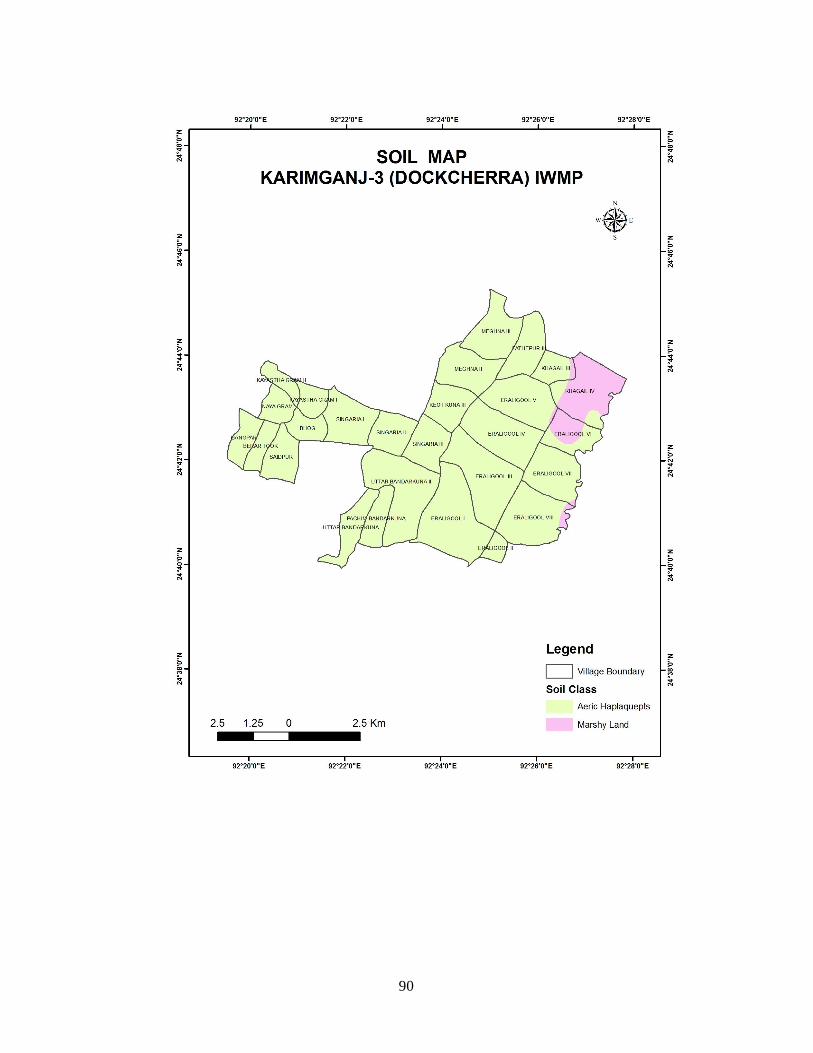
Soil: The general and average soil character of cultivable land in the watershed is mainly alluvial and composed of mixture of sand (course to loamy). From soil resource mapping and taxonomic classification carried by the Natural Bureau of Soil Survey and Land Use Planning (NBSSLUP) it is observed that basically eight types of taxonomic classification are found with the watershed namely - Fine Typic Haplaquepts associated with fine loamy, Aeric Haplaquepts (74), Fine loamy, Typic Haplaquepts associated Fine Loamy, Aeric Fluvequents (75) & Fine Silty Typic Fluvequents associated with Fine Aeric Haplaquepts (76) Characteristics of Dominant Soil:
Particulars
Fine Typic Haplaquepts
associated with fine loamy, Aeric
Haplaquepts (74)
Fine loamy, Typic Haplaquepts associated
Fine Loamy, Aeric Fluvequents (75)
Fine Silty Typic Fluvequents
associated with Fine Aeric Haplaquepts
(76) Morphology Valleys Valleys Valleys
Surface Texture Valleys Valleys Valleys
Parent Material Alluvium Alluvium Alluvium
Soil Depth Deep (>100 cm) Deep (>100) Deep (>100 cm)
The depth of ground water level in water table zone varies from 0.41 to 3.07 m bgl in the pre monsoon period and 0.56 to 3.41 m bgl during post monsoon period. As per the records of Ground Water Information Booklet, Central Ground Water Board, 2008 –the area is best suited for creation of ground water abstraction structures for discharge ranging from 100-300 M3/hr.
Economy:
The project area is depends on agricultural economy. Paddy is the major crop and is cultivated in kharif season and land remains uncultivated for rest of the year. The traditional farming system characterized by Low agricultural productivity, lack of irrigation facilities, damage cause by pest and diseases is the
major constraint for the agricultural development of the region. Further fishing, livestock rearing handloom and weaving are other important economic activities of the watershed area.
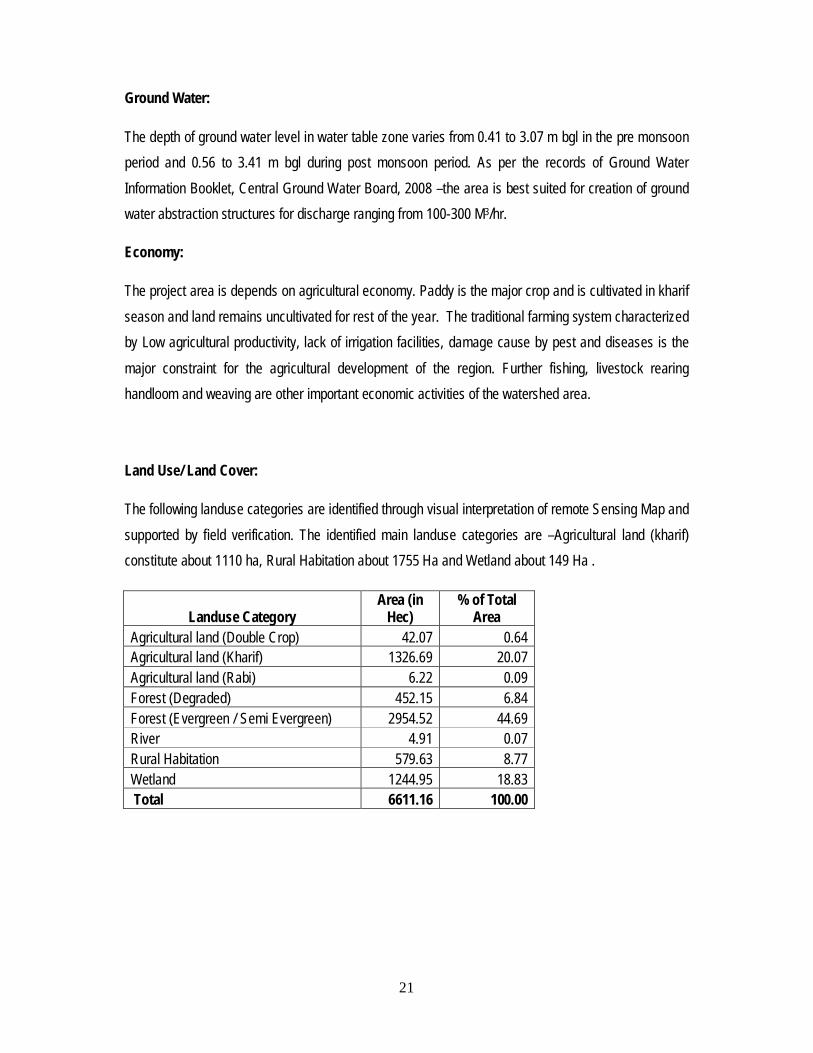
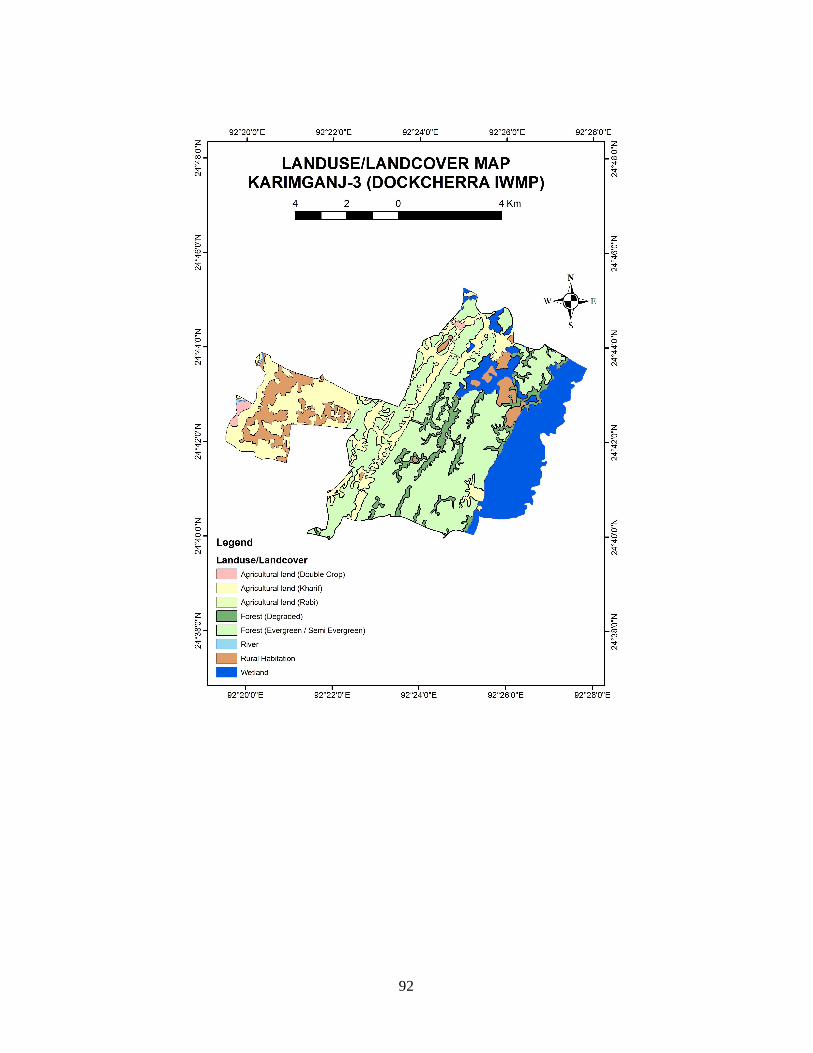
Land Use/ Land Cover:
The following landuse categories are identified through visual interpretation of remote Sensing Map and supported by field verification. The identified main landuse categories are –Agricultural land (kharif) constitute about 1110 ha, Rural Habitation about 1755 Ha and Wetland about 149 Ha .
Landuse Category Area (in
Hec) % of Total
Area Agricultural land (Double Crop) 42.07 0.64 Agricultural land (Kharif) 1326.69 20.07 Agricultural land (Rabi) 6.22 0.09 Forest (Degraded) 452.15 6.84 Forest (Evergreen / Semi Evergreen) 2954.52 44.69 River 4.91 0.07 Rural Habitation 579.63 8.77 Wetland 1244.95 18.83 Total 6611.16 100.00
22
Lulc Map
23
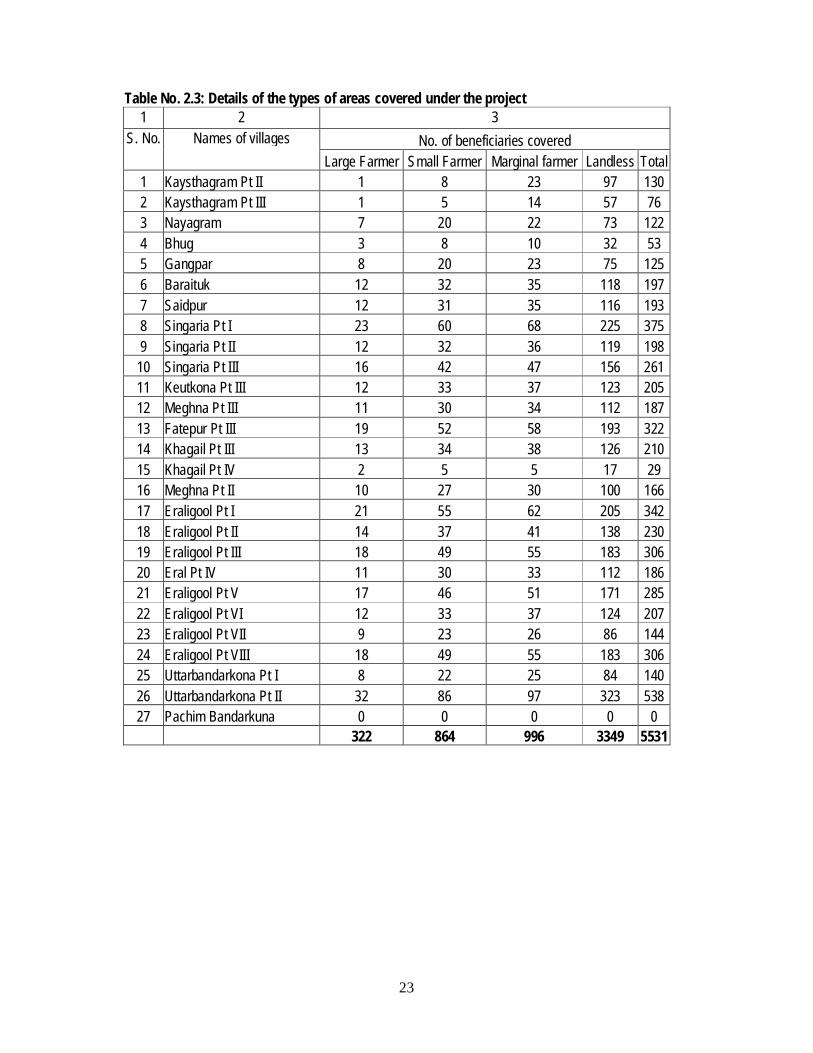
Table No. 2.3: Details of the types of areas covered under the project 1 2 3
S. No. Names of villages No. of beneficiaries covered Large Farmer Small Farmer Marginal farmer Landless Total
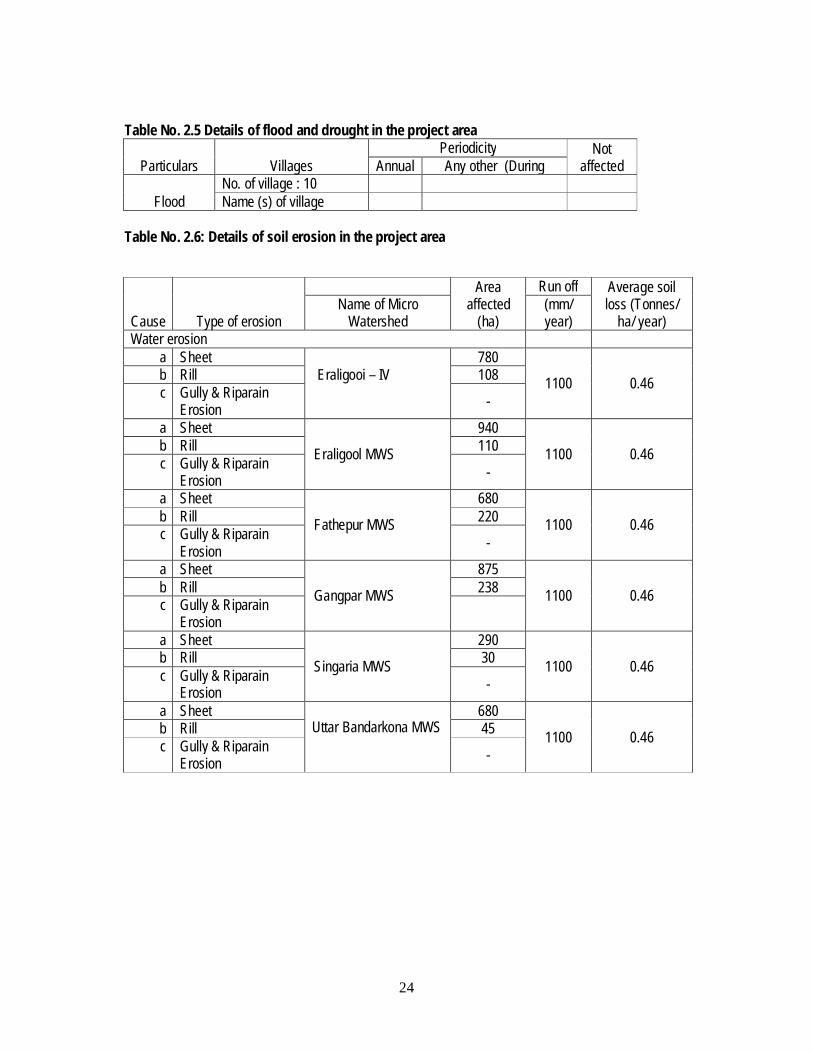
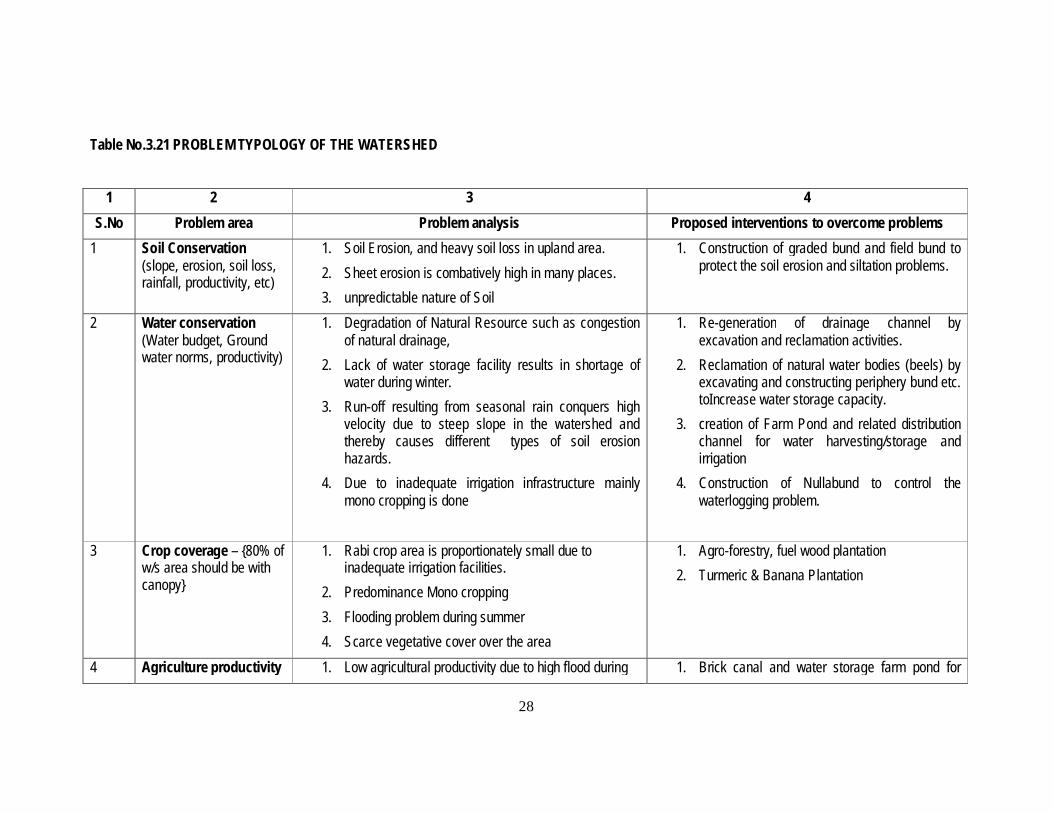
1. Soil Erosion, and heavy soil loss in upland area. 2. Sheet erosion is combatively high in many places. 3. unpredictable nature of Soil
1. Construction of graded bund and field bund to protect the soil erosion and siltation problems.
2 Water conservation (Water budget, Ground water norms, productivity)
1. Degradation of Natural Resource such as congestion of natural drainage,
2. Lack of water storage facility results in shortage of water during winter.
3. Run-off resulting from seasonal rain conquers high velocity due to steep slope in the watershed and thereby causes different types of soil erosion hazards.
4. Due to inadequate irrigation infrastructure mainly mono cropping is done
1. Re-generation of drainage channel by excavation and reclamation activities.
2. Reclamation of natural water bodies (beels) by excavating and constructing periphery bund etc. toIncrease water storage capacity.
3. creation of Farm Pond and related distribution channel for water harvesting/storage and irrigation
4. Construction of Nullabund to control the waterlogging problem.
3 Crop coverage – {80% of
w/s area should be with canopy}
1. Rabi crop area is proportionately small due to inadequate irrigation facilities.
2. Predominance Mono cropping 3. Flooding problem during summer 4. Scarce vegetative cover over the area
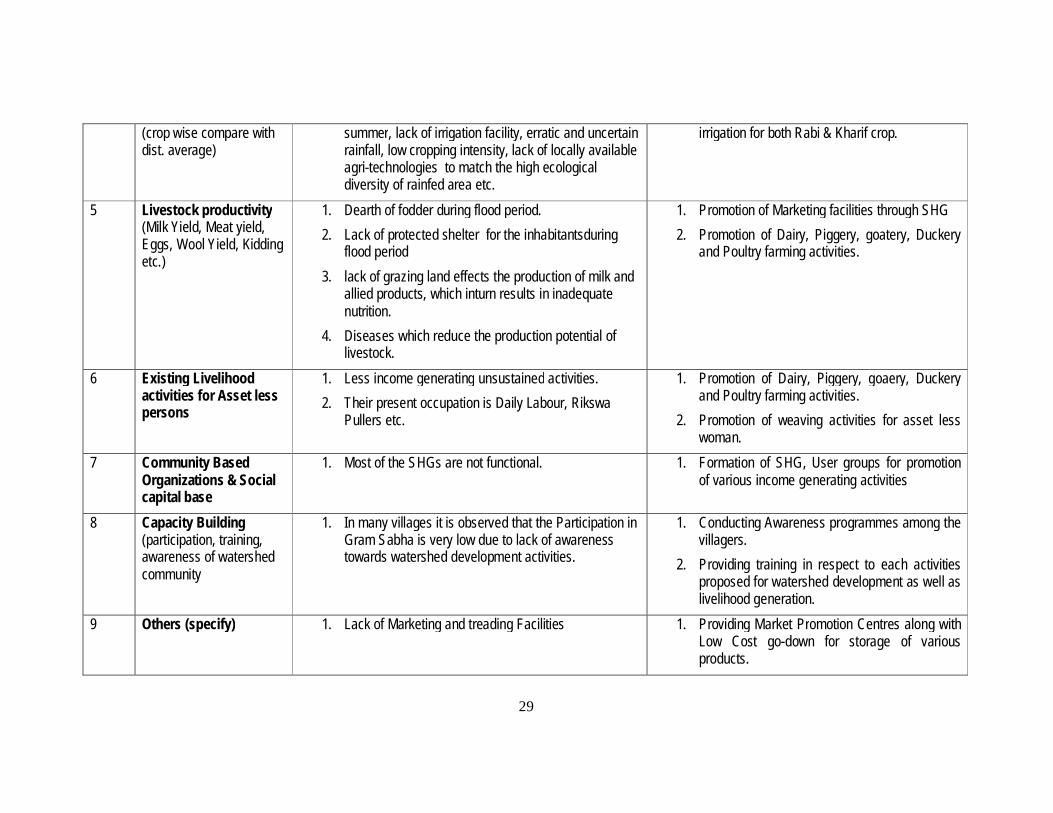
4 Agriculture productivity 1. Low agricultural productivity due to high flood during 1. Brick canal and water storage farm pond for
29
(crop wise compare with dist. average)
summer, lack of irrigation facility, erratic and uncertain rainfall, low cropping intensity, lack of locally available agri-technologies to match the high ecological diversity of rainfed area etc.
1. Dearth of fodder during flood period. 2. Lack of protected shelter for the inhabitantsduring
flood period 3. lack of grazing land effects the production of milk and
allied products, which inturn results in inadequate nutrition.
4. Diseases which reduce the production potential of livestock.
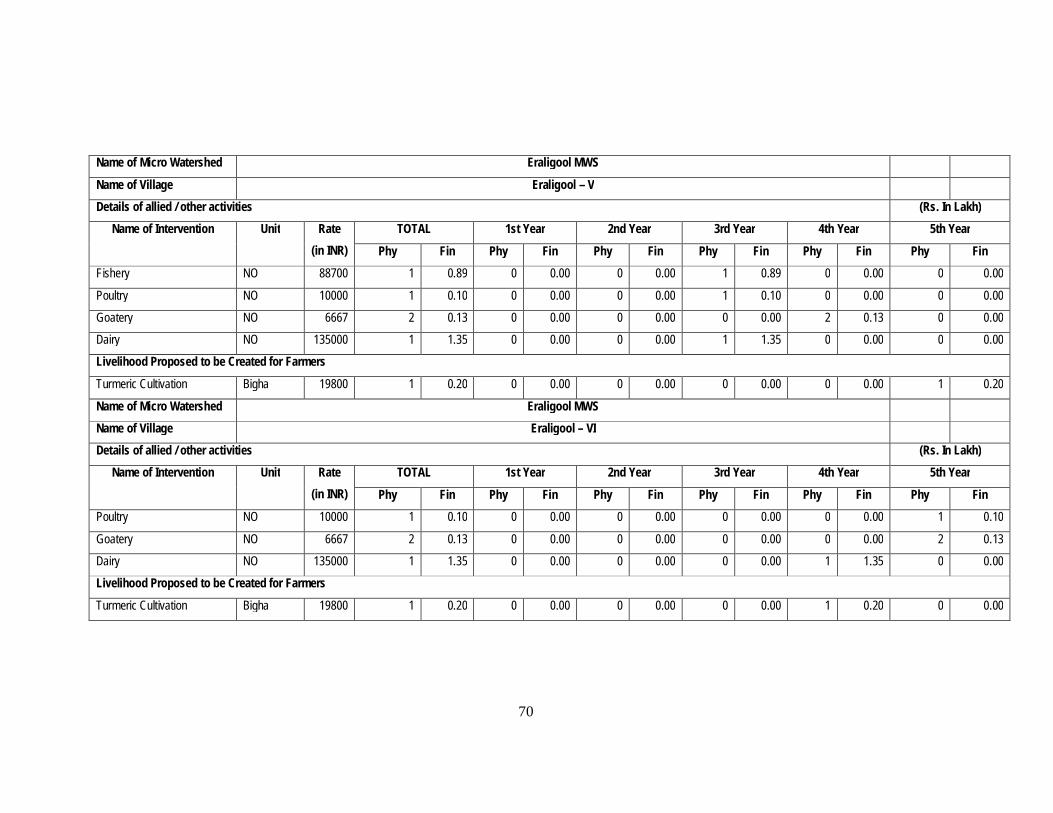
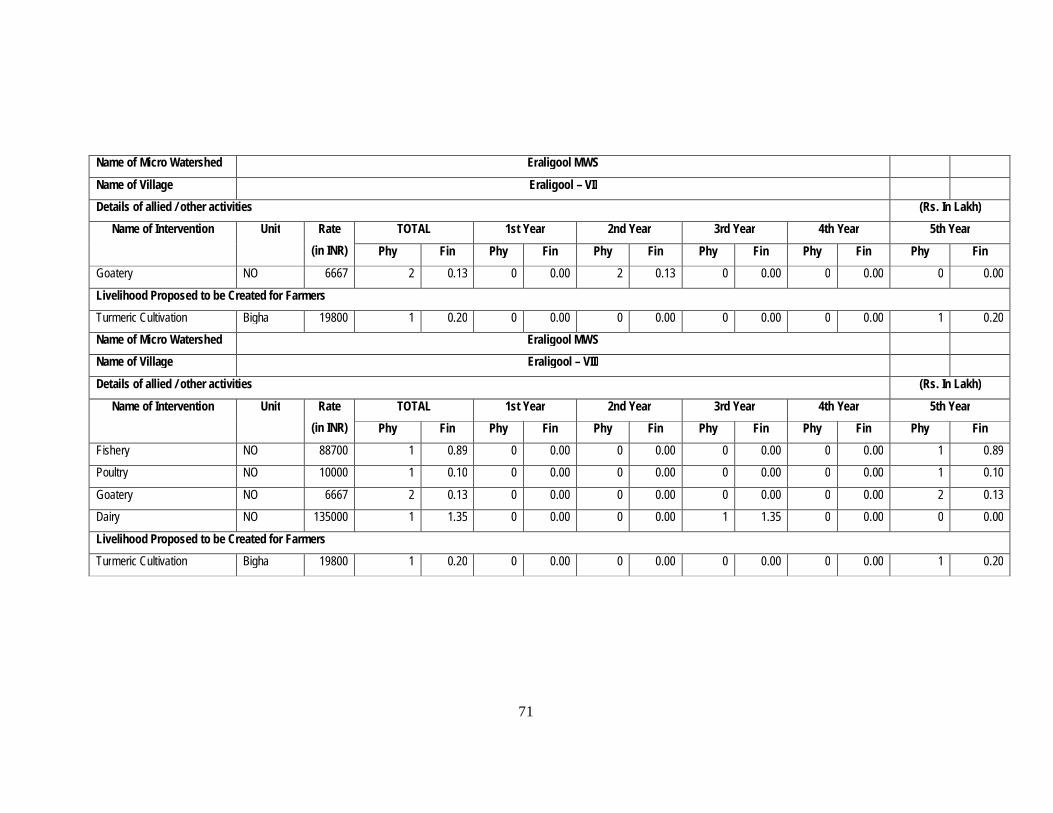
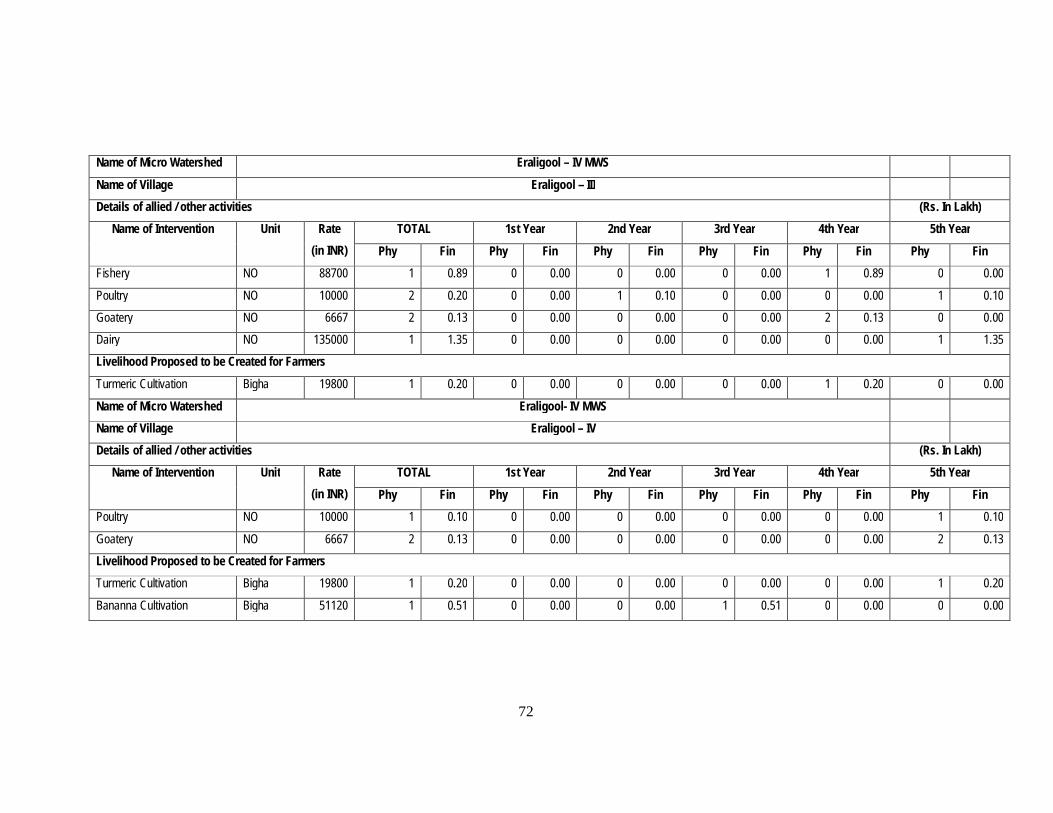
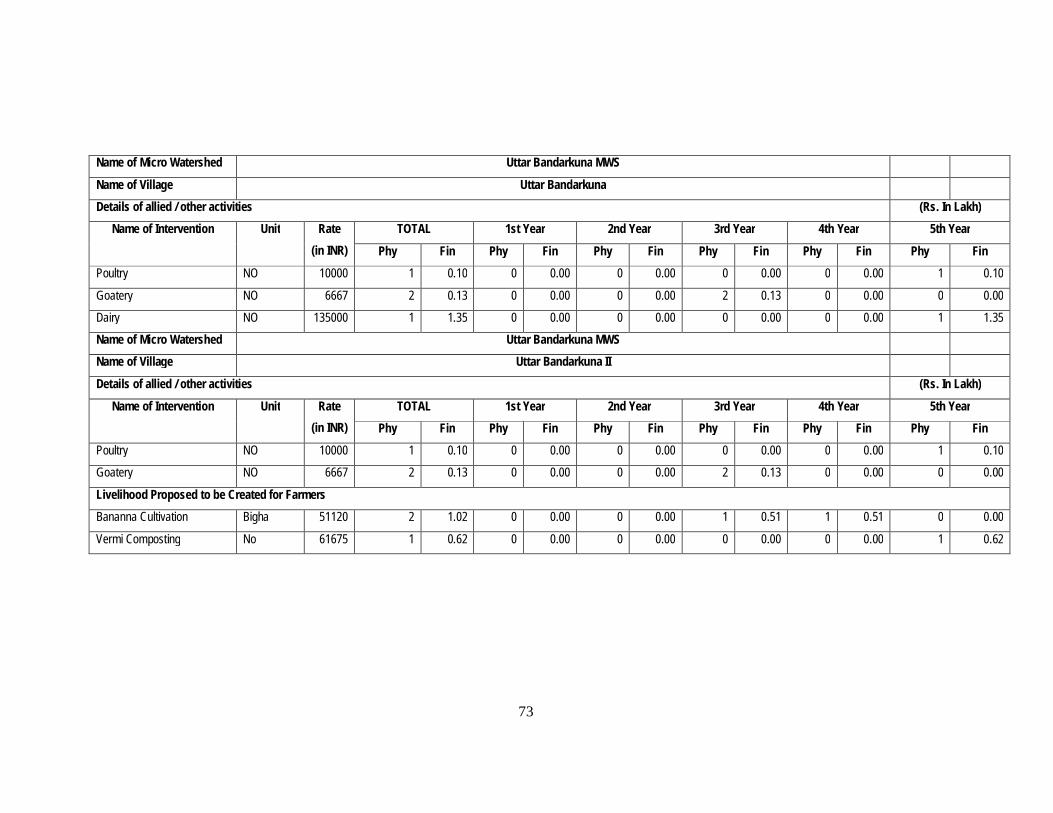
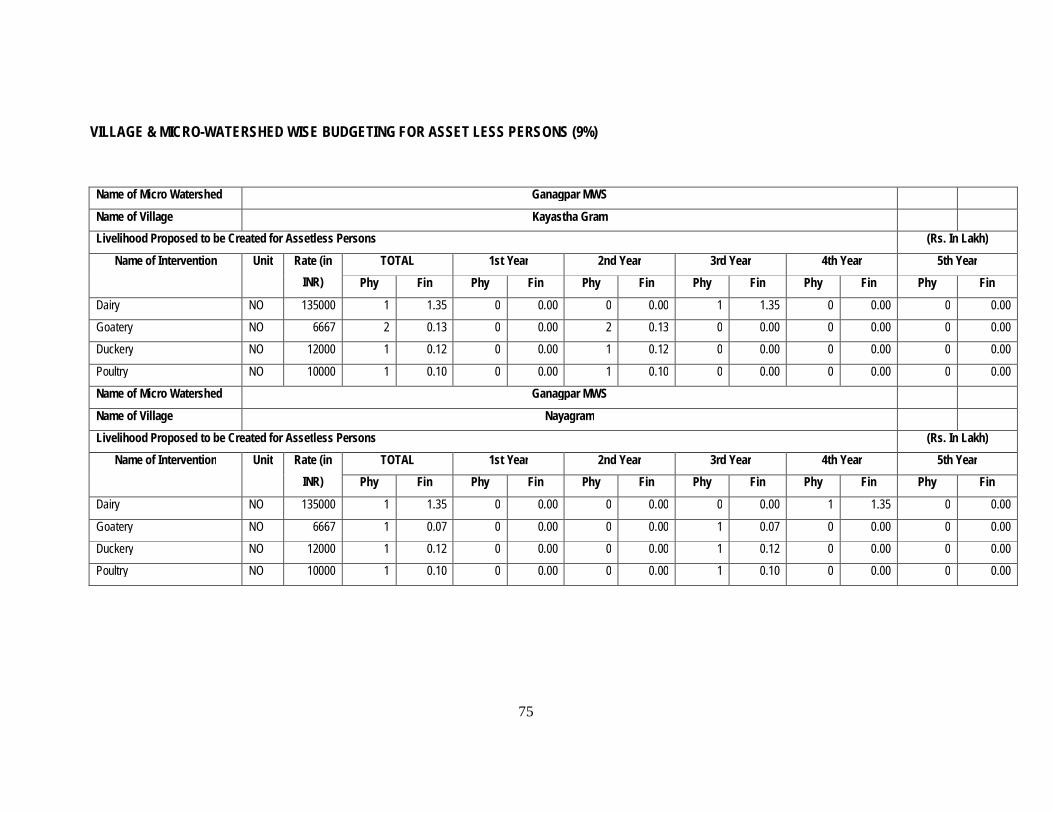
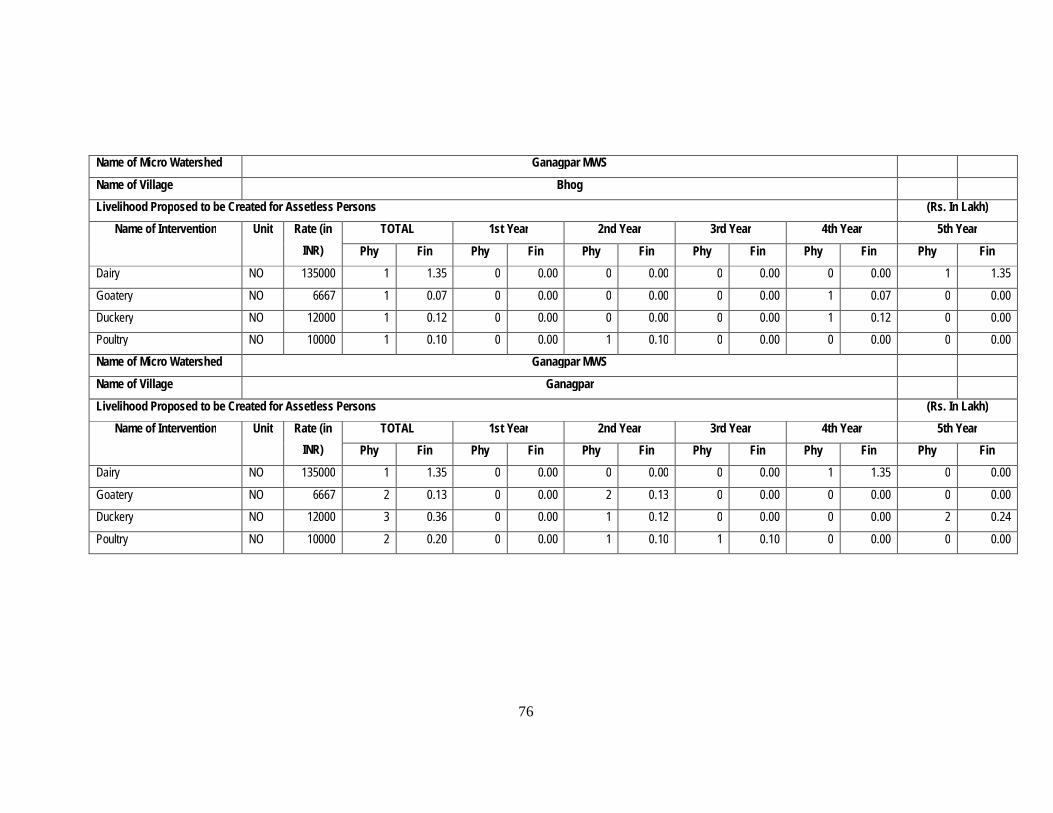
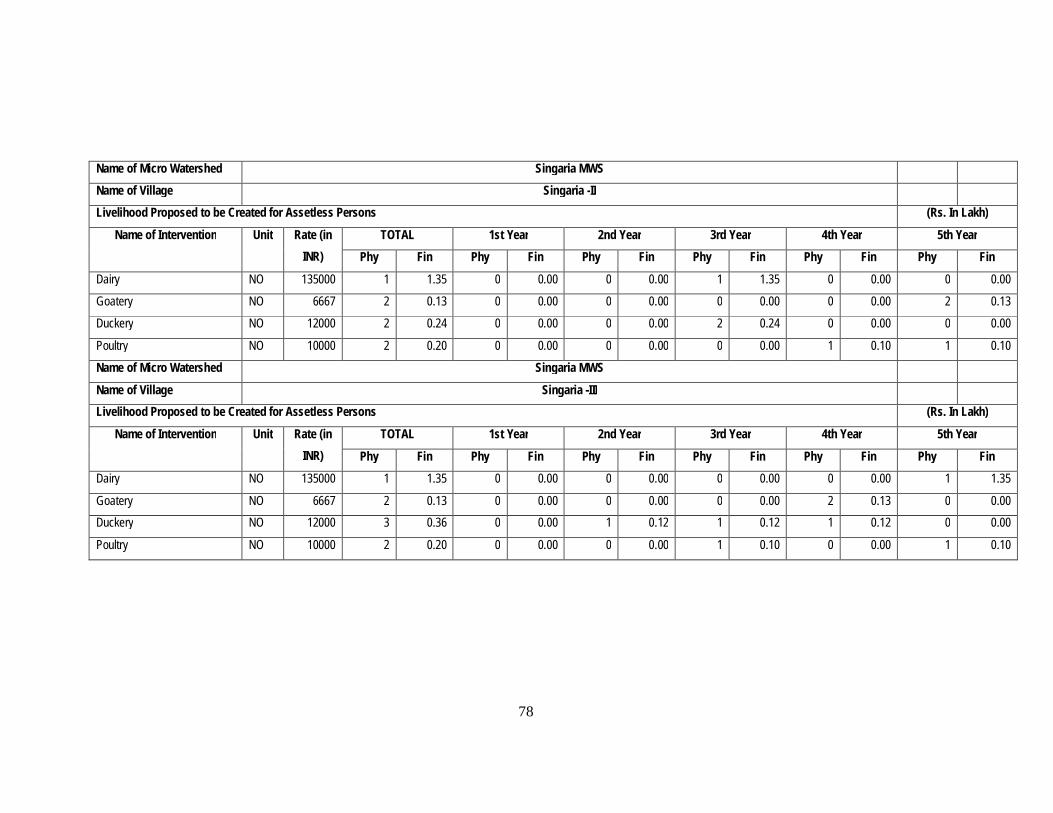
1. Promotion of Marketing facilities through SHG 2. Promotion of Dairy, Piggery, goatery, Duckery
and Poultry farming activities.
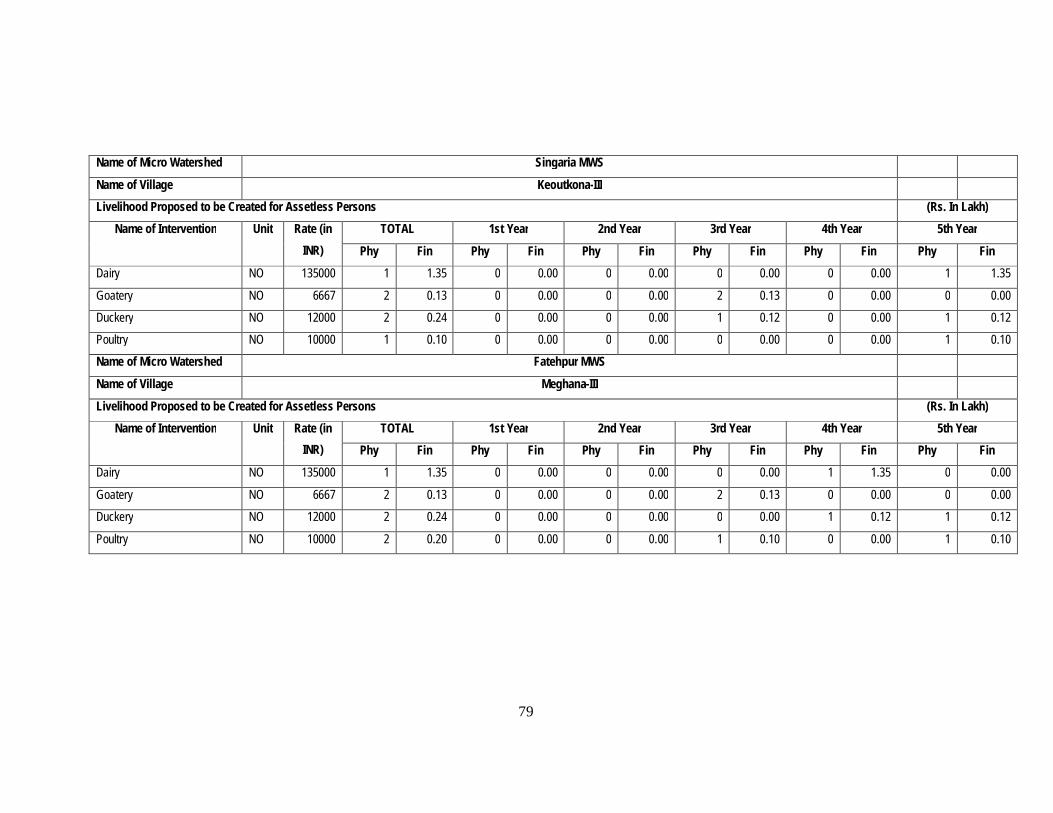
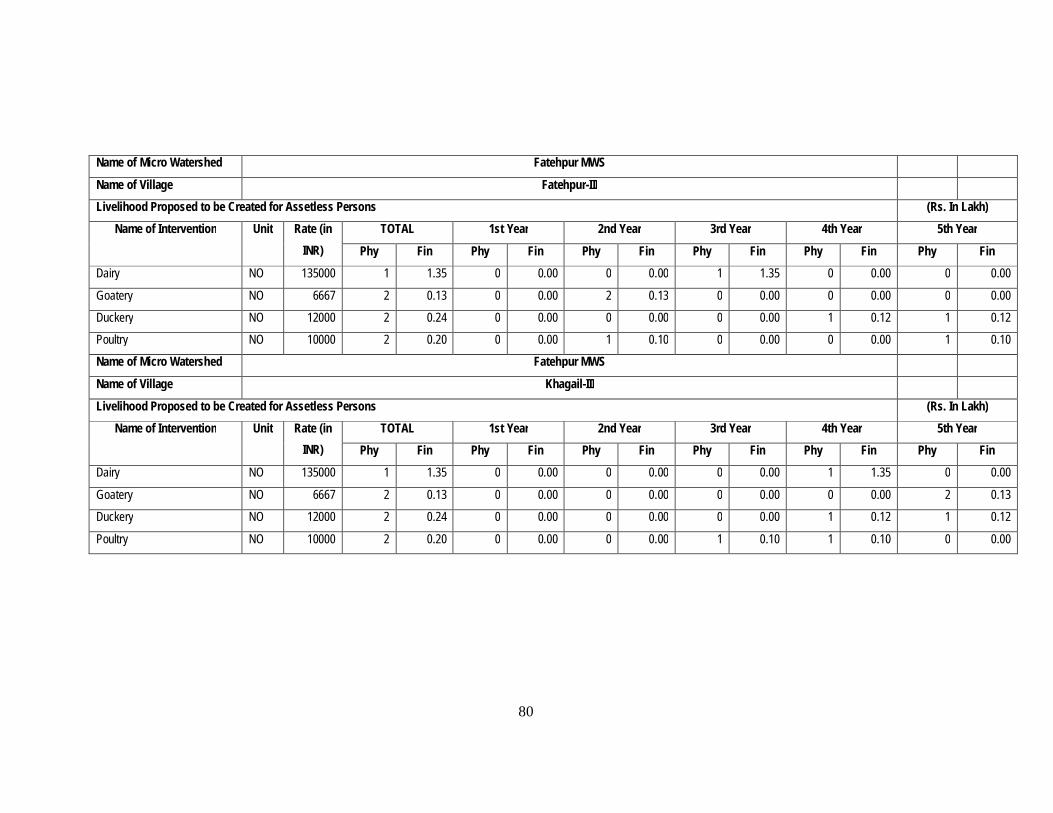
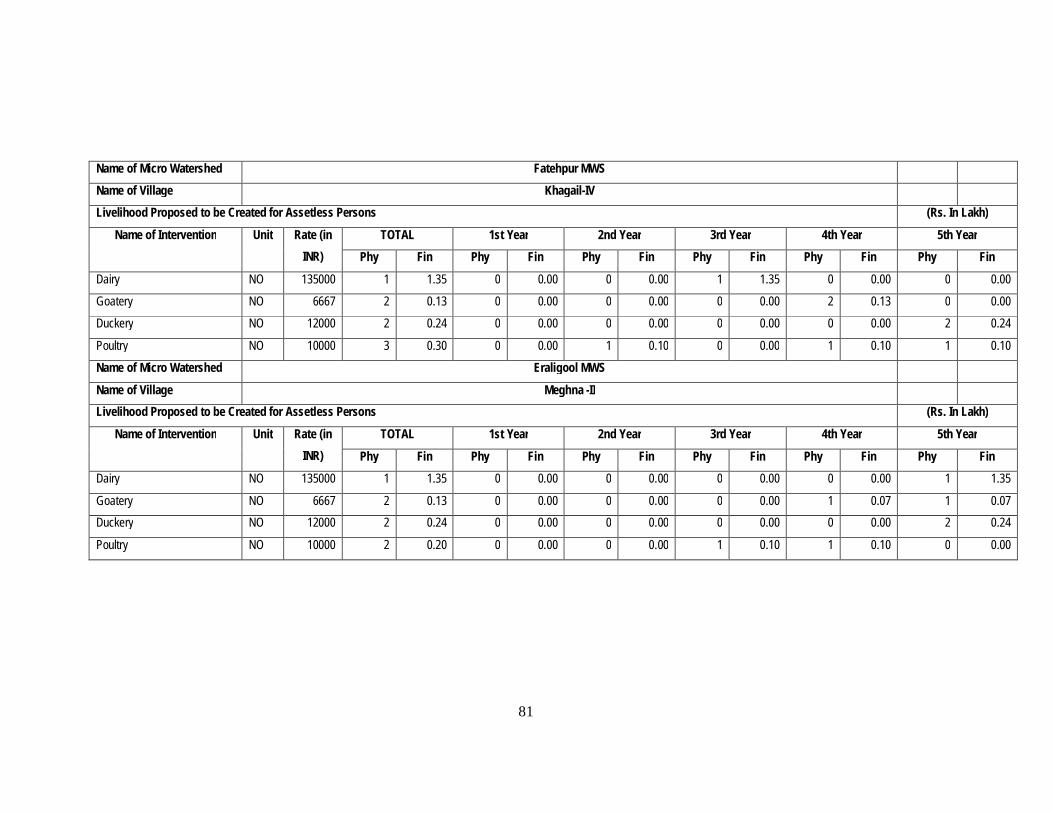
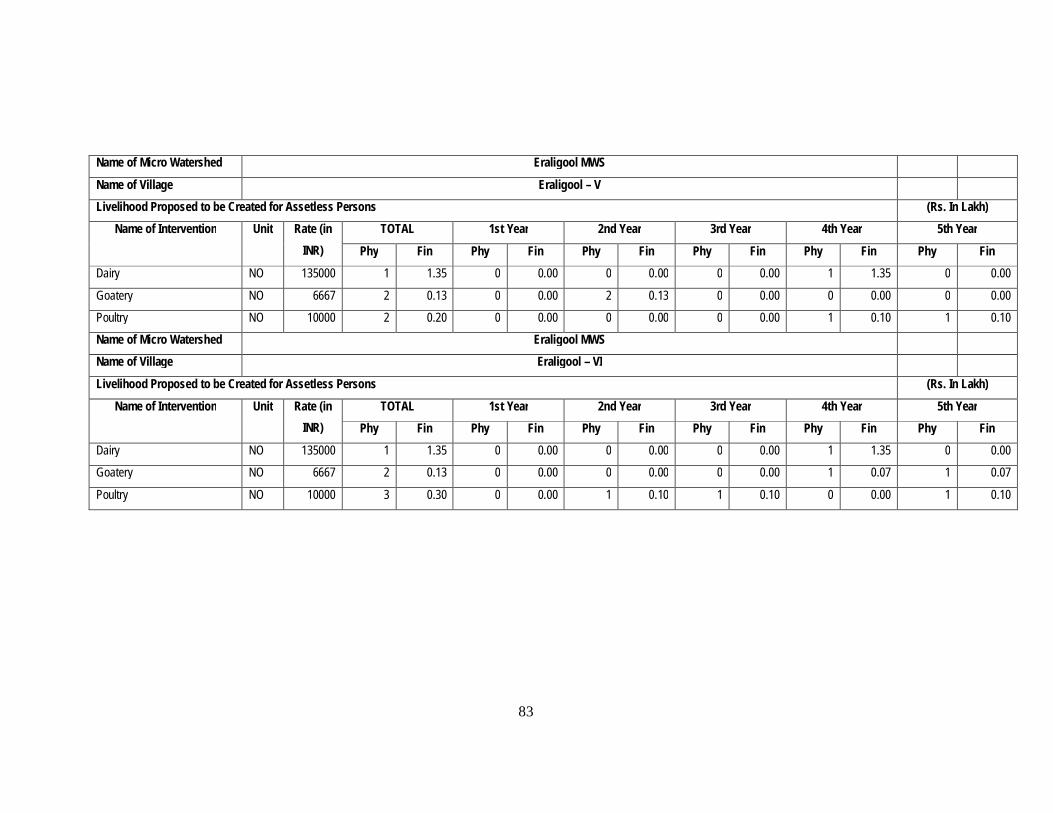
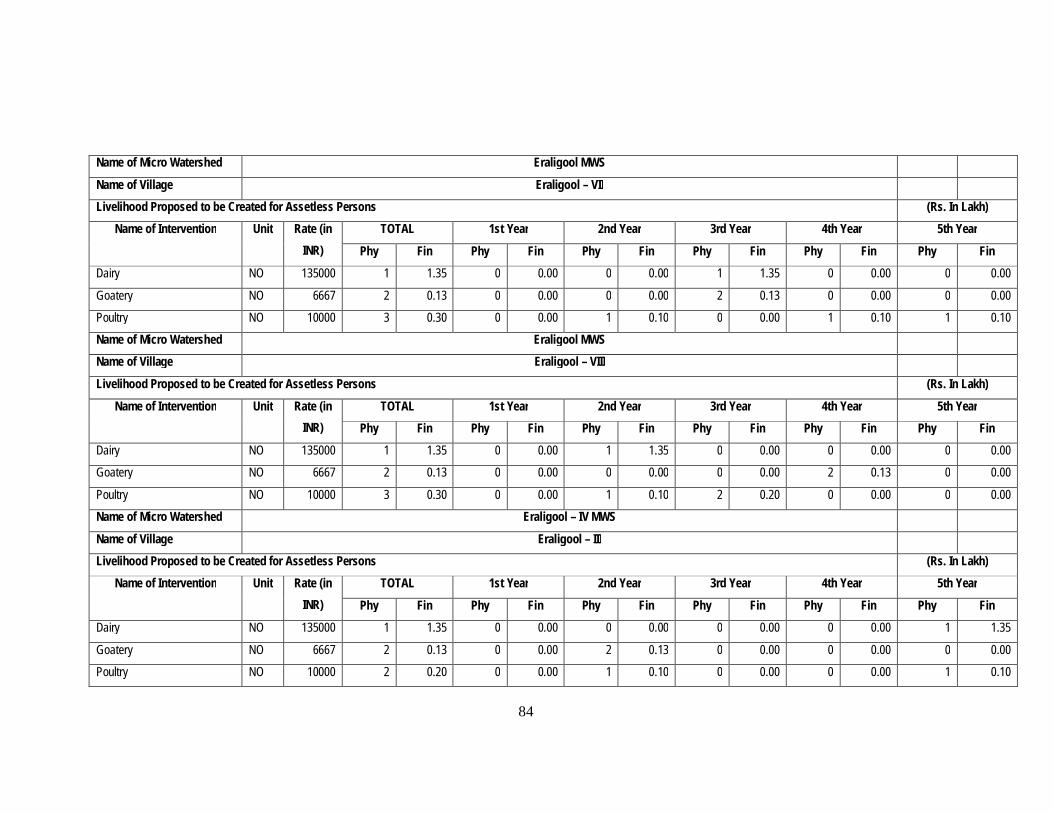
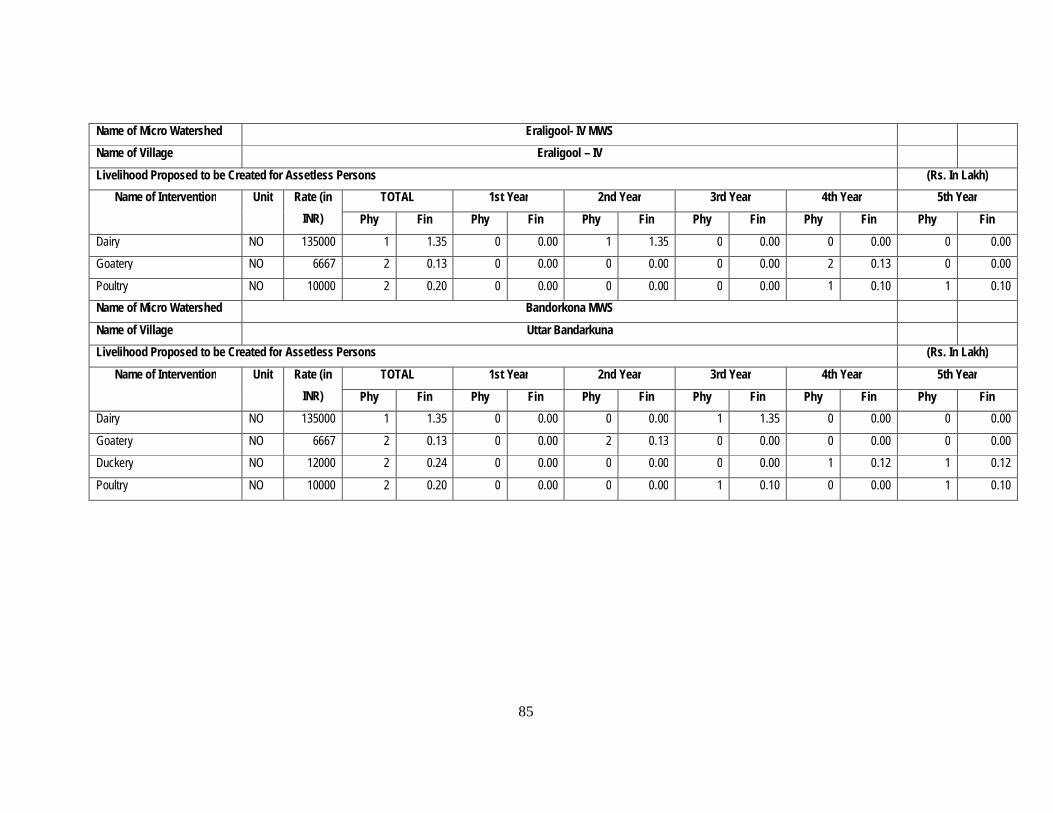
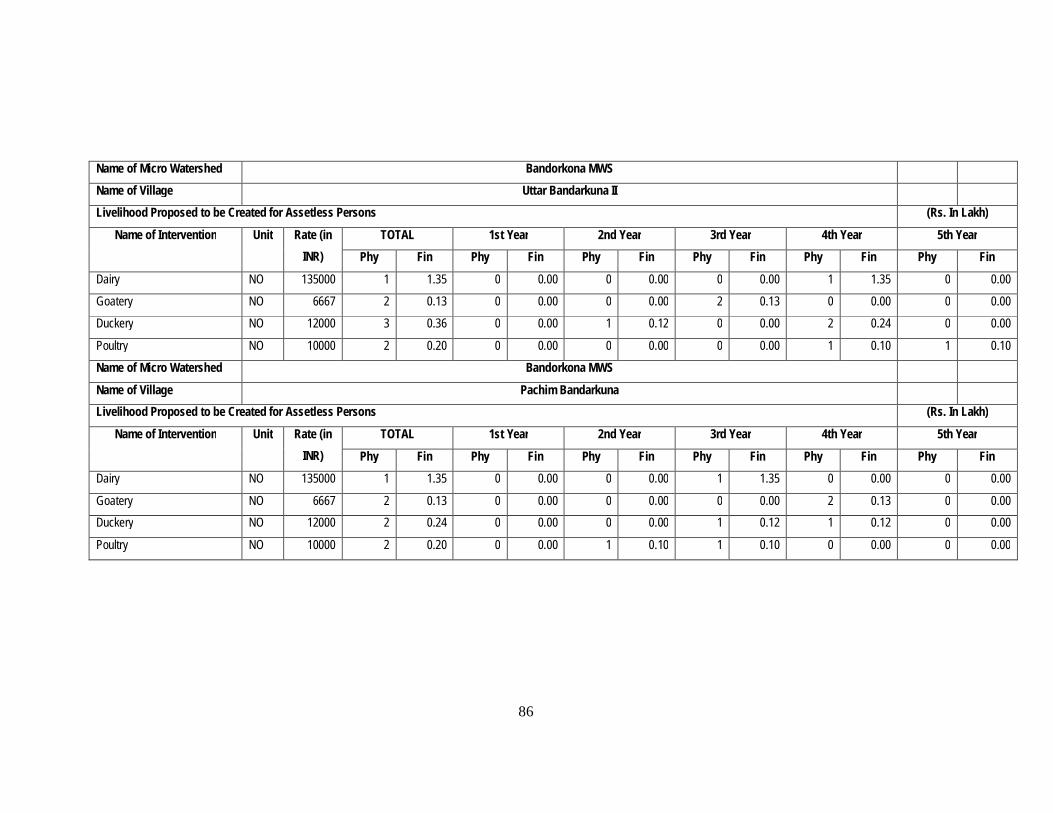
6 Existing Livelihood activities for Asset less persons
1. Less income generating unsustained activities. 2. Their present occupation is Daily Labour, Rikswa
Pullers etc.
1. Promotion of Dairy, Piggery, goaery, Duckery and Poultry farming activities.
2. Promotion of weaving activities for asset less woman.
7 Community Based Organizations & Social capital base
1. Most of the SHGs are not functional. 1. Formation of SHG, User groups for promotion of various income generating activities
8 Capacity Building (participation, training, awareness of watershed community
1. In many villages it is observed that the Participation in Gram Sabha is very low due to lack of awareness towards watershed development activities.
1. Conducting Awareness programmes among the villagers.
2. Providing training in respect to each activities proposed for watershed development as well as livelihood generation.
9 Others (specify) 1. Lack of Marketing and treading Facilities 1. Providing Market Promotion Centres along with Low Cost go-down for storage of various products.
30
CHAPTER – 4 Institutional Building and Project Management
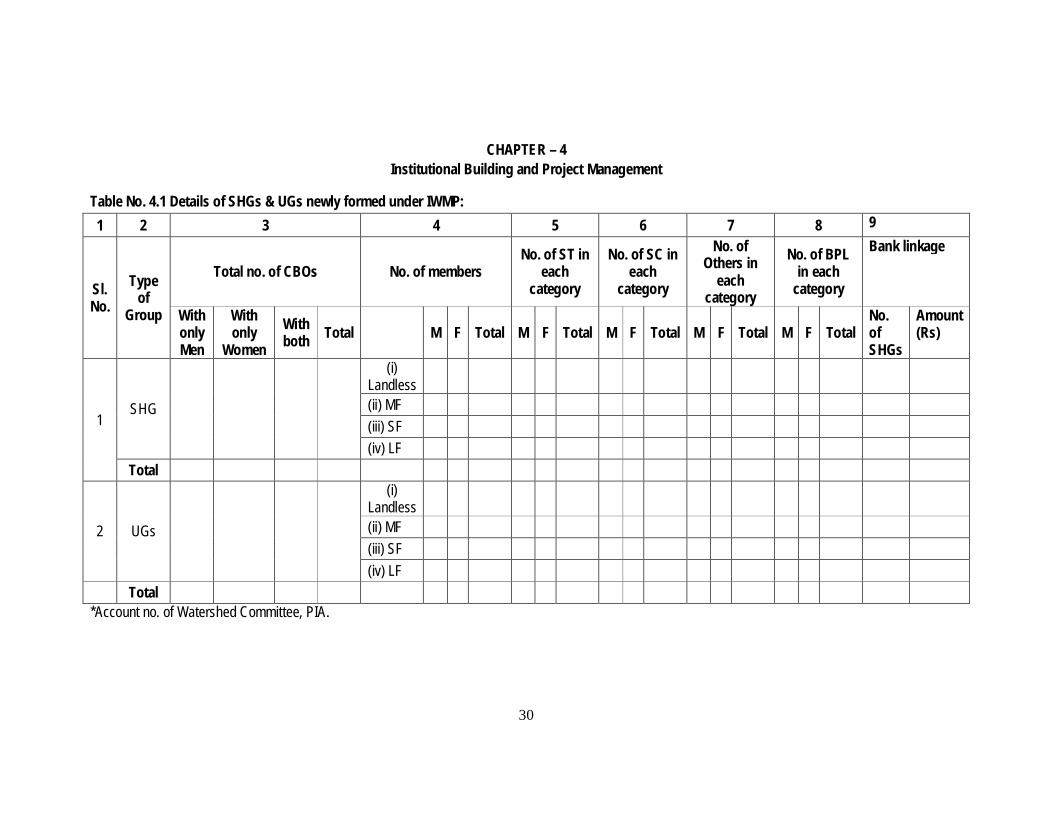
Table No. 4.1 Details of SHGs & UGs newly formed under IWMP: 1 2 3 4 5 6 7 8 9
Sl. No.
Type of
Group
Total no. of CBOs No. of members No. of ST in
each category
No. of SC in each
category
No. of Others in
each category
No. of BPL in each
category
Bank linkage
With only Men
With only
Women With both Total M F Total M F Total M F Total M F Total M F Total
(NOTE- Member wise details of SHGs, UGs & Watershed Committee has to be enclosed as annexures. The details includes the Name, Husband name and Caste)
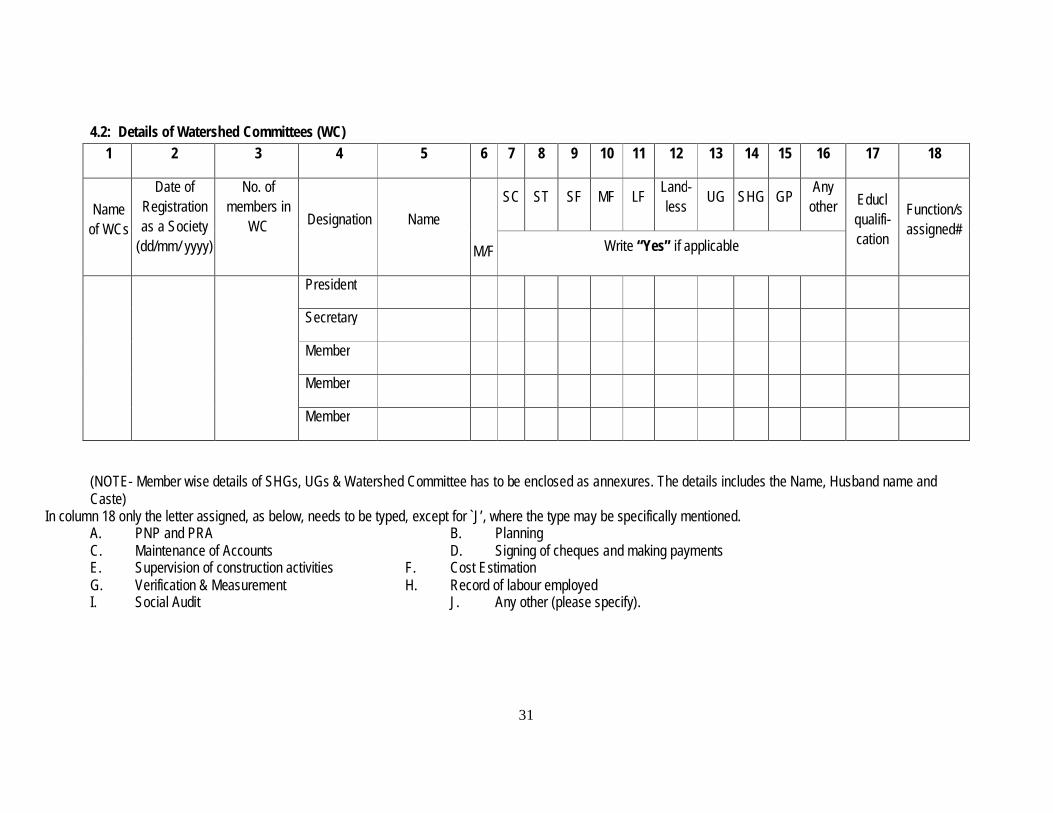
In column 18 only the letter assigned, as below, needs to be typed, except for `J’, where the type may be specifically mentioned. A. PNP and PRA B. Planning C. Maintenance of Accounts D. Signing of cheques and making payments E. Supervision of construction activities F. Cost Estimation G. Verification & Measurement H. Record of labour employed I. Social Audit J. Any other (please specify).
32
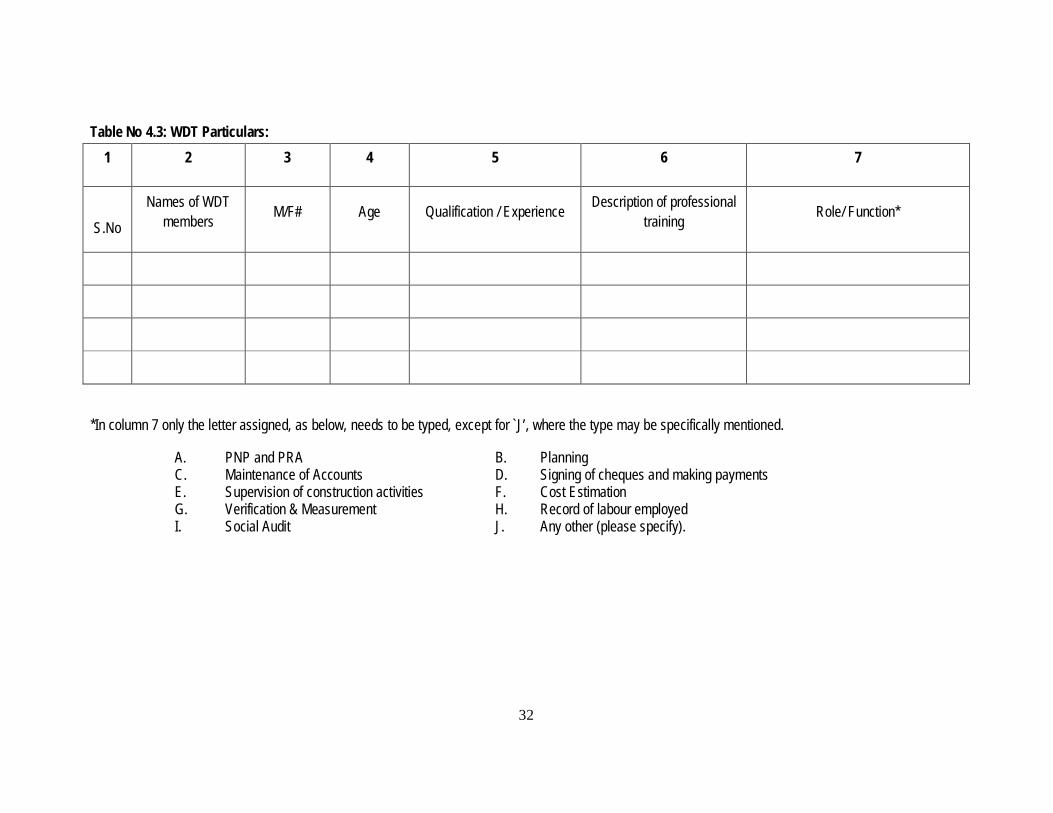
Table No 4.3: WDT Particulars: 1 2 3 4 5 6 7
S.No
Names of WDT members M/F# Age Qualification / Experience Description of professional
training Role/ Function*
*In column 7 only the letter assigned, as below, needs to be typed, except for `J’, where the type may be specifically mentioned.
A. PNP and PRA B. Planning C. Maintenance of Accounts D. Signing of cheques and making payments E. Supervision of construction activities F. Cost Estimation G. Verification & Measurement H. Record of labour employed I. Social Audit J. Any other (please specify).
33
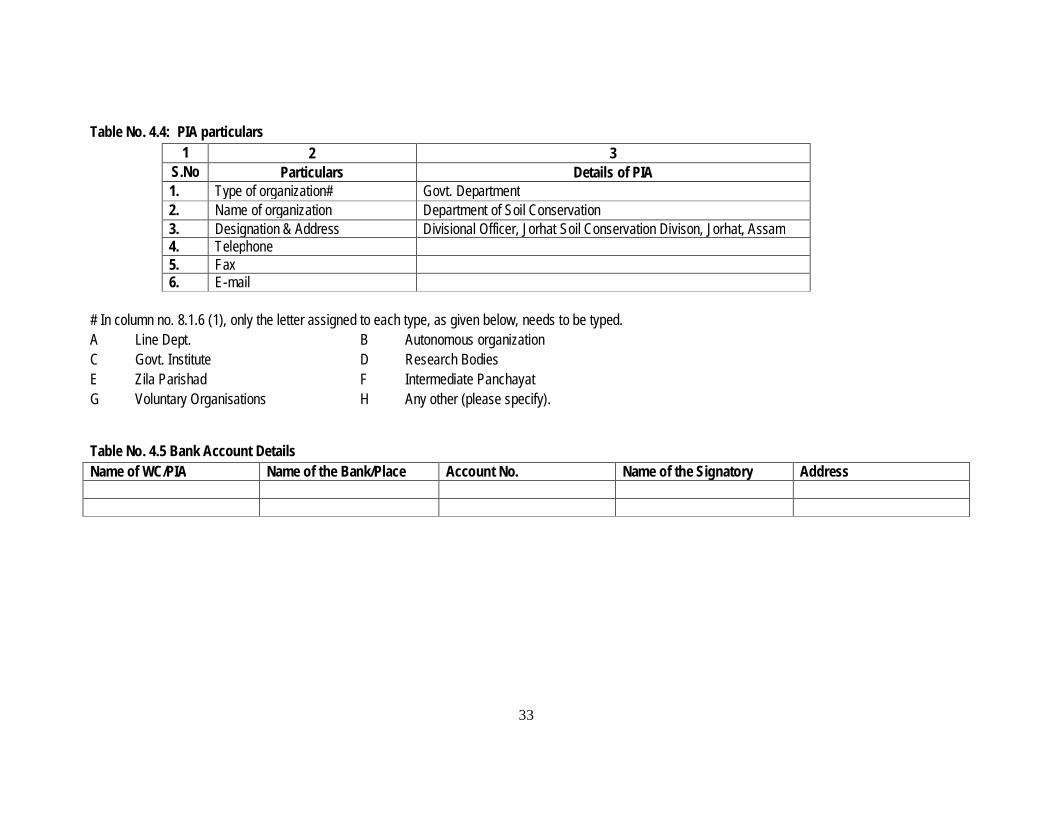
Table No. 4.4: PIA particulars 1 2 3
S.No Particulars Details of PIA 1. Type of organization# Govt. Department 2. Name of organization Department of Soil Conservation 3. Designation & Address Divisional Officer, Jorhat Soil Conservation Divison, Jorhat, Assam 4. Telephone 5. Fax 6. E-mail
# In column no. 8.1.6 (1), only the letter assigned to each type, as given below, needs to be typed. A Line Dept. B Autonomous organization C Govt. Institute D Research Bodies E Zila Parishad F Intermediate Panchayat G Voluntary Organisations H Any other (please specify).
Table No. 4.5 Bank Account Details Name of WC/PIA Name of the Bank/Place Account No. Name of the Signatory Address
34
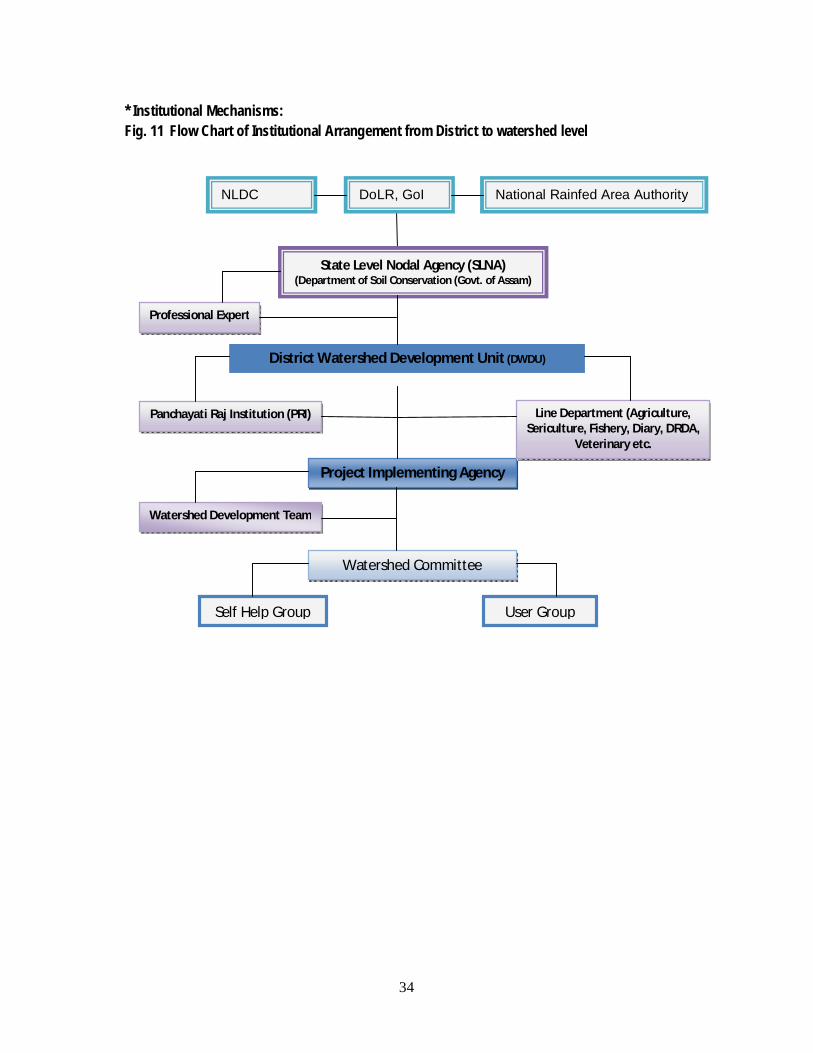
* Institutional Mechanisms: Fig. 11 Flow Chart of Institutional Arrangement from District to watershed level
National Rainfed Area Authority
State Level Nodal Agency (SLNA) (Department of Soil Conservation (Govt. of Assam)
Professional Expert
District Watershed Development Unit (DWDU)
Project Implementing Agency
Watershed Development Team
Watershed Committee
Self Help Group User Group
Panchayati Raj Institution (PRI) Line Department (Agriculture, Sericulture, Fishery, Diary, DRDA,
Veterinary etc.
DoLR, GoI NLDC
35
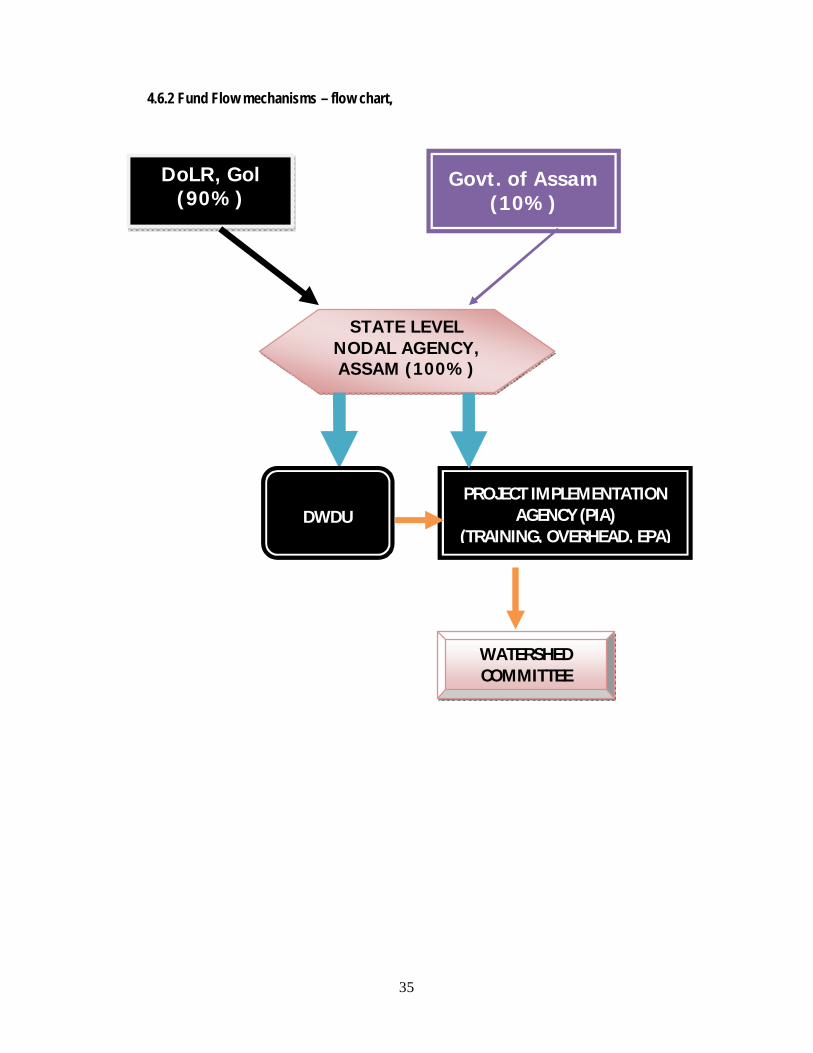
4.6.2 Fund Flow mechanisms – flow chart,
DoLR, Gol (90%)
Govt. of Assam (10%)
STATE LEVEL NODAL AGENCY, ASSAM (100%)
PROJECT IMPLEMENTATION AGENCY (PIA)
(TRAINING, OVERHEAD, EPA)
WATERSHED COMMITTEE
DWDU
36
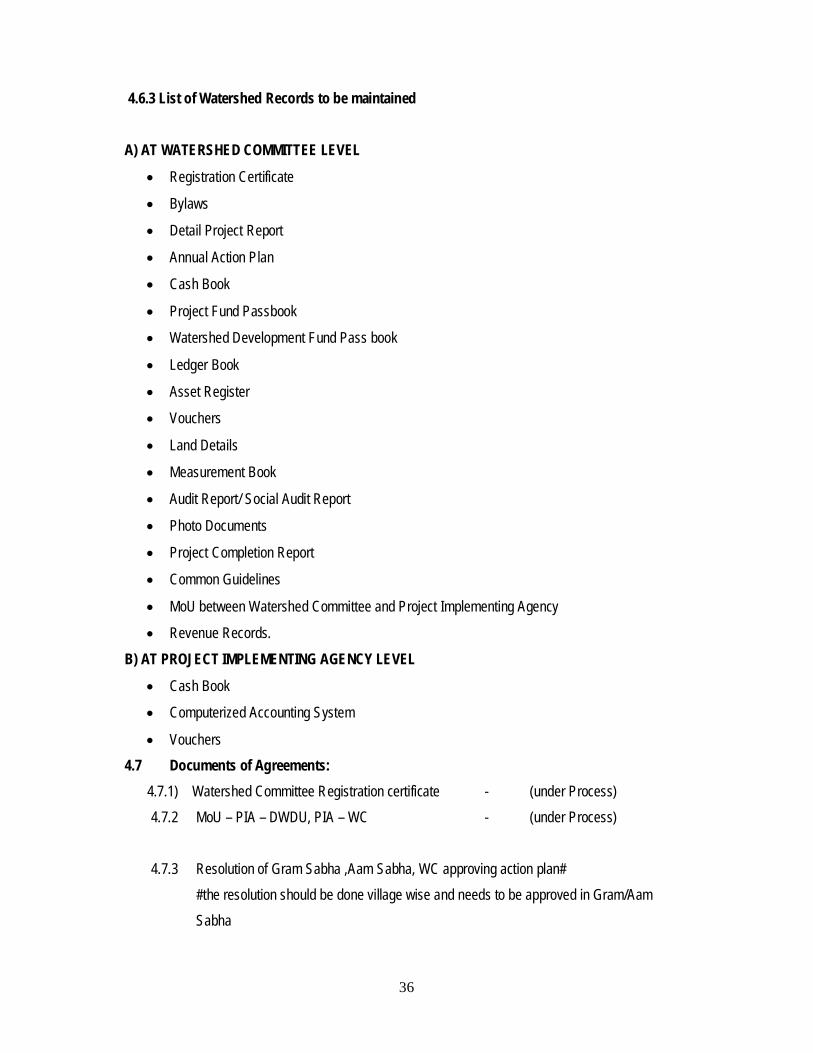
4.6.3 List of Watershed Records to be maintained A) AT WATERSHED COMMITTEE LEVEL
Registration Certificate
Bylaws
Detail Project Report
Annual Action Plan
Cash Book
Project Fund Passbook
Watershed Development Fund Pass book
Ledger Book
Asset Register
Vouchers
Land Details
Measurement Book
Audit Report/ Social Audit Report
Photo Documents
Project Completion Report
Common Guidelines
MoU between Watershed Committee and Project Implementing Agency
Revenue Records.
B) AT PROJECT IMPLEMENTING AGENCY LEVEL
Cash Book
Computerized Accounting System
Vouchers 4.7 Documents of Agreements:
4.7.1) Watershed Committee Registration certificate - (under Process) 4.7.2 MoU – PIA – DWDU, PIA – WC - (under Process)
4.7.3 Resolution of Gram Sabha ,Aam Sabha, WC approving action plan# #the resolution should be done village wise and needs to be approved in Gram/Aam Sabha
37
4.8 Project Implementation Project Implementation involves a number of activities,of which the major are - securing community participation, co-ordination of activities and project management & Controlling, Monitoring. Co-ordination is the practice whereby more people or organizations work together to deal collectively with a shared objective. The rationale for co-ordination shall be-
1. To take immediate curative action for problems encountered in implementation of the project. 2. To promote better relationship among organizations, institution,agencies, departments and
individuals connected with the project and to harmonies resources and activities for the achievements of the project objectives.
3. To establish cordial relationship between the target population of the project and all the other segments of the society.
4. Team building, which includes recruiting people with appropriate qualification and capability for positions in the organization, orienting new people to their position to help them learn about their responsibilities and providing training when necessary to upgrade people’s skills.
Project Management & Controlling means managing activities to ensure progress towards the project objectives. 1. Evaluating the progress of project by comparing the current situation with established goals
and objectives. 2. Submitting reports to account for project activities and finance 3. Monitoring performance to document the way people carry out their responsibilities.
4. Providing feedback to people on a regular, informal basis including optimistic feedback and constructive criticism.
5. Adjusting plans to respond the changes in the internal and external organizational environment.
Monitoring is an important stage of project implementation and it implies the process of routinely gathering information on all aspects of the project. The first level monitoring shall be done by the project staff. The DWDU and PIA shall be responsible for monitoring the staff and task under them and Project Manager shall be accountable for monitoring all aspects of the project. The second level monitoring shall be done by third party. The monitoring team shall be collected the report through field visit, progress and measures performance including financial reporting.
38
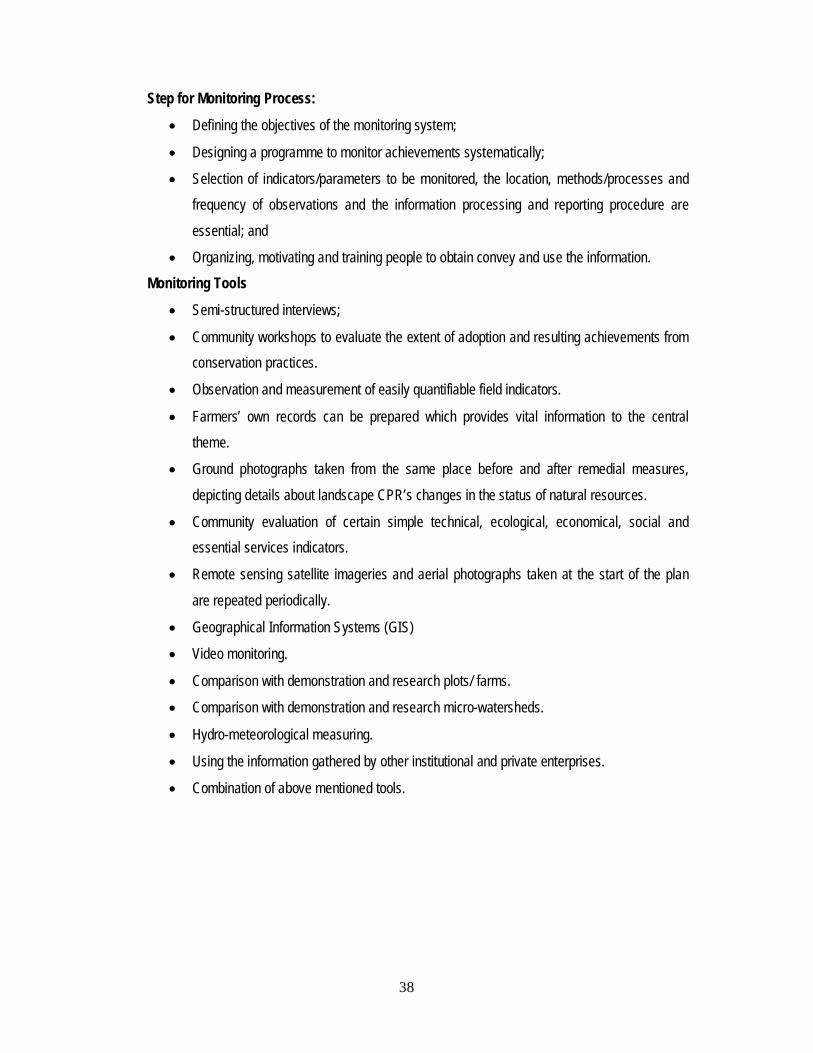
Step for Monitoring Process:
Defining the objectives of the monitoring system;
Designing a programme to monitor achievements systematically;
Selection of indicators/parameters to be monitored, the location, methods/processes and frequency of observations and the information processing and reporting procedure are
essential; and
Organizing, motivating and training people to obtain convey and use the information. Monitoring Tools
Semi-structured interviews;
Community workshops to evaluate the extent of adoption and resulting achievements from conservation practices.
Observation and measurement of easily quantifiable field indicators.
Farmers’ own records can be prepared which provides vital information to the central theme.
Ground photographs taken from the same place before and after remedial measures,
depicting details about landscape CPR’s changes in the status of natural resources.
Community evaluation of certain simple technical, ecological, economical, social and essential services indicators.
Remote sensing satellite imageries and aerial photographs taken at the start of the plan
are repeated periodically.
Geographical Information Systems (GIS)
Video monitoring.
Comparison with demonstration and research plots/ farms.
Comparison with demonstration and research micro-watersheds.
Hydro-meteorological measuring.
Using the information gathered by other institutional and private enterprises.
Combination of above mentioned tools.
39
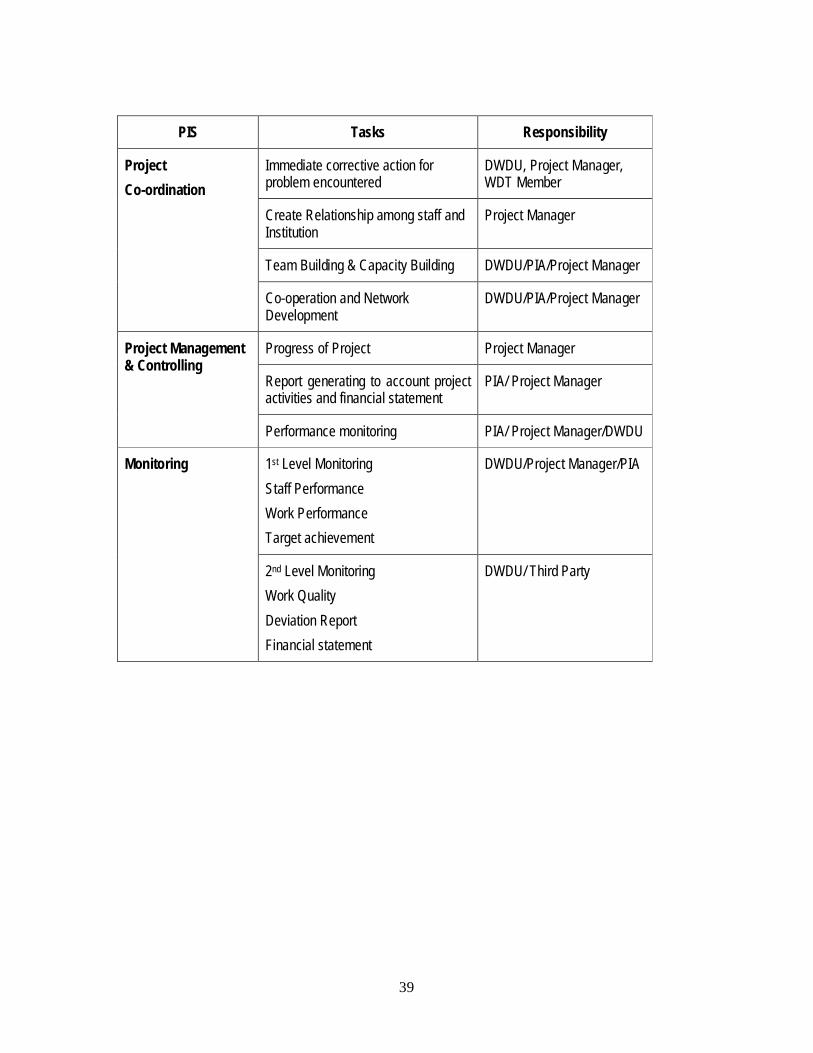
PIS Tasks Responsibility
Project Co-ordination
Immediate corrective action for problem encountered
DWDU, Project Manager, WDT Member
Create Relationship among staff and Institution
Project Manager
Team Building & Capacity Building DWDU/PIA/Project Manager
Co-operation and Network Development
DWDU/PIA/Project Manager
Project Management & Controlling
Progress of Project Project Manager
Report generating to account project activities and financial statement
PIA/ Project Manager
Performance monitoring PIA/ Project Manager/DWDU
Monitoring 1st Level Monitoring Staff Performance Work Performance Target achievement
DWDU/Project Manager/PIA
2nd Level Monitoring Work Quality Deviation Report Financial statement
DWDU/ Third Party
40
CHAPTER – 5
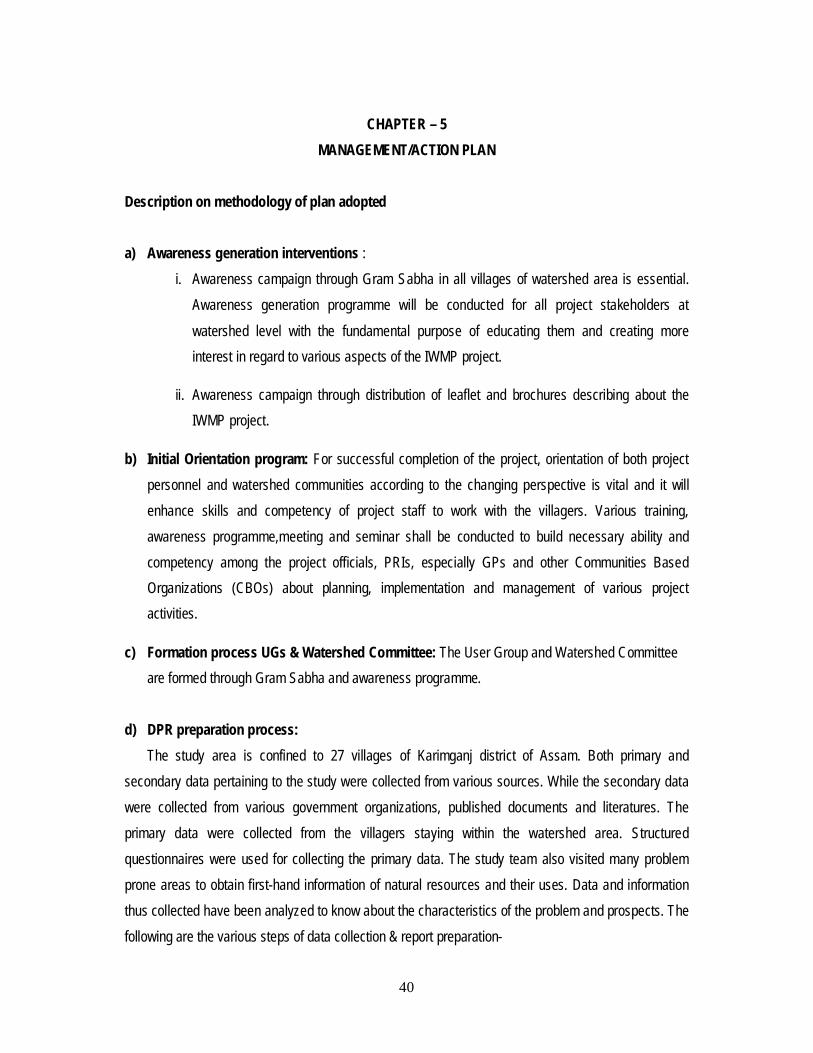
MANAGEMENT/ACTION PLAN Description on methodology of plan adopted a) Awareness generation interventions :
i. Awareness campaign through Gram Sabha in all villages of watershed area is essential. Awareness generation programme will be conducted for all project stakeholders at
watershed level with the fundamental purpose of educating them and creating more interest in regard to various aspects of the IWMP project.
ii. Awareness campaign through distribution of leaflet and brochures describing about the IWMP project.
b) Initial Orientation program: For successful completion of the project, orientation of both project personnel and watershed communities according to the changing perspective is vital and it will enhance skills and competency of project staff to work with the villagers. Various training, awareness programme,meeting and seminar shall be conducted to build necessary ability and competency among the project officials, PRIs, especially GPs and other Communities Based Organizations (CBOs) about planning, implementation and management of various project activities.
c) Formation process UGs & Watershed Committee: The User Group and Watershed Committee are formed through Gram Sabha and awareness programme.
d) DPR preparation process: The study area is confined to 27 villages of Karimganj district of Assam. Both primary and
secondary data pertaining to the study were collected from various sources. While the secondary data were collected from various government organizations, published documents and literatures. The primary data were collected from the villagers staying within the watershed area. Structured questionnaires were used for collecting the primary data. The study team also visited many problem prone areas to obtain first-hand information of natural resources and their uses. Data and information thus collected have been analyzed to know about the characteristics of the problem and prospects. The following are the various steps of data collection & report preparation-
41
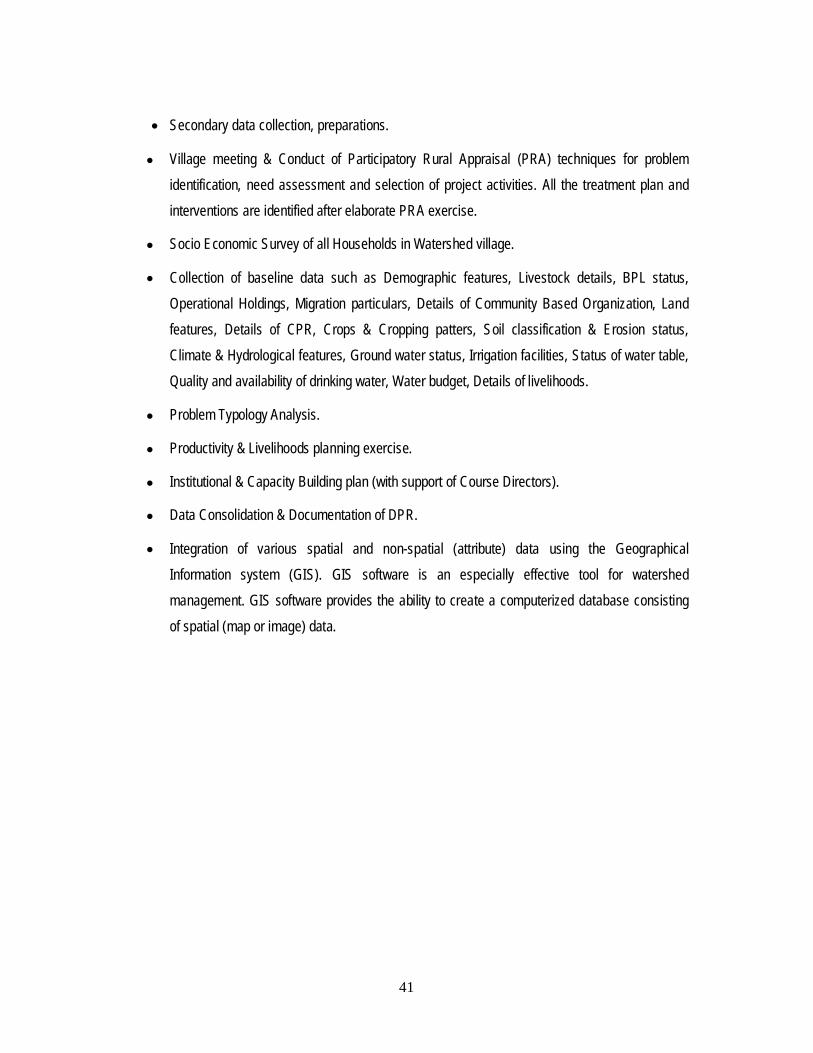
Secondary data collection, preparations.
Village meeting & Conduct of Participatory Rural Appraisal (PRA) techniques for problem identification, need assessment and selection of project activities. All the treatment plan and interventions are identified after elaborate PRA exercise.
Socio Economic Survey of all Households in Watershed village.
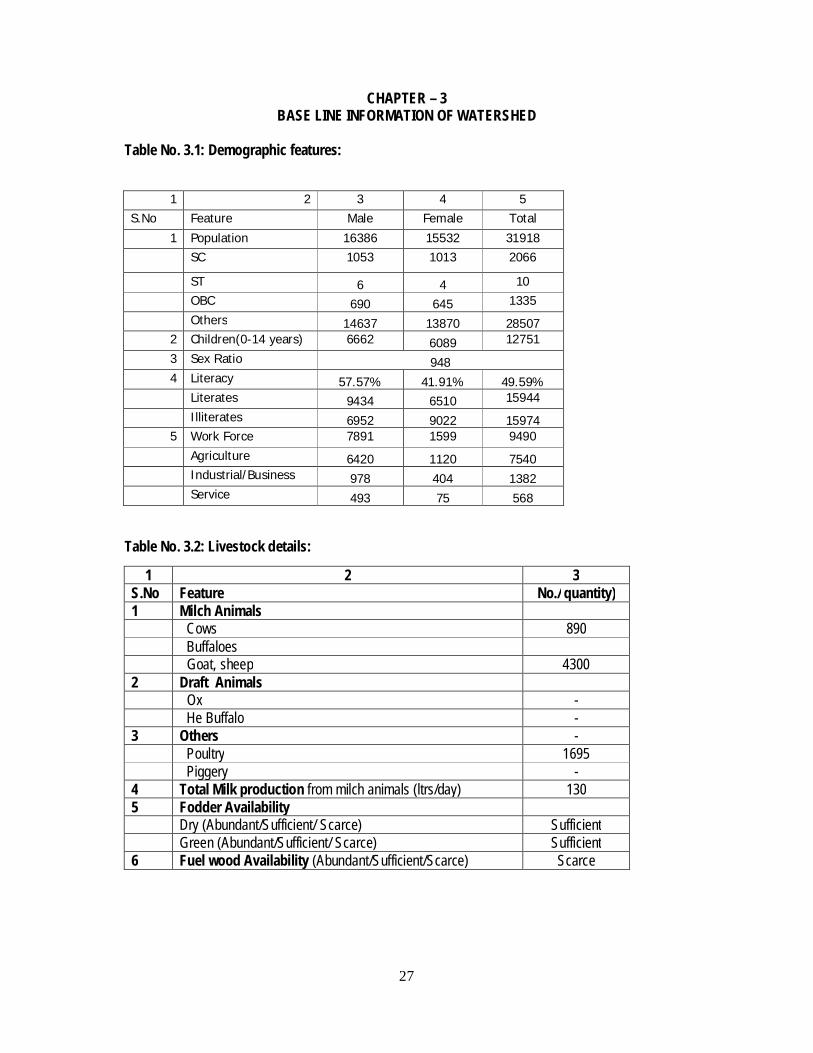
Collection of baseline data such as Demographic features, Livestock details, BPL status, Operational Holdings, Migration particulars, Details of Community Based Organization, Land features, Details of CPR, Crops & Cropping patters, Soil classification & Erosion status, Climate & Hydrological features, Ground water status, Irrigation facilities, Status of water table, Quality and availability of drinking water, Water budget, Details of livelihoods.
Problem Typology Analysis.
Productivity & Livelihoods planning exercise.
Institutional & Capacity Building plan (with support of Course Directors).
Data Consolidation & Documentation of DPR.
Integration of various spatial and non-spatial (attribute) data using the Geographical Information system (GIS). GIS software is an especially effective tool for watershed management. GIS software provides the ability to create a computerized database consisting of spatial (map or image) data.
42
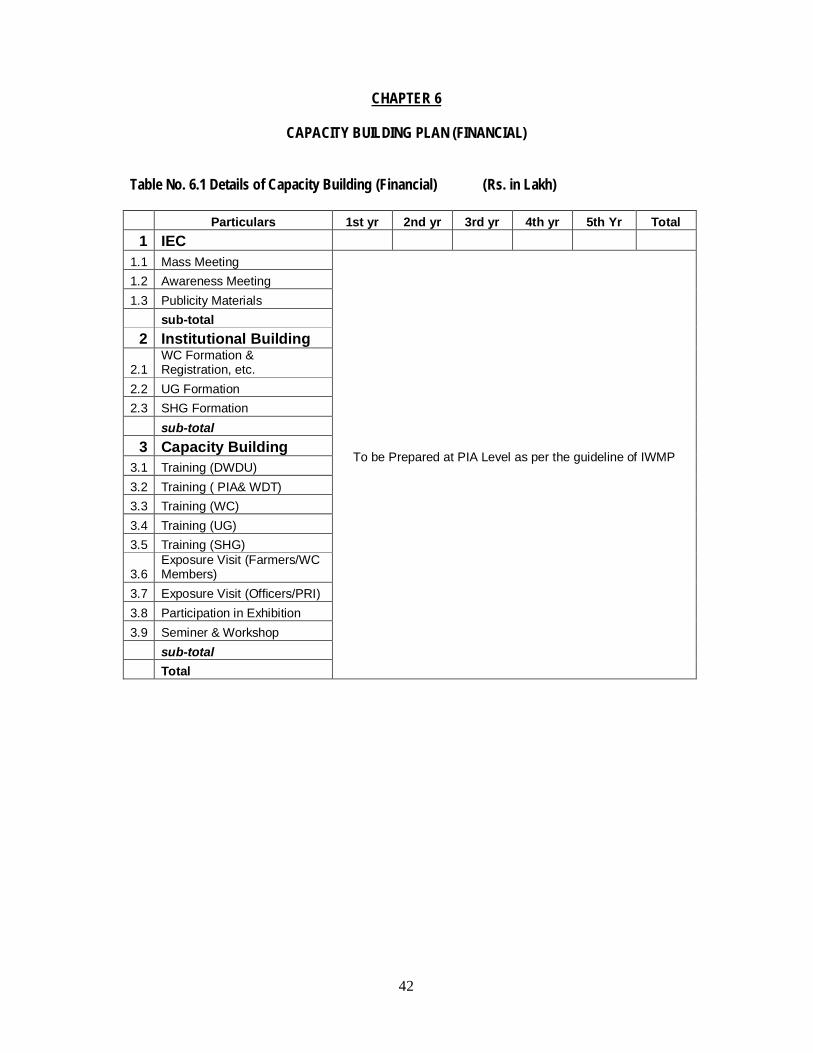
CHAPTER 6
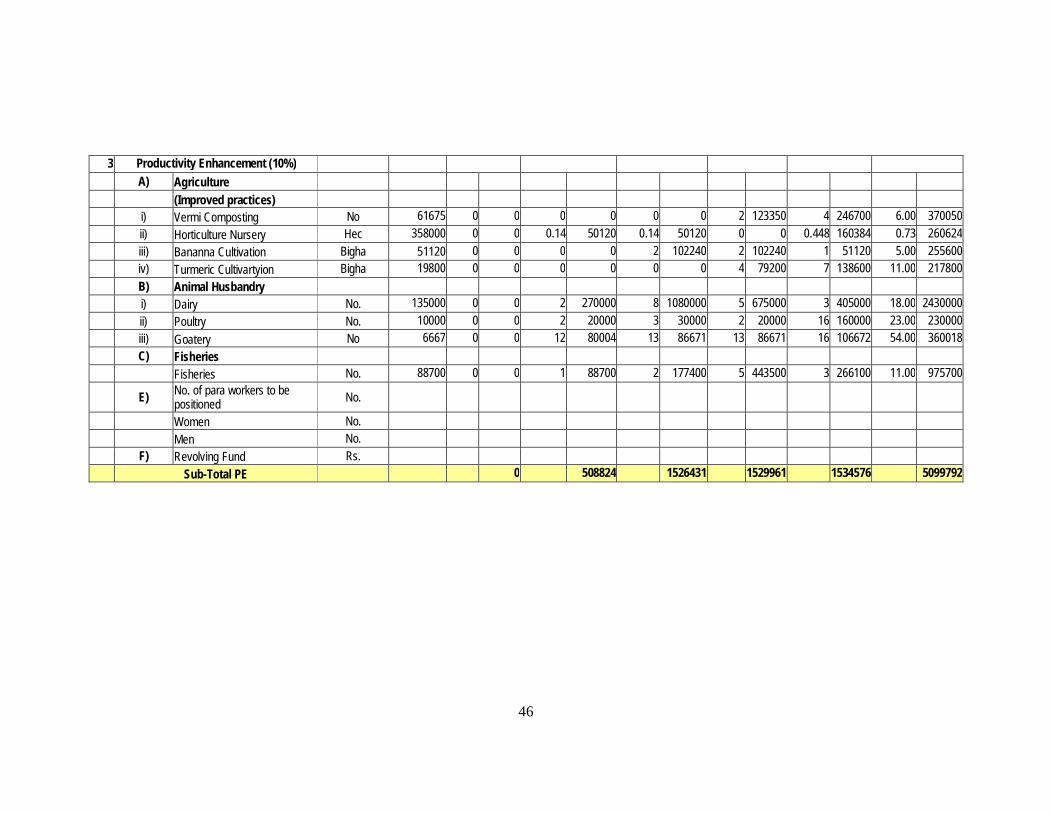
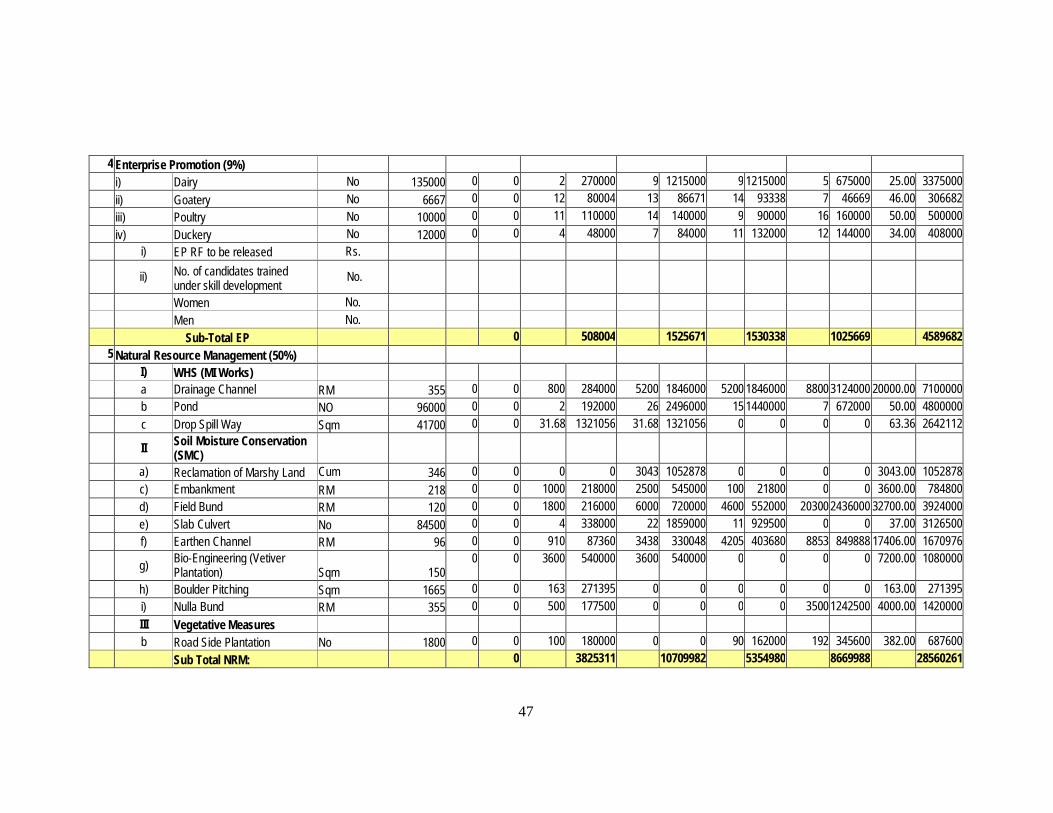
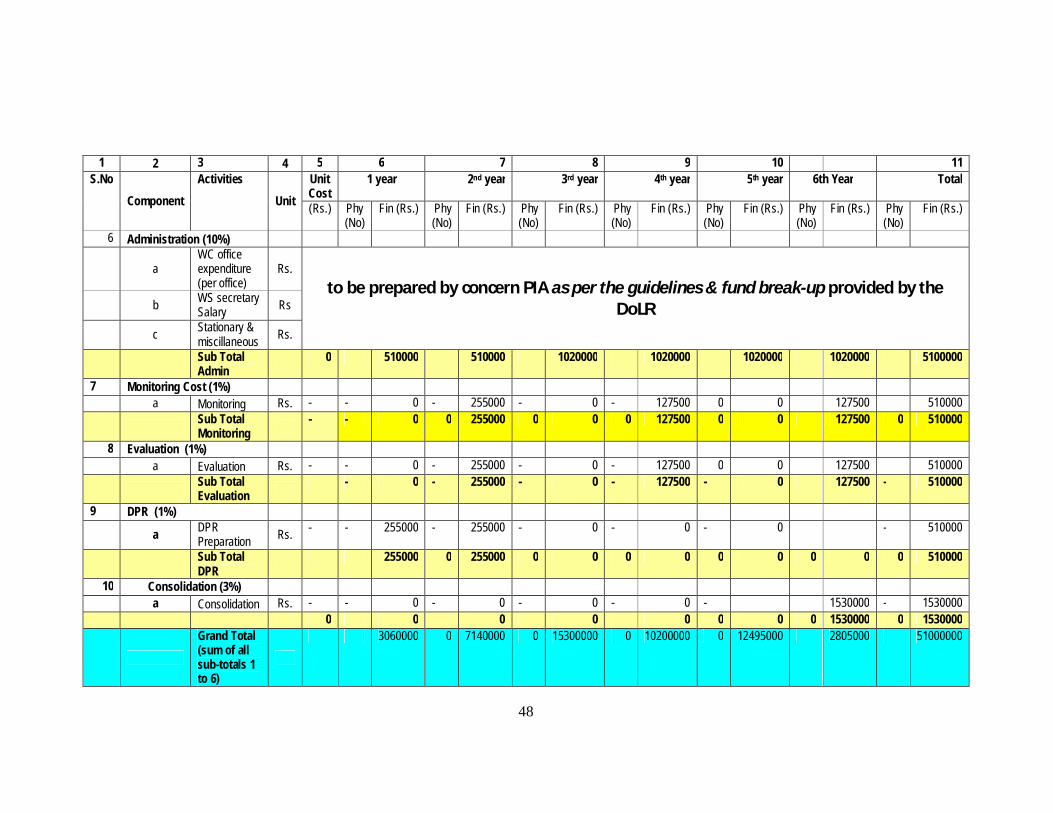
CAPACITY BUILDING PLAN (FINANCIAL) Table No. 6.1 Details of Capacity Building (Financial) (Rs. in Lakh) Particulars 1st yr 2nd yr 3rd yr 4th yr 5th Yr Total
1 IEC 1.1 Mass Meeting
To be Prepared at PIA Level as per the guideline of IWMP
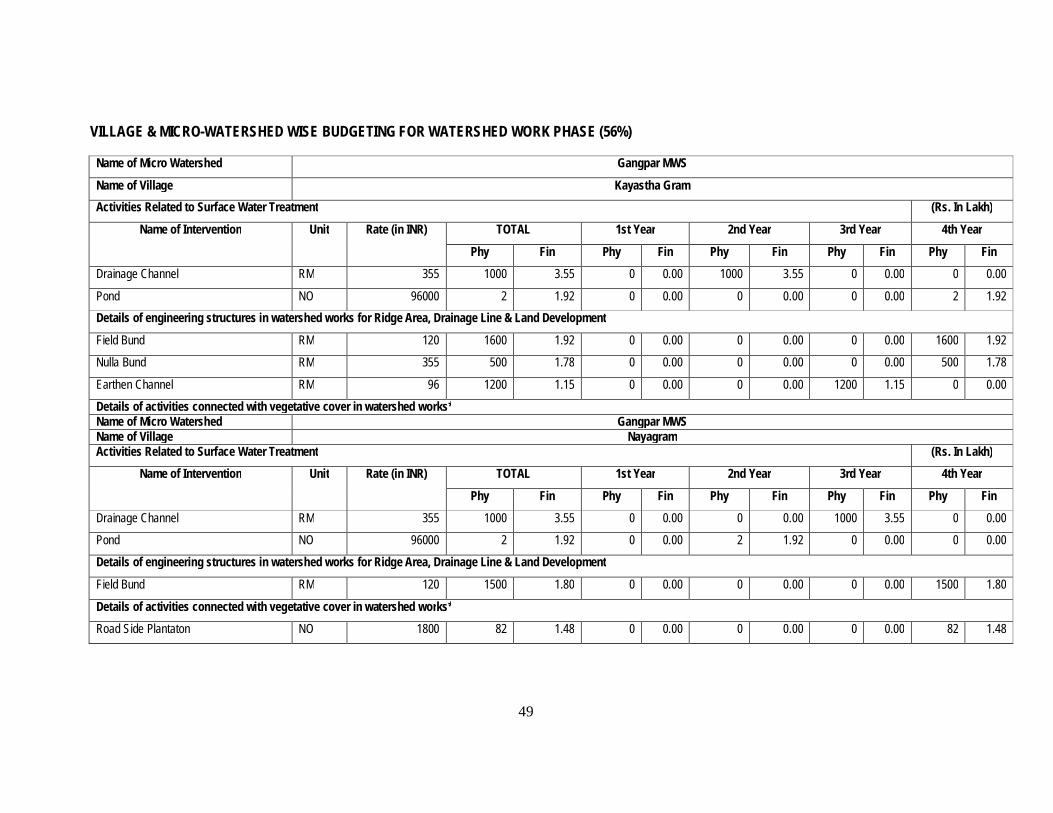
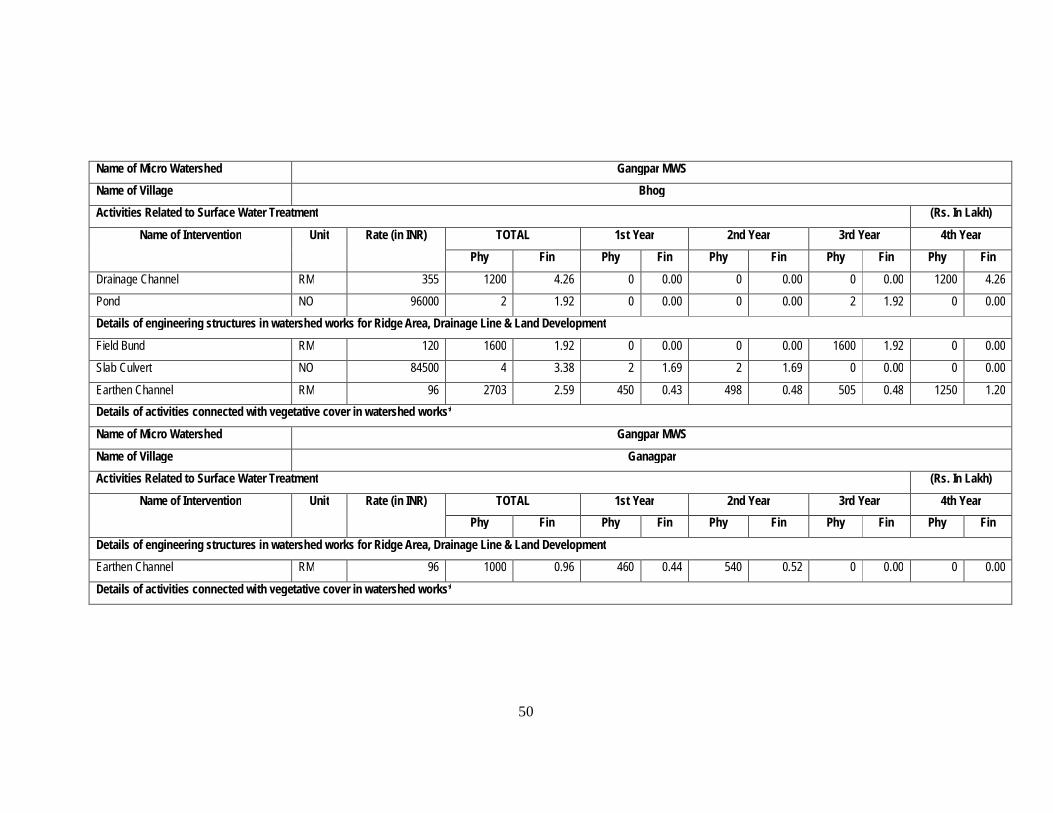
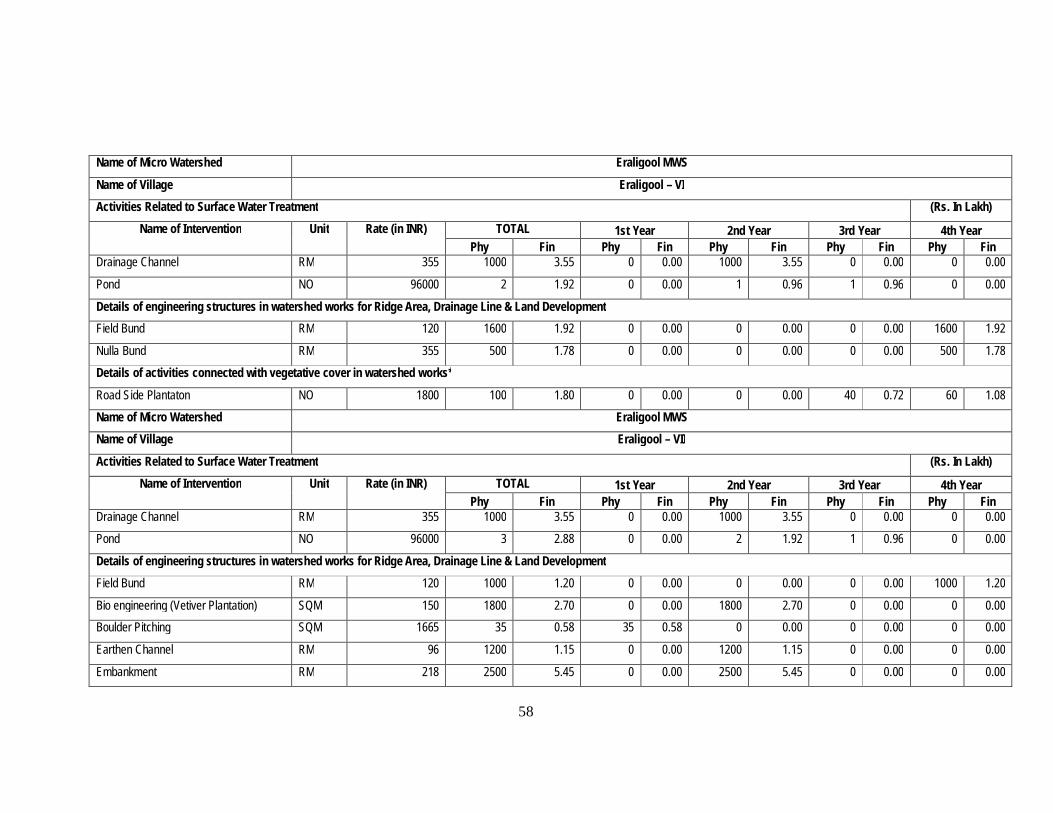
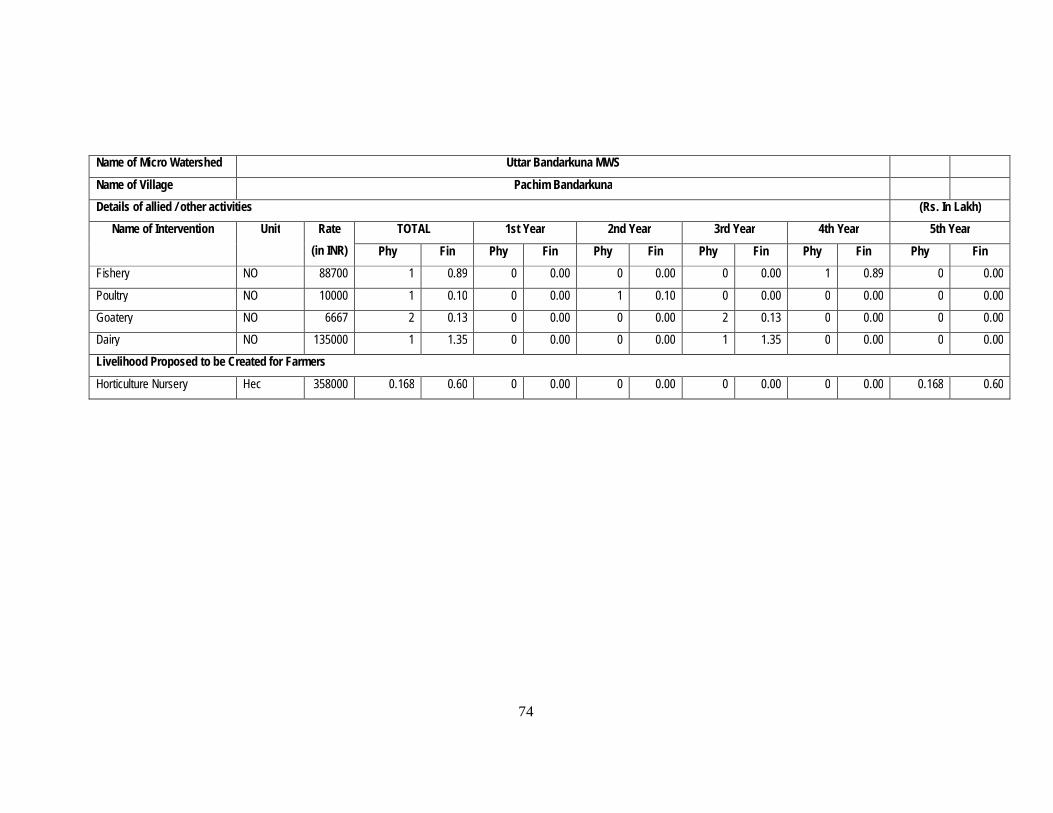
Details of activities connected with vegetative cover in watershed works* Name of Micro Watershed Gangpar MWS Name of Village Nayagram Activities Related to Surface Water Treatment (Rs. In Lakh)
Name of Intervention Unit Rate (in INR) TOTAL 1st Year 2nd Year 3rd Year 4th Year
Phy Fin Phy Fin Phy Fin Phy Fin Phy Fin Drainage Channel RM 355 1000 3.55 0 0.00 0 0.00 1000 3.55 0 0.00
Pond NO 96000 2 1.92 0 0.00 2 1.92 0 0.00 0 0.00
Details of engineering structures in watershed works for Ridge Area, Drainage Line & Land Development
Earthen Channel RM 96 2703 2.59 450 0.43 498 0.48 505 0.48 1250 1.20 Details of activities connected with vegetative cover in watershed works*
Name of Micro Watershed Gangpar MWS
Name of Village Ganagpar Activities Related to Surface Water Treatment (Rs. In Lakh)
Name of Intervention Unit Rate (in INR) TOTAL 1st Year 2nd Year 3rd Year 4th Year Phy Fin Phy Fin Phy Fin Phy Fin Phy Fin
Details of engineering structures in watershed works for Ridge Area, Drainage Line & Land Development Earthen Channel RM 96 1000 0.96 460 0.44 540 0.52 0 0.00 0 0.00
Details of activities connected with vegetative cover in watershed works*
51
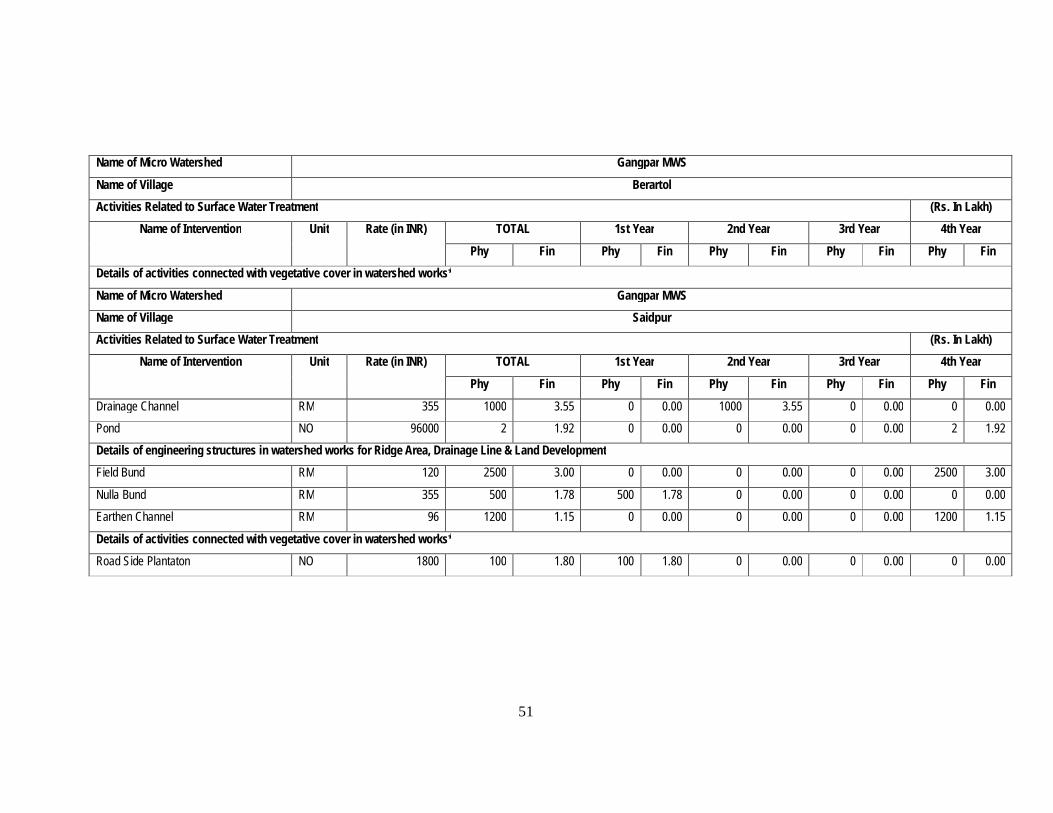
Name of Micro Watershed Gangpar MWS
Name of Village Berartol Activities Related to Surface Water Treatment (Rs. In Lakh)
Name of Intervention Unit Rate (in INR) TOTAL 1st Year 2nd Year 3rd Year 4th Year
Phy Fin Phy Fin Phy Fin Phy Fin Phy Fin Details of activities connected with vegetative cover in watershed works*
Name of Micro Watershed Gangpar MWS Name of Village Saidpur Activities Related to Surface Water Treatment (Rs. In Lakh)
Name of Intervention Unit Rate (in INR) TOTAL 1st Year 2nd Year 3rd Year 4th Year
Details of engineering structures in watershed works for Ridge Area, Drainage Line & Land Development Field Bund RM 120 2500 3.00 0 0.00 0 0.00 0 0.00 2500 3.00
Details of activities connected with vegetative cover in watershed works* Road Side Plantaton NO 1800 100 1.80 100 1.80 0 0.00 0 0.00 0 0.00
52
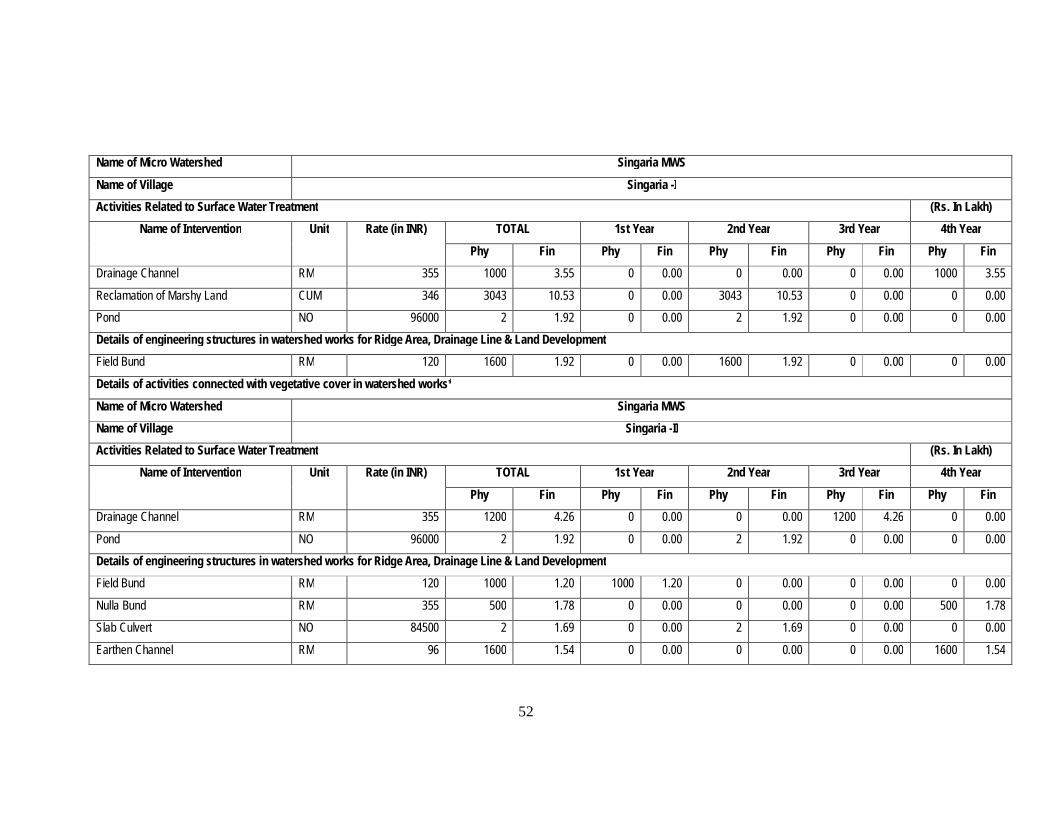
Name of Micro Watershed Singaria MWS
Name of Village Singaria -I Activities Related to Surface Water Treatment (Rs. In Lakh)
Name of Intervention Unit Rate (in INR) TOTAL 1st Year 2nd Year 3rd Year 4th Year
Phy Fin Phy Fin Phy Fin Phy Fin Phy Fin Drainage Channel RM 355 1000 3.55 0 0.00 0 0.00 0 0.00 1000 3.55
Reclamation of Marshy Land CUM 346 3043 10.53 0 0.00 3043 10.53 0 0.00 0 0.00
Pond NO 96000 2 1.92 0 0.00 2 1.92 0 0.00 0 0.00
Details of engineering structures in watershed works for Ridge Area, Drainage Line & Land Development Field Bund RM 120 1600 1.92 0 0.00 1600 1.92 0 0.00 0 0.00
Details of activities connected with vegetative cover in watershed works*
Name of Micro Watershed Singaria MWS Name of Village Singaria -II Activities Related to Surface Water Treatment (Rs. In Lakh)
Name of Intervention Unit Rate (in INR) TOTAL 1st Year 2nd Year 3rd Year 4th Year
Phy Fin Phy Fin Phy Fin Phy Fin Phy Fin Drainage Channel RM 355 1200 4.26 0 0.00 0 0.00 1200 4.26 0 0.00
Pond NO 96000 2 1.92 0 0.00 2 1.92 0 0.00 0 0.00
Details of engineering structures in watershed works for Ridge Area, Drainage Line & Land Development Field Bund RM 120 1000 1.20 1000 1.20 0 0.00 0 0.00 0 0.00
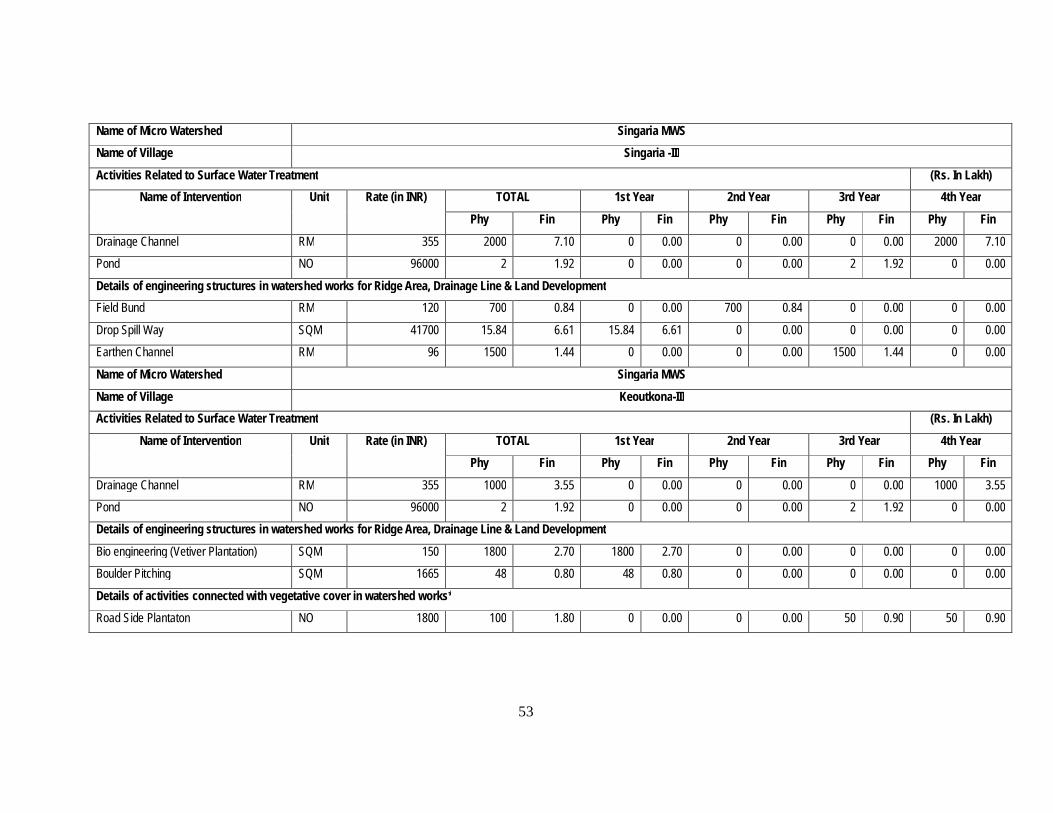
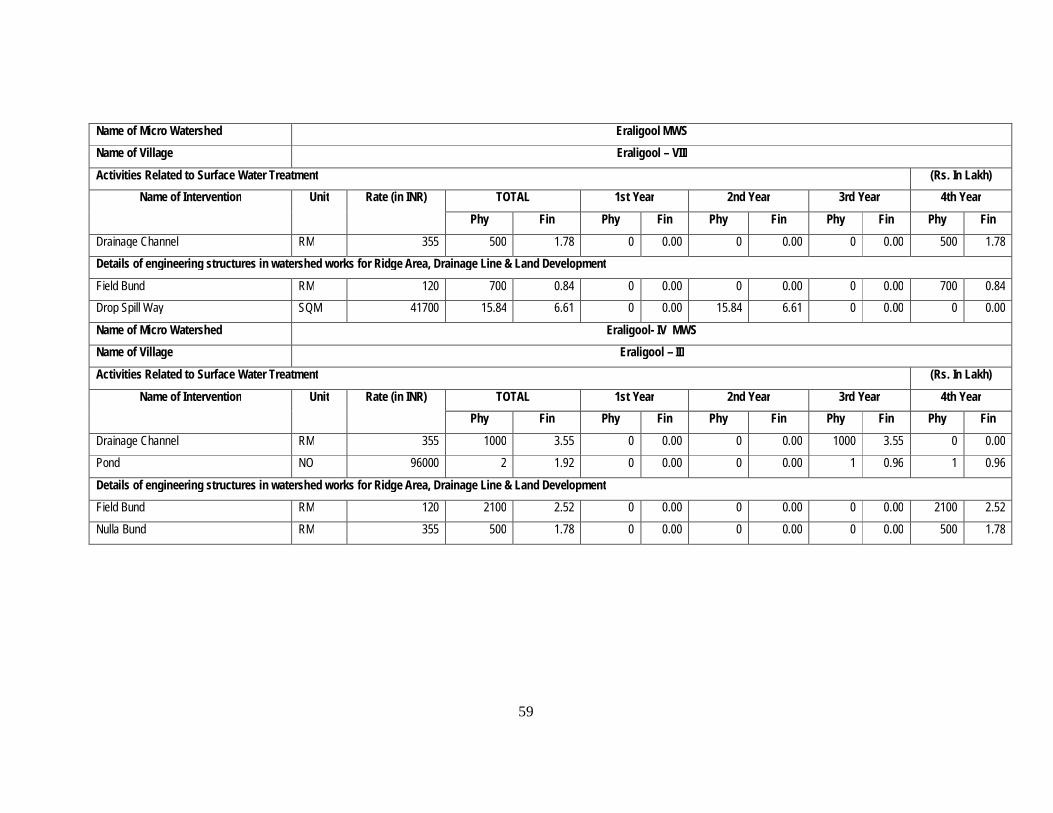
Details of engineering structures in watershed works for Ridge Area, Drainage Line & Land Development Field Bund RM 120 700 0.84 0 0.00 700 0.84 0 0.00 0 0.00
Drop Spill Way SQM 41700 15.84 6.61 15.84 6.61 0 0.00 0 0.00 0 0.00
Details of activities connected with vegetative cover in watershed works* Road Side Plantaton NO 1800 100 1.80 0 0.00 0 0.00 50 0.90 50 0.90
54
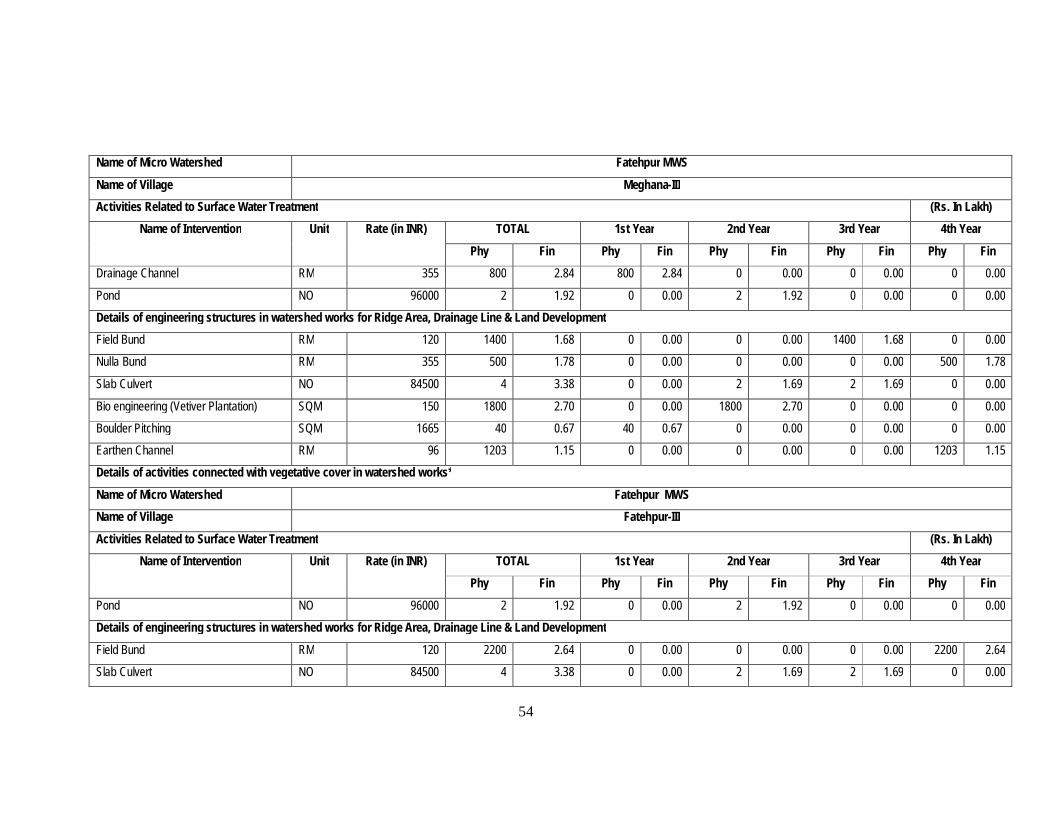
Name of Micro Watershed Fatehpur MWS
Name of Village Meghana-III Activities Related to Surface Water Treatment (Rs. In Lakh)
Name of Intervention Unit Rate (in INR) TOTAL 1st Year 2nd Year 3rd Year 4th Year
Phy Fin Phy Fin Phy Fin Phy Fin Phy Fin Drainage Channel RM 355 800 2.84 800 2.84 0 0.00 0 0.00 0 0.00
Pond NO 96000 2 1.92 0 0.00 2 1.92 0 0.00 0 0.00
Details of engineering structures in watershed works for Ridge Area, Drainage Line & Land Development Field Bund RM 120 1400 1.68 0 0.00 0 0.00 1400 1.68 0 0.00
Activities Related to Surface Water Treatment (Rs. In Lakh) Name of Intervention Unit Rate (in INR) TOTAL 1st Year 2nd Year 3rd Year 4th Year
Phy Fin Phy Fin Phy Fin Phy Fin Phy Fin Pond NO 96000 2 1.92 0 0.00 2 1.92 0 0.00 0 0.00
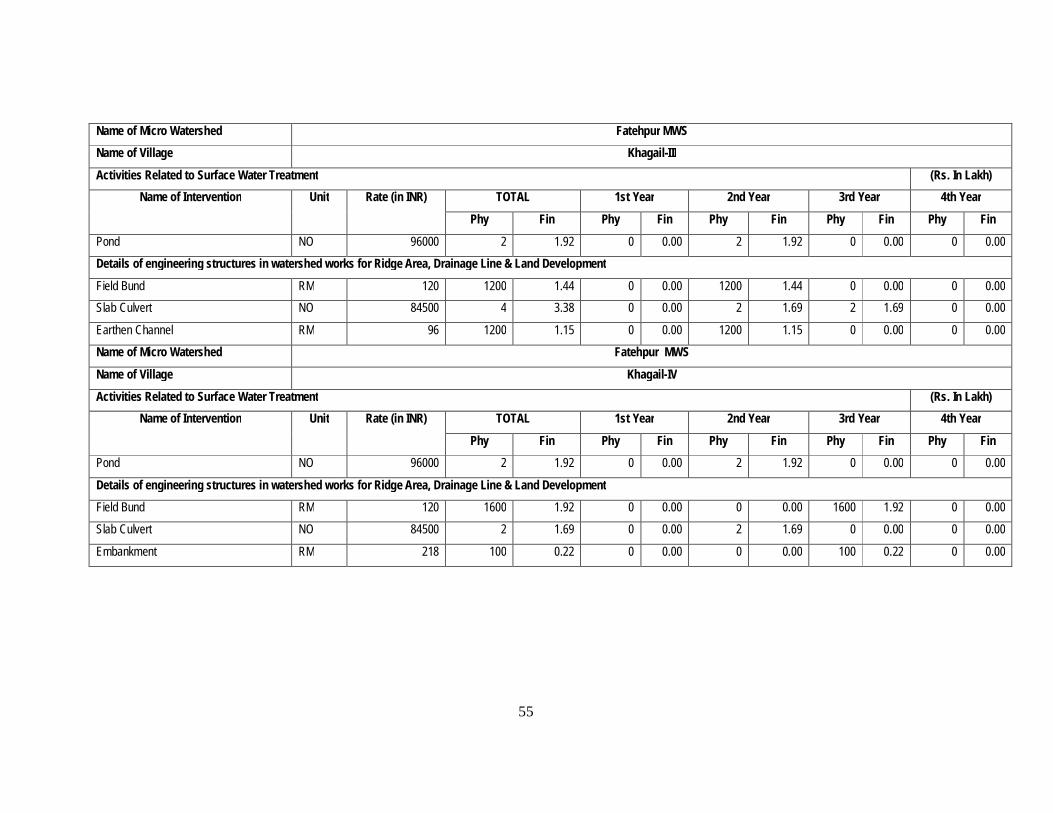
Details of engineering structures in watershed works for Ridge Area, Drainage Line & Land Development Field Bund RM 120 1600 1.92 0 0.00 0 0.00 1600 1.92 0 0.00
Details of engineering structures in watershed works for Ridge Area, Drainage Line & Land Development Field Bund RM 120 1700 2.04 0 0.00 0 0.00 0 0.00 1700 2.04
Details of engineering structures in watershed works for Ridge Area, Drainage Line & Land Development Field Bund RM 120 1600 1.92 0 0.00 0 0.00 0 0.00 1600 1.92
Details of activities connected with vegetative cover in watershed works*
Road Side Plantaton NO 1800 100 1.80 0 0.00 0 0.00 40 0.72 60 1.08
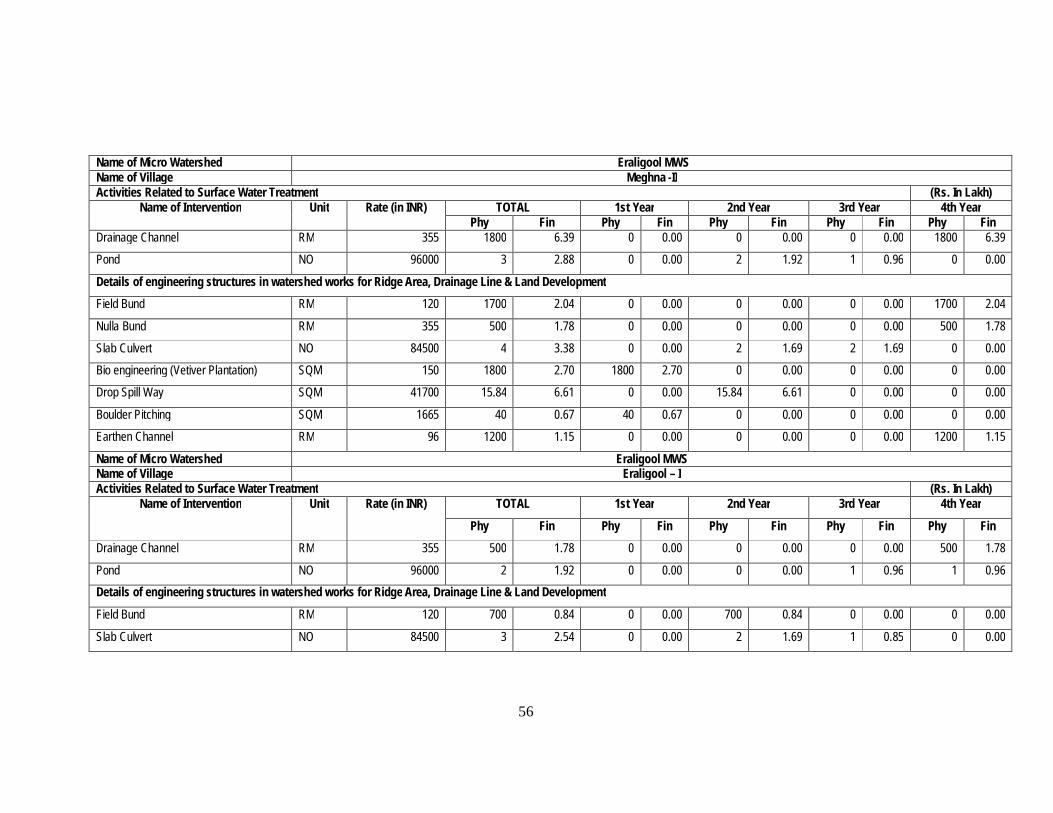
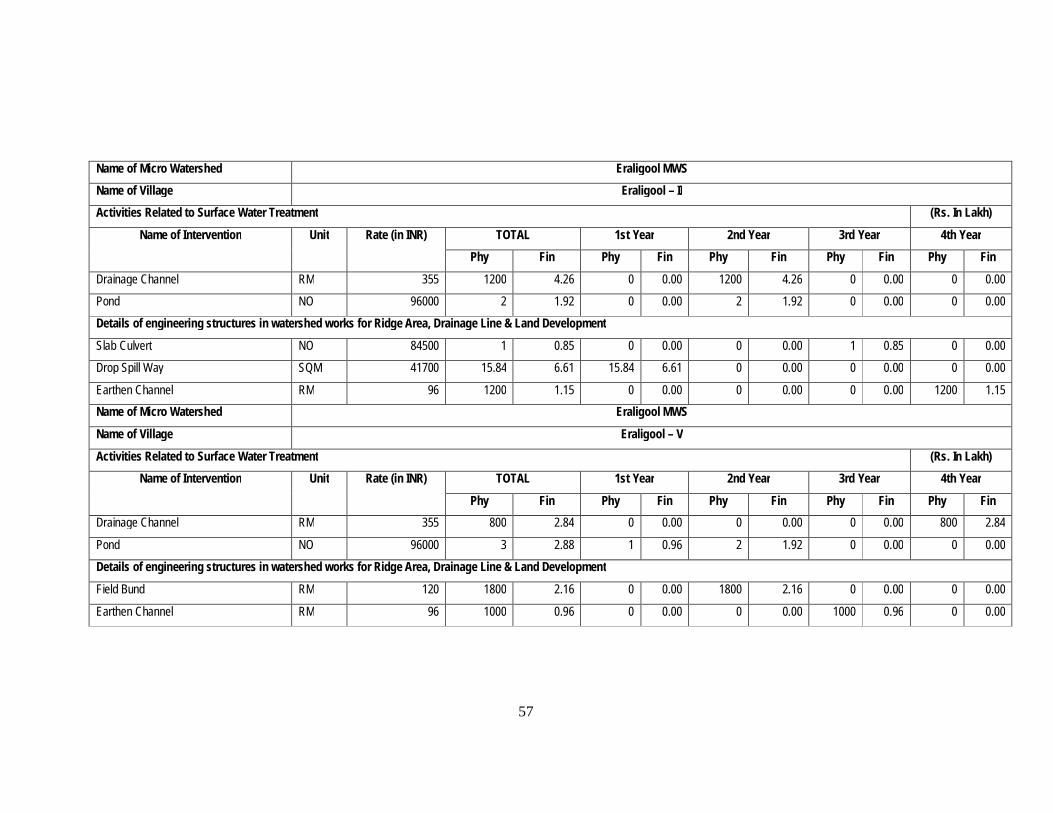
Name of Micro Watershed Eraligool MWS Name of Village Eraligool – VII
Activities Related to Surface Water Treatment (Rs. In Lakh) Name of Intervention Unit Rate (in INR) TOTAL 1st Year 2nd Year 3rd Year 4th Year
Phy Fin Phy Fin Phy Fin Phy Fin Phy Fin Drainage Channel RM 355 1000 3.55 0 0.00 1000 3.55 0 0.00 0 0.00
Pond NO 96000 3 2.88 0 0.00 2 1.92 1 0.96 0 0.00
Details of engineering structures in watershed works for Ridge Area, Drainage Line & Land Development Field Bund RM 120 1000 1.20 0 0.00 0 0.00 0 0.00 1000 1.20
Details of engineering structures in watershed works for Ridge Area, Drainage Line & Land Development Field Bund RM 120 2100 2.52 0 0.00 0 0.00 0 0.00 2100 2.52
Name of Village Eraligool – IV Activities Related to Surface Water Treatment (Rs. In Lakh)
Name of Intervention Unit Rate (in INR) TOTAL 1st Year 2nd Year 3rd Year 4th Year
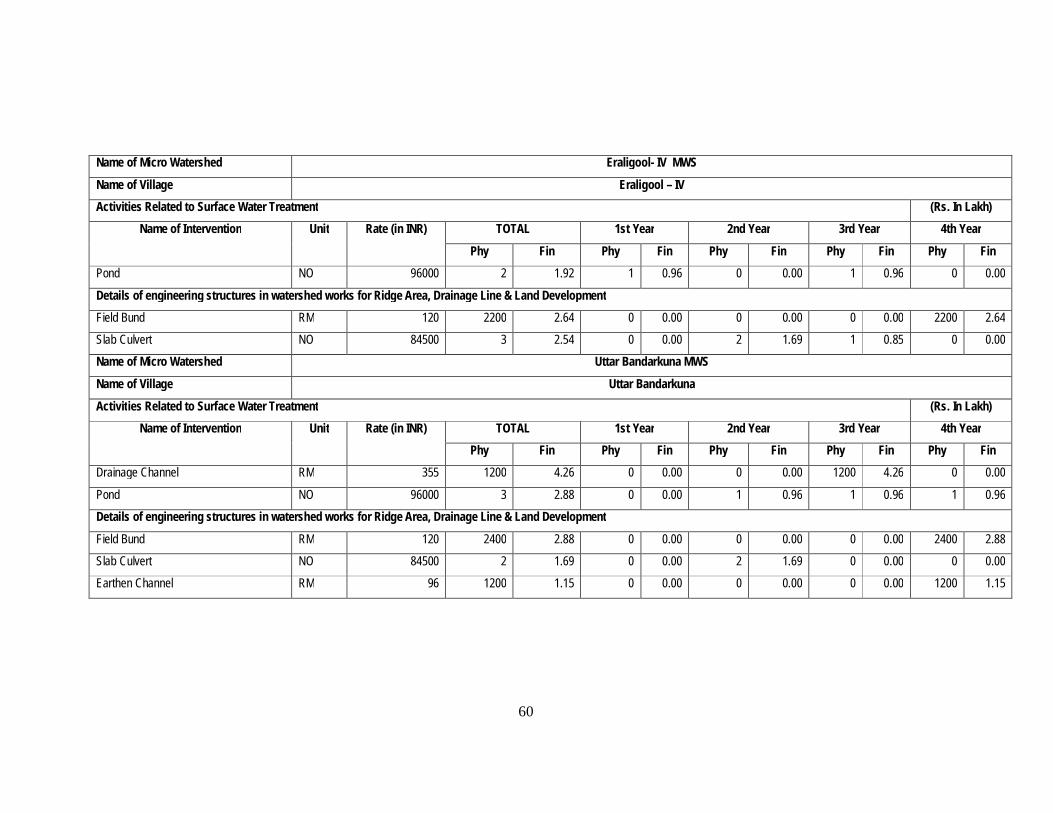
Phy Fin Phy Fin Phy Fin Phy Fin Phy Fin Pond NO 96000 2 1.92 1 0.96 0 0.00 1 0.96 0 0.00
Details of engineering structures in watershed works for Ridge Area, Drainage Line & Land Development Field Bund RM 120 2200 2.64 0 0.00 0 0.00 0 0.00 2200 2.64
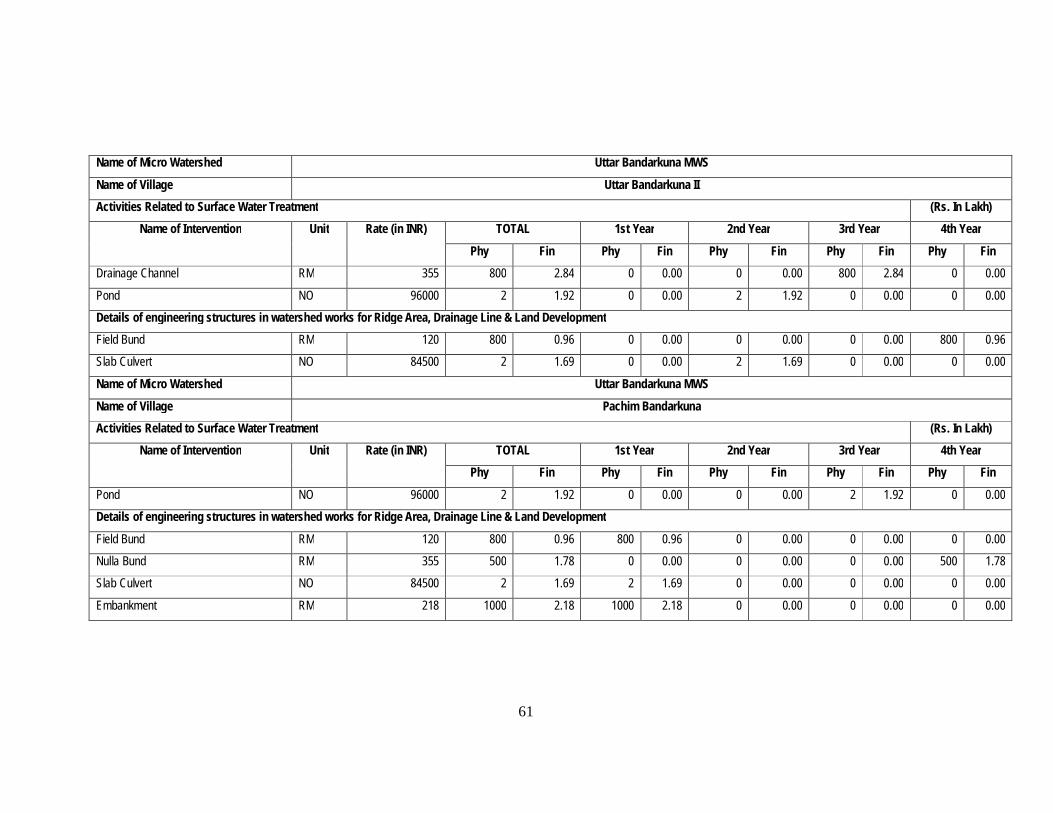
Name of Village Uttar Bandarkuna II Activities Related to Surface Water Treatment (Rs. In Lakh)
Name of Intervention Unit Rate (in INR) TOTAL 1st Year 2nd Year 3rd Year 4th Year
Phy Fin Phy Fin Phy Fin Phy Fin Phy Fin Drainage Channel RM 355 800 2.84 0 0.00 0 0.00 800 2.84 0 0.00
Pond NO 96000 2 1.92 0 0.00 2 1.92 0 0.00 0 0.00
Details of engineering structures in watershed works for Ridge Area, Drainage Line & Land Development Field Bund RM 120 800 0.96 0 0.00 0 0.00 0 0.00 800 0.96