37
DETAILED PROJECT REPORT ON SEPARATOR (1.0 TPH) (GANJAM RICE MILL CLUSTER) Bureau of Energy Efficiency Prepared By Reviewed By
DETAILED PROJECT REPORT
ON
SEPARATOR (1.0 TPH)
(GANJAM RICE MILL CLUSTER)
Bureau of Energy Efficiency
Prepared By
Reviewed By
SEPARATOR FOR RICE MILL (1.0 TPH)
GANJAM RICE MILLS CLUSTER
BEE, 2010
Detailed Project Report on Separator (1.0 TPH)
Rice Mill SME Cluster, Ganjam, Orissa (India)
New Delhi: Bureau of Energy Efficiency;
Detail Project Report No.: Ganjam/Ricemills/PC/01
For more information
Bureau of Energy Efficiency (BEE)
(Ministry of Power, Government of India)
4th Floor, Sewa Bhawan
R. K. Puram, New Delhi – 110066
Telephone +91-11-26179699
Fax+91-11-26178352
Websites: www.bee-india.nic.in
Email: [email protected]/ [email protected]
Acknowledgement
We are sincerely thankful to the Bureau of Energy Efficiency, Ministry of Power, for giving
us the opportunity to implement the BEE SME project in “Ganjam Rice Cluster, Ganjam”.
We express our sincere gratitude to all concerned officials for their support and guidance
during the conduct of this exercise.
Dr. Ajay Mathur, Director General, BEE
Smt. Abha Shukla, Secretary, BEE
Shri Jitendra Sood, Energy Economist, BEE
Shri Pawan Kumar Tiwari, Advisor (SME), BEE
Shri Rajeev Yadav, Project Economist, BEE
Zenith Energy Services Pvt. Ltd. (ZESPL) is also thankful to Shri Purna Chandra Sahu,
President, Shri Santhosh Kumar Sahu, Secretary, Ganjam District Rice Mill Owners
Association, Berhampur and to Shri Bibudatta Panigrahi, M/s Aanjeneya Modern Rice Mill
for their valuable inputs, co-operation, support and identification of the units for energy use
and technology audit studies and facilitating the implementation of BEE SME program in
Ganjam Rice Cluster.
We take this opportunity to express our appreciation for the excellent support provided by
Rice Unit Owners, Local Service Providers, and Equipment Suppliers for their active
involvement and their valuable inputs in making the program successful and in completion
of the Detailed Project Report (DPR).
ZESPL is also thankful to all the SME owners, plant in charges and all workers of the SME
units for their support during the energy use and technology audit studies and in
implementation of the project objectives.
Zenith Energy Services Private Ltd.
Hyderabad
Contents
List of Annexure vii
List of Tables vii
List of Figures viii
List of Abbreviation viii
Executive summary ix
About BEE’S SME program xi
1 INTRODUCTION ........................................................................................................1
1.1 Brief Introduction about cluster ...................................................................................1
1.1.1 Production process .....................................................................................................1
1.2 Energy performance in existing situation ....................................................................4
1.2.1 Electricity consumption of a typical unit in the cluster ..................................................4
1.2.2 Average production by a typical unit in the cluster ......................................................4
1.2.3 Specific Energy Consumption .....................................................................................4
1.3 Existing technology/equipment ...................................................................................4
1.3.1 Description of existing technology ...............................................................................4
1.3.2 Its role in the whole process .......................................................................................5
1.4 Establishing the baseline for the equipment to be changed ........................................6
1.4.1 Design and operating parameters power consumption ...............................................6
1.4.2 Electricity consumption ...............................................................................................6
1.4.2 Operating efficiency of the existing system .................................................................6
1.5 Barriers for adoption of new and energy efficient technology / equipment ...................7
1.5.1 Technological Barriers ................................................................................................7
1.5.2 Financial Barrier ..........................................................................................................7
1.5.3 Skilled manpower .......................................................................................................7
1.5.4 Other barrier(s) ...........................................................................................................7
2. EQUIPMENT OPTION FOR ENERGY EFFICIENCY IMPROVEMENT ......................8
2.1 Detailed description of technology/equipment selected ...............................................8
2.1.1 Description of technology ............................................................................................8
2.1.2 Technology /Equipment specifications ........................................................................8
2.1.3 Justification of the technology selected & its suitability................................................9
2.1.4 Superiority over existing technology/equipment ..........................................................9
2.1.5 Availability of the proposed technology/equipment ......................................................9
2.1.6 Source of technology/equipment for the project ............................................................9
2.1.7 Service/technology providers ......................................................................................9
2.1.8 Terms of sales of the suppliers, etc. ............................................................................9
2.1.9 Process down time during implementation ................................................................ 10
2.2 Life cycle assessment and risks analysis .................................................................. 10
2.3 Suitable unit/plant size the identified equipment........................................................ 10
3. ECONOMIC BENEFITS OF NEW ENERGY EFFICIENT TECHNOLOGY ................ 11
3.1 Technical benefits ..................................................................................................... 11
3.1.1 Fuel Saving ............................................................................................................... 11
3.1.2 Electricity savings ..................................................................................................... 11
3.1.2 Improvement in product quality ................................................................................. 11
3.1.3 Increase in production............................................................................................... 11
3.1.4 Reduction in raw material consumption .................................................................... 11
3.1.5 Reduction in other losses .......................................................................................... 11
3.2 Monetary benefits ..................................................................................................... 11
3.3 Social benefits .......................................................................................................... 11
3.3.1 Improvement in working environment in the plant ..................................................... 11
3.3.2 Improvement in skill set of workers ........................................................................... 12
3.4 Environmental benefits ............................................................................................. 12
3.4.1 Reduction in effluent generation ............................................................................... 12
3.4.2 Reduction in GHG emission such as CO2, NOx, etc ................................................. 12
3.4.3 Reduction in other emissions like SOx ...................................................................... 12
4. INSTALLATION OF NEW ENERGY EFFICIENT EQUIPMENT ................................ 13
4.1 Cost of equipment implementation ............................................................................ 13
4.1.1 Cost of equipments ................................................................................................... 13
4.1.2 Other costs ............................................................................................................... 13
4.2 Arrangement of funds ............................................................................................... 13
4.2.1 Entrepreneur’s contribution ....................................................................................... 13
4.2.2 Loan amount ............................................................................................................. 13
4.2.3 Terms & conditions of loan ....................................................................................... 13
4.3 Financial indicators ................................................................................................... 14
4.3.1 Cash flow analysis .................................................................................................... 14
4.3.2 Simple payback period .............................................................................................. 14
4.3.3 Net Present Value (NPV) .......................................................................................... 14
4.3.4 Internal rate of return (IRR) ....................................................................................... 14
4.3.5 Return on investment (ROI) ...................................................................................... 14
4.4 Sensitivity analysis in realistic, pessimistic and optimistic scenarios ......................... 14
4.5 Procurement and implementation schedule .............................................................. 15
vii
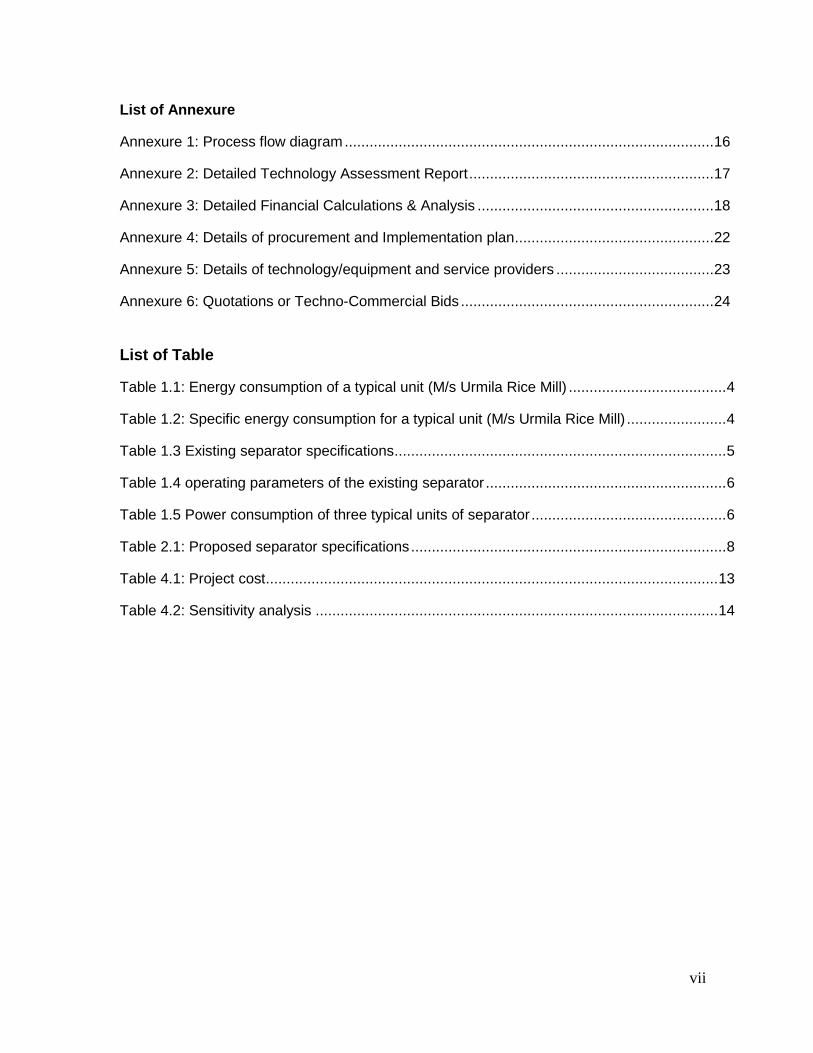
List of Annexure
Annexure 1: Process flow diagram ......................................................................................... 16
Annexure 2: Detailed Technology Assessment Report ........................................................... 17
Annexure 3: Detailed Financial Calculations & Analysis ......................................................... 18
Annexure 4: Details of procurement and Implementation plan ................................................ 22
Annexure 5: Details of technology/equipment and service providers ...................................... 23
Annexure 6: Quotations or Techno-Commercial Bids ............................................................. 24
List of Table
Table 1.1: Energy consumption of a typical unit (M/s Urmila Rice Mill) ...................................... 4
Table 1.2: Specific energy consumption for a typical unit (M/s Urmila Rice Mill) ........................ 4
Table 1.3 Existing separator specifications ................................................................................ 5
Table 1.4 operating parameters of the existing separator .......................................................... 6
Table 1.5 Power consumption of three typical units of separator ............................................... 6
Table 2.1: Proposed separator specifications ............................................................................ 8
Table 4.1: Project cost ............................................................................................................. 13
Table 4.2: Sensitivity analysis ................................................................................................. 14
viii
List of Figure
Figure 1: General Process Flowchart of a Typical Rice Mill Unit ………………….…….…3
Lists of Abbreviations
BEE - Bureau of Energy Efficiency
DPR - Detailed Project Report
DSCR - Debt Service Coverage Ratio
GHG - Green House Gases
HP - Horse Power
IRR - Internal Rate of Return
MoP - Ministry of Power
MSME - Micro Small and Medium Enterprises
NPV - Net Present Value
ROI - Return On Investment
MoMSME - Ministry of micro Small and Medium Enterprises
SIDBI - Small Industrial Development Bank of India
TPH - Ton Per Hour
ix
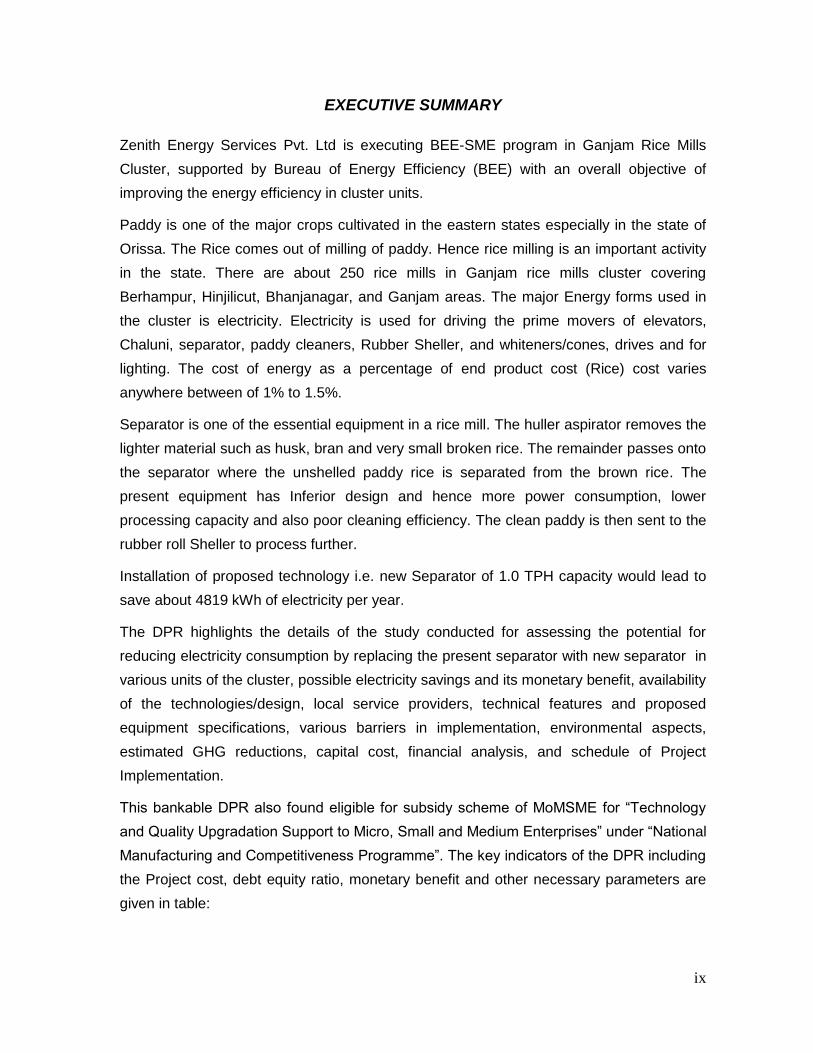
EXECUTIVE SUMMARY
Zenith Energy Services Pvt. Ltd is executing BEE-SME program in Ganjam Rice Mills
Cluster, supported by Bureau of Energy Efficiency (BEE) with an overall objective of
improving the energy efficiency in cluster units.
Paddy is one of the major crops cultivated in the eastern states especially in the state of
Orissa. The Rice comes out of milling of paddy. Hence rice milling is an important activity
in the state. There are about 250 rice mills in Ganjam rice mills cluster covering
Berhampur, Hinjilicut, Bhanjanagar, and Ganjam areas. The major Energy forms used in
the cluster is electricity. Electricity is used for driving the prime movers of elevators,
Chaluni, separator, paddy cleaners, Rubber Sheller, and whiteners/cones, drives and for
lighting. The cost of energy as a percentage of end product cost (Rice) cost varies
anywhere between of 1% to 1.5%.
Separator is one of the essential equipment in a rice mill. The huller aspirator removes the
lighter material such as husk, bran and very small broken rice. The remainder passes onto
the separator where the unshelled paddy rice is separated from the brown rice. The
present equipment has Inferior design and hence more power consumption, lower
processing capacity and also poor cleaning efficiency. The clean paddy is then sent to the
rubber roll Sheller to process further.
Installation of proposed technology i.e. new Separator of 1.0 TPH capacity would lead to
save about 4819 kWh of electricity per year.
The DPR highlights the details of the study conducted for assessing the potential for
reducing electricity consumption by replacing the present separator with new separator in
various units of the cluster, possible electricity savings and its monetary benefit, availability
of the technologies/design, local service providers, technical features and proposed
equipment specifications, various barriers in implementation, environmental aspects,
estimated GHG reductions, capital cost, financial analysis, and schedule of Project
Implementation.
This bankable DPR also found eligible for subsidy scheme of MoMSME for “Technology
and Quality Upgradation Support to Micro, Small and Medium Enterprises” under “National
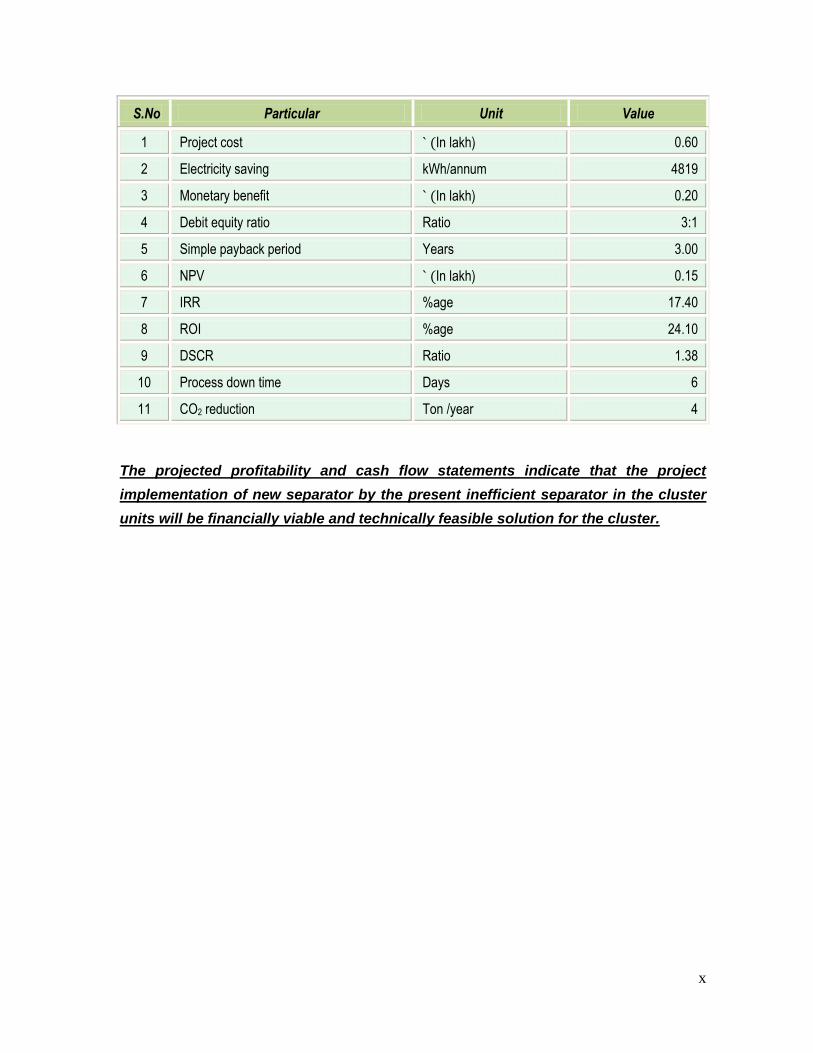
Manufacturing and Competitiveness Programme”. The key indicators of the DPR including
the Project cost, debt equity ratio, monetary benefit and other necessary parameters are
given in table:
x
S.No Particular Unit Value
1 Project cost ` (In lakh) 0.60
2 Electricity saving kWh/annum 4819
3 Monetary benefit ` (In lakh) 0.20
4 Debit equity ratio Ratio 3:1
5 Simple payback period Years 3.00
6 NPV ` (In lakh) 0.15
7 IRR %age 17.40
8 ROI %age 24.10
9 DSCR Ratio 1.38
10 Process down time Days 6
11 CO2 reduction Ton /year 4
The projected profitability and cash flow statements indicate that the project
implementation of new separator by the present inefficient separator in the cluster
units will be financially viable and technically feasible solution for the cluster.
xi
ABOUT BEE’S SME PROGRAM
Bureau of Energy Efficiency (BEE) is implementing a BEE-SME Programme to improve
the energy performance in 29 selected SMEs clusters. Ganjam Rice Mills Cluster is one of
them. The BEE’s SME Programme intends to enhance the energy efficiency awareness by
funding/subsidizing need based studies in SME clusters and giving energy conservation
recommendations. For addressing the specific problems of these SMEs and enhancing
energy efficiency in the clusters, BEE will be focusing on energy efficiency, energy
conservation and technology up-gradation through studies and pilot projects in these
SMEs clusters.
Major activities in the BEE -SME program are furnished below:
Activity 1: Energy use and technology audit
The energy use technology studies would provide information on technology status, best
operating practices, gaps in skills and knowledge on energy conservation opportunities,
energy saving potential and new energy efficient technologies, etc for each of the sub
sector in SMEs.
Activity 2: Capacity building of stake holders in cluster on energy efficiency
In most of the cases SME entrepreneurs are dependent on the locally available
technologies, service providers for various reasons. To address this issue BEE has also
undertaken capacity building of local service providers and entrepreneurs/ Managers of
SMEs on energy efficiency improvement in their units as well as clusters. The local service
providers will be trained in order to be able to provide the local services in setting up of
energy efficiency projects in the clusters
Activity 3: Implementation of energy efficiency measures
To implement the technology up-gradation project in the clusters, BEE has proposed to
prepare the technology based detailed project reports (DPRs) for a minimum of five
technologies in three capacities for each technology.
Activity 4: Facilitation of innovative financing mechanisms for implementation of
energy efficiency projects
The objective of this activity is to facilitate the uptake of energy efficiency measures
through innovative financing mechanisms without creating market distortion.
Separator 1.0 Tonne
1
1 INTRODUCTION
1.1 Brief Introduction about cluster
Paddy is one of the major crops cultivated in the eastern states especially in the state of
Orissa. The Rice comes out of milling of paddy. Hence rice milling is an important activity
in the state. There are about 250 rice mills in Ganjam rice mills cluster covering
Berhampur, Hinjilicut, Bhanjanagar, and Ganjam areas. The major Energy forms used in
the cluster is grid electricity. Electricity is used for driving the prime movers of elevators,
Chaluni, separator, paddy cleaners, Rubber Sheller, and whiteners/cones, drives and for
lighting. The cost of energy as a percentage of end product cost (Rice) cost varies
anywhere between 1% and 1.5%.
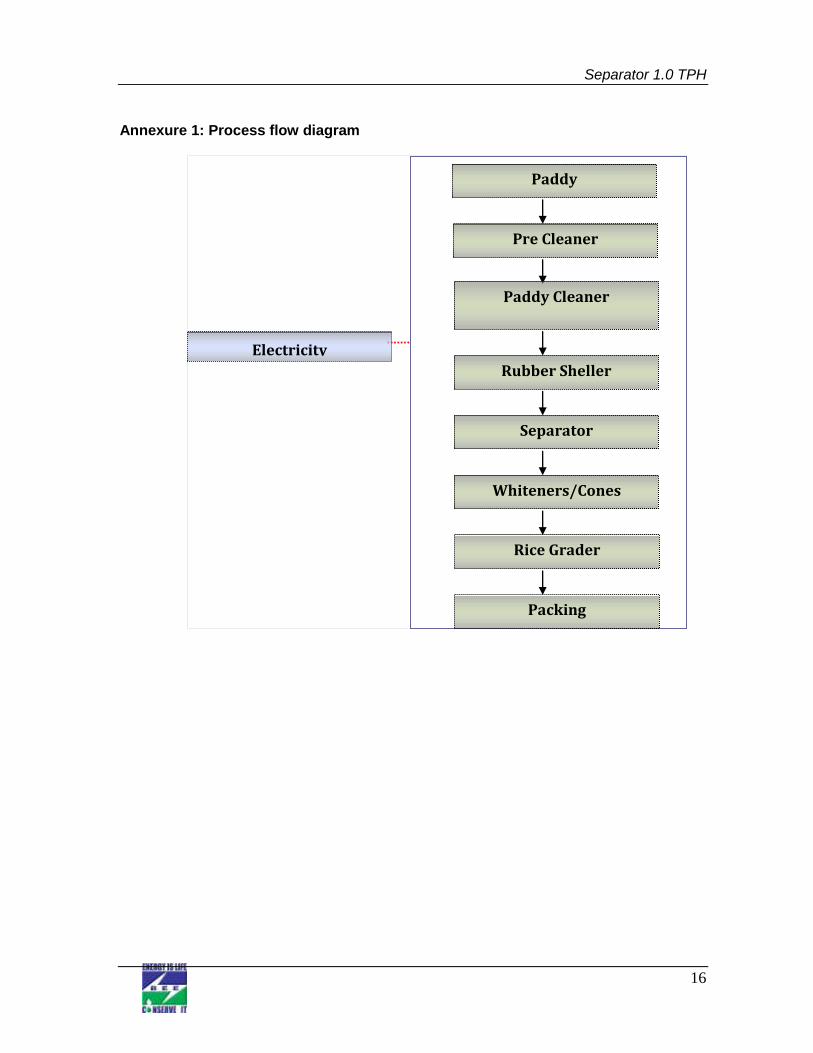
1.1.1 Production process
Pre-Cleaner/ Paddy Cleaner
Paddy cleaner is a most essential equipment in a rice mill and separates all the impurities
like dust, straw, sand, clay and heavy particles of even and uneven sizes from paddy
before the paddy is processed. The clean paddy sent to the rubber roll sheller to process
further. The advantages with the paddy cleaner are it increases the life of rubber rollers
and the percentage of oil in bran.
The function of the dust blower is to remove the dust from paddy through the pipeline
connected to the paddy cleaner. This equipment is recommended for installation in
conventional rice mills, also to get the same advantages as of modern rice mills. If this are
not removed prior to shelling the efficiency of the rubber Sheller and the milling recovery is
reduced.
The pre-cleaners separate three groups of materials:
The first separation is done by scalping or removing the objects that are larger than
the grain. Either a flat oscillating screen or a rotary drum screen that allows the
grain to pass through but retains straw.
The second separation retains the grains but allows broken grains, small stones
and weed seeds to pass through. Aspirator is installed to remove the dust and light
empty grains
Separator 1.0 TPH
2
Rubber Sheller
The objective of a hulling/de husking operation is to remove the husk from the paddy grain
with a minimum of damage to the bran layer and, if possible, without breaking the brown
rice grain. Since, the structure of the paddy grain makes it necessary to apply friction to
the grain surface to remove the husk; it leads to breaking of some of the rice.
The paddy is fed into the center of the machine through a small hopper. A vertically
adjustable cylindrical sleeve regulates the capacity and equal distribution of the paddy
over the entire surface of the rotating disc, paddy is forced between the two discs ( rubber
Sheller)and as a result of pressure and friction most of the paddy is de husked (hulled),
where husk and brown rice are separated.
Separator
The output from the huller is a mixture of brown rice, husk, broken paddy etc. The huller
aspirator removes the lighter material such as husk, bran and very small broken rice. The
remainder passes onto the paddy separator where the unshelled paddy rice is separated
from the brown rice. The amount of paddy present depends on the efficiency of the
husker, and normally less than 10%. Paddy separators work by making use of the
differences in specific gravity, buoyancy, and size between paddy and brown rice. Paddy
rice has a lower specific gravity, higher buoyancy, and is physically bigger, longer and
wider than brown rice
The compartment type of paddy separator uses the difference in specific gravity and the
buoyancy to separate paddy and brown rice. When paddy and brown rice move over an
inclined plane, they move at different speeds depending on their specific gravity, their
shape and contact area, smoothness of inclined surface and the co-efficient of sliding
friction. Brown grains are smaller, heavier, rounder, and smoother and will slide faster than
paddy grains. The processing capacity of the compartment separator is dependent on the
compartment area. For a 1.0 ton/hr capacity rice mill, a 45-compartment separator made
up of 15 compartments on each of three decks is used.
Whitening and Polishing
In the process of whitening, the skin and bran layer of the brown rice are removed. During
polishing of the whitened rice, the bran particles still sticking to the surface of the rice are
removed and the surface of the rice is slightly polished to give it a glazed appearance. For
further whitening if required as per the market demand or for export market, the polished
rice is further processed in the silky machine for additional polishing.
Separator 1.0 TPH
3
Electricity Rubber Sheller
Separator
Whiteners/Cones
Paddy Cleaner
Paddy
Pre Cleaner
Rice Grader
Packing
Rice grader
After polishing, the white rice is separated into head rice and, large and small broken rice
by a sifter. Head rice is normally classified as kernels, which are 75-80% or more of a
whole kernel. The sifter is made up of a series of oscillating or cylindrical screens through
which the rice passes. The output from the bottom screen is the very fine broken tips and
is called the “brewers”.
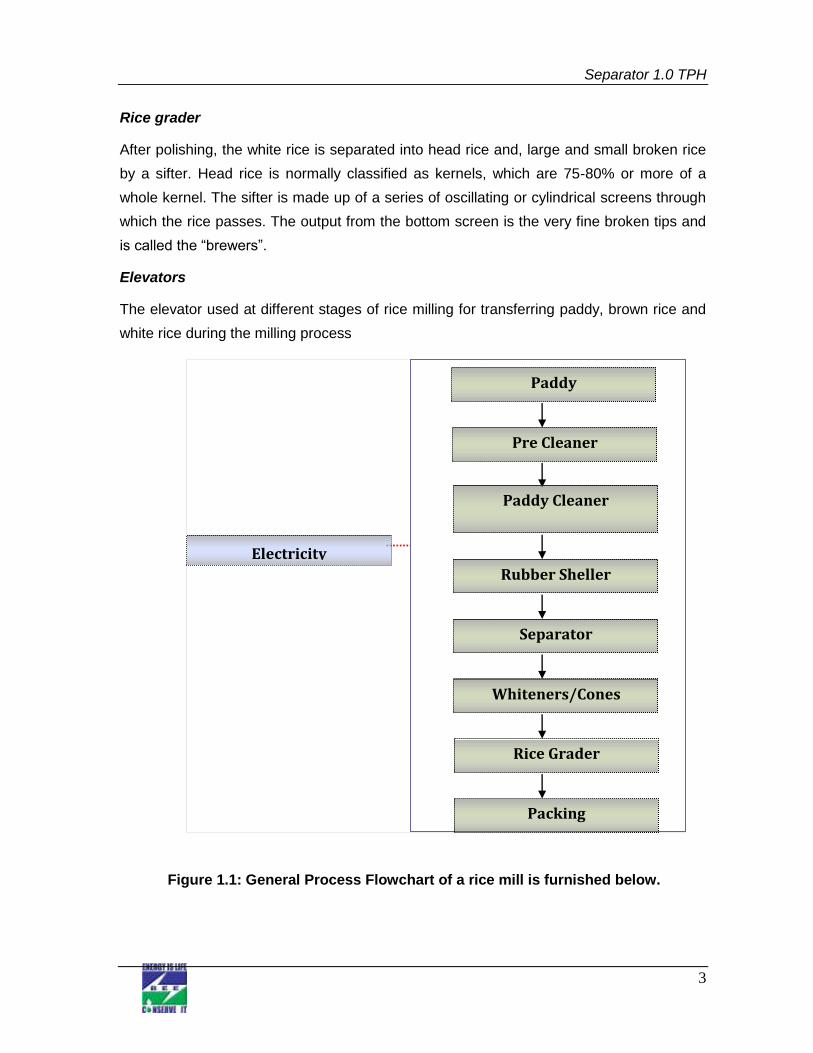
Elevators
The elevator used at different stages of rice milling for transferring paddy, brown rice and
white rice during the milling process
Figure 1.1: General Process Flowchart of a rice mill is furnished below.
Separator 1.0 TPH
4
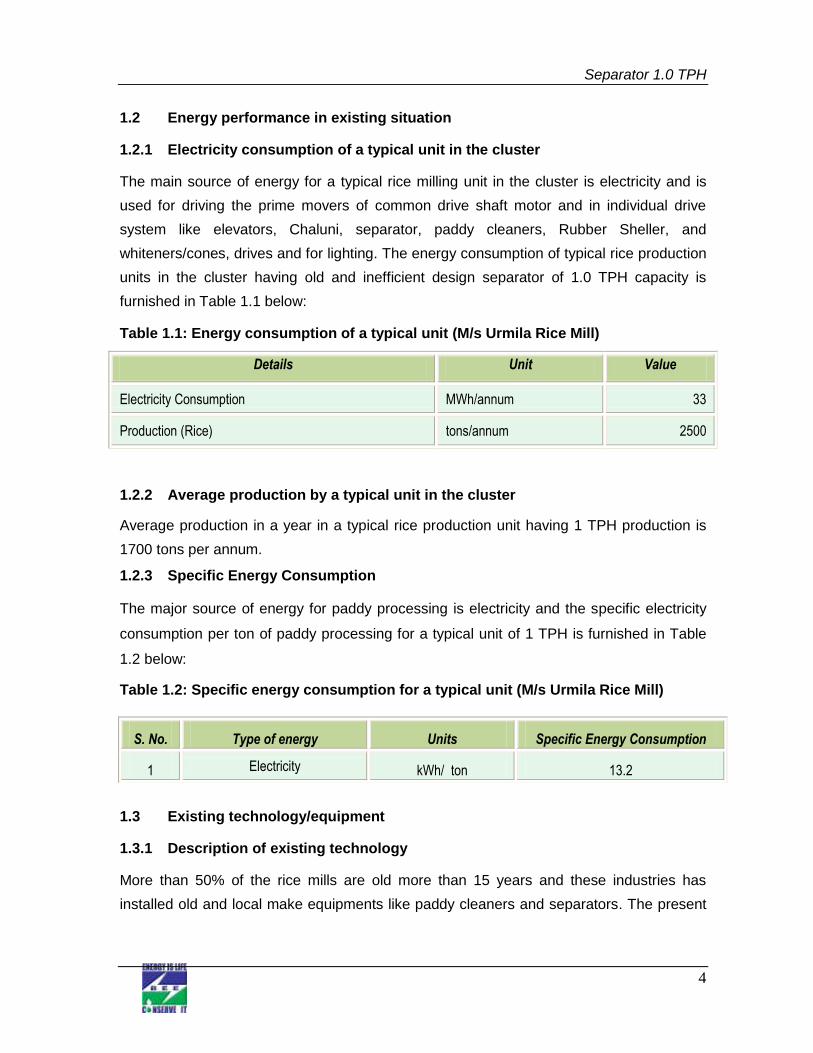
1.2 Energy performance in existing situation
1.2.1 Electricity consumption of a typical unit in the cluster
The main source of energy for a typical rice milling unit in the cluster is electricity and is
used for driving the prime movers of common drive shaft motor and in individual drive
system like elevators, Chaluni, separator, paddy cleaners, Rubber Sheller, and
whiteners/cones, drives and for lighting. The energy consumption of typical rice production
units in the cluster having old and inefficient design separator of 1.0 TPH capacity is
furnished in Table 1.1 below:
Table 1.1: Energy consumption of a typical unit (M/s Urmila Rice Mill)
Details Unit Value
Electricity Consumption MWh/annum 33
Production (Rice) tons/annum 2500
1.2.2 Average production by a typical unit in the cluster
Average production in a year in a typical rice production unit having 1 TPH production is
1700 tons per annum.
1.2.3 Specific Energy Consumption
The major source of energy for paddy processing is electricity and the specific electricity
consumption per ton of paddy processing for a typical unit of 1 TPH is furnished in Table
1.2 below:
Table 1.2: Specific energy consumption for a typical unit (M/s Urmila Rice Mill)
1.3 Existing technology/equipment
1.3.1 Description of existing technology
More than 50% of the rice mills are old more than 15 years and these industries has
installed old and local make equipments like paddy cleaners and separators. The present
S. No. Type of energy Units Specific Energy Consumption
1 Electricity kWh/ ton 13.2
Separator 1.0 TPH
5
equipment has the following disadvantages w.r.t power consumption, quality and
productivity
Inferior design and hence more power consumption w.r.t. the technologies
available in the market.
Lower processing capacity for the same power consumption.
Cleaning of the unshelled paddy rice from brown rice is poor and cleaning
efficiency is also poor.
Due to local make and very old system, detail specifications are not available. The existing
separotor’s technical specifications and operating parameters are furnished in Table 1.3
below:
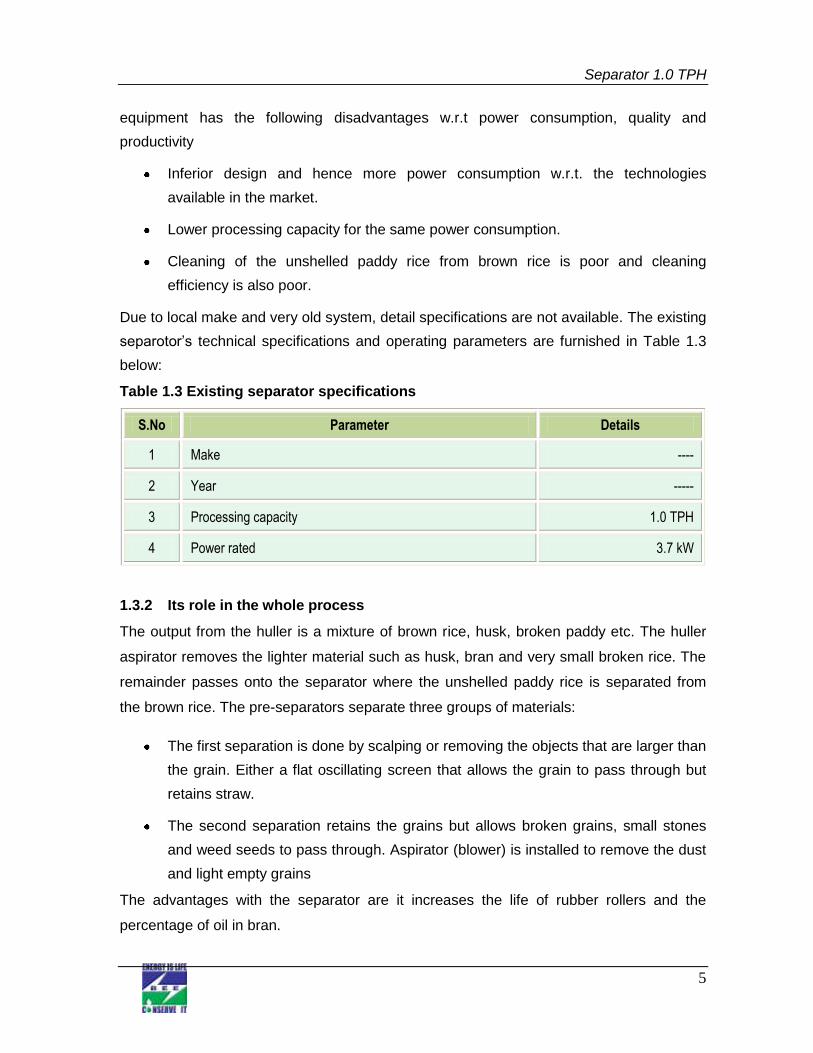
Table 1.3 Existing separator specifications
S.No Parameter Details
1 Make ----
2 Year -----
3 Processing capacity 1.0 TPH
4 Power rated 3.7 kW
1.3.2 Its role in the whole process
The output from the huller is a mixture of brown rice, husk, broken paddy etc. The huller
aspirator removes the lighter material such as husk, bran and very small broken rice. The
remainder passes onto the separator where the unshelled paddy rice is separated from
the brown rice. The pre-separators separate three groups of materials:
The first separation is done by scalping or removing the objects that are larger than
the grain. Either a flat oscillating screen that allows the grain to pass through but
retains straw.
The second separation retains the grains but allows broken grains, small stones
and weed seeds to pass through. Aspirator (blower) is installed to remove the dust
and light empty grains
The advantages with the separator are it increases the life of rubber rollers and the
percentage of oil in bran.
Separator 1.0 TPH
6
1.4 Establishing the baseline for the equipment to be changed
1.4.1 Design and operating parameters power consumption
The present power consumption of a separator is 3.5 kW. The separator is operated for 12
hours in a day and generally operated for 200 days. The annual power consumption in the
separator is 8400 kWh. The operating parameters of the existing separator machine are
furnished in Table 1.4 below:
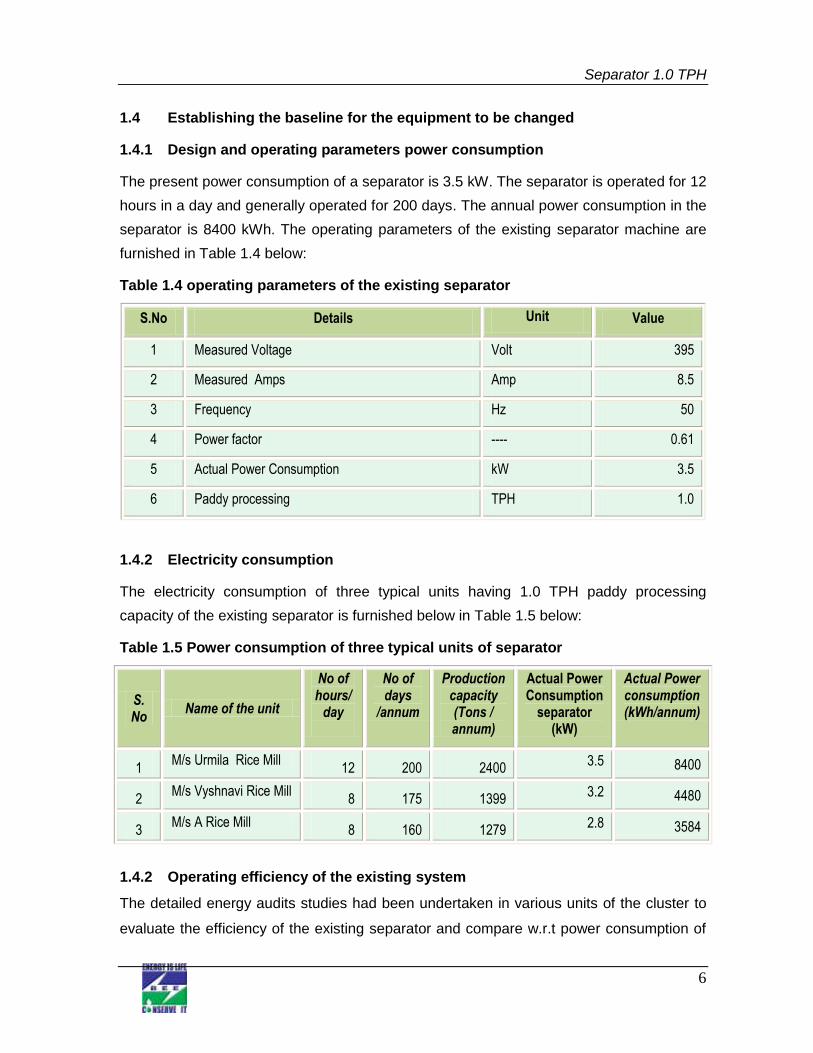
Table 1.4 operating parameters of the existing separator
S.No Details Unit Value
1 Measured Voltage Volt 395
2 Measured Amps Amp 8.5
3 Frequency Hz 50
4 Power factor ---- 0.61
5 Actual Power Consumption kW 3.5
6 Paddy processing TPH 1.0
1.4.2 Electricity consumption
The electricity consumption of three typical units having 1.0 TPH paddy processing
capacity of the existing separator is furnished below in Table 1.5 below:
Table 1.5 Power consumption of three typical units of separator
S. No
Name of the unit
No of hours/
day
No of days
/annum
Production capacity (Tons / annum)
Actual Power Consumption
separator (kW)
Actual Power consumption (kWh/annum)
1 M/s Urmila Rice Mill
12 200 2400 3.5 8400
2 M/s Vyshnavi Rice Mill
8 175 1399 3.2 4480
3 M/s A Rice Mill
8 160 1279 2.8 3584
1.4.2 Operating efficiency of the existing system
The detailed energy audits studies had been undertaken in various units of the cluster to
evaluate the efficiency of the existing separator and compare w.r.t power consumption of
Separator 1.0 TPH
7
the latest separators available in the market. Based on the studies undertaken, the
separators installed in cluster units are consuming more power than the new separators
available in the market. New system will consume about 40% less power consumption.
1.5 Barriers for adoption of new and energy efficient technology / equipment
1.5.1 Technological Barriers
The major technical barriers that prevented the implementation of the new separator in the
cluster are:
Lack of awareness of the technologies in the area
Lack of technical knowledge and its losses
1.5.2 Financial Barrier
The replacement of separator with new improved design separators requires high initial
investment. Hence, many of the owners don’t show interest for implementation. Further,
the production capacities of these mills are low and operated for one shift only and further
the energy cost w.r.t paddy cost is low or negligible.
Further, lack of awareness of the losses of existing separator and monetary benefit of the
new improved design separators also one of the major factors for implementing the
technology.
Energy Efficiency Financing Schemes such as SIDBI’s, if focused on the cluster, will play
a catalytic role in implementation of identified energy conservation projects & technologies.
The cluster has significant potential for implementing the improved design separator by
replacing separator.
1.5.3 Skilled manpower
Not applicable
1.5.4 Other barrier(s)
Information on the energy efficient technologies is not available among cluster unit
owners.
Separator 1.0 TPH
8
2. EQUIPMENT OPTION FOR ENERGY EFFICIENCY IMPROVEMENT
2.1 Detailed description of technology/equipment selected
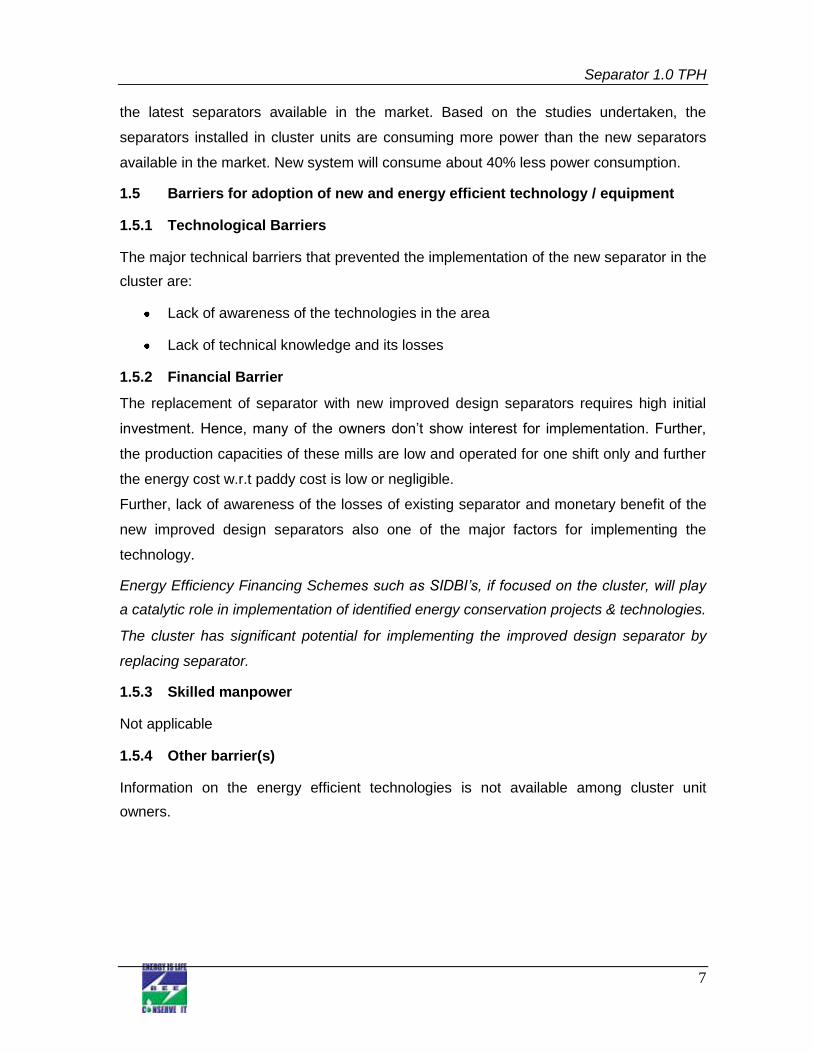
2.1.1 Description of technology
The project activity is replacement of old and inferior separator with new improved design
separator.
The new improved design separator accurately separates Oversized and Undersized
impurities and part of the Immature Grains from Paddy; the inbuilt Self-separation system
ensures optimum efficiency during the production cycle. Vibromotors make the operation
noiseless and trouble-free.
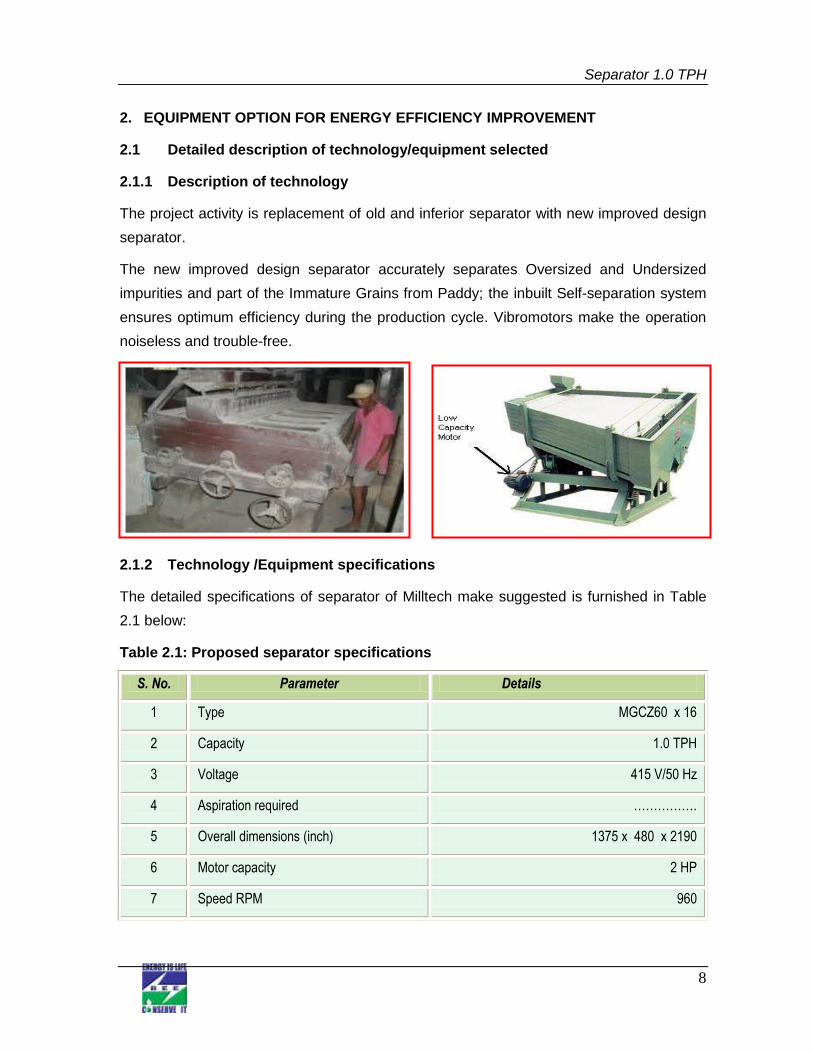
2.1.2 Technology /Equipment specifications
The detailed specifications of separator of Milltech make suggested is furnished in Table
2.1 below:
Table 2.1: Proposed separator specifications
S. No. Parameter Details
1 Type MGCZ60 x 16
2 Capacity 1.0 TPH
3 Voltage 415 V/50 Hz
4 Aspiration required …………….
5 Overall dimensions (inch) 1375 x 480 x 2190
6 Motor capacity 2 HP
7 Speed RPM 960
Separator 1.0 TPH
9
2.1.3 Justification of the technology selected & its suitability
About 50% of the rice mill units in the cluster have separators and is a very technology
adopted. Majority of these separators are very old and inferior design and consuming
more power consumption for same output. Whereas, the new improved will consume less
power and the paddy processing capacity is more than the old separators.
2.1.4 Superiority over existing technology/equipment
The following are the superior features of new improved design separator developed by
Milltech
Removes Immature grains along with other Impurities
Inbuilt separation system to avoid clogging of screens
Different screens can be mounted to suit the applications
Screens can be interchanged easily
No relatively moving parts
Maintenance free
2.1.5 Availability of the proposed technology/equipment
The separator suppliers are available at Hyderabad and at Berhampur; the Milltech
dealers are available at Berhampur. The detail of the suppliers is provided in Annexure 5.
2.1.6 Source of technology/equipment for the project
The source of the technology is indigenous and is locally available.
2.1.7 Service/technology providers
Details of service providers had been furnished in Annexure 5.
2.1.8 Terms of sales of the suppliers, etc.
The terms and conditions of the equipment supplier for supply of the separator are
furnished below:
Terms & Conditions:
40% advance and 40% after delivery of the materials and 20% after completion of
the Work
12 months guarantee from the date of delivery of the materials
Separator 1.0 TPH
10
2.1.9 Process down time during implementation
The process down time for installation of new improved design separator is considered at
one week for dismantling the existing system and installation of new machine, providing
electrical connections to the motor, cable laying, panels and starters installation etc.
2.2 Life cycle assessment and risks analysis
The life of the separator is considered at 15 years. There is no risk involved as the
separators are successfully in operation in since 3 decades in the rice mills.
2.3 Suitable unit/plant size the identified equipment
The paddy processing capacity of the present separator is 1.0 TPH and the capacity of the
new separator is 1.0 TPH and the capacity can be adjusted as per the requirement.
.
Separator 1.0 TPH
11
3. ECONOMIC BENEFITS OF NEW ENERGY EFFICIENT TECHNOLOGY
3.1 Technical benefits
3.1.1 Fuel Saving
No fuel saving is envisaged due to proposed technology
3.1.2 Electricity savings
The New Improved Design Paddy Separator will consume less power than the existing
separator and hence reduces electricity consumption. The power savings due to
installation of project activity is estimated at 4819 kWh per annum. Details of electricity
saving is given in Annexure 2.
3.1.2 Improvement in product quality
The product quality will improve to certain extent due to better cleaning of the paddy and
removes unwanted materials accurately.
3.1.3 Increase in production
The new separator has more production capacity than the existing separator and hence
there may be improvement in the production for the same duration of operation of the rice
mill.
3.1.4 Reduction in raw material consumption
Not Applicable
3.1.5 Reduction in other losses
Not applicable.
3.2 Monetary benefits
The monetary benefit due to installation of new improved design separator is estimated at
` 0.20 lakh per annum due to reduction in electricity consumption. Details of monetary
saving are given in Annexure 2.
3.3 Social benefits
3.3.1 Improvement in working environment in the plant
As installation of improved design separator will reduce the noise levels and dust and
hence working environment may improve.
Separator 1.0 TPH
12
3.3.2 Improvement in skill set of workers
The technology selected for the implementation is new and energy efficient. The
technology implemented will create awareness among the workforce and improves skills
of the workers.
3.4 Environmental benefits
3.4.1 Reduction in effluent generation
Not applicable
3.4.2 Reduction in GHG emission such as CO2, NOx, etc
The major GHG emission reduction source is CO2. The technology will reduce grid
electricity consumption and emission reductions are estimated at 4 tons of CO2 per annum
due to implementation of the project activity.
3.4.3 Reduction in other emissions like SOx
No significant impact on SOx emissions.
Separator 1.0 TPH
13
4. INSTALLATION OF NEW ENERGY EFFICIENT EQUIPMENT
4.1 Cost of equipment implementation
4.1.1 Cost of equipments
The total cost of New Improved Design Paddy Separator is estimated at ` 0.50 lakh as per
the quotation provided in Annexure 6.
As per discussions with technology provider resale value of ` 0.35 lakh for old equipment
and discount of ` 0.10 lakh on new separator has been considered.
4.1.2 Other costs
Cost included in cabling modification and commissioning is ` 0.10 lakh. Detail of project
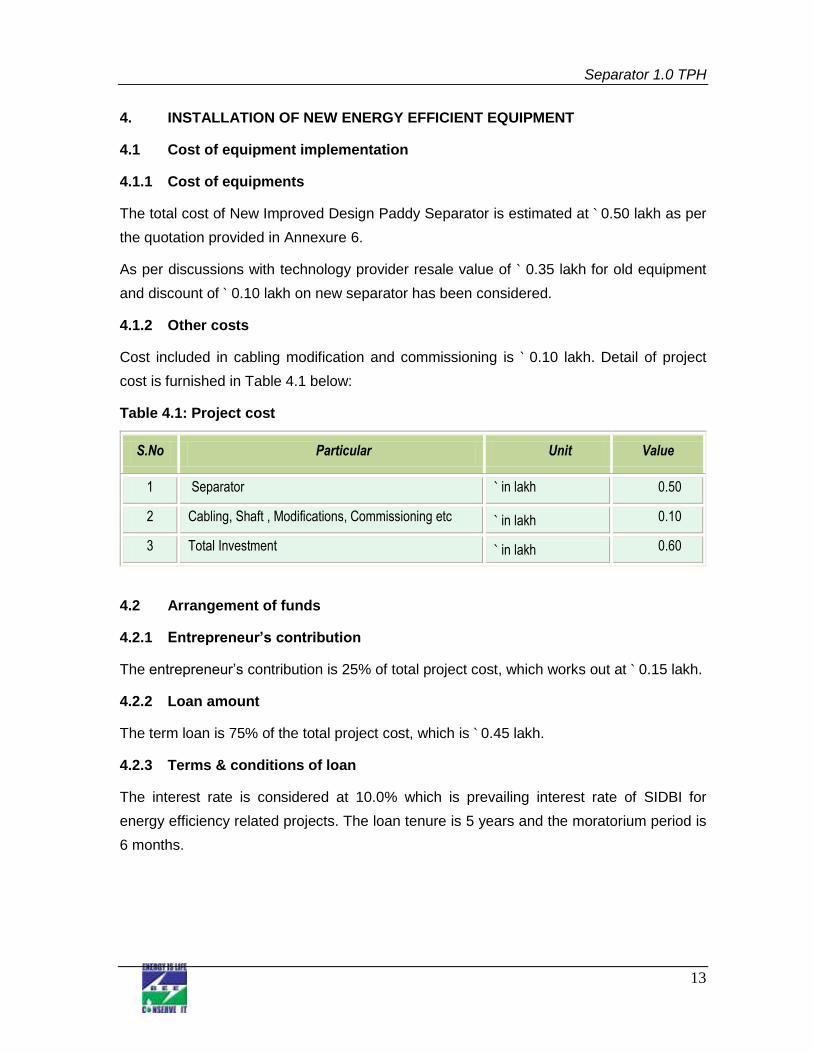
cost is furnished in Table 4.1 below:
Table 4.1: Project cost
S.No Particular Unit Value
1 Separator ` in lakh 0.50
2 Cabling, Shaft , Modifications, Commissioning etc ` in lakh 0.10
3 Total Investment ` in lakh 0.60
4.2 Arrangement of funds
4.2.1 Entrepreneur’s contribution
The entrepreneur’s contribution is 25% of total project cost, which works out at ` 0.15 lakh.
4.2.2 Loan amount
The term loan is 75% of the total project cost, which is ` 0.45 lakh.
4.2.3 Terms & conditions of loan
The interest rate is considered at 10.0% which is prevailing interest rate of SIDBI for
energy efficiency related projects. The loan tenure is 5 years and the moratorium period is
6 months.
Separator 1.0 TPH
14
4.3 Financial indicators
4.3.1 Cash flow analysis
Considering the above discussed assumptions, the net cash accruals starting with ` 0.11
lakh in the first year operation and increases to ` 0.47 lakh at the end of eighth year.
4.3.2 Simple payback period
The total project cost of the proposed technology is ` 0.60 lakh and monetary savings due
to reduction in electricity consumption is ` 0.20 lakh and the simple payback period work
out to be 2.96 years.
4.3.3 Net Present Value (NPV)
The Net present value of the investment at 10.0% interest rate works out to be ` 0.15 lakh.
4.3.4 Internal rate of return (IRR)
The after tax Internal Rate of Return of the project works out to be 17.40%. Thus the
project is financially viable.
4.3.5 Return on investment (ROI)
The average return on investment of the project activity works out at 24.10%.
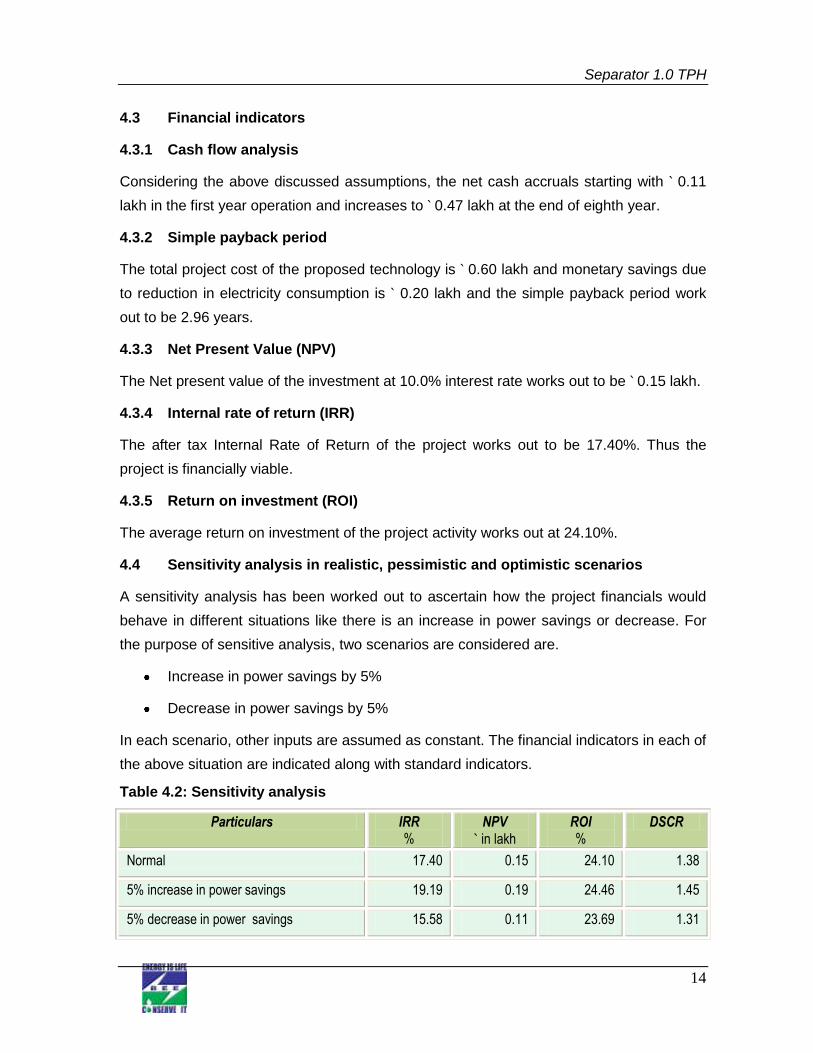
4.4 Sensitivity analysis in realistic, pessimistic and optimistic scenarios
A sensitivity analysis has been worked out to ascertain how the project financials would
behave in different situations like there is an increase in power savings or decrease. For
the purpose of sensitive analysis, two scenarios are considered are.
Increase in power savings by 5%
Decrease in power savings by 5%
In each scenario, other inputs are assumed as constant. The financial indicators in each of
the above situation are indicated along with standard indicators.
Table 4.2: Sensitivity analysis
Particulars IRR %
NPV ` in lakh
ROI %
DSCR
Normal 17.40 0.15 24.10 1.38
5% increase in power savings 19.19 0.19 24.46 1.45
5% decrease in power savings 15.58 0.11 23.69 1.31
Separator 1.0 TPH
15
4.5 Procurement and implementation schedule
The project is expected to be completed in 4 weeks from the date of release of purchase
order. The detailed schedule of project implementation is furnished in Annexure 4.
Separator 1.0 TPH
16
Electricity Rubber Sheller
Separator
Whiteners/Cones
Paddy Cleaner
Paddy
Pre Cleaner
Rice Grader
Packing
Annexure 1: Process flow diagram
Separator 1.0 TPH
17
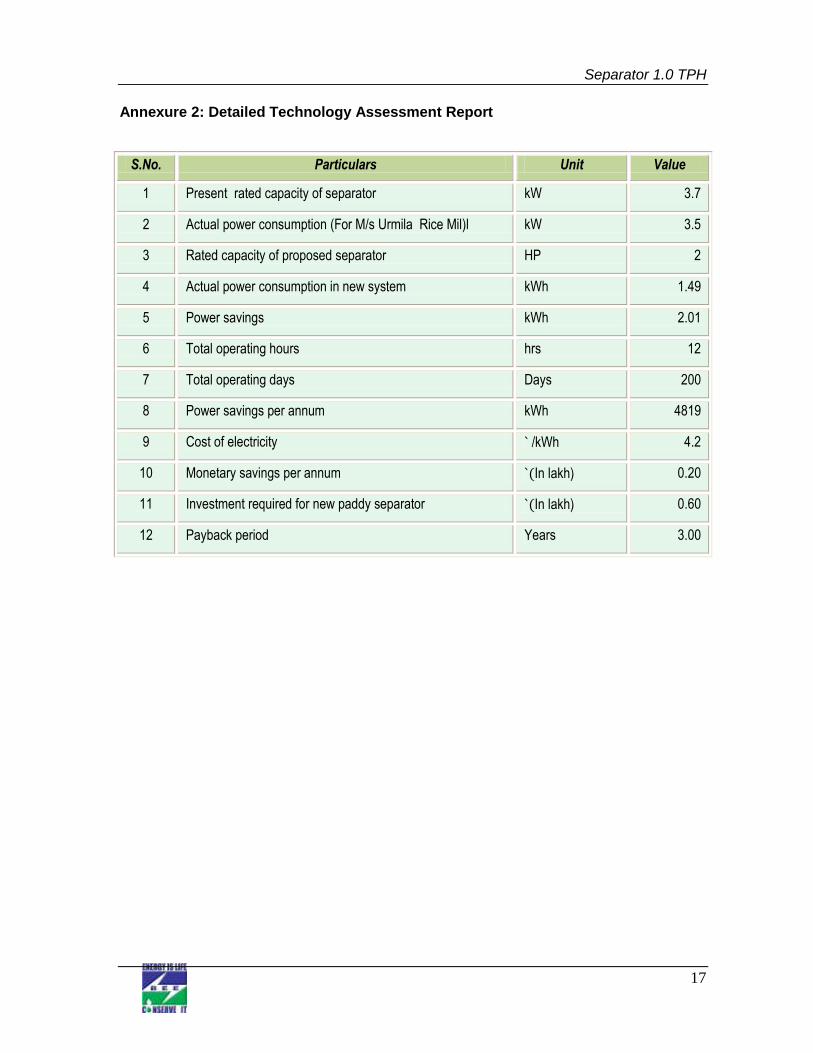
Annexure 2: Detailed Technology Assessment Report
S.No. Particulars Unit Value
1 Present rated capacity of separator kW 3.7
2 Actual power consumption (For M/s Urmila Rice Mil)l kW 3.5
3 Rated capacity of proposed separator HP 2
4 Actual power consumption in new system kWh 1.49
5 Power savings kWh 2.01
6 Total operating hours hrs 12
7 Total operating days Days 200
8 Power savings per annum kWh 4819
9 Cost of electricity ` /kWh 4.2
10 Monetary savings per annum `(In lakh) 0.20
11 Investment required for new paddy separator `(In lakh) 0.60
12 Payback period Years 3.00
Separator 1.0 TPH
18
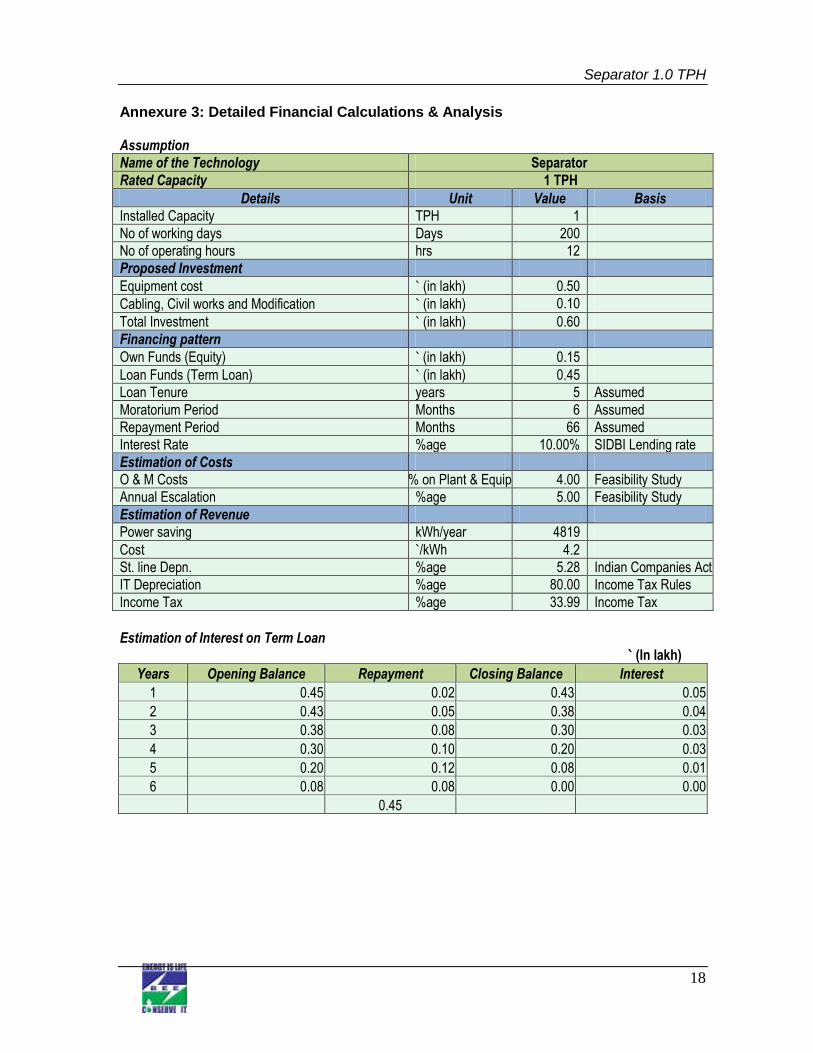
Annexure 3: Detailed Financial Calculations & Analysis
Assumption
Name of the Technology Separator
Rated Capacity 1 TPH
Details Unit Value Basis
Installed Capacity TPH 1
No of working days Days 200
No of operating hours hrs 12
Proposed Investment
Equipment cost ` (in lakh) 0.50
Cabling, Civil works and Modification ` (in lakh) 0.10
Total Investment ` (in lakh) 0.60
Financing pattern
Own Funds (Equity) ` (in lakh) 0.15
Loan Funds (Term Loan) ` (in lakh) 0.45
Loan Tenure years 5 Assumed
Moratorium Period Months 6 Assumed
Repayment Period Months 66 Assumed
Interest Rate %age 10.00% SIDBI Lending rate
Estimation of Costs
O & M Costs % on Plant & Equip 4.00 Feasibility Study
Annual Escalation %age 5.00 Feasibility Study
Estimation of Revenue
Power saving kWh/year 4819
Cost `/kWh 4.2
St. line Depn. %age 5.28 Indian Companies Act
IT Depreciation %age 80.00 Income Tax Rules
Income Tax %age 33.99 Income Tax
Estimation of Interest on Term Loan ` (In lakh)
Years Opening Balance Repayment Closing Balance Interest
1 0.45 0.02 0.43 0.05
2 0.43 0.05 0.38 0.04
3 0.38 0.08 0.30 0.03
4 0.30 0.10 0.20 0.03
5 0.20 0.12 0.08 0.01
6 0.08 0.08 0.00 0.00
0.45
Separator 1.0 TPH
19
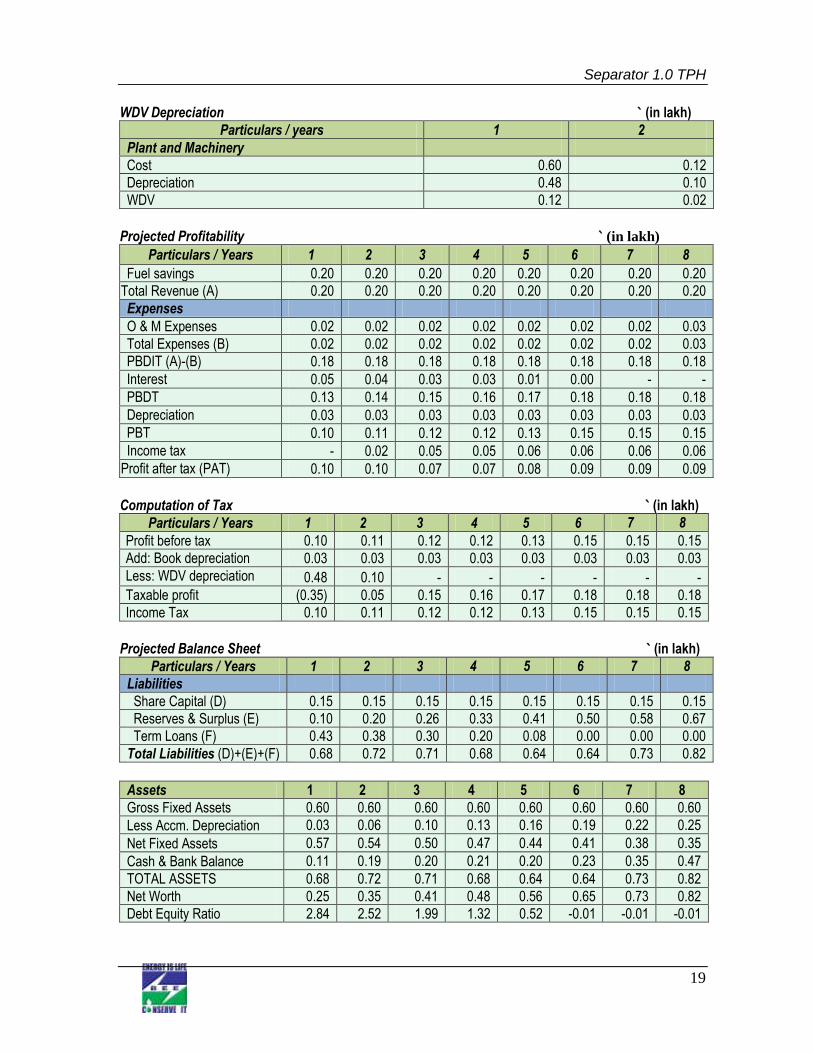
WDV Depreciation ` (in lakh)
Particulars / years 1 2
Plant and Machinery
Cost 0.60 0.12
Depreciation 0.48 0.10
WDV 0.12 0.02
Projected Profitability ` (in lakh)
Particulars / Years 1 2 3 4 5 6 7 8
Fuel savings 0.20 0.20 0.20 0.20 0.20 0.20 0.20 0.20
Total Revenue (A) 0.20 0.20 0.20 0.20 0.20 0.20 0.20 0.20
Expenses
O & M Expenses 0.02 0.02 0.02 0.02 0.02 0.02 0.02 0.03
Total Expenses (B) 0.02 0.02 0.02 0.02 0.02 0.02 0.02 0.03
PBDIT (A)-(B) 0.18 0.18 0.18 0.18 0.18 0.18 0.18 0.18
Interest 0.05 0.04 0.03 0.03 0.01 0.00 - -
PBDT 0.13 0.14 0.15 0.16 0.17 0.18 0.18 0.18
Depreciation 0.03 0.03 0.03 0.03 0.03 0.03 0.03 0.03
PBT 0.10 0.11 0.12 0.12 0.13 0.15 0.15 0.15
Income tax - 0.02 0.05 0.05 0.06 0.06 0.06 0.06
Profit after tax (PAT) 0.10 0.10 0.07 0.07 0.08 0.09 0.09 0.09
Computation of Tax ` (in lakh)
Particulars / Years 1 2 3 4 5 6 7 8
Profit before tax 0.10 0.11 0.12 0.12 0.13 0.15 0.15 0.15
Add: Book depreciation 0.03 0.03 0.03 0.03 0.03 0.03 0.03 0.03
Less: WDV depreciation 0.48 0.10 - - - - - -
Taxable profit (0.35) 0.05 0.15 0.16 0.17 0.18 0.18 0.18
Income Tax 0.10 0.11 0.12 0.12 0.13 0.15 0.15 0.15
Projected Balance Sheet ` (in lakh)
Particulars / Years 1 2 3 4 5 6 7 8
Liabilities
Share Capital (D) 0.15 0.15 0.15 0.15 0.15 0.15 0.15 0.15
Reserves & Surplus (E) 0.10 0.20 0.26 0.33 0.41 0.50 0.58 0.67
Term Loans (F) 0.43 0.38 0.30 0.20 0.08 0.00 0.00 0.00
Total Liabilities (D)+(E)+(F) 0.68 0.72 0.71 0.68 0.64 0.64 0.73 0.82
Assets 1 2 3 4 5 6 7 8
Gross Fixed Assets 0.60 0.60 0.60 0.60 0.60 0.60 0.60 0.60
Less Accm. Depreciation 0.03 0.06 0.10 0.13 0.16 0.19 0.22 0.25
Net Fixed Assets 0.57 0.54 0.50 0.47 0.44 0.41 0.38 0.35
Cash & Bank Balance 0.11 0.19 0.20 0.21 0.20 0.23 0.35 0.47
TOTAL ASSETS 0.68 0.72 0.71 0.68 0.64 0.64 0.73 0.82
Net Worth 0.25 0.35 0.41 0.48 0.56 0.65 0.73 0.82
Debt Equity Ratio 2.84 2.52 1.99 1.32 0.52 -0.01 -0.01 -0.01
Separator 1.0 TPH
20
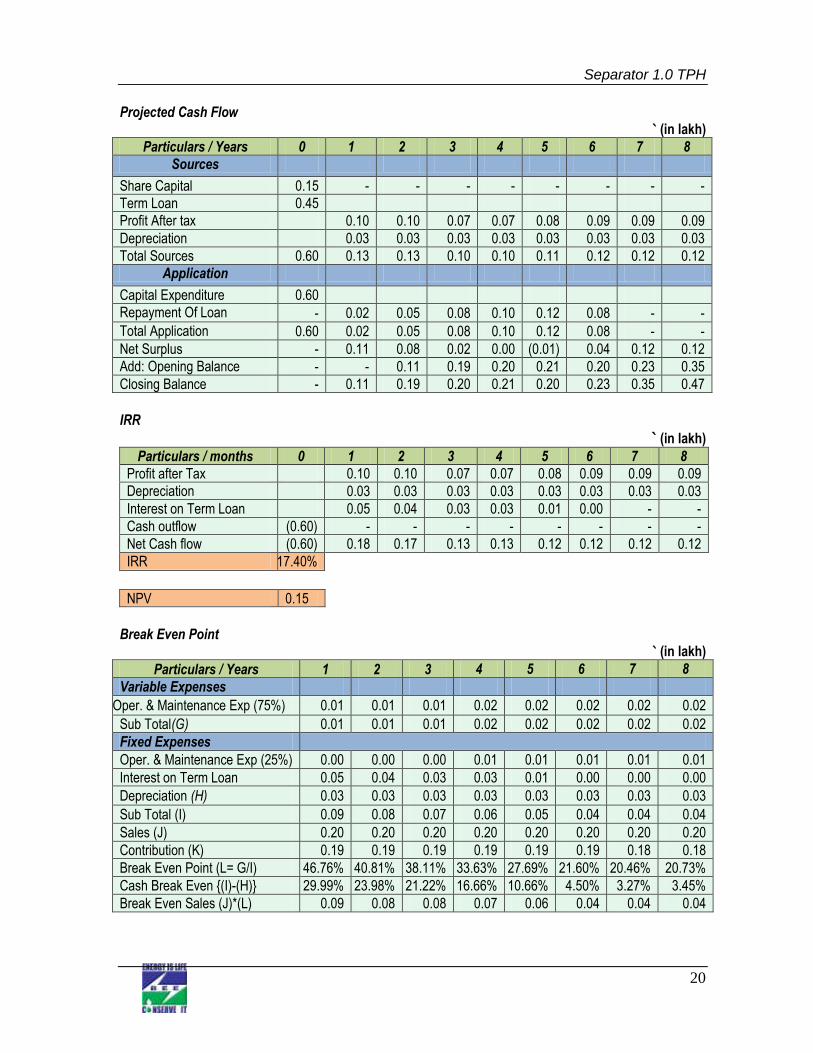
Projected Cash Flow ` (in lakh)
Particulars / Years 0 1 2 3 4 5 6 7 8
Sources
Share Capital 0.15 - - - - - - - -
Term Loan 0.45
Profit After tax 0.10 0.10 0.07 0.07 0.08 0.09 0.09 0.09
Depreciation 0.03 0.03 0.03 0.03 0.03 0.03 0.03 0.03
Total Sources 0.60 0.13 0.13 0.10 0.10 0.11 0.12 0.12 0.12
Application
Capital Expenditure 0.60
Repayment Of Loan - 0.02 0.05 0.08 0.10 0.12 0.08 - -
Total Application 0.60 0.02 0.05 0.08 0.10 0.12 0.08 - -
Net Surplus - 0.11 0.08 0.02 0.00 (0.01) 0.04 0.12 0.12
Add: Opening Balance - - 0.11 0.19 0.20 0.21 0.20 0.23 0.35
Closing Balance - 0.11 0.19 0.20 0.21 0.20 0.23 0.35 0.47
IRR
` (in lakh) Particulars / months 0 1 2 3 4 5 6 7 8
Profit after Tax 0.10 0.10 0.07 0.07 0.08 0.09 0.09 0.09
Depreciation 0.03 0.03 0.03 0.03 0.03 0.03 0.03 0.03
Interest on Term Loan 0.05 0.04 0.03 0.03 0.01 0.00 - -
Cash outflow (0.60) - - - - - - - -
Net Cash flow (0.60) 0.18 0.17 0.13 0.13 0.12 0.12 0.12 0.12
IRR 17.40%
NPV 0.15
Break Even Point
` (in lakh)
Particulars / Years 1 2 3 4 5 6 7 8
Variable Expenses
Oper. & Maintenance Exp (75%) 0.01 0.01 0.01 0.02 0.02 0.02 0.02 0.02
Sub Total(G) 0.01 0.01 0.01 0.02 0.02 0.02 0.02 0.02
Fixed Expenses
Oper. & Maintenance Exp (25%) 0.00 0.00 0.00 0.01 0.01 0.01 0.01 0.01
Interest on Term Loan 0.05 0.04 0.03 0.03 0.01 0.00 0.00 0.00
Depreciation (H) 0.03 0.03 0.03 0.03 0.03 0.03 0.03 0.03
Sub Total (I) 0.09 0.08 0.07 0.06 0.05 0.04 0.04 0.04
Sales (J) 0.20 0.20 0.20 0.20 0.20 0.20 0.20 0.20
Contribution (K) 0.19 0.19 0.19 0.19 0.19 0.19 0.18 0.18
Break Even Point (L= G/I) 46.76% 40.81% 38.11% 33.63% 27.69% 21.60% 20.46% 20.73%
Cash Break Even {(I)-(H)} 29.99% 23.98% 21.22% 16.66% 10.66% 4.50% 3.27% 3.45%
Break Even Sales (J)*(L) 0.09 0.08 0.08 0.07 0.06 0.04 0.04 0.04
Separator 1.0 TPH
21
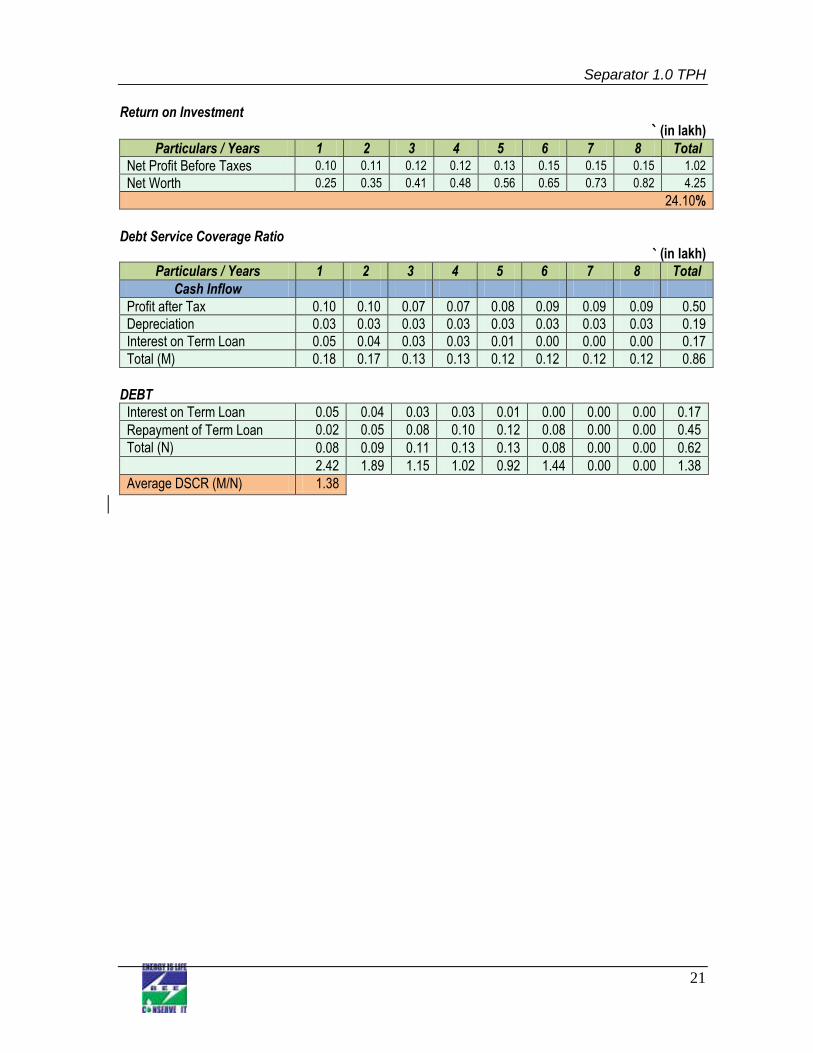
Return on Investment
` (in lakh) Particulars / Years 1 2 3 4 5 6 7 8 Total
Net Profit Before Taxes 0.10 0.11 0.12 0.12 0.13 0.15 0.15 0.15 1.02
Net Worth 0.25 0.35 0.41 0.48 0.56 0.65 0.73 0.82 4.25
24.10%
Debt Service Coverage Ratio
` (in lakh)
Particulars / Years 1 2 3 4 5 6 7 8 Total
Cash Inflow
Profit after Tax 0.10 0.10 0.07 0.07 0.08 0.09 0.09 0.09 0.50
Depreciation 0.03 0.03 0.03 0.03 0.03 0.03 0.03 0.03 0.19
Interest on Term Loan 0.05 0.04 0.03 0.03 0.01 0.00 0.00 0.00 0.17
Total (M) 0.18 0.17 0.13 0.13 0.12 0.12 0.12 0.12 0.86
DEBT
Interest on Term Loan 0.05 0.04 0.03 0.03 0.01 0.00 0.00 0.00 0.17
Repayment of Term Loan 0.02 0.05 0.08 0.10 0.12 0.08 0.00 0.00 0.45
Total (N) 0.08 0.09 0.11 0.13 0.13 0.08 0.00 0.00 0.62
2.42 1.89 1.15 1.02 0.92 1.44 0.00 0.00 1.38
Average DSCR (M/N) 1.38
Separator 1.0 TPH
22
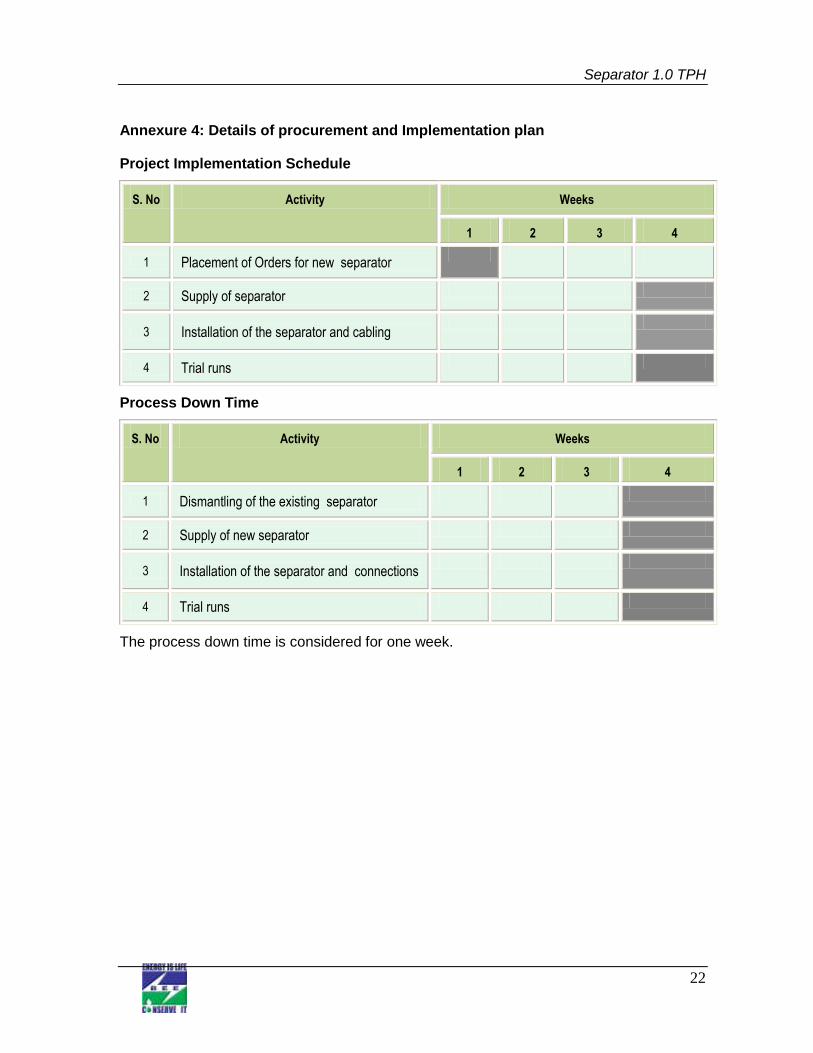
Annexure 4: Details of procurement and Implementation plan
Project Implementation Schedule
S. No Activity Weeks
1 2 3 4
1 Placement of Orders for new separator
2 Supply of separator
3 Installation of the separator and cabling
4 Trial runs
Process Down Time
S. No Activity Weeks
1 2 3 4
1 Dismantling of the existing separator
2 Supply of new separator
3 Installation of the separator and connections
4 Trial runs
The process down time is considered for one week.
Separator 1.0 TPH
23
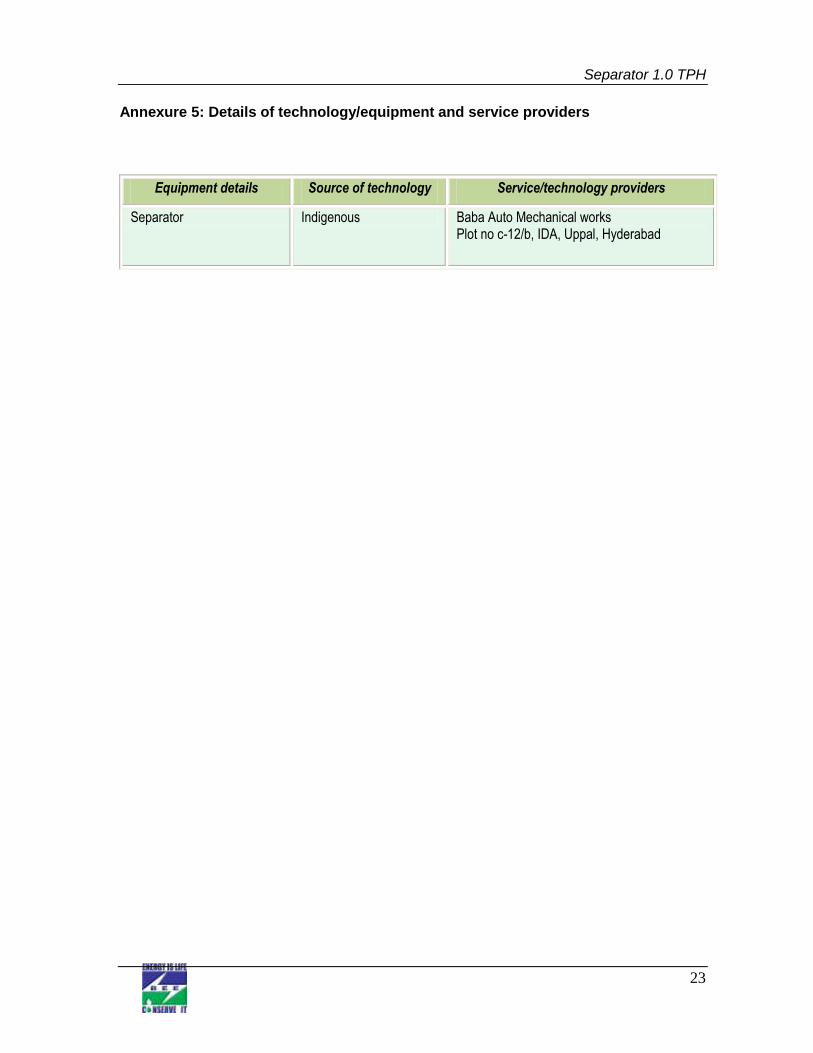
Annexure 5: Details of technology/equipment and service providers
Equipment details Source of technology Service/technology providers
Separator Indigenous Baba Auto Mechanical works Plot no c-12/b, IDA, Uppal, Hyderabad
Separator 1.0 TPH
24
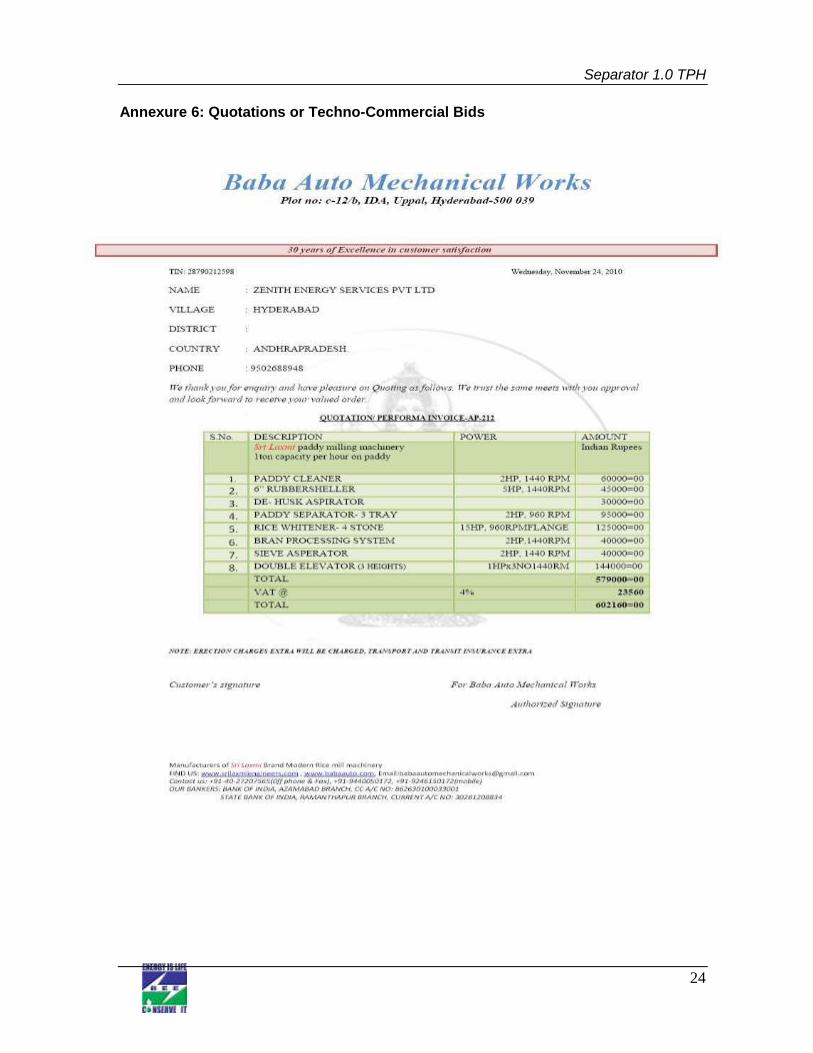
Annexure 6: Quotations or Techno-Commercial Bids

Bureau of Energy Efficiency (BEE) (Ministry of Power, Government of India) 4th Floor, Sewa Bhawan, R. K. Puram, New Delhi – 110066 Ph.: +91 – 11 – 26179699 (5 Lines), Fax: +91 – 11 – 26178352
Websites: www.bee-india.nic.in, www.energymanagertraining.com
Zenith Energy Services Pvt. Ltd 10-5-6/B, My Home Plaza, Masab Tank HYDERABAD, AP 500 028 Phone: 040 23376630, 31, Fax No.040 23322517
Website: www.zenithenergy.com
India SME Technology Services Ltd DFC Building, Plot No.37-38, D-Block, Pankha Road, Institutional Area, Janakpuri, New Delhi-110058 Tel: +91-11-28525534, Fax: +91-11-28525535 Website: www.techsmall.com


