Detecting cavitation and simultaneously occuring mechanical faults Konsta Karioja Mechatronics and machine diagnostics research group, Faculty of technology, P.O. Box 4200, FI-90014 University of Oulu, Finland E-mail: konsta.karioja@oulu.fi Sulo Lahdelma Engineering Office Mitsol Oy, Tirriäisentie 11, FI-90540 Oulu, Finland E-mail: [email protected].fi Abstract Cavitation is a somewhat common and well-known phenomenon and can cause ero- sion in machines, such as water turbines and pumps. The detection of cavitation in different machines has been quite widely investigated. However, when cavitation occurs simultaneously with different types of mechanical faults, the task is slightly more complicated. This paper discusses the application of real order derivatives, weighted l p norms and S surfaces in order to detect cavitation, mechanical loose- ness, the lack of lubrication and certain combinations of these. It is shown that these methods can produce easily interpretable information on a complex situation of this kind. Keywords: cavitation, simultaneous faults, weighted l p norm, real order derivative, fractional derivative, MIT measurement index, S surface 1. Introduction While being harmful due to erosion of materials, cavitation causes vibration. This gives the possibility to detect it by means of vibration measurements. There is also a potential risk of mechanical damage caused by vibration induced by cavitation. In condition monitoring, a change in the vibration signal is often considered to be a sign of a deteriorating condition in the machine. However, if cavitation is taking place simultaneously, the vibrations that are induced by it should be extracted from those that are due to mechanical faults.
Transcript
Detecting cavitation and simultaneously occuringmechanical faults
Konsta Karioja
Mechatronics and machine diagnostics research group, Faculty of technology,P.O. Box 4200, FI-90014 University of Oulu, Finland
Cavitation is a somewhat common and well-known phenomenon and can cause ero-sion in machines, such as water turbines and pumps. The detection of cavitationin different machines has been quite widely investigated. However, when cavitationoccurs simultaneously with different types of mechanical faults, the task is slightlymore complicated. This paper discusses the application of real order derivatives,weighted lp norms and S surfaces in order to detect cavitation, mechanical loose-ness, the lack of lubrication and certain combinations of these. It is shown thatthese methods can produce easily interpretable information on a complex situationof this kind.
Keywords: cavitation, simultaneous faults, weighted lp norm, real order derivative,fractional derivative, MIT measurement index, S surface
1. Introduction
While being harmful due to erosion of materials, cavitation causes vibration. Thisgives the possibility to detect it by means of vibration measurements. There is alsoa potential risk of mechanical damage caused by vibration induced by cavitation.In condition monitoring, a change in the vibration signal is often considered to bea sign of a deteriorating condition in the machine. However, if cavitation is takingplace simultaneously, the vibrations that are induced by it should be extracted fromthose that are due to mechanical faults.
This requires an adequate amount of measurement data and some expertise to per-form suitable signal processing for feature extraction. In the following, detectingcavitation and simultaneously occuring mechanical faults is discussed, and someresults based on laboratory experiments are presented.
2. Laboratory tests
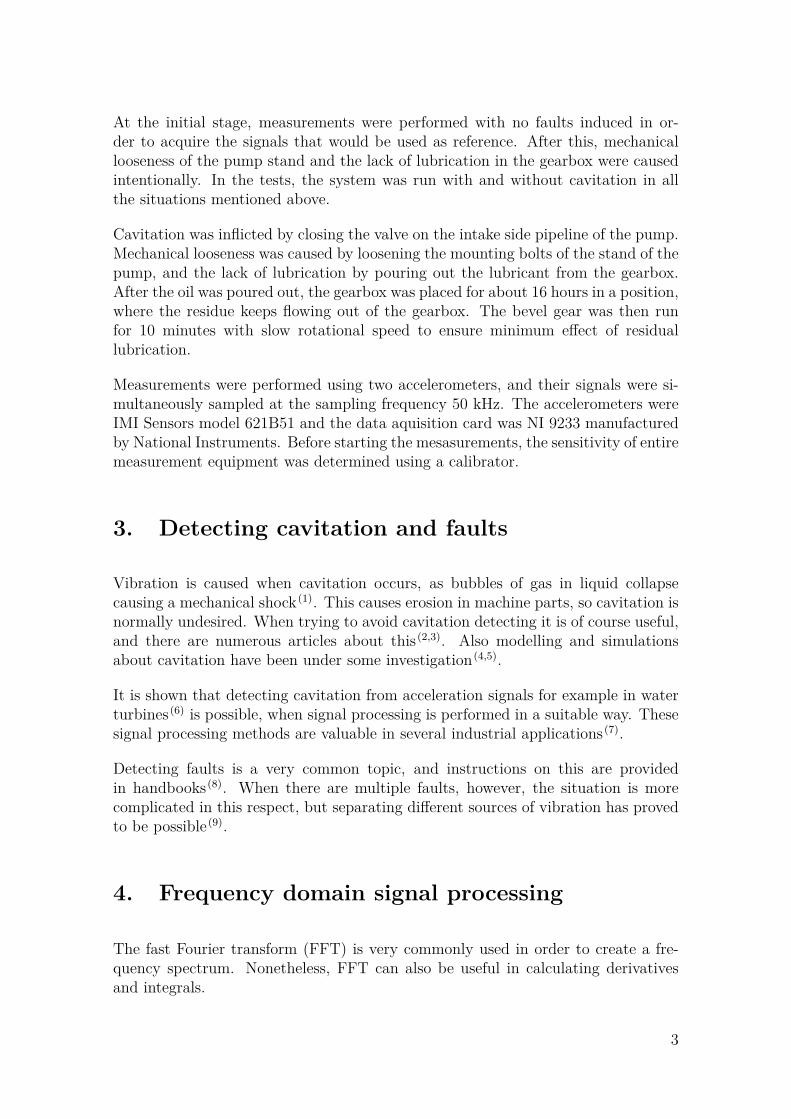
The laboratory testing was conducted at Otto von Guericke University, in Magde-burg, Germany. The test rig used was originally manufactured by G.U.N.T. Geräte-bau GmbH, and was later modified at the Otto von Guericke University. The testequipment consisted of:
• Bodywork of G.U.N.T. PT 500 test rig
• 1.1 kW electric motor manufactured by EMK
• Nordac 700E frequency converter
• Mädler 41200102 bevel gearbox with transmission ratio 1:2
• Centrifugal pump for cavitation testing, manufactured by G.U.N.T.
• 2 KTR claw clutches
A photograph of the test rig is in Figure 1.
Figure 1. The test rig
2
At the initial stage, measurements were performed with no faults induced in or-der to acquire the signals that would be used as reference. After this, mechanicallooseness of the pump stand and the lack of lubrication in the gearbox were causedintentionally. In the tests, the system was run with and without cavitation in allthe situations mentioned above.
Cavitation was inflicted by closing the valve on the intake side pipeline of the pump.Mechanical looseness was caused by loosening the mounting bolts of the stand of thepump, and the lack of lubrication by pouring out the lubricant from the gearbox.After the oil was poured out, the gearbox was placed for about 16 hours in a position,where the residue keeps flowing out of the gearbox. The bevel gear was then runfor 10 minutes with slow rotational speed to ensure minimum effect of residuallubrication.
Measurements were performed using two accelerometers, and their signals were si-multaneously sampled at the sampling frequency 50 kHz. The accelerometers wereIMI Sensors model 621B51 and the data aquisition card was NI 9233 manufacturedby National Instruments. Before starting the mesasurements, the sensitivity of entiremeasurement equipment was determined using a calibrator.
3. Detecting cavitation and faults
Vibration is caused when cavitation occurs, as bubbles of gas in liquid collapsecausing a mechanical shock (1). This causes erosion in machine parts, so cavitation isnormally undesired. When trying to avoid cavitation detecting it is of course useful,and there are numerous articles about this (2,3). Also modelling and simulationsabout cavitation have been under some investigation (4,5).
It is shown that detecting cavitation from acceleration signals for example in waterturbines (6) is possible, when signal processing is performed in a suitable way. Thesesignal processing methods are valuable in several industrial applications (7).
Detecting faults is a very common topic, and instructions on this are providedin handbooks (8). When there are multiple faults, however, the situation is morecomplicated in this respect, but separating different sources of vibration has provedto be possible (9).
4. Frequency domain signal processing
The fast Fourier transform (FFT) is very commonly used in order to create a fre-quency spectrum. Nonetheless, FFT can also be useful in calculating derivativesand integrals.
3
The real order derivative stands for a derivative, whose order can be any real number,instead of being limited to integers. The definition for real order derivative x(α) offunction x = Xeiωt is:
x(α) = ωαXei(ωt+α π2 ), (1)
where X is a constant, real number α is the order of derivative, ω is the angularfrequency, e is the Napier’s constant, i is the imaginary unit and t is a variablerepresenting time. This definition was introduced by Lahdelma in (10).
Furthermore, we can express (1) as follows:
x(α) = (iω)αx. (2)
The FFT results in a sequence with finite number of complex components {Xk},which present the phase angle and the amplitude of each term of the Fourier series.This complex spectrum can be transformed to the complex spectrum of the α orderderivative by multiplying each term {Xk} by corresponding (iωk)α, this is to say:
Xαk = (iωk)αXk (3)
As integration is the inverse procedure of the derivation, it can be calculated as‘a negative derivative’, which means using negative values of α. When desiredoperations on the sequence are complete, the time domain signal of α order derivativecan be acquired by inverse Fourier transform (FFT-1). There is a somewhat similarway of filtering the signal. The unwanted frequency components can simply bemultiplied by zero. This results in a filter with very sharp cut off.
5. Weighted lp norms and measurement indices
For detecting several faults, the weighted lp norm was applied. This norm has provedto be an effective tool in condition monitoring, and it can be applied to any type ofsignal (6,11,12,13,14). It is defined by:
∥x(α)∥p,w = (N∑
i=1wi|x(α)
i |p)1p . (4)
where the real number α is the order of derivative, x is displacement, N is thenumber of samples in signal, and the real number p > 0. This is the classical lpnorm ∥x(α)∥p when w1 = w2 = ... = wN = 1. Moreover, we end up with the formula(5), when w1 = w2 = ... = wN = 1
N. It has the same form as the generalised mean,
4
also known as the power mean or the Hölder mean. Lahdelma has introduced in (13)
the concept of the space lp.
∥x(α)∥p ≡ ( 1N
N∑i=1
|x(α)i |p)
1p = ( 1
N)
1p ∥x
(α)i ∥p. (5)
The MIT index (15) can be used to create an easily interpretable way of determiningthe scope of the relative change in the value of the norm. It is calculated by
τ MIT p1,p2,...,pnα1,α2,...,αn
= 1n
n∑i=1
bαi
||x(αi)||pi
(||x(αi)||pi)0
, (6)
where bαiis the weighting factor for αi order derivative, and the norms ||x(αi)||pi
arecalculated from signals x(αi). The norm (||x(αi)||pi
)0 is a reference, usually obtainedfrom a machine in good condition.
6. Analysis of the measurements
The S surface (12) is a three dimensional graph, which is obtained by calculating thevalues of the MIT index (6) using different order derivatives and the lp norms, andplotting the results. The frequency spectra are presented using rms values.
6.1 Vibrations induced by the motor
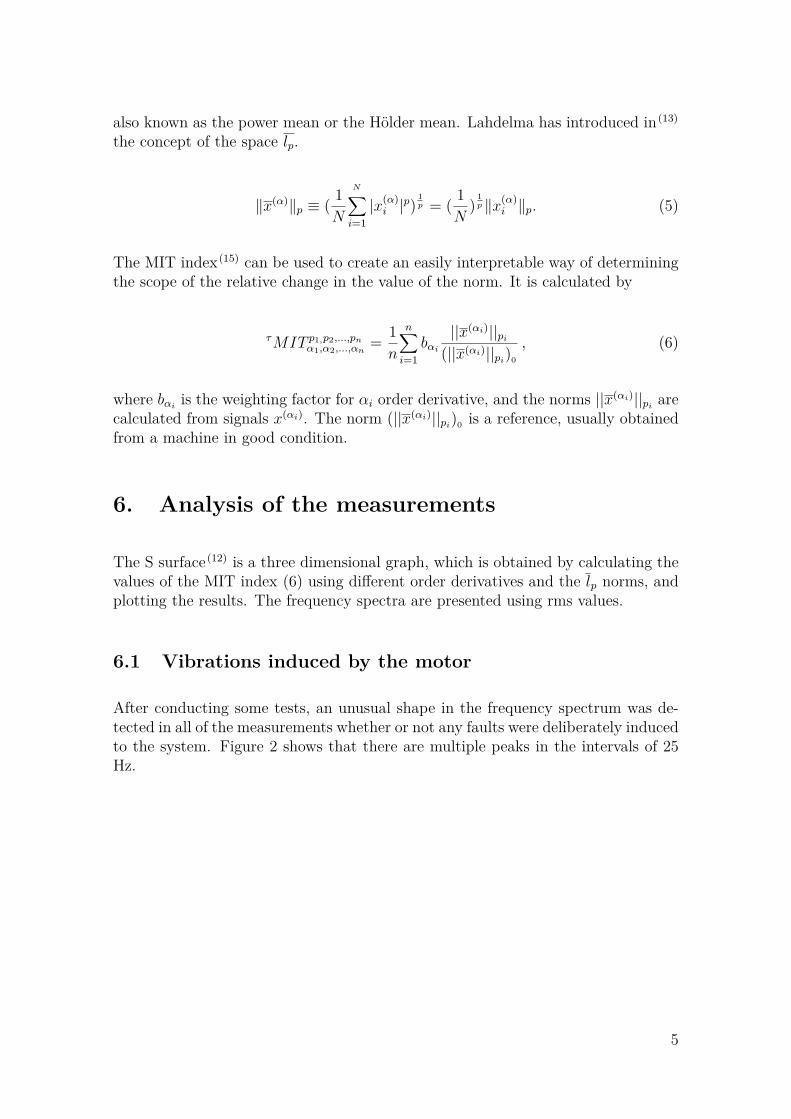
After conducting some tests, an unusual shape in the frequency spectrum was de-tected in all of the measurements whether or not any faults were deliberately inducedto the system. Figure 2 shows that there are multiple peaks in the intervals of 25Hz.
5
0 100 200 300 400 500 600 700 800 900 10000
0.05
0.1
0.15
0.2
0.25Frequency spectrum
x(2) (
m/s
2 )
Frequency (Hz)
Figure 2. Acceleration spectrum of a signal measured from the pumpwhen the rotational speed was 3000 rpm
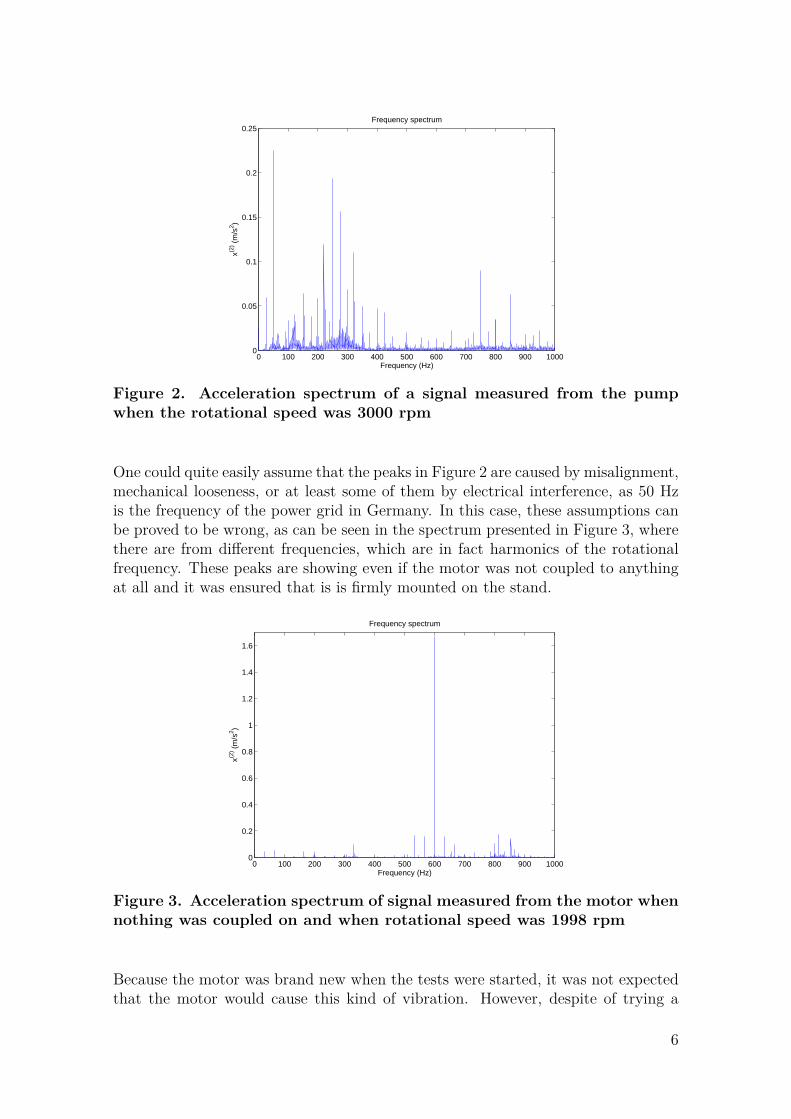
One could quite easily assume that the peaks in Figure 2 are caused by misalignment,mechanical looseness, or at least some of them by electrical interference, as 50 Hzis the frequency of the power grid in Germany. In this case, these assumptions canbe proved to be wrong, as can be seen in the spectrum presented in Figure 3, wherethere are from different frequencies, which are in fact harmonics of the rotationalfrequency. These peaks are showing even if the motor was not coupled to anythingat all and it was ensured that is is firmly mounted on the stand.
0 100 200 300 400 500 600 700 800 900 10000
0.2
0.4
0.6
0.8
1
1.2
1.4
1.6
Frequency spectrum
x(2) (
m/s
2 )
Frequency (Hz)
Figure 3. Acceleration spectrum of signal measured from the motor whennothing was coupled on and when rotational speed was 1998 rpm
Because the motor was brand new when the tests were started, it was not expectedthat the motor would cause this kind of vibration. However, despite of trying a
6
number of different settings for the frequency converter, the vibration did not changesubstantially. In the end it was concluded that there may have been some kind ofdefect in the motor or in the frequency converter, but as the vibration level was verylow after all, this could not be considered very exceptional. In fact, the vibrationcan be considered to be on acceptable level, even if it is due to fault of some kind.Nonetheless, this phenomenon is not insignificant enough to be ignored in furtheranalysis.
6.2 Cavitation
Acceleration signals measured from the pump with and without cavitation are shownFigure 4. The difference can be seen even if it cannot be considered very dramatic.
(a)
0 0.5 1 1.5 2 2.5 3 3.5 4−30
−20
−10
0
10
20
30Time domain signal
Time (s)
x(2) (
m/s
2 )
(b)
0 0.5 1 1.5 2 2.5 3 3.5 4−30
−20
−10
0
10
20
30Time domain signal
Time (s)
x(2) (
m/s
2 )
Figure 4. Acceleration signals from the frequency range 3...15000 Hzmeasured from the pump. Rotational speed was 3000 rpm: (a) in theinitial situation and (b) when there is cavitation
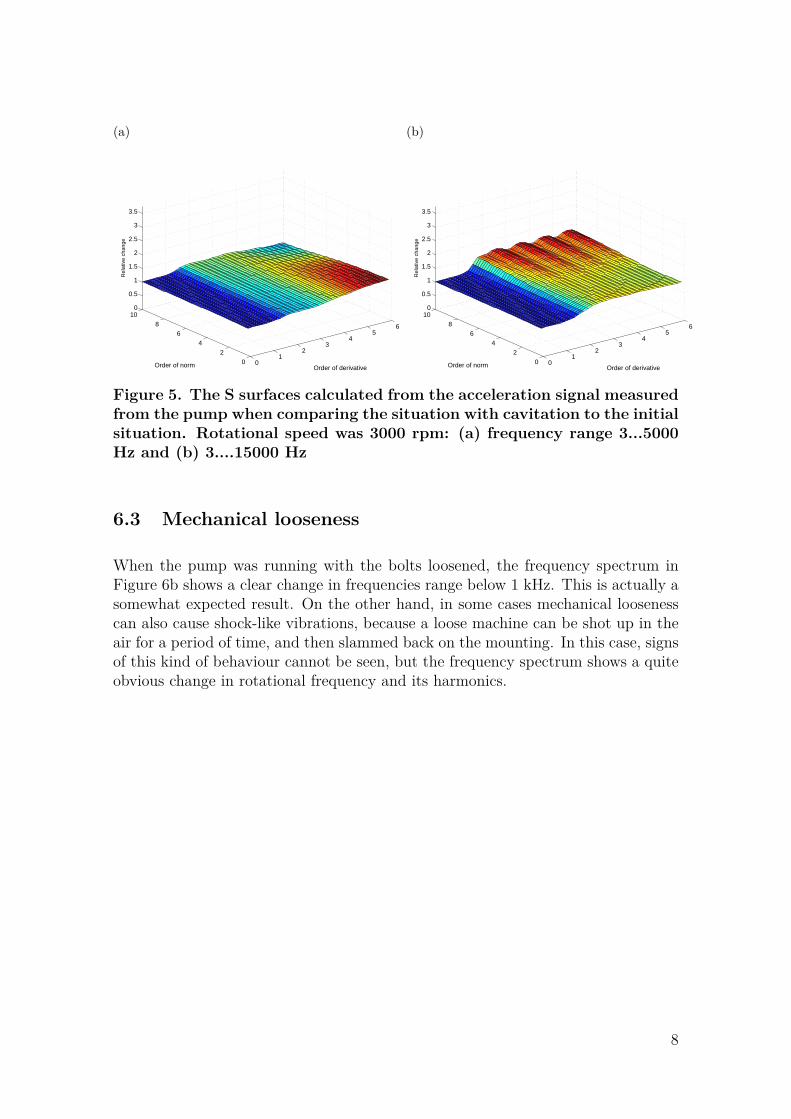
Figure 5 shows the S surfaces calculated from the signals in Figure 4 from twodifferent frequency ranges. It can be seen that in the originally used frequencyrange the maximum relative change is greater than in the case where band-passfiltering from 3 to 5000 Hz is used. It can also be stated, that the S surface inFigure 5b is rather interesting. The relative change in lp norms of the order around4 and above is fluctuating, which can be seen as ’ridges’ to the S surface. This is avery good example indicating that using several orders of derivative can be usefulwhen trying to determine the best features for a certain case. It is quite obvious toowhy using S surface is sensible in this case, because it shows the optimum orders ofnorm and derivative very easily.
7
(a)
01
23
45
6
0
2
4
6
8
100
0.5
1
1.5
2
2.5
3
3.5
Order of derivativeOrder of norm
Rel
ativ
e ch
ange
(b)
01
23
45
6
0
2
4
6
8
100
0.5
1
1.5
2
2.5
3
3.5
Order of derivativeOrder of norm
Rel
ativ
e ch
ange
Figure 5. The S surfaces calculated from the acceleration signal measuredfrom the pump when comparing the situation with cavitation to the initialsituation. Rotational speed was 3000 rpm: (a) frequency range 3...5000Hz and (b) 3....15000 Hz
6.3 Mechanical looseness
When the pump was running with the bolts loosened, the frequency spectrum inFigure 6b shows a clear change in frequencies range below 1 kHz. This is actually asomewhat expected result. On the other hand, in some cases mechanical loosenesscan also cause shock-like vibrations, because a loose machine can be shot up in theair for a period of time, and then slammed back on the mounting. In this case, signsof this kind of behaviour cannot be seen, but the frequency spectrum shows a quiteobvious change in rotational frequency and its harmonics.
8
(a)
0 100 200 300 400 500 600 700 800 900 10000
0.1
0.2
0.3
0.4
0.5
0.6
0.7
0.8
0.9
1
Frequency spectrum
x(2) (
m/s
2 )
Frequency (Hz)
(b)
0 100 200 300 400 500 600 700 800 900 10000
0.1
0.2
0.3
0.4
0.5
0.6
0.7
0.8
0.9
1
Frequency spectrum
x(2) (
m/s
2 )
Frequency (Hz)
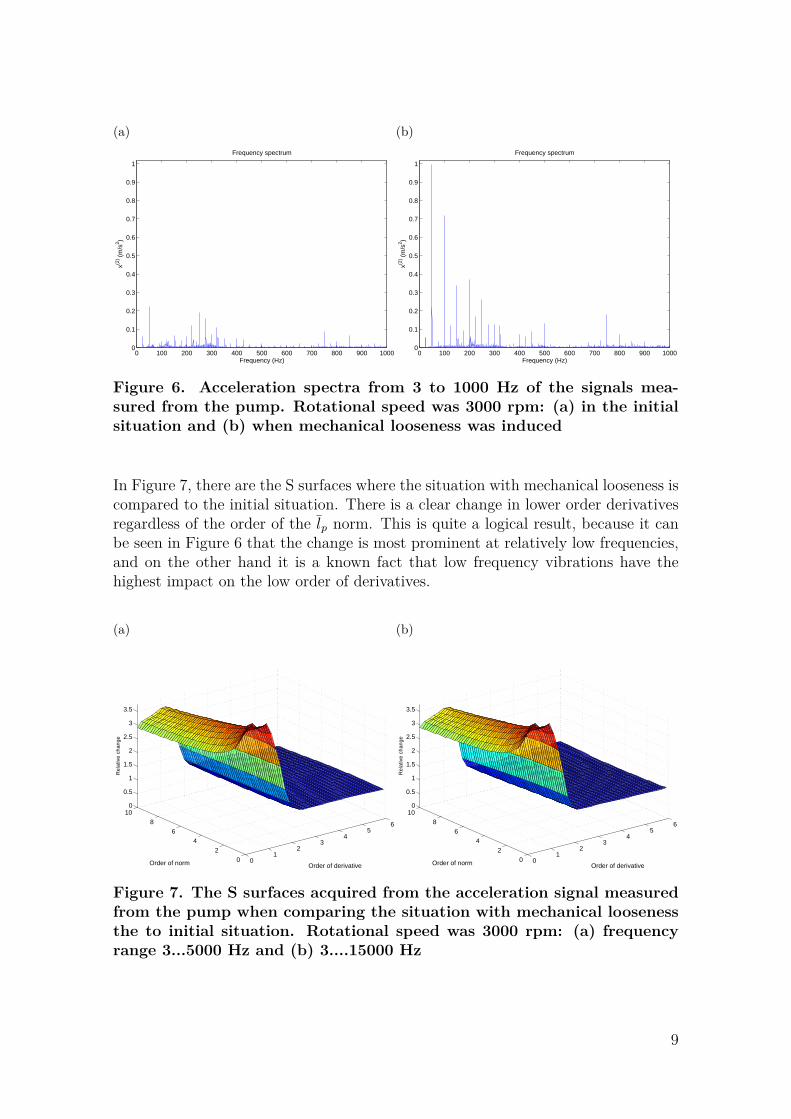
Figure 6. Acceleration spectra from 3 to 1000 Hz of the signals mea-sured from the pump. Rotational speed was 3000 rpm: (a) in the initialsituation and (b) when mechanical looseness was induced
In Figure 7, there are the S surfaces where the situation with mechanical looseness iscompared to the initial situation. There is a clear change in lower order derivativesregardless of the order of the lp norm. This is quite a logical result, because it canbe seen in Figure 6 that the change is most prominent at relatively low frequencies,and on the other hand it is a known fact that low frequency vibrations have thehighest impact on the low order of derivatives.
(a)
01
23
45
6
0
2
4
6
8
100
0.5
1
1.5
2
2.5
3
3.5
Order of derivativeOrder of norm
Rel
ativ
e ch
ange
(b)
01
23
45
6
0
2
4
6
8
100
0.5
1
1.5
2
2.5
3
3.5
Order of derivativeOrder of norm
Rel
ativ
e ch
ange
Figure 7. The S surfaces acquired from the acceleration signal measuredfrom the pump when comparing the situation with mechanical loosenessthe to initial situation. Rotational speed was 3000 rpm: (a) frequencyrange 3...5000 Hz and (b) 3....15000 Hz
9
6.4 Lack of lubricant
Lack of lubrication was caused to the gearbox by simply pouring out the lubricant,but not washing it off. To achieve a situation where the amount of lubricant iscertainly inadequate, the gearbox was run for 10 minutes to heat it up and thus todecrease the viscosity of the oil. After this the lubricant was let to pour out of thegearbox for 20 hours. After removing the lubricant, the gearbox was run for aboutten minutes at slow speed before starting the measurements. The purpose of thisaction was to reduce the effect of residual lubrication. The measurements analysedhere were performed after the gearbox had been running for about 15 minutes andafter removing the lubricant, so it is quite certain the the residue of the lubricanthad minimum effect, if any.
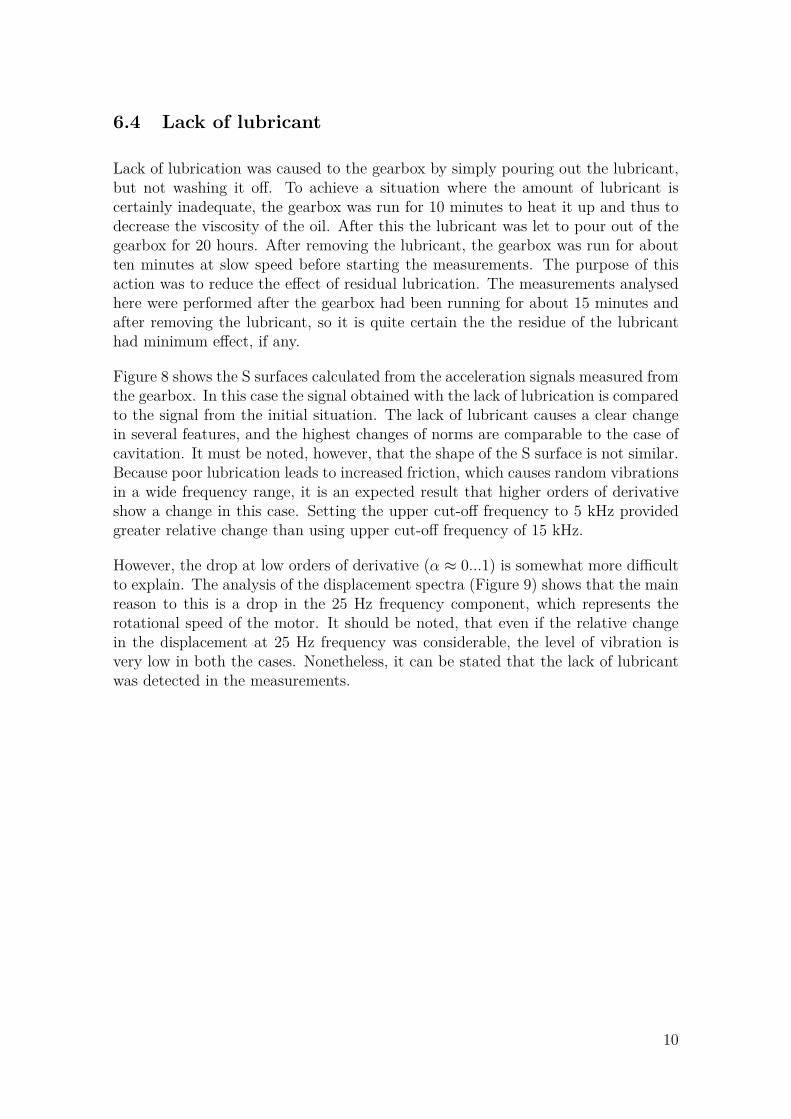
Figure 8 shows the S surfaces calculated from the acceleration signals measured fromthe gearbox. In this case the signal obtained with the lack of lubrication is comparedto the signal from the initial situation. The lack of lubricant causes a clear changein several features, and the highest changes of norms are comparable to the case ofcavitation. It must be noted, however, that the shape of the S surface is not similar.Because poor lubrication leads to increased friction, which causes random vibrationsin a wide frequency range, it is an expected result that higher orders of derivativeshow a change in this case. Setting the upper cut-off frequency to 5 kHz providedgreater relative change than using upper cut-off frequency of 15 kHz.
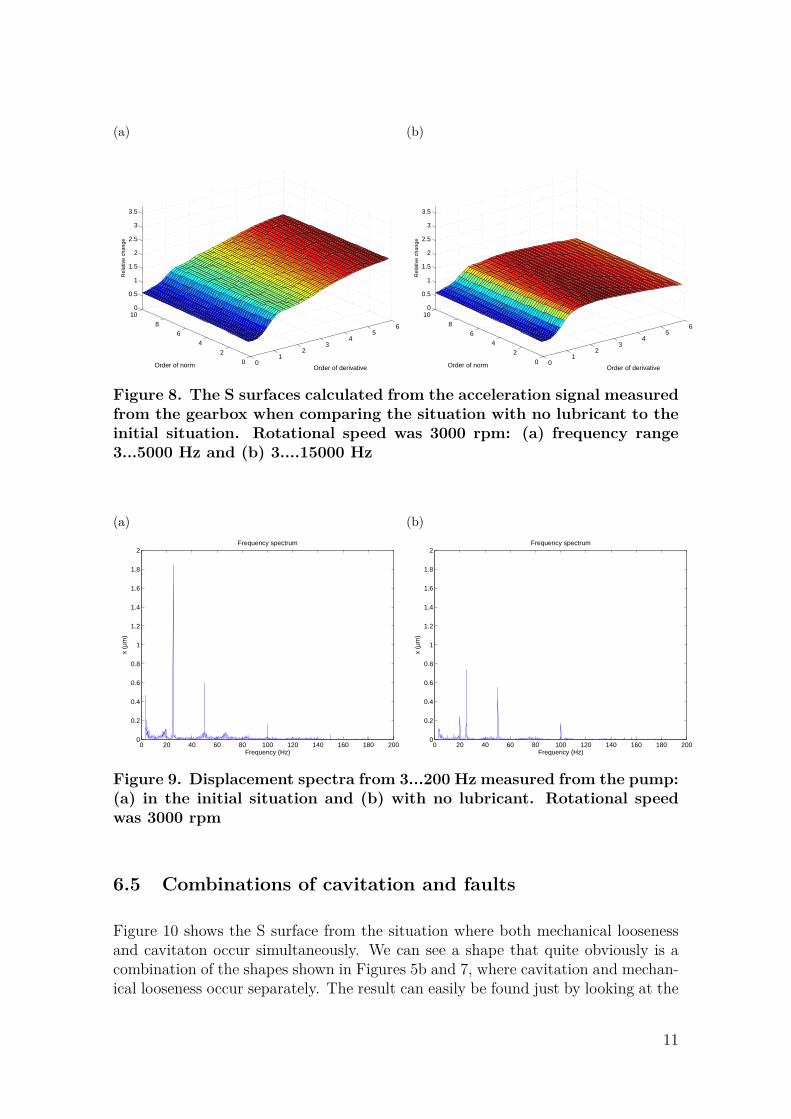
However, the drop at low orders of derivative (α ≈ 0...1) is somewhat more difficultto explain. The analysis of the displacement spectra (Figure 9) shows that the mainreason to this is a drop in the 25 Hz frequency component, which represents therotational speed of the motor. It should be noted, that even if the relative changein the displacement at 25 Hz frequency was considerable, the level of vibration isvery low in both the cases. Nonetheless, it can be stated that the lack of lubricantwas detected in the measurements.
10
(a)
01
23
45
6
0
2
4
6
8
100
0.5
1
1.5
2
2.5
3
3.5
Order of derivativeOrder of norm
Rel
ativ
e ch
ange
(b)
01
23
45
6
0
2
4
6
8
100
0.5
1
1.5
2
2.5
3
3.5
Order of derivativeOrder of norm
Rel
ativ
e ch
ange
Figure 8. The S surfaces calculated from the acceleration signal measuredfrom the gearbox when comparing the situation with no lubricant to theinitial situation. Rotational speed was 3000 rpm: (a) frequency range3...5000 Hz and (b) 3....15000 Hz
(a)
0 20 40 60 80 100 120 140 160 180 2000
0.2
0.4
0.6
0.8
1
1.2
1.4
1.6
1.8
2Frequency spectrum
x (µ
m)
Frequency (Hz)
(b)
0 20 40 60 80 100 120 140 160 180 2000
0.2
0.4
0.6
0.8
1
1.2
1.4
1.6
1.8
2Frequency spectrum
x (µ
m)
Frequency (Hz)
Figure 9. Displacement spectra from 3...200 Hz measured from the pump:(a) in the initial situation and (b) with no lubricant. Rotational speedwas 3000 rpm
6.5 Combinations of cavitation and faults
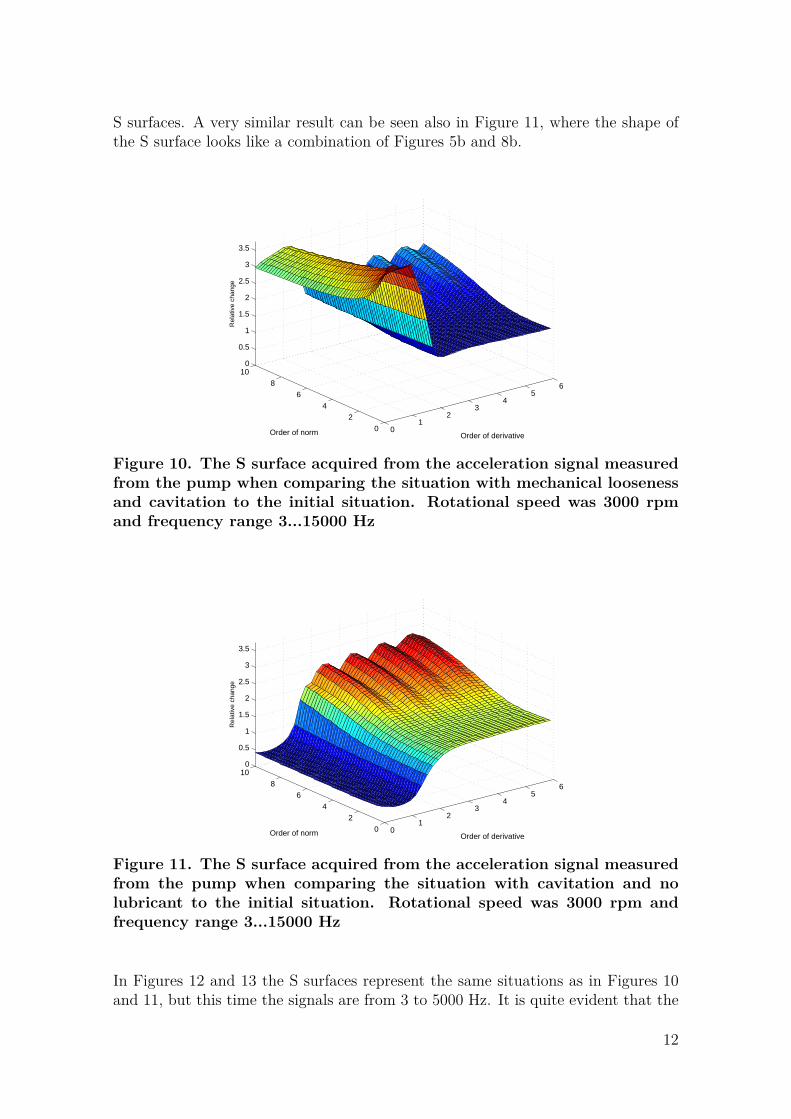
Figure 10 shows the S surface from the situation where both mechanical loosenessand cavitaton occur simultaneously. We can see a shape that quite obviously is acombination of the shapes shown in Figures 5b and 7, where cavitation and mechan-ical looseness occur separately. The result can easily be found just by looking at the
11
S surfaces. A very similar result can be seen also in Figure 11, where the shape ofthe S surface looks like a combination of Figures 5b and 8b.
01
23
45
6
0
2
4
6
8
100
0.5
1
1.5
2
2.5
3
3.5
Order of derivativeOrder of norm
Rel
ativ
e ch
ange
Figure 10. The S surface acquired from the acceleration signal measuredfrom the pump when comparing the situation with mechanical loosenessand cavitation to the initial situation. Rotational speed was 3000 rpmand frequency range 3...15000 Hz
01
23
45
6
0
2
4
6
8
100
0.5
1
1.5
2
2.5
3
3.5
Order of derivativeOrder of norm
Rel
ativ
e ch
ange
Figure 11. The S surface acquired from the acceleration signal measuredfrom the pump when comparing the situation with cavitation and nolubricant to the initial situation. Rotational speed was 3000 rpm andfrequency range 3...15000 Hz
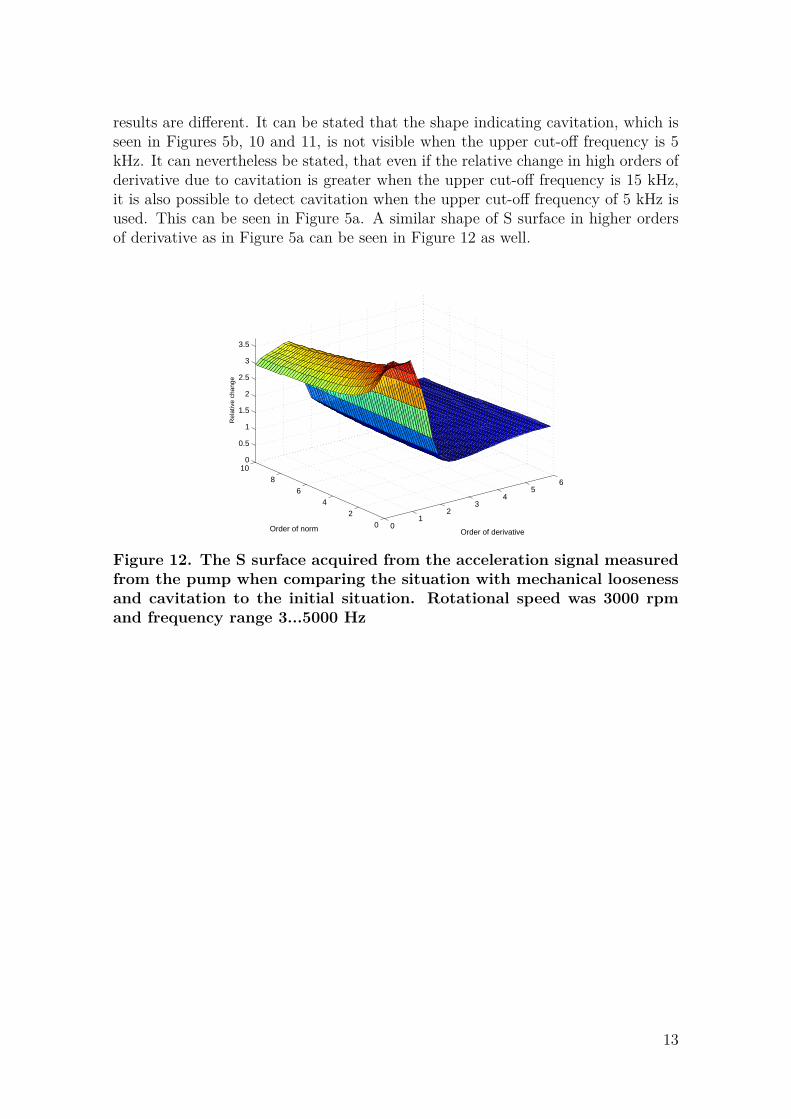
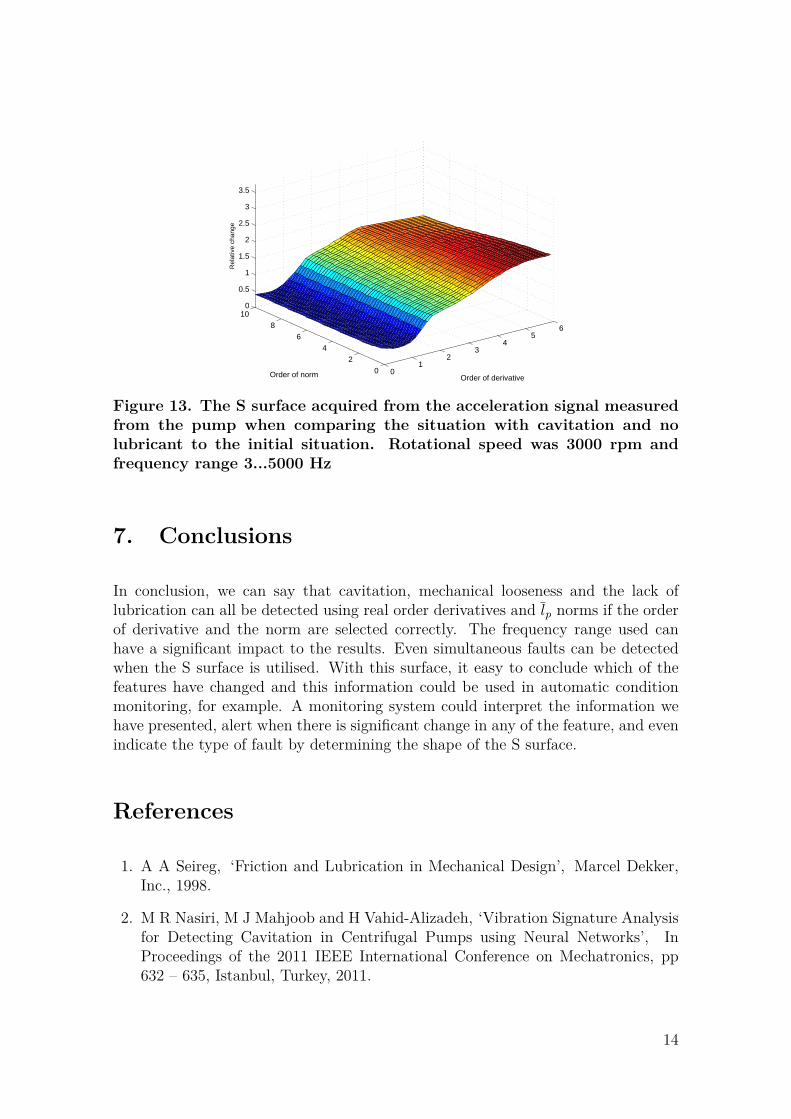
In Figures 12 and 13 the S surfaces represent the same situations as in Figures 10and 11, but this time the signals are from 3 to 5000 Hz. It is quite evident that the
12
results are different. It can be stated that the shape indicating cavitation, which isseen in Figures 5b, 10 and 11, is not visible when the upper cut-off frequency is 5kHz. It can nevertheless be stated, that even if the relative change in high orders ofderivative due to cavitation is greater when the upper cut-off frequency is 15 kHz,it is also possible to detect cavitation when the upper cut-off frequency of 5 kHz isused. This can be seen in Figure 5a. A similar shape of S surface in higher ordersof derivative as in Figure 5a can be seen in Figure 12 as well.
01
23
45
6
0
2
4
6
8
100
0.5
1
1.5
2
2.5
3
3.5
Order of derivativeOrder of norm
Rel
ativ
e ch
ange
Figure 12. The S surface acquired from the acceleration signal measuredfrom the pump when comparing the situation with mechanical loosenessand cavitation to the initial situation. Rotational speed was 3000 rpmand frequency range 3...5000 Hz
13
01
23
45
6
0
2
4
6
8
100
0.5
1
1.5
2
2.5
3
3.5
Order of derivativeOrder of norm
Rel
ativ
e ch
ange
Figure 13. The S surface acquired from the acceleration signal measuredfrom the pump when comparing the situation with cavitation and nolubricant to the initial situation. Rotational speed was 3000 rpm andfrequency range 3...5000 Hz
7. Conclusions
In conclusion, we can say that cavitation, mechanical looseness and the lack oflubrication can all be detected using real order derivatives and lp norms if the orderof derivative and the norm are selected correctly. The frequency range used canhave a significant impact to the results. Even simultaneous faults can be detectedwhen the S surface is utilised. With this surface, it easy to conclude which of thefeatures have changed and this information could be used in automatic conditionmonitoring, for example. A monitoring system could interpret the information wehave presented, alert when there is significant change in any of the feature, and evenindicate the type of fault by determining the shape of the S surface.
References
1. A A Seireg, ‘Friction and Lubrication in Mechanical Design’, Marcel Dekker,Inc., 1998.
2. M R Nasiri, M J Mahjoob and H Vahid-Alizadeh, ‘Vibration Signature Analysisfor Detecting Cavitation in Centrifugal Pumps using Neural Networks’, InProceedings of the 2011 IEEE International Conference on Mechatronics, pp632 – 635, Istanbul, Turkey, 2011.
14
3. L Alfayez, D Mba and G Dyson, ‘The application of acoustic emission fordetecting incipient cavitation and the best efficiency point of a 60 kW centrifugalpump: case study’, NDT&E International, Vol 38, No 5, pp 354 – 358, 2005.
4. D del Campo, R Castilla, G A Raush, P J Gamez Montero and E Codina,‘Numerical Analysis of External Gear Pumps Including Cavitation’, Journal ofFluids Engineering, Vol 134, No 8, 2012.
5. S L Constantin, ‘Numerical simulation for the study of cavitation forcentrifugal pump’, In Advanced Topics in Optoelectronics, Microelectronics,and Nanotechnologies VI, Proceedings of SPIE, volume 8411, 2012.
6. S Lahdelma and E Juuso, ‘Signal processing and feature extraction by usingreal order derivatives and generalised norms. Part 1: Methodology’, TheInternational Journal of Condition Monitoring, Vol 1, No 2, pp 46–53, 2011.
7. E Juuso and S Lahdelma, ‘Cavitation Indices in Power Control of KaplanWater Turbines’, In Proceedings of CM 2009/MFPT 2009, The SixthInternational Conference on Conditon Monitoring and Machinery FailurePrevention Technologies, Northampton, UK, 2009.
8. B K N Rao, editor, ‘Handbook of condition monitoring’, Elsevier AdvancedTechnology, Oxford, 1996.
9. S Lahdelma, J Laurila, J Strackeljan and R Hein, ‘Separating DifferentVibration Sources in Complex Fault Detection’, In The Eighth InternationalConference on Condition Monitoring and Machinery Failure PreventionTechnologies, 2011.
10. S Lahdelma, ‘On the Derivative of Real Number Order and its Application toCondition Monitoring’, Kunnossapito, Vol 17, No 8, pp 39–42, 1997.
11. S Lahdelma and E Juuso, ‘Signal processing and feature extraction by usingreal order derivatives and generalised norms. Part 2: Applications’, TheInternational Journal of Condition Monitoring, Vol 1, No 2, pp 54–66, 2011.
12. K Karioja and S Lahdelma, ‘Applying acceleration and strain signals for thestress evaluation of a steel cutter’, In Proceedings of CM 2013/MFPT 2013,The Tenth International Conference on Condition Monitoring and MachineryFailure Prevention Technologies, Kraków, Poland, 2013.
13. S Lahdelma and J Laurila, ‘Detecting misalignment of a claw clutch usingvibration measurements’, In Proceedings of CM 2012/MFPT 2012, TheNinth International Conference on Condition Monitoring and Machinery FailurePrevention Technologies, London, UK, 2012.
14. P S Bullen, ‘Handbook of means and their inequalities’, Kluwer AcademicPublishers, Dordrecht, The Netherlands, 2nd edition, 2003.
15
15. S Lahdelma and E Juuso, ‘Signal processing in vibration analysis’, InProceedings of CM 2008/MFPT 2008, The Fifth International Conferenceon Condition Monitoring and Machinery Failure Prevention Technologies, pp879–889, Edinburgh, UK, 2008.


![Visualization of Unsteady Behavior of Cavitation in ... · cavitation state, transition-cavitation state, and super-cavitation state in the orifice throat [5]. Under relative high](https://static.documents.pub/doc/80x56/5b4f673e7f8b9a166e8c4c74/visualization-of-unsteady-behavior-of-cavitation-in-cavitation-state-transition-cavitation.jpg)


