Detecting injector deactivation failure modes in diesel engines using time and order domain approaches Mitchell Lebold 1 , Scott Pflumm 2 , Jeffrey Banks 3 , Jonathon Bednar 4 , Karl Reichard 5 , Kenneth Fischer 6 and Joseph Stempnik 7 1,2,3,4,5 The Pennsylvania State University State College, PA 16804-0030 Telephone: (814) 865-8958 [email protected]jsp116@ arl.psu.edu jcb242@ arl.psu.edu jpb5007@ arl.psu.edu kmr5@ arl.psu.edu 6,7 US Army RDECOM - TARDEC 6501 E. 11 Mile Rd. RDTA-RS MS #204 Warren, MI 48397-5000 [email protected][email protected]ABSTRACT This paper documents the investigation of fuel injector fault detection methods for a seven liter diesel engine. This effort was conducted for the Tank Automotive Research Development Engineering Center (TARDEC) Condition Based Maintenance (CBM) team. The task was to develop algorithms capable of real-time detection of injector misfire events. The purpose of this task was to enable TARDEC’s Engine Control Management (ECM) research and development efforts to evaluate the technical feasibility of integrating automated on-board condition monitoring algorithms with future ECM monitoring and control operations. During this investigation, it was shown that multiple techniques can correctly detect and identify injector cylinder misfiring. Each individual technique has its own advantages, and this investigation focused on low computational power signal processing methods that would be suitable for embedding in an engine controller or processor. The list below includes six injector fault analysis approaches that were evaluated for this effort: 1. Injector signal based analysis 2. Vibration based analysis 3. Time domain speed encoder analysis 4. Order domain speed encoder analysis 5. FFT classifier selection techniques 6. Time domain classification techniques This paper highlights the first four diagnostics techniques. On-platform tests are suggested for technique validation and future development of these initial findings. 1. INTRODUCTION The Tank Automotive Research Development Engineering Center (TARDEC) Condition Based Maintenance (CBM) team investigated the development of a Vehicle Health Management Systems (VHMS) for ground combat platfoms. The mission of the program was to direct the development of technologies to provide the US Army with an improved diagnostic, predictive and sustainment capability for ground vehicles. _____________________ Mitchell Lebold et al. This is an open-access article distributed under the terms of the Creative Commons Attribution 3.0 United States License, which permits unrestricted use, distribution, and reproduction in any medium, provided the original author and source are credited. Disclaimer: Reference herein to any specific commercial company, product, process, or service by trademark, manufacturer, or otherwise, does not necessarily constitute or imply its endorsement, recommendation, or favoring by the United States Government or the Department of the Army (DoA). The opinions of the authors expressed herein do not necessarily state or reflect those of the United States Government or the DoA, and shall not be used for advertising or product endorsement purposes. Recommended Approval for Public Release - Distribution is Unlimited (Distribution A)
Transcript
Detecting injector deactivation failure modes in diesel engines using time and order domain approaches
Mitchell Lebold1, Scott Pflumm2, Jeffrey Banks3, Jonathon Bednar4, Karl Reichard5, Kenneth Fischer6 and Joseph
Stempnik7
1,2,3,4,5 The Pennsylvania State University State College, PA 16804-0030
This paper documents the investigation of fuel injector fault detection methods for a seven liter diesel engine. This effort was conducted for the Tank Automotive Research Development Engineering Center (TARDEC) Condition Based Maintenance (CBM) team. The task was to develop algorithms capable of real-time detection of injector misfire events. The purpose of this task was to enable TARDEC’s Engine Control Management (ECM) research and development efforts to evaluate the technical feasibility of integrating automated on-board condition monitoring algorithms with future ECM monitoring and control operations.
During this investigation, it was shown that multiple techniques can correctly detect and identify injector cylinder misfiring. Each individual technique has its own advantages, and this investigation focused on low computational power signal processing methods that would be suitable for embedding in an engine controller or processor. The list below includes six injector fault analysis approaches that were evaluated for this effort:
1. Injector signal based analysis 2. Vibration based analysis 3. Time domain speed encoder analysis 4. Order domain speed encoder analysis 5. FFT classifier selection techniques 6. Time domain classification techniques
This paper highlights the first four diagnostics techniques. On-platform tests are suggested for technique validation and future development of these initial findings.
1. INTRODUCTION
The Tank Automotive Research Development Engineering Center (TARDEC) Condition Based Maintenance (CBM) team investigated the development of a Vehicle Health Management Systems (VHMS) for ground combat platfoms. The mission of the program was to direct the development of technologies to provide the US Army with an improved diagnostic, predictive and sustainment capability for ground vehicles.
_____________________ Mitchell Lebold et al. This is an open-access article distributed under the terms of the Creative Commons Attribution 3.0 United States License, which permits unrestricted use, distribution, and reproduction in any medium, provided the original author and source are credited. Disclaimer: Reference herein to any specific commercial company, product, process, or service by trademark, manufacturer, or otherwise, does not necessarily constitute or imply its endorsement, recommendation, or favoring by the United States Government or the Department of the Army (DoA). The opinions of the authors expressed herein do not necessarily state or reflect those of the United States Government or the DoA, and shall not be used for advertising or product endorsement purposes. Recommended Approval for Public Release - Distribution is Unlimited (Distribution A)
Report Documentation Page Form ApprovedOMB No. 0704-0188
Public reporting burden for the collection of information is estimated to average 1 hour per response, including the time for reviewing instructions, searching existing data sources, gathering andmaintaining the data needed, and completing and reviewing the collection of information. Send comments regarding this burden estimate or any other aspect of this collection of information,including suggestions for reducing this burden, to Washington Headquarters Services, Directorate for Information Operations and Reports, 1215 Jefferson Davis Highway, Suite 1204, ArlingtonVA 22202-4302. Respondents should be aware that notwithstanding any other provision of law, no person shall be subject to a penalty for failing to comply with a collection of information if itdoes not display a currently valid OMB control number.
1. REPORT DATE SEP 2012 2. REPORT TYPE
3. DATES COVERED 00-00-2012 to 00-00-2012
4. TITLE AND SUBTITLE Detecting injector deactivation failure modes in diesel engines using timeand order domain approaches
5a. CONTRACT NUMBER
5b. GRANT NUMBER
5c. PROGRAM ELEMENT NUMBER
6. AUTHOR(S) 5d. PROJECT NUMBER
5e. TASK NUMBER
5f. WORK UNIT NUMBER
7. PERFORMING ORGANIZATION NAME(S) AND ADDRESS(ES) Pennsylvania State University,State College,PA,16804-0030
8. PERFORMING ORGANIZATIONREPORT NUMBER
9. SPONSORING/MONITORING AGENCY NAME(S) AND ADDRESS(ES) 10. SPONSOR/MONITOR’S ACRONYM(S)
11. SPONSOR/MONITOR’S REPORT NUMBER(S)
12. DISTRIBUTION/AVAILABILITY STATEMENT Approved for public release; distribution unlimited
13. SUPPLEMENTARY NOTES See also ADA581775. Annual Conference of the Prognostics and Health Management Society (PHM 2012)held in Minneapolis, Minnesota on September 23-27, 2012. Sponsored by the Office of Naval Research (ONR).
14. ABSTRACT This paper documents the investigation of fuel injector fault detection methods for a seven liter dieselengine. This effort was conducted for the Tank Automotive Research Development Engineering Center(TARDEC) Condition Based Maintenance (CBM) team. The task was to develop algorithms capable ofreal-time detection of injector misfire events. The purpose of this task was to enable TARDEC?s EngineControl Management (ECM) research and development efforts to evaluate the technical feasibility ofintegrating automated on-board condition monitoring algorithms with future ECM monitoring and controloperations. During this investigation, it was shown that multiple techniques can correctly detect andidentify injector cylinder misfiring. Each individual technique has its own advantages, and thisinvestigation focused on low computational power signal processing methods that would be suitable forembedding in an engine controller or processor. The list below includes six injector fault analysisapproaches that were evaluated for this effort 1. Injector signal based analysis 2. Vibration based analysis3. Time domain speed encoder analysis 4. Order domain speed encoder analysis 5. FFT classifier selectiontechniques 6. Time domain classification techniques This paper highlights the first four diagnosticstechniques. On-platform tests are suggested for technique validation and future development of theseinitial findings.
15. SUBJECT TERMS
16. SECURITY CLASSIFICATION OF: 17. LIMITATION OF ABSTRACT Same as
Report (SAR)
18. NUMBEROF PAGES
12
19a. NAME OFRESPONSIBLE PERSON
a. REPORT unclassified
b. ABSTRACT unclassified
c. THIS PAGE unclassified
Standard Form 298 (Rev. 8-98) Prescribed by ANSI Std Z39-18
Annual Conference of Prognostics and Health Management Society 2012
2
In 2010, TARDEC conducted diesel engine dynamometer testing on a seven liter diesel engine. As part of the dynamometer test schedule, an engine testing tool was used to selectively deactivate individual fuel injectors over a range of speed and load conditions. This set of tests formed the basis for the data set used in this investigation.
This effort investigated multiple approaches and documented the advantages and limitations with varying degrees of robustness, cost and complexity in terms of instrumentation, hardware and software requirements. From failure mode, effects and criticality analysis (FMECA) studies of diesel engines shown by Banks, Hines, Lebold, Campbell, Begg and Byington (2001) can be used to detect failures that will produced the greatest value for achieving high operational availability and reducing maintenance costs. For this effort, we focused on detecting injector (or combustion) related faults. We emphasize the distinction that unlike the work developed in the past by Murphy, Lebold, Reichard, Galie, and Byington (2003) the approaches described here focused on commonly installed sensors. Moreover, the goal of this work was to developsimple data collection/processing schemes for embedded solutions.
The six injector fault analysis techniques studied as part of this effort can be grouped into three domains: time, frequency, and classification. Each technique is summarized below.
Time Domain Techniques:
§ INJECTOR SIGNAL BASED ANALYSIS o Begin with calculating the timed based injector
pulse profile. o Once the pulse profile is characterized, determine
injector faults by categorizing pulse profile energy. § VIBRATION BASED ANALYSIS
o Investigate an alternative accelerometer-based approach utilizing only analog acquired signals.
o Similar to the injector signal analysis, this approach also determines injector faults by the presence of energy in the vibration signal during the specific cylinder firing event window.
• TIME DOMAIN SPEED ENCODER ANALYSIS o Investigate fault detection approaches using the
crankshaft speed encoder signal acquired from the digital timer board DAQ system.
o Determine fault based on the instantaneous speed profile of the crank shaft.
Order Domain Techniques:
• ORDER DOMAIN SPEED ENCODER ANALSIS o Investigate the order domain analysis of the
crankshaft speed encoder signal acquired from the timer board DAQ system.
o Determine fault based on the magnitude and phase at particular crankshaft orders.
Classification Domain Techniques:
• GENERAL FAULT CLASSIFICATION AND REASONING ALGORITHMS o Investigate fault detection methods using
classification/reasoning algorithms on FFT frequency bin data.
• TIME BASED CLASSIFICATION APPROACH o Investigate fault detection methods using
classification/reasoning algorithms on time domain data.
For this paper, only the time and order domain techniques will be discussed. The following sections will discuss the process for calculating injector signal profile and the four diagnostic techniques in further detail.
2. ENGINE INJECTOR ANALYSIS BACKGROUND
The purpose of injector timing analysis is to quantify the pulse duration and delay of the injection of fuel into the engine with respect to the piston’s orientation. This is usally referenced to the piston’s Top Dead Center (TDC) location of 0 degrees. Top dead center is the position of a piston in which it is farthest from the crankshaft.
In graphic terms the goal of this task is shown in Figure 1. The subsequent sub-sections describe the process by which this end result is obtained.
Figure 1. Graphic Illustration of Fuel Injector Timing
Analysis Objective
The algorithm developed to perform this task calculates this pulse width for every injector actuation event that occurs
Annual Conference of Prognostics and Health Management Society 2012
3
during the entire ten second recording. The algorithm is designed to differentiate and properly account for injector pulses consisting of single, double or triple pulse profiles. The data in Figure 2 illustrates single, triple and double pulse profiles respectively. Single pulses were typically observed at relatively low speed around 700 revolution per minute (RPM) and low load (30 lbs-ft) conditions during the initial warm-up of the engine. Triple pulses were observed as speed-load conditions were increased. Typically the right-most pulse within the three pulse profile would gradually widen as speed-load continued to increase and eventually ‘absorb’ the center pulse, thereby resulting in the two pulse profile at the highest speed - load (2200 RPM - 560 lbs-ft) condition.
a), b),
c),
Figure 2. (a): Single Injector Pulse; (b) Triple Pulse; (c)
Double Pulse The algorithm stores the computed pulse duration (∆T) and the relative delay/offset from Top Dead Center (TDC) for each respective pulse profile event occurring during the record set. In broad terms the analysis is divided into three sub-tasks:
1. Compute detection window 2. Determine true top dead center 3. Process injector pulses
While this processing technique is the basis for the first time-domain analysis approach, it is also useful for insuring that the engine controller is performing properly and that the engine is load balancing across the engine properly. The following section discusses the first time domain technique, which parses the data similarly to the approach just mentioned and looks at the energy within each combustion event window.
3. INJECTOR SIGNAL BASED ANALYSIS
This time-domain technique for injector fault detection looks at the presence of energy in the injector signal during the injection firing event window. Figure 3 illustrates the method by which signal energy is determined to exist in the detection window.
Figure 3. Detecting Injector Signal Energy in the Window of Interest
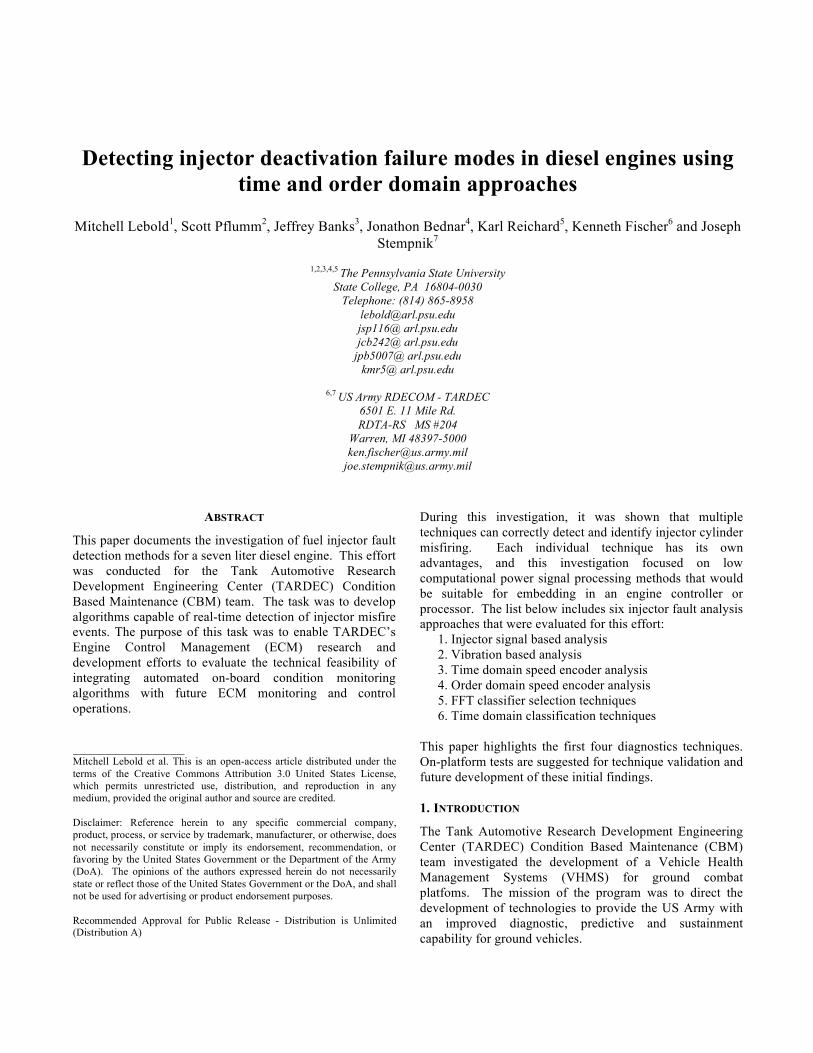
Figure 4 is a graphic representation illustrating how the algorithm identifies a cylinder three injector misfire. This plot is predicated on the fact the algorithm has identified TDC of cylinder one. Once the cylinder one TDC is located, the algorithm measures the injector signal energy in each detection window. If the signal energy does not exceed the threshold condition, the algorithm identifies the respective injector as a misfire fault. The injector signal based detection approach resulted in 100% detection rate for all of the specific load, speed and fault conditions tested. No false positives or negatives were generated using this approach. The sensing requirements for this approach are an injector signal and a once per revolution signal (1PPR/TDC signal). The signal processing approach works under varying conditions regardless of the number of injector pulses produced per cylinder, (commonly one, two or three pulses). Furthermore, due to the low computation processing power needed for this approach, this simplistic technique can be easily embedded into an engine controller or small microprocessor.
Annual Conference of Prognostics and Health Management Society 2012
4
The next method applies the same signal processing methodology to accelerometer (vibration) data collected from a location mounted on top of the engine heads.
Figure 4. Detecting a Representative Cylinder Misfire Event .
4. VIBRATION BASED ANALYSIS
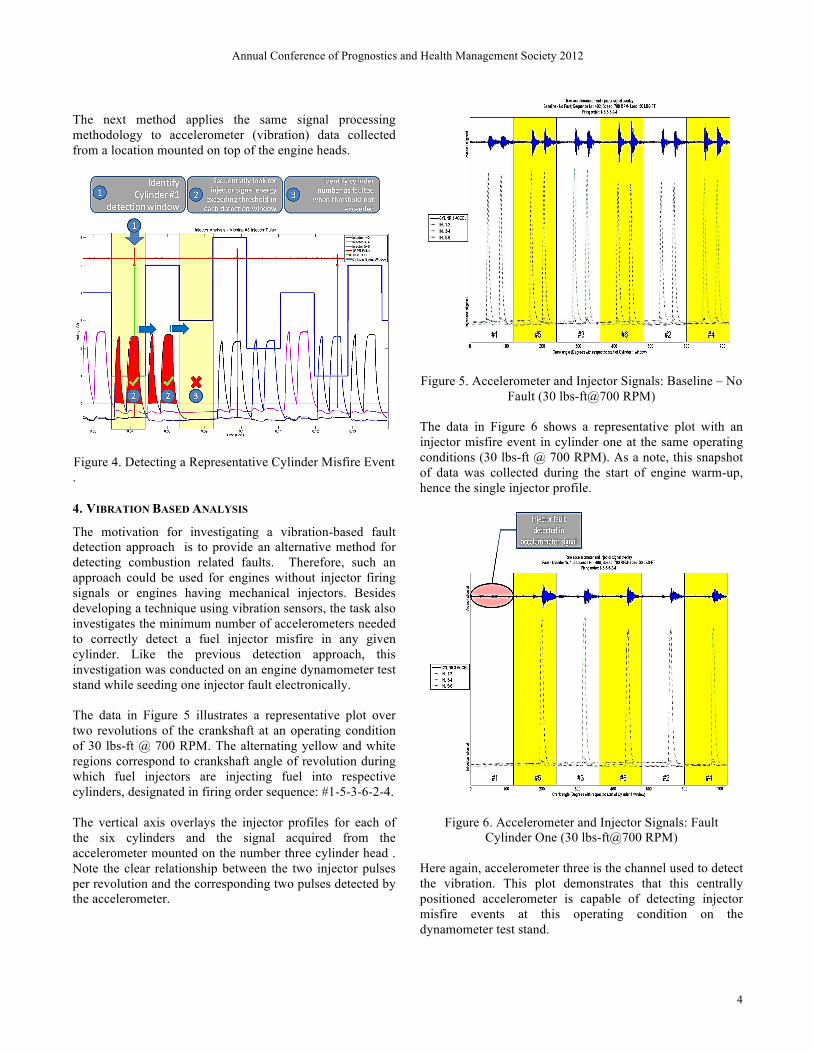
The motivation for investigating a vibration-based fault detection approach is to provide an alternative method for detecting combustion related faults. Therefore, such an approach could be used for engines without injector firing signals or engines having mechanical injectors. Besides developing a technique using vibration sensors, the task also investigates the minimum number of accelerometers needed to correctly detect a fuel injector misfire in any given cylinder. Like the previous detection approach, this investigation was conducted on an engine dynamometer test stand while seeding one injector fault electronically. The data in Figure 5 illustrates a representative plot over two revolutions of the crankshaft at an operating condition of 30 lbs-ft @ 700 RPM. The alternating yellow and white regions correspond to crankshaft angle of revolution during which fuel injectors are injecting fuel into respective cylinders, designated in firing order sequence: #1-5-3-6-2-4. The vertical axis overlays the injector profiles for each of the six cylinders and the signal acquired from the accelerometer mounted on the number three cylinder head . Note the clear relationship between the two injector pulses per revolution and the corresponding two pulses detected by the accelerometer.
Figure 5. Accelerometer and Injector Signals: Baseline – No
Fault (30 lbs-ft@700 RPM) The data in Figure 6 shows a representative plot with an injector misfire event in cylinder one at the same operating conditions (30 lbs-ft @ 700 RPM). As a note, this snapshot of data was collected during the start of engine warm-up, hence the single injector profile.
Figure 6. Accelerometer and Injector Signals: Fault Cylinder One (30 lbs-ft@700 RPM)
Here again, accelerometer three is the channel used to detect the vibration. This plot demonstrates that this centrally positioned accelerometer is capable of detecting injector misfire events at this operating condition on the dynamometer test stand.
Annual Conference of Prognostics and Health Management Society 2012
5
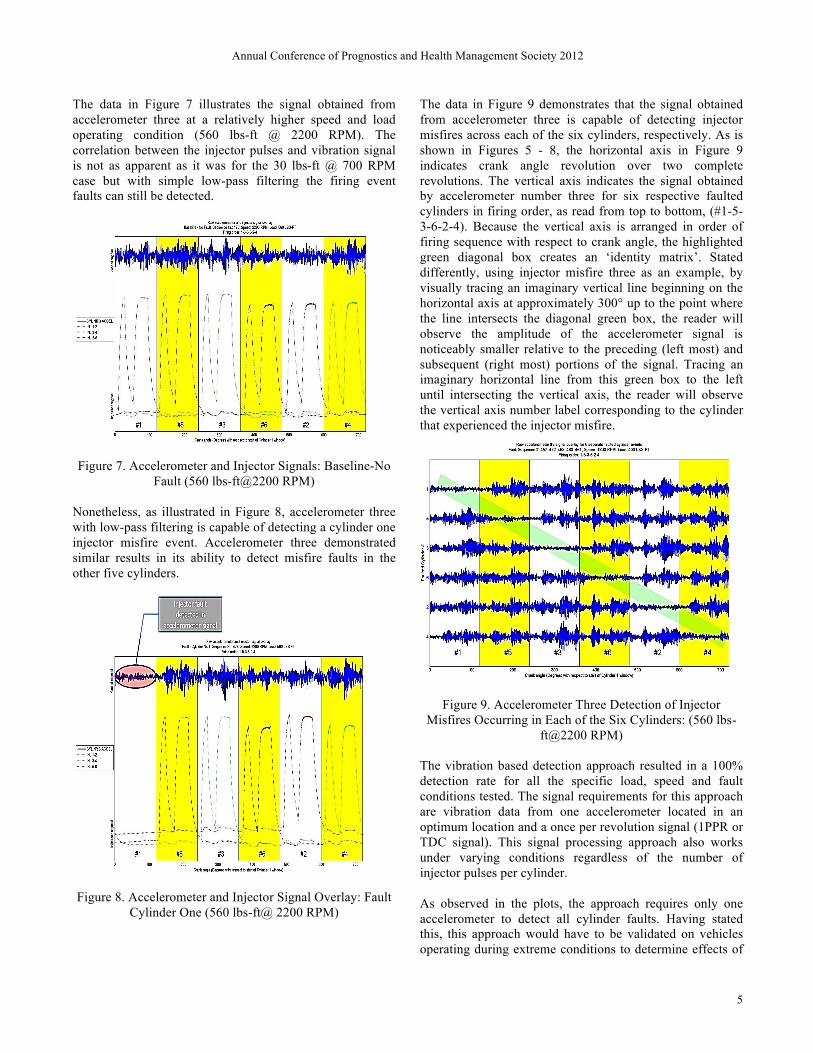
The data in Figure 7 illustrates the signal obtained from accelerometer three at a relatively higher speed and load operating condition (560 lbs-ft @ 2200 RPM). The correlation between the injector pulses and vibration signal is not as apparent as it was for the 30 lbs-ft @ 700 RPM case but with simple low-pass filtering the firing event faults can still be detected.
Figure 7. Accelerometer and Injector Signals: Baseline-No
Fault (560 lbs-ft@2200 RPM)
Nonetheless, as illustrated in Figure 8, accelerometer three with low-pass filtering is capable of detecting a cylinder one injector misfire event. Accelerometer three demonstrated similar results in its ability to detect misfire faults in the other five cylinders.
Figure 8. Accelerometer and Injector Signal Overlay: Fault
Cylinder One (560 lbs-ft@ 2200 RPM)
The data in Figure 9 demonstrates that the signal obtained from accelerometer three is capable of detecting injector misfires across each of the six cylinders, respectively. As is shown in Figures 5 - 8, the horizontal axis in Figure 9 indicates crank angle revolution over two complete revolutions. The vertical axis indicates the signal obtained by accelerometer number three for six respective faulted cylinders in firing order, as read from top to bottom, (#1-5-3-6-2-4). Because the vertical axis is arranged in order of firing sequence with respect to crank angle, the highlighted green diagonal box creates an ‘identity matrix’. Stated differently, using injector misfire three as an example, by visually tracing an imaginary vertical line beginning on the horizontal axis at approximately 300° up to the point where the line intersects the diagonal green box, the reader will observe the amplitude of the accelerometer signal is noticeably smaller relative to the preceding (left most) and subsequent (right most) portions of the signal. Tracing an imaginary horizontal line from this green box to the left until intersecting the vertical axis, the reader will observe the vertical axis number label corresponding to the cylinder that experienced the injector misfire.
Figure 9. Accelerometer Three Detection of Injector Misfires Occurring in Each of the Six Cylinders: (560 lbs-
ft@2200 RPM) The vibration based detection approach resulted in a 100% detection rate for all the specific load, speed and fault conditions tested. The signal requirements for this approach are vibration data from one accelerometer located in an optimum location and a once per revolution signal (1PPR or TDC signal). This signal processing approach also works under varying conditions regardless of the number of injector pulses per cylinder. As observed in the plots, the approach requires only one accelerometer to detect all cylinder faults. Having stated this, this approach would have to be validated on vehicles operating during extreme conditions to determine effects of
Annual Conference of Prognostics and Health Management Society 2012
6
externally induced vibrations. If validated, this simple approach can also be easily embedded into an engine controller or small embedded processor based system. It is worth noting that different engines would each require their own respective signal amplitude threshold levels in order to trigger a fault detection alert. This paper demonstrates the feasibility of the approach. Amplitude thresholds were not part of this phase of the work. They will be established and validated for integration on an engine specific basis. The next detection method discussed looks at using a commonly installed speed sensor for detecting faults by means of measuring changes in the crankshaft speed.
5. TIME DOMAIN SPEED ENCODER ANALYSIS
When an engine misfires, there will be a sudden decrease in engine speed immediately after the misfire event. Therefore, when a misfire event occurs, a torsional vibration is excited in the crankshaft and will show up in the instantaneous speed of the engine. The task of this analysis was to detect injector faults based on changes in crankshaft speed. For the purpose of this testing, the crankshaft was equipped with two speed encoders, a one pulse per revolution (1 PPR) and a 360 PPR encoder, respectively. The one PPR encoder provided an index signal for detecting each revolution of the crankshaft. The 360 PPR encoder enabled calculation of crankshaft angular velocity at a resolution of 1° of revolution. In the hypothetical ideal scenario, crankshaft speed would be constant with no fluctuations for a given steady state operating condition. However in practice, each firing event/impulse creates a sinusoidal oscillation of crankshaft speed. The blue line in Figure 10 illustrates this speed oscillation. The green, magenta and red lines indicate the injector signals for the respective cylinders. Keeping in mind the x-axis represents 720° degrees (2 complete revolutions of the crankshaft), the alternating yellow and white regions corresponds to the firing order of the respective cylinders #1-5-3-6-2-4. Two additional comments are pertinent to interpreting the following plots: 1. The speed plot is a composite mean of 50 two-revolution cycles of the crankshaft. Averaging over multiple cycles over a given steady state operating condition results in the averaging out of extraneous signal noise. The capability to synchronize multiple cycles and thereby enable multi-cycle averaging is accomplished by combining the one PPR encoder channel as an indexing signal with the injector one-two channel (green) to identify a consistent crank angle reference point. This reference point corresponds to the top dead center (TDC) position of cylinder one at the beginning of the cylinder one power stroke.
Figure 10. Sinusoidal Oscillation of Crankshaft Speed with
All Six Injectors Operating 2. The left vertical axis corresponds to the speed plot (blue line), and the right vertical axis corresponds to the fuel injector signal voltage. Signal levels greater than zero correspond to the fuel injector injecting fuel into the cylinder. The reason the injector signals are represented with green, magenta and red lines is due to the instrumentation configuration. There are three pairs of injector voltage sensors. The injectors are grouped sequentially (Green: injector one and two), (Magenta: injector three and four), (Red: injector five and six). Keep in mind, the following analysis is using the injector signals for validation purposes. The motivation for this analysis assumes the fuel injector signals would not be accessible as inputs for fielded-real world fault detection algorithm. The data in Figure 11 shows the instantaneous speed plots over two revolutions of the crankshaft for a baseline (no injector fault) condition and an injector number three fault condition. At low speed and load conditions (30 lbs-ft @ 700 RPM), the speed oscillates in a relatively sinusoidal manner for both the no-fault and fault conditions. The abnormal characteristic of an increased range in RPM variation in the crankshaft speed for the faulted case (red line) observed primarily during cylinder two’s firing order indicates the presence of an injector fault. Based on observations across multiple low speed and load setpoint conditions, the characteristic ‘spike’ in speed oscillation is typically observed one to two cylinders later in the firing order.
Annual Conference of Prognostics and Health Management Society 2012
7
Figure 11. Low Speed-Low Load Speed Profile over Two Revolutions of the Crankshaft
However it was observed during our investigation that the potential to utilize this dynamic characteristic for fault detection purposes over the full range of engine operation is limited. This is due to the fact that the ‘spike’ is not as clearly or consistently evident at higher speed and load conditions. This is discussed and shown in the following figures.
The data in Figure 12 and Figure 13 illustrate two examples of the speed variation observed at higher speed and load conditions (400 lbs-ft @ 1450 RPM and 560 lbs-ft @ 2200 RPM respectively). In Figure 12 the ‘spike’ is not evident. It appears that the relative drop in speed during the crank angle region corresponding to cylinder six firing order may be indicative of the injector three misfire.
Figure 12. Speed Profile Over Two Revolutions of the Crankshaft (400 lbs-ft @ 1450 RPM)
In Figure 13, there is a ‘spike’ occurring during cylinder two’s firing order. However there is also a ‘spike’ occurring during cylinder one’s firing order. These inconsistent speed variations require additional pre-processing prior to implementing automated fault detection algorithms.
Figure 13. Speed Profile Over Two Revolutions of the Crankshaft (560 lbs-ft@2200 RPM)
In general, the correlation between fuel injector misfire and speed fluctuation is limited when using a visual inspection of the time domain speed plots based on instantaneous speed calculation of the shaft encoder. Distinguishing injector misfires at higher speeds (>700 RPM) from ‘noisy’ engine speed data is not clear-cut and will require more sophisticated processing techniques. The instantaneous speed based detection approach is capable of detecting failure however it is computationally more complicated to implement. Visual detection of a given injector fault is apparent at different speed and load conditions. The automated detection techniques developed in the course of this investigation are effective at detecting injection related failures at low speeds and loads. At higher speeds, using instantaneous speed to distinguish specific injector faults is more difficult due to the speed fluctuations resulting from torsional vibration dynamics of the engine crankshaft. For these operating conditions, the pattern recognition algorithms would require more processing power than the other time-domain solutions presented in this paper.
For this investigation, this technique was not considered for further development due to the number of other practical methods which were found to be suitable for embedding into controllers. However, instantaneous speed measurements were found to be valuable using an order domain approach. This technique enables detection of faults using the crank encoder at high speeds and loads as well as
Annual Conference of Prognostics and Health Management Society 2012
8
the ability to identify the specific cylinder with the injector fault.
The following sections will discuss the timer board data collection approach and the order domain fault detection processing technique in further detail.
6. ORDER DOMAIN SPEED ENCODER ANALYSIS
This section will discuss the method for collecting and processing order domain data for injector fault analysis. This investigation is based upon work by Geveci, Osburn, and Franchek (2005).
6.1. Data Collection Background
Throughout the test schedule, the engine’s instantaneous crankshaft velocity was sampled using a Time Interval Measurement System (TIMS). While common A/D converters sample the amplitude of a sensor’s output at discrete time intervals, a TIMS records the number of timer board counts between the output signal’s threshold crossings. TIMS measurement systems are used in various areas in machinery health prediction systems as shown in Lebold, Maynard, Reichard (2005), Lebold Maynard (2003) and Maynard, Lebold, Groover ,Trethewey (2000).
An AVL 365C encoder system was employed to produce an output signal representative of the crankshaft’s instantaneous velocity. The encoder system’s periodic output waveform is amplified to rails using threshold values to produce a TTL logic signal having hi/low amplitudes corresponding to the encoder wheel’s optical pattern as illustrated in Figure 14.
Figure 14. Conversion of sinusoidal sensor output to square wave pulses.
The TTL logic levels are then converted into a binary representation to accurately define the pattern-passing rate. The exact transition time from low-to-high and high-to-low of an optical pattern passing is important for processing. Therefore the fastest available analog-to-digital (A/D) converter would be preferable. However, these devices are very costly and are not necessary since the replication of the signal’s temporal characteristics is not necessary. Only accurate capture of the transition times are necessary. A timer/counter board is an ideal candidate for this system because it provides a means of computing the transition time between an incoming logic signal with a high degree of resolution.
The National Instruments PCI-6602 Timer/Counter Board is a cost-effective solution and was used for data collection. With an 80MHz clock reference, pulse-width measurements from the PCI-6602 can be performed at a resolution of 0.0000000125 seconds. The data collection system is designed around the semi-buffered period measurement approach using direct memory access (DMA) for speed. In pulse-width measurement applications, the board counts the number of ticks (clock pulses of the time-base) that occur in every semi-period of the input waveform. It then stores this value in a data buffer. This results in an array of clock counts per semi-period of the encoder hub’s pattern as illustrated in Figure 15. Knowing the reference clock frequency used during the measurement, the pulse-width, period or frequency of the input waveform can be computed. For this application, the series of pulse widths will be used to determine the engine’s order content.
Figure 15. Zero crossing timer reset points.
Annual Conference of Prognostics and Health Management Society 2012
9
6.2. Order Domain Data Analysis
Datasets from the TIMS provided a semi-period resolution of 720 PPR. Before processing, all datasets were normalized to begin at the TDC corresponding to the beginning of cylinder one’s power stroke, hereafter referred to as ‘true TDC’. In this way, the relative phase differences between particular cylinder firing events were consistent for all snapshots.
Encoder semi-periods in the datasets were combined to allow for a period-based analysis. Because encoder wheels typically have highs/lows of different widths, a period-based analysis eliminates the variance between semi-periods. Shown below, Figure 16 illustrates the time history of a semi-period signal (blue) and the constructed period based signal (black) that was used in the subsequent analysis. It is important to note that the mean of both signals was removed to illustrate a reduction in high-frequency signal content.
Figure 16. The Semi-Period Signal (Blue) Recorded in Snapshot 492 During Test #25 and the Constructed Period
Based Signal (Black) The period based signals were then demodulated to calculate the amplitude of the crankshaft’s torsional vibration in degrees in the rotational domain. To reduce the effects of events uncorrelated to the shaft’s rotation in the demodulated signal, synchronous averaging was also applied in the rotational domain. The amplitude and phases of the demodulated, averaged signal were then analyzed in the order domain. Figure 17 through Figure 19 illustrate order spectra comparing data collected during baseline and injector fault tests at the discrete low, medium and high engine speeds, respectively.
Figure 17. Baseline (Snapshot 492) and Cylinder Three Fault (Snapshot 487) Order Spectra for Low Speed, Low
Load Engine Operating Conditions
An order domain analysis of the data collected during the injector fault test schedule suggests that cylinder faults can be identified by monitoring the amplitude of the crankshaft’s orders lower than two. When an injector fault was introduced into the test system at low, medium, and high load/speed engine conditions, noticeable modulation of the crankshaft occurred between orders one-half and two.
Figure 18. Baseline (Snapshot 446) and Cylinder Three Fault (Snapshot 443) Order Spectra for Medium Speed,
Medium Load Engine Operating Conditions Using these same datasets, an injector fault threshold amplitude for the orders between one-half and two was calculated. When the amplitude of any of the orders
Annual Conference of Prognostics and Health Management Society 2012
10
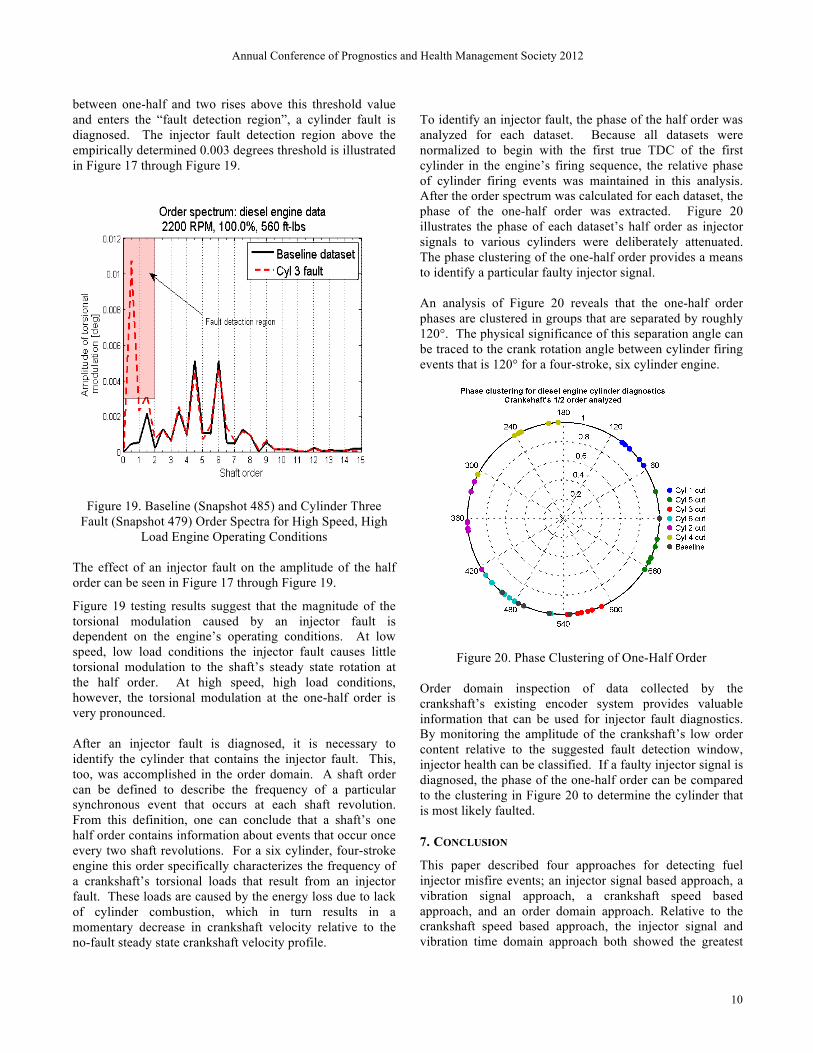
between one-half and two rises above this threshold value and enters the “fault detection region”, a cylinder fault is diagnosed. The injector fault detection region above the empirically determined 0.003 degrees threshold is illustrated in Figure 17 through Figure 19.
Figure 19. Baseline (Snapshot 485) and Cylinder Three Fault (Snapshot 479) Order Spectra for High Speed, High
Load Engine Operating Conditions The effect of an injector fault on the amplitude of the half order can be seen in Figure 17 through Figure 19.
Figure 19 testing results suggest that the magnitude of the torsional modulation caused by an injector fault is dependent on the engine’s operating conditions. At low speed, low load conditions the injector fault causes little torsional modulation to the shaft’s steady state rotation at the half order. At high speed, high load conditions, however, the torsional modulation at the one-half order is very pronounced. After an injector fault is diagnosed, it is necessary to identify the cylinder that contains the injector fault. This, too, was accomplished in the order domain. A shaft order can be defined to describe the frequency of a particular synchronous event that occurs at each shaft revolution. From this definition, one can conclude that a shaft’s one half order contains information about events that occur once every two shaft revolutions. For a six cylinder, four-stroke engine this order specifically characterizes the frequency of a crankshaft’s torsional loads that result from an injector fault. These loads are caused by the energy loss due to lack of cylinder combustion, which in turn results in a momentary decrease in crankshaft velocity relative to the no-fault steady state crankshaft velocity profile.
To identify an injector fault, the phase of the half order was analyzed for each dataset. Because all datasets were normalized to begin with the first true TDC of the first cylinder in the engine’s firing sequence, the relative phase of cylinder firing events was maintained in this analysis. After the order spectrum was calculated for each dataset, the phase of the one-half order was extracted. Figure 20 illustrates the phase of each dataset’s half order as injector signals to various cylinders were deliberately attenuated. The phase clustering of the one-half order provides a means to identify a particular faulty injector signal. An analysis of Figure 20 reveals that the one-half order phases are clustered in groups that are separated by roughly 120°. The physical significance of this separation angle can be traced to the crank rotation angle between cylinder firing events that is 120° for a four-stroke, six cylinder engine.
Figure 20. Phase Clustering of One-Half Order Order domain inspection of data collected by the crankshaft’s existing encoder system provides valuable information that can be used for injector fault diagnostics. By monitoring the amplitude of the crankshaft’s low order content relative to the suggested fault detection window, injector health can be classified. If a faulty injector signal is diagnosed, the phase of the one-half order can be compared to the clustering in Figure 20 to determine the cylinder that is most likely faulted.
7. CONCLUSION
This paper described four approaches for detecting fuel injector misfire events; an injector signal based approach, a vibration signal approach, a crankshaft speed based approach, and an order domain approach. Relative to the crankshaft speed based approach, the injector signal and vibration time domain approach both showed the greatest
Annual Conference of Prognostics and Health Management Society 2012
11
potential for on-board vehicle implementation. These approaches demonstrated the capability of detecting individual injector misfires on the seven liter diesel engine over the (30 lbs-ft @ 700 RPM) to (560 lbs-ft @ 2100 RPM) operating range when tested on an engine dynamometer. Furthermore, each approach equally demonstrated the ability to correctly identify the specific cylinder location of the faulted injector.
Both approaches require a TDC/one PPR or 360PPR encoder signal for synchronization or the camshaft speed encoder signal, along with the basic hardware and software for algorithm implementation.
The injector signal based approach does require access to the signal taps for the six respective injectors while the vibration based approach requires one accelerometer mounted to the top of the engine. Due to the nature of vibration monitoring, this approach should also work for detecting any combustion related faults but must be first validated on an actual platform to ensure it is immune to externally induced vibrations. Among other factors, the extent to which fuel line clogs or worn injector actuators are relevant faults may dictate the reliability of this approach in a fielded environment.
The order domain approach showed great potential for on-board vehicle implementation. The approach demonstrated the capability of detecting individual injector misfires on the seven liter diesel engine over the (30 lbs-ft @ 700 RPM) to (560 lbs-ft @ 2100 RPM) operating range when tested on an engine dynamometer. Additionally, this approach demonstrated the ability to correctly identify the specific cylinder location of the faulted injector.
ACKNOWLEDGMENT
This paper is based upon work supported by the Army RDECOM-TARDEC under Contract Number N00024-02-D-6604, Delivery Order Number 0707. The content of the information does not necessarily reflect the position or policy of the Government, and no official endorsement should be inferred.
REFERENCES
Banks, J.C., Hines, J., Lebold, M.S., Campbell, R.L., et al. (2001). Failure Modes and Predictive Diagnostics Considerations for Diesel Engines. Meeting of the Society for Machinery Failure Prevention Technology, April 2001.
Geveci, M., Osburn, A. and Franchek, A. (2005). An
investigation of crankshaft oscillations for cylinder health diagnostics. Mechanical Systems and Signal Processing, vol 19, pp. 1107-1134.
Lebold M.S., Maynard K.P., et al. (2003). Technology Development For Shaft Crack Detection in Rotating Equipment. EPRI International Maintenance Conference, August 2003.
Lebold, M.S., Maynard K.P., Reichard, K.M., et al., (2005). A Non-Intrusive Technique For On-Line Shaft Crack Detection and Tracking. Proceedings of IEEE Aerospace Conference, March 2005.
Maynard, K.P, Lebold, M.S., Groover, C.L., and Trethewey, M.W., (2000). Application of Double Resampling to Shaft Torsional Vibration Measurement for the Detection of Blade Natural Frequencies. Society for Machinery Failure Prevention Technology, March, 2000.
Murphy,B.J., Lebold, M.S., Reichard, K.M., et al. (2003 ).
Diagnostic Fault Detection for Internal Combustion Engines Via Pressure Curve Reconstruction. Proceedings of IEEE Aerospace Conference, March 2003.
BIOGRAPHIES
Mitchell S. Lebold is a Research Engineer with the Applied Research Laboratory at The Pennsylvania State University with more than fifteen years of experience in algorithm development and embedded monitoring systems. He holds an M.S. and B.S. degree in Electrical Engineering from Pennsylvania State University. Mr. Lebold leads several multi-disciplinary research and development projects in the areas of wireless smart sensors, algorithm development, and open standards for condition-based maintenance. He has designed and developed numerous custom test and measurement systems as well as embedded wireless data acquisition systems for machinery health monitoring. His current research involves engine and driveline diagnostics and prognostics algorithm development. James S. Pflumm is a research engineer at the Applied Research Laboratory. He received his B.S.M.E and M.S.M.E in Mechanical Engineering from Penn State University in 2002 and 2005 respectively. His current work at ARL is in support of test and analysis of failure modes for ground vehicles at the sub-system and component level.
Annual Conference of Prognostics and Health Management Society 2012
12
Jeffrey C. Banks is the Department Head of Complex Systems Engineering & Monitoring and he has 17+ years’ experience in applying advanced signal processing techniques, intelligent systems technology, and embedded diagnostics / prognostics tools to condition monitoring applications for the US Navy, US Marine Corps, US Army, NASA and Industry. His education includes a B.S.M.E. from Villanova University and a M.S. in Acoustics from The Pennsylvania State University. His research engineer duties include developing machinery health management systems and diagnostic and prognostic technology for various DoD assets including the U.S. Marine Corps Expeditionary Fighting Vehicle (EFV), Light Armored Vehicle (LAV), AV-8B Harrier, U.S. Army Heavy Expanded Mobility Tactical Truck (HEMTT), and Heavy Brigade Combat Team M1A2 Abrams, M2/M3 Bradley Fighting Vehicle, M88 Hercules platforms. He has developed two short courses at all NASA facilities in the areas of Condition Based Maintenance (CBM) and Reliability Centered Maintenance (RCM). Additional responsibilities include conducting degrader analyses for a variety of complex systems and platforms including aircraft engines and combat ground vehicles. He has also designed and developed diagnostic instrumentation systems for machinery failure test beds and field data acquisition systems. Mr. Banks has first authored and published more than 50 conference papers and technical reports. Jonathan P. Bednar is a Graduate Research Assistant with the Applied Research Laboratory at The Pennsylvania State University. He earned his B.S. degree in Mechanical Engineering in 2010 from The Pennsylvania State University and will complete his M.S. degree in 2012 focusing in acoustics and vibrations. His current research includes condition monitoring of Compression Ignition engine crankshafts using torsional features and the optimization of a high-temperature pressure sensing device. Dr. Karl M. Reichard is the head of the ARL Penn State Embedded Hardware/Software Systems and Applications Department and teaches and advises graduate students in The Pennsylvania State University Graduate Program in Acoustics, and the Departments of Mechanical and Electrical Engineering. He has over 25 years of experience in the design and implementation of signal processing, control and embedded diagnostics/prognostics systems. He has developed unattended remote sensing, active control and health
monitoring systems for a variety of manned and unmanned platforms for the Navy, Army, Marine Corp, NASA, and industry. In addition to his work at Penn State ARL, Dr. Reichard has also worked for the US Army at Aberdeen Proving Grounds where he developed data measurement, acquisition, and processing systems to support testing of military systems. He earned B.S., M.S., and Ph.D. degrees in Electrical Engineering from Virginia Tech. Kenneth Fischer has led the Condition Based Maintenance (CBM) Team within the U.S. Army Tank Automotive Research, Development, and Engineering Center (TARDEC), located in Warren, Michigan since 2009. In this capacity, he has overseen the design, development, integration and test of the diagnostic hardware and software components required to implement CBM on military ground vehicles. Mr. Fischer holds a MS Degree in Engineering Management from University of Dayton and a BS in Computer Engineering from Lawrence Technological University and has over 15 years of automotive experience in embedded diagnostic and test system design. Joseph Stempnik is an electric engineer at the Tank Automotive Research Engineering Center (TARDEC). He received his B.S. in Electrical Engineering from Lawrence Technological University. His current work at TARDEC is in support of test and evaluation of engines that support Army ground vehicles and has over 15 years of automotive experience in embedded controls and software system design.