Detecting Stepping Stones in Internet Environments by Ping Li B.Eng. (University of Electronic Science and Technology of China) M.Eng. (University of Electronic Science and Technology of China) Submitted in Fulfillment of the requirements for the degree of Doctor of Philosophy Deakin University February, 2011
Transcript
Detecting Stepping Stones in Internet Environments
by
Ping Li B.Eng. (University of Electronic Science and Technology of China)
M.Eng. (University of Electronic Science and Technology of China)
Submitted in Fulfillment of the requirements for the degree of
Doctor of Philosophy
Deakin University
February, 2011
lswan
Redacted stamp
lswan
Redacted stamp
IV
IV
Acknowledgements
I would like to express my sincere gratitude and profound thanks to my supervisor
Professor Wanlei Zhou for his supportive supervision, helpful criticism, valuable
suggestions and endless patience. Without his inspiring enthusiasm and
encouragement, this work could not have been completed. He generously provided me
his time, effort, and insightful advice at all times, and guided me into the door leading
to a successful researcher.
I would like to thank many staff members in School of Information Technology,
Deakin University. They are Professor Lynn Batten, Professor Andrez Goscinski, Dr.
Robin Doss, Dr. Yang Xiang, Dr. Shang Gao, Dr. Gang Li, Dr. Ming Li, Dr. Shui Yu,
Mr. Jun Zhang and Dr. Shuyuan Jin etc. And I am also grateful to Ms. Georgina Cahill,
Mr. Nghia Dang and other staff in the school for their valuable help.
I would also like to thank my friends and colleagues for their wonderful help to my
research and life. They are Dr. Ke Li, Dr. Ashley Chonka, Dr. Leanne Ngo, Dr.
Yiqing Tu, Dr. Faye Ferial Khaddage, Miss Yini Wang, Mr. Theerasak Thapngam, Mr.
Alessio Bonti, Mr. Longxiang Gao, Mr. Yongli Ren, Ms. Wei Zhou, Mr. Sheng Wen,
Ms. Yanli Yu, Mr. Min Gan, Miss Jia Rong and so on.
I cannot end without thanking my family, which include my lovely parents, my dad
Zhongxin Li, and my mum Xianglian Wang for their continue support. Also a special
thanks to the love of my life Yu Deng for his encouragement, care and love and my
angels, Keyue and Kezhuo for their patience and understanding.
V
Publications
During my PhD Candidature, the following research papers were published or
accepted in fully refereed International Conference Proceedings and Journals.
� Yu, Y., Li, K., Zhou, W. and Li, P., Trust Mechanisms in Wireless Sensor
Networks: Attack Analysis and Countermeasures, Journal of Networking and
Computer Applications. Accepted: 12/12/2010 (ERA Rank A, Impact
Factor=1.111).
� Li, P., Zhou, W. and Wang, Y. (2010) Getting the Real-Time Precise Round-Trip
Time for Stepping Stone Detection, NSS 2010 Proceedings of the 3rd IEEE
International Conference on Network & System Security, IEEE Computer Society
Press, United States, pp. 377-382.
� Li, P., Zhou, W. and Yu, Y. (2010) A Quick-Response Real-Time Stepping Stone
Detection Scheme, HPCC 2010 Proceedings of the 12rd IEEE International
Conference on High Performance Computing and Communications, IEEE
Computer Society Press, United States, pp. 677-682.
� Li, K., Zhou, W., Li, P., Hai, J. and Liu, J. (2009) Distinguishing DDoS Attacks
from Flash Crowds Using Probability Metrics, NSS 2009 Proceedings of the 3rd
IEEE International Conference on Network & System Security, IEEE Computer
Society Press, United States, pp. 9-17.
� Li, K., Zhou, W. and Li, P. (2009) Reliable Downloading Algorithms for
BitTorrent-like Systems, NPC 2009 Proceedings of the 6th IFIP International
Conference on Network and Parallel Computing, IEEE Computer Society Press,
United States, pp. 167-173.
VI
VI
� Li, P., Zhou, W. and Li, K. (2008) An Operational Approach to Validate the Path
of BGP, Lecture Notes in Computer Science. Volume 5022/2008, pp. 133-143,
Springer Berlin / Heidelberg.
� Li, K., Zhou, W., Yu, S. and Li, P. (2007) Novel Data Management Algorithms in
Peer-to-Peer Content Distribution Networks, Lecture Notes in Computer Science,
Volume 4798/2007, pp. 538-543, Springer, Germany.
VII
VII
ABSTRACT
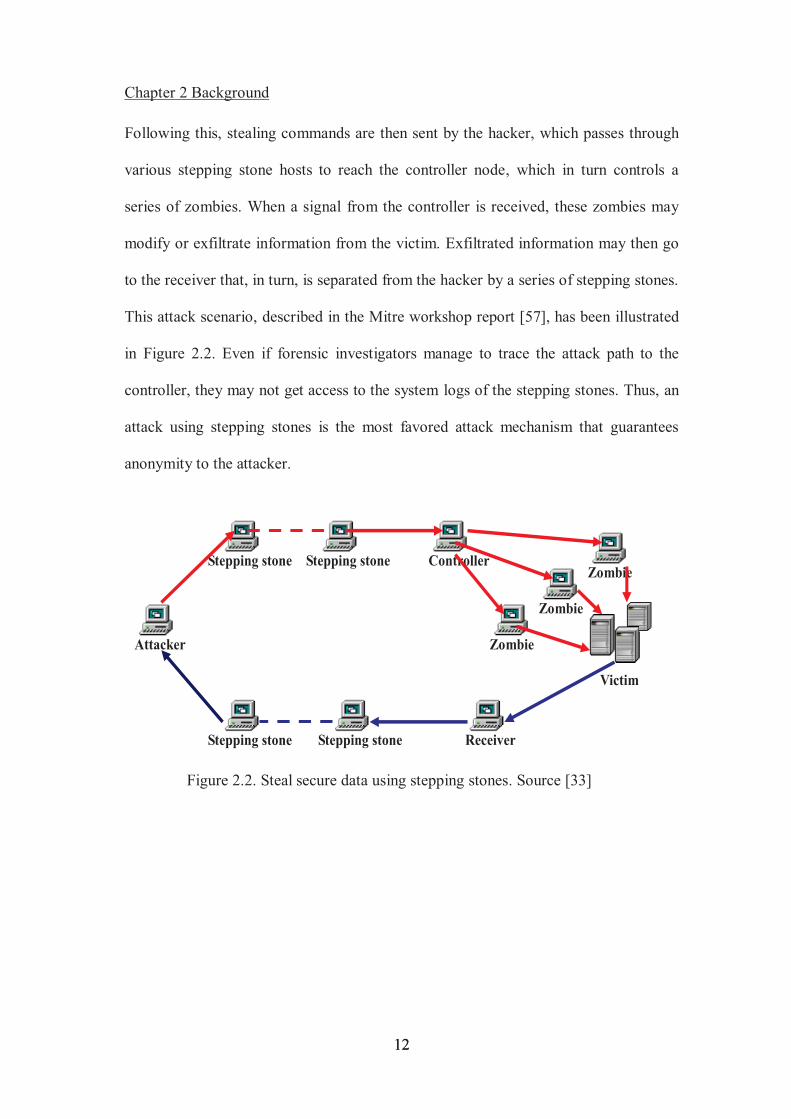
Although many countermeasures and legislation have been developed against Internet attacks, the number of attacks is still on the rise, causing devastating consequences such as disrupting critical infrastructure, significant financial loss, and endangering public life. One critical question that researchers and law enforcement agencies still cannot answer easily is where are the real source(s) of Internet attacks coming from? Attackers can easily hide their identities and evade punishment by relaying their attacks through a series of compromised systems or devices which are called stepping stones. Attackers also make detection more difficult by using evasive techniques such as the introduction of dummy packets into the stream, and introducing delay into the timing of the packet stream. The goal of this thesis is to develop an effective and efficient scheme along with a number of related algorithms to detect stepping stones in real Internet environments, even when evasion techniques are used by attackers.
This thesis is organized as follows. Chapter 1 presents an introduction about stepping stone attacks and important issues related to stepping stone detection. Chapter 2 provides a brief, but in-depth introduction to the major characteristics of stepping stone attacks and a detailed survey of the related work carried out in detecting stepping stones. Chapters 3 to 6 present our major contributions for detecting stepping stones. In Chapter 3, we propose a real-time Round Trip Time (RTT) getting algorithm for stepping stones, which can be employed by RTT based stepping stone detection approaches to detect stepping stones. Or it can be used by other stepping stone detection approaches to select the value of important parameters. A simple but effective stepping stone detection scheme which can be employed in Internet is proposed in Chapter 4. Two stepping stone detection algorithms that are highly resistant to evasion techniques are proposed in Chapter 5. In Chapter 6, we present a quantitative and comparative study on network-based passive stepping stone detection proposals based on a series of experiments. Finally, Chapter 7 summarizes the contributions of this thesis and discusses future work.
VIII
VIII
Table of Contents
Acknowledgements ............................................................................. IV
Publications ........................................................................................... V
ABSTRACT ....................................................................................... VII
Table of Contents ............................................................................. VIII
List of Figures .................................................................................... XII
List of Tables ...................................................................................... XV
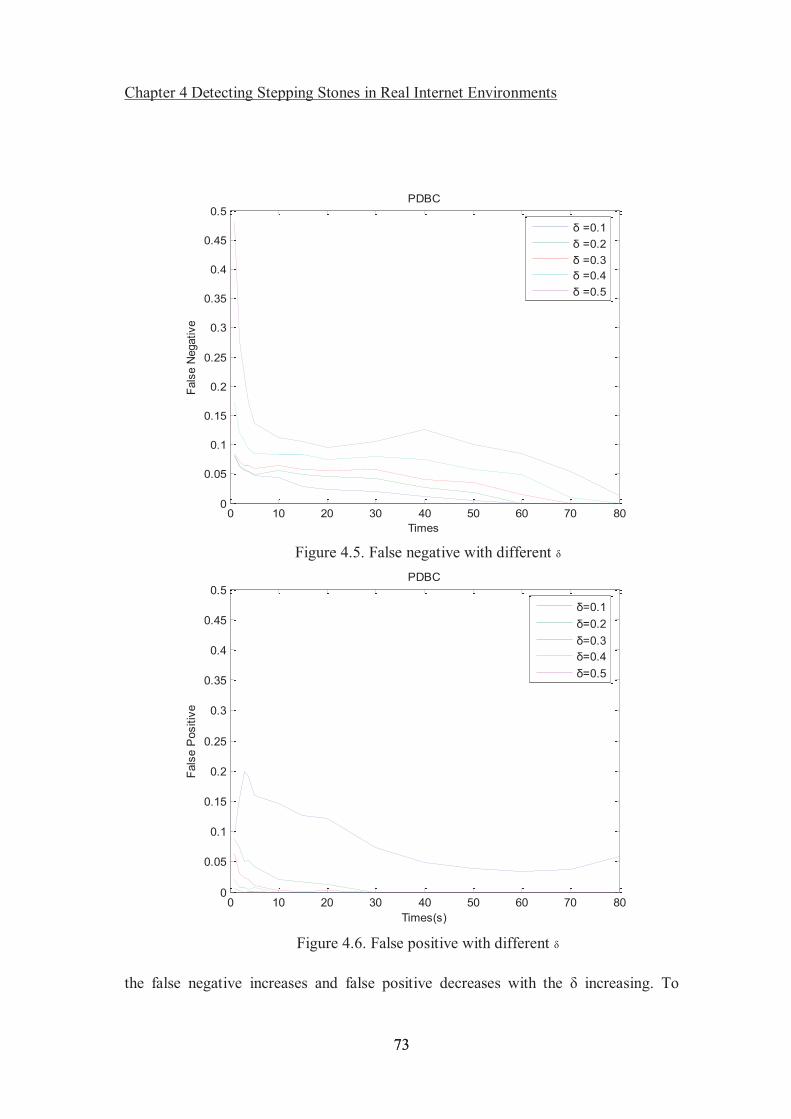
Figure 4.12. Accuracy for IPD with different chaff rate
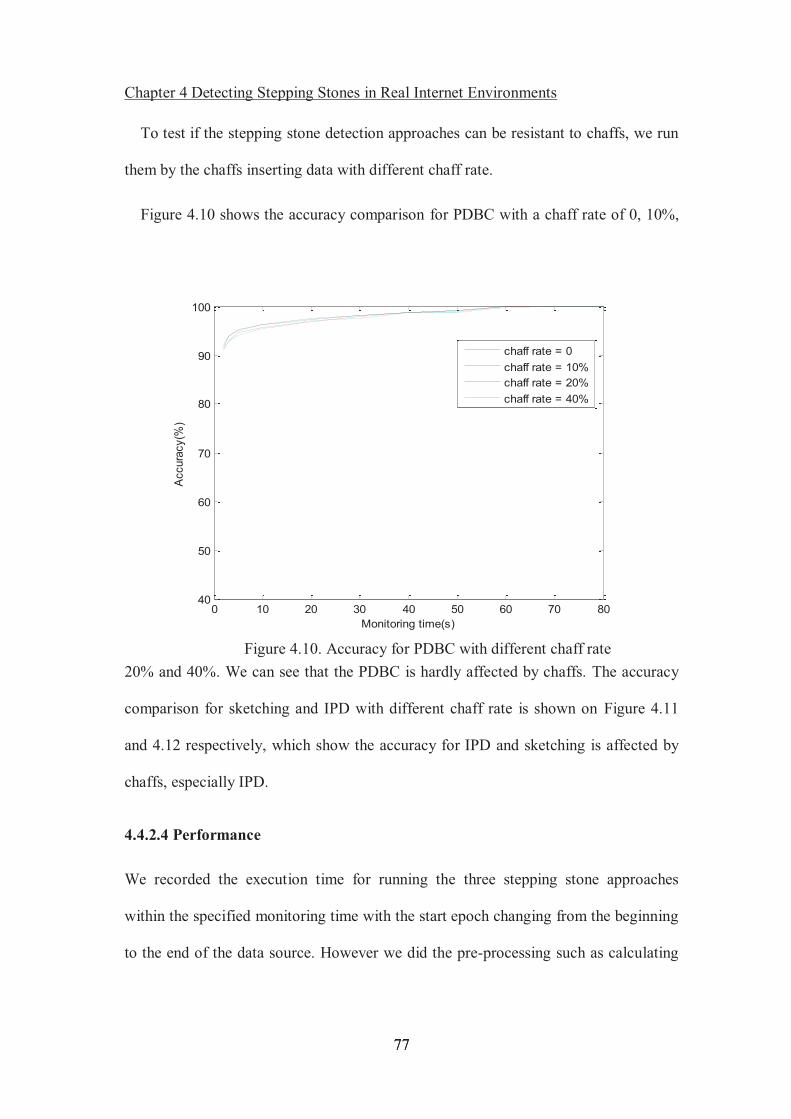
Chapter 4 Detecting Stepping Stones in Real Internet Environments
79
79
execution time values were relatively stable, and the average values are shown in
Table 4.5. Since the computation time for PDBC is smaller than ( )O n in our
experiments, the execution time for PDBC changes only slightly for different
monitored times. Because IPD compares packets with the number of window sizes for
every packet, the execution time will increase exponentially with the monitoring time
increasing. For the sketching scheme, one of the main computing costs is calculating
sketches, which will increase linearly.
4.5 Summary
Quick responsiveness with high accuracy and low computation costs are critical
challenges for applying stepping stone detection approaches in the real Internet
environment. In this chapter, we propose a simple but practical stepping stone
detection algorithm which has less storage and computation costs than existing
algorithms. The results of the experiments demonstrated our method can achieve
detection results with more than 90% accuracy within 2 seconds, and 100% accuracy
within 60 seconds. This is much better than the IPD and sketching approaches which
Table 4.5. Execute time for PDBC, IPD and sketching
Approach Execute time /Monitored time(10s)
Execute time /Monitored time(40s)
Execute time /Monitored time(80s)
PDBC 3.281s 3.281s 3.343s
IPD 4.109s 22.187s 52.437s
Sketching 4.640s 7.578s 8.640s
Chapter 4 Detecting Stepping Stones in Real Internet Environments
80
80
were the only two approaches taking responsiveness into consideration. Our
experiments also demonstrate that our approach can also be resistant to chaffs.
Chapter 5 Detecting Chaffed and Jittered Stepping Stone Connections
81
Chapter 5
Detecting Chaffed and Jittered Stepping
Stone Connections
Packet timing or frequency (count) characteristics are foundations commonly
employed in detecting stepping stones. However these characteristics may be altered
by attackers introducing jitters and chaffs into stepping stone connections. But the
timing causality that the packet has to arrive first before it can leave a node won’t be
changed. In this chapter, based on two Poisson processing models, we formulate and
prove two separate upper bounds of probability that normal connections present with
the timing causality of correlated connections. In addition, based on the two upper
bounds of probability, we propose two novel algorithms which have no parameters
that can detect stepping stones accurately even if there are big jitters and a high chaff
rate. We compare our algorithms with previous ones and our experiments show that
our algorithms are more resistant to chaffs and jitters than previous ones. In addition
to this, our algorithms maintain high accuracy for detecting normal stepping stones
Chapter 5 Detecting Chaffed and Jittered Stepping Stone Connections
82
with no chaff or jitter perturbation. We also present comparisons between our
algorithms through analysis and experimentation.
5.1 Introduction
Current stepping stone detection approaches [2, 3, 4, 5, 8, 9, 10, 21, 35] are
predominately based on timing or frequency characteristics that may be altered during
the packet transmission on the Internet Additionally, attackers may also introduce
random jitter delays before packets depart from stepping stones or they may insert
chaffs (chaffs are superfluous packets, which contain no valuable information and are
not relayed by stepping stones) into the original attack flow on stepping stones, which
can even completely break the timing and frequency features.
However the timing causality of the packet arriving first before it can leave a node
does not be change. Therefore, the packet arrival epochs on stepping stones keep the
order of stepping stone chain. But this timing causality between correlated stepping
stone connections may be appeared between normal connections as well. In our
experiments we gave much attention to the normal connections instead of stepping
stone connections, and found the existence of an upper bound for the probability that
normal connections present with the timing causality of correlated stepping stone
connections. In addition, based on the upper bounds of probability, we designed the
Abnormal Probability Detection algorithm (APD) and Speedy Abnormal Probability
Detection algorithm (SAPD) which can accurately detect stepping stones even with
chaff and jitter perturbation. In this chapter, we also compare our proposals with
previous approaches.
Chapter 5 Detecting Chaffed and Jittered Stepping Stone Connections
83
The rest of this chapter is organised as follows. In Section 5.2, we present related
work on the ability of stepping stone detections to resist evasion. We also analyse and
explain the mathematical models of connection streams, and present proof for two
formulas on the upper bounds of probability based on two Poisson models in Section
5.3. Section 5.4 describes the detail of two algorithms based on the two formulas.
Section 5.5 explains our experimental results. And finally, we conclude this chapter in
Section 5.6.
5.2 Related Works
With many approaches proposed to detect stepping stones, the evading technique
developed concurrently. At first, encryption to stepping stone connections makes the
approaches [1] based on content unavailable. Then, the introduction of chaffs and
jitters may perturb the timing or frequency characteristics of stepping stones, which
are the foundations of most stepping stone detection approaches [2, 3, 4, 5, 8, 9, 10, 21,
35]. The SNEAK attack tool [46] can even create constant rate streams by inserting
jitters and chaffs, which are completely removed from the inter packet information.
The evasion techniques of introducing chaffs and jitters also caught the attention of
researchers. Donoho et al. [5] argue that attackers have maximum tolerable delay
constraints and correlation between stepping stone connections can be detected
regardless of chaff packets if connections last long enough. Similarly, under a
maximum tolerable delay constraint, Blum et al. [8] present confidence bounds on the
stepping stone detections. Their algorithm is based on the difference of the number of
packets between two connections at a given time. This difference is expected to be
Chapter 5 Detecting Chaffed and Jittered Stepping Stone Connections
84
low for correlated connections even if there are a few chaff packets. In [9], Zhang et al.
propose several algorithms with special focus on random delays and chaff. They
compared most previous stepping stone detection approaches [2, 3, 4, 5, 8] and their
experiments demonstrated their proposals were more effective in resisting chaffs and
jitters even though their algorithms are also based on the assumption there is no packet
dropping, and their experimental data is not real connection data. In [54], Wu et al.
tried to improve the chaff resistance properties of [8]. However, they assumed that the
chaff is introduced for only one of the connections of a correlated connection pair.
Coskun et al. [35] proposed a sketching method and claimed it could resist chaff and
jitter perturbations. However, his experiments only involve cases of small jitter and
low chaff rates. Kampasi et al. [49] provide methods to improve stepping stone
detection when either jitter, chaff or both are introduced into a packet stream. But
these methods are only used as supplements to other stepping stone detection
approaches.
5.3 Probability Analysis
In this section, we begin by formally defining some terms. Then we introduce two
network stream models. Based on these two models, we formulate and prove two
different upper bounds of probability that stepping stone’s timing causality appears on
normal connections.
Chapter 5 Detecting Chaffed and Jittered Stepping Stone Connections
85
5.3.1 Related Definitions
Normally attackers launch stepping stone attacks by constructing a chain of interactive
connections on a series of compromised hosts (stepping stones) using protocols such
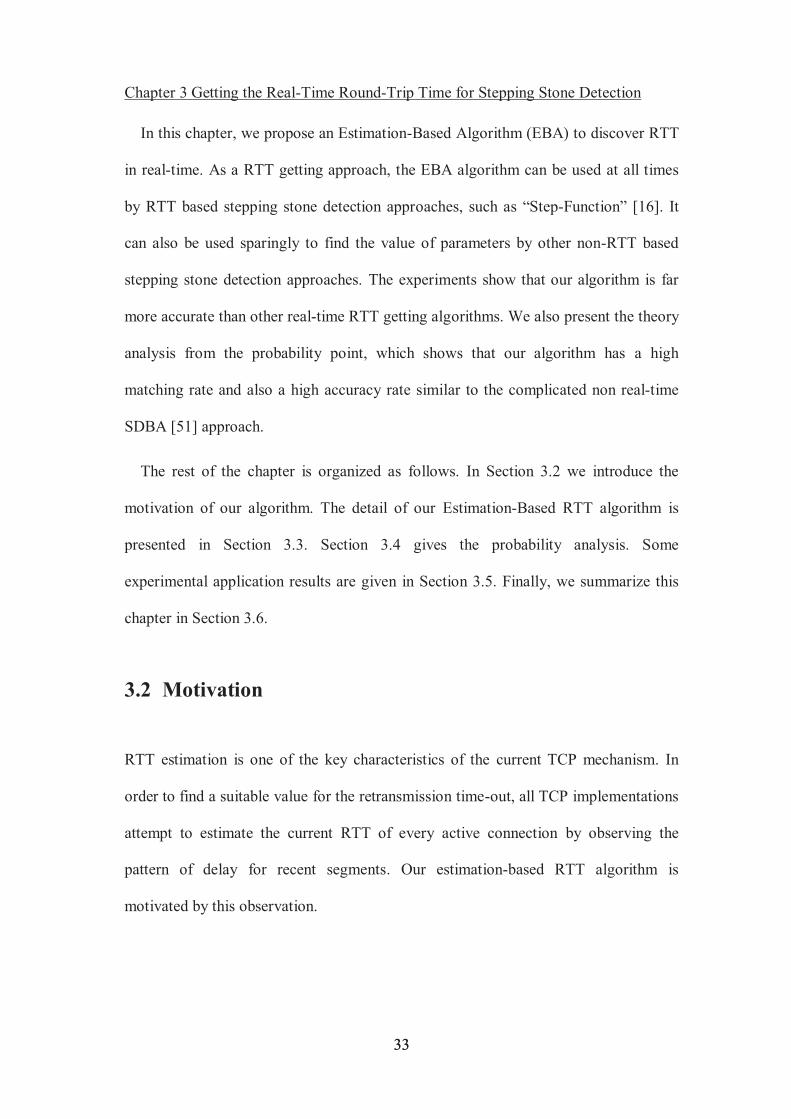
as Telnet or SSH, as shown on Figure 5.1.
Definition 5.1 (RTT and timing causality) The packets sent in interactive
connections from an attacker (client) to a target (server) are called send packets, and
the packets sent in the reverse direction are called echo packets. The time delay
between the send packet and the corresponding echo packet on a connection is called
Round-Trip Time (RTT) for this interactive connection.
From Figure 5.1, and also from the timing causality that the packet has to arrive
first before it can leave a node, we can see that for the same send packet, it arrives first
on stepping stone i-1, then arrives on stepping stone i. Until the send packet arrives at
Attacker Stepping stone 1
Stepping stone i-1
Stepping stone i
Target
RTT
Send Echo
a
Figure 5.1. The timing causality on a stepping stone chain
Chapter 5 Detecting Chaffed and Jittered Stepping Stone Connections
86
the target host, the corresponding echo packet will be generated, and will be sent back
to stepping stone i, and then to stepping stone i-1.
If two connections are in the same connection chain, we consider them as a
correlated connection pair, otherwise they are a normal connection pair.
Definition 5.2 (RTT Sequence and Packet Pair) A RTT sequence aRtt is a
series of RTTs in chronological order obtained by an RTT getting algorithm on
connection a . Let 1 1 1 2 2 2{ ( , ), ( , ), ( , ) }( 0)s e s e i si eia a a a a a a a a aRtt Rtt t t Rtt t t Rtt t t i �) }( 0)i si ei((a a a( ,( ,( , ) }(( , ) }(( ,( ,( , ) }((((( , ) }(( , ) }(((( ,
where iaRtt is the ith RTT obtained by the RTT getting algorithm for interactive
connection a . siat and ei
at are the arrival epoch of the Send and Echo packet by which
to get the ith RTT on connection a . ( , )si eia at t is called Packet Pair, and
si ei ia a at t Rtt � . For an easy description of the algorithm, the RTT sequence
representation here is slightly different from the definition in Section 3.3 and Section
4.3.
Definition 5.3 (Correlated Packet Pair and Correlated Probability) For the
packet pair ( , )si eia at t on connection a and the packet pair ( , )sj ej
b bt t on connection b ,
if there exists si sj ei eja b a bt t t t� � � , we consider ( , ) ( , )sj ej si ei
b b a at t t t� are a
correlated packet pair. By definition 5.2, we can also achieve for a correlated packet
pair, there exists:
si sj sj j si ia b b b a asi sj si i ja b a a b
t t t Rtt t Rtt
t t t Rtt Rtt
� � � � �
� � � � (1)
Chapter 5 Detecting Chaffed and Jittered Stepping Stone Connections
87
For the packet pair ( , )si eia at t on a , if there exists any packet pair ( , )sj ej
b bt t on b
such that ( , ) ( , )sj ej si eib b a at t t t� , we consider ( , )si ei
a at t has correlated pair. Correlated
Probability abCP is defined as the ratio that the number of packet pairs of a , having
correlated pairs on b to the number of total packet pairs of a .
The Correlated Probability for two normal connections seems random. But it is
actually related with the packet frequency and RTT value which we will prove in a
later analysis.
5.3.2 Modelling Connection Streams
Network streams are frequently modelled as a Poisson process [90]. The famous
Jackson’s theorem [80], a significant development in the theory of networks of queues,
simply assumes packet arrivals are Poisson processes. To detect stepping stones,
connection streams (the packet arrivals on connections) are generally modelled as
Poisson processes as well [5, 8, 9, 10].
Normally, Poisson processes with a fixed rate [5, 8, 9, 10] are used to generate the
model. In this situation, the distribution of the packet interval follows the exponential
distribution with distribution function xe �� � , where� is the expected packet arrival
rate, and can be considered 1T (T is the expected packet interval, equals the average
packet interval).
Chapter 5 Detecting Chaffed and Jittered Stepping Stone Connections
88
Let us assume for every packet arrival on connection streams with different
rate ( )i i n� � and over time ( )iT i n� , which is the packet interval of ith packet, we
can get * 1i iT� . Then the average arrival rate is the same as the model with a fixed
rate Poisson distribution, as explained below:
1
1 1
n
i ii
n n
i ii i
Tn
T T
��
�
� �.
This means the Poisson process with a fixed rate can be modelled as many Poisson
distributions with varying rates, and over varying time periods [8]. As a result,
connection streams can be modelled as Poisson processes with varying rates, and over
varying time period. In this situation, the distribution of every inter arrival time will
follow the exponential distribution with distribution function ixie
�� � , where1
iiT
� .
5.3.3 Probability Bound under Poisson Model with Varying Rate
Theorem 5.1. Let’s assume normal connections a and b behave as sequences of a
Poisson processes. For the two RTT sequences obtained by the RTT getting algorithm
on connection a and b during the same time range:
1 1 1 2 2 2{ ( , ), ( , ), ( , )}( 0)s e s e n sn ena a a a a a a a a aRtt Rtt t t Rtt t t Rtt t t n �(n sn(((((((((((((
1 1 1 2 2 2{ ( , ), ( , ), ( , )}( 0)s e s e m sm emb b b b b b b b b bRtt Rtt t t Rtt t t Rtt t t m �b b((m sm(((((((((((((((( ,
If ( , )i ja bRtt Rtt i n j m� � � � � ,
Chapter 5 Detecting Chaffed and Jittered Stepping Stone Connections
89
( , )( )sj ejb bt t j m� is the first packet pair on connection b after ( )si
at i n� ,
( )
( 1) ( 1)
)
1( , ) ( ,1) ( , )1
jia b
j
ij
Rtt Rttb
s i si sj s ji a a j b ba
b
eucp i j MIN a t t b t te
� �
� �
�
� � �
�
Then 1
1
1 ( , )1
n
ab abi
CP UVCP ucp i jn
�
� � �
Proof. Firstly, we derive the probability that one packet pair ( , ) {1, }si eia at t i n }
has correlated pairs on connection b .
According to (1), we know that only the packet pairs whose arrival epoch of a send
packet is after siat have a chance to be correlated with ( , )si ei
a at t . If the first packet pair
on connection b after siat is not correlated with ( , )si ei
a at t , then the later packet is also
not correlated with siat . So the probability that ( , )si ei
a at t has correlated pairs on
connection b equals the probability that the first packet pair on connection b after siat
is correlated with ( , )si eia at t , i.e. Pr(( , ) ( , ))sj ej si ei
b b a at t t t� .
Then we derive Pr(( , ) ( , ))sj ej si eib b a at t t t� from two cases:
a) When i ji a ba Rtt Rtt� �
! � ! �! � ! �! � ! �! � ! � ! � ! �
sj ej si eib b a a
sj ej si ei sj s(i+1) sj s(i+1)b b a a b a b a
sj ej si ei sj s(i+1) sj s(i+1)b b a a b a b a
sj ej si ei sj s(i+1) sj ej si ei sjb b a a b a b b a a b a
Pr( , , )
Pr( , , )*Pr( )
Pr( , , )*Pr( )
Pr( , , ) Pr( , ,
t t t t
t t t t t t t t
t t t t t t t t
t t t t t t t t t t t t
�
� � �
� � � �
� � � � � � s(i+1) )
Chapter 5 Detecting Chaffed and Jittered Stepping Stone Connections
90
� If ( 1)sj s ib at t ��
We assume connection stream b behaves as a Poisson process with rate j� during
the jth packet arrival. Then we can derive:
! � ! �sj ej si ei sj s(i+1)b b a a b a
si sja b
sj s(i+1)b a
si sja b
si sj s(i+1)a b a
Pr( , , )
Pr( )Pr( )
Pr( )Pr( )
si i ja a b
si i ja a b
t t t t t t
t t t Rtt Rttt t
t t t Rtt Rttt t t
� �
� � � �
�
� � � �
� �
( 1)
( 1)
( 1)( 1)
( 1)
( )11
j s jsi ija a b b
s jsia b
s js ija b
s jsia b
jia jb
i j
t Rtt Rtt t xjt t
t t xjt t
Rtt Rtt
a
e dx
e dx
ee
�
�
�
�
�
�
�
�
��
�
� � � �
�
� �
�
� �
�
�
�
"
"
� If ( 1)sj s ib at t ��
By the precondition of i ji a ba Rtt Rtt� � , we can achieve the below inequation which
is in conflict with definition 5.3.
sj ( 1)b
s i si si i ja a i a a bt t t a t Rtt Rtt�� � � � �
So ( 1)Pr(( , ) ( , ) | ) 0sj ej si ei sj s ib b a a b at t t t t t �� �
As a result, when i ji a ba Rtt Rtt� � , we can get:
! � ! �( )
sj ej si eib b a a
1Pr( , , )1
jia jb
i j
Rtt Rtt
aet t t t
e
�
�
� �
�
�� �
�
By the analysis in 5.3.2, we know 1j
jb� , so we can further get:
Chapter 5 Detecting Chaffed and Jittered Stepping Stone Connections
91
! � ! �( )
sj ej si eib b a a
1Pr( , , ) ( , )1
jia b
j
ij
Rtt Rttb
ab
et t t t ucp i je
� �
�
�� �
�
b) When i ji a ba Rtt Rtt� �
We can get Pr(( , ) ( , )) 1 ( , ),sj ej si eib b a at t t t ucp i j� � as the below inequation exists:
( )
1 1( )1
jia b
j
ij
Rtt Rttb
i ji a ba
b
e a Rtt Rtte
� �
�
�� � �
�
From cases a) and b), we can derive:
Pr ( ( , )si eia at t has correlated pairs on connection b)
= Pr(( , ) ( , )) ( , ),sj ej si eib b a at t t t ucp i j� �
According to the definition of abCP , it can be considered as the expected value of
the Pr(( , ) ( , ))sj ej si eib b a at t t t� . So we get:
1
ab1
1CP ( , ) 1
n
iucp i j
n
�
�� �
5.3.4 Probability Bound under Poisson Model with a Fixed Rate
Theorem 5.2. For two normal connections a and b , assuming they behave as
Poisson processes with an equal rate of � ,
then | | | |(1 )*ln(1 )a b a bRtt Rtt Rtt Rttab abCP UVCP e e� �� � � �� � � , where aRtt and bRtt are the
average RTT on connection a and b separately.
Chapter 5 Detecting Chaffed and Jittered Stepping Stone Connections
92
Proof. Let’s assume a bRtt Rtt� . Similar to the proof of Theorem 5.1, we first
derive the probability that one packet pair ( , )si eia at t of connection a has correlated
pairs on connection b , which equals ! � ! �sj ej si eib b a aPr( , , )t t t t� , where ( , )sj ej
b bt t is the first
packet pair on connection b after siat
By the proof of Theorem 5.1, we knew that:
� When i ji a ba Rtt Rtt� � (where ( 1)s i si
i a aa t t� � )
! � ! �( )
sj ej si eib b a a
1Pr( , , )1
jia jb
i j
Rtt Rtt
aet t t t
e
�
�
� �
�
�� �
�, where j� is the varying packet arrival rate of
connection b .
� When i ji a ba Rtt Rtt� � ,
! � ! �sj ej si eib b a aPr( , , ) 1t t t t� �
As RTT always varies in a narrow range [56], we can approximately replace
i ja bRtt Rtt� with a bRtt Rtt� . By the assumption that connection b behaves as a
Poisson process with fixed rate� , we get that:
� When i a ba Rtt Rtt� �
! � ! �( )
sj ej si eib b a a
1Pr( , , )1
a b
i
Rtt Rtt
aet t t t
e
�
�
� �
�
�� �
�
� When i a ba Rtt Rtt� �
! � ! �sj ej si eib b a aPr( , , ) 1t t t t� �
Chapter 5 Detecting Chaffed and Jittered Stepping Stone Connections
93
abCP should be the expected value of ! � ! �sj ej si eib b a aPr( , , )t t t t� , and because
connection a behaves as Poisson processes with rate � , which means ia is
exponential distribution. Then we can derive:
! � ! �sj ej si eib b a a0
( )
0
( ) ( ) ( )
( ) (
Pr( , , )*
11* *( )1
1 (1 )*ln(1 )
(1 )*ln(1
a ba b
a b
a a ab b b
a ab b
ab
x
Rtt RttRtt Rtt x xxRtt Rtt
Rtt Rtt Rtt Rtt Rtt Rtt
Rtt Rtt Rtt Rtt
CP
t t t t e dx
ee dx e dxe
e e e
e e
�
�� �
�
� � �
�
�
� �
�� �
� �� ��� ���
� � � � � �
� � � �
�
� �
� � � � �
� �
"
" "
) )�
Now we can relax the assumption a bRtt Rtt� by replacing the a bRtt Rtt� with
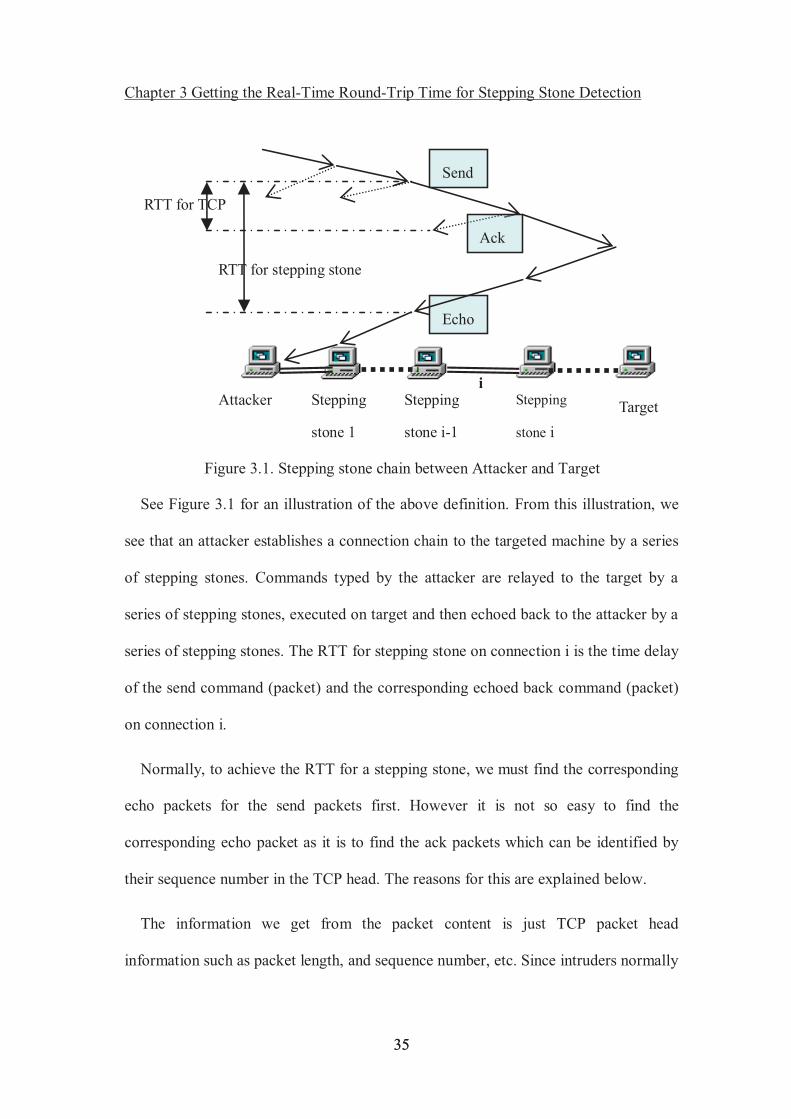
Figure 5.7. Accuracy for SAPD with monitoring time increasing
Chapter 5 Detecting Chaffed and Jittered Stepping Stone Connections
109
APD. The UFCP for SAPD rises slightly quicker than UVCP for APD, which is the
0 200 400 600 800 1000 1200 1400 1600 1800 20000
10
20
30
40
50
60
70
80
90
100
Fixed delay(ms)
Rat
e(%
)UFCPCPTrue Positive
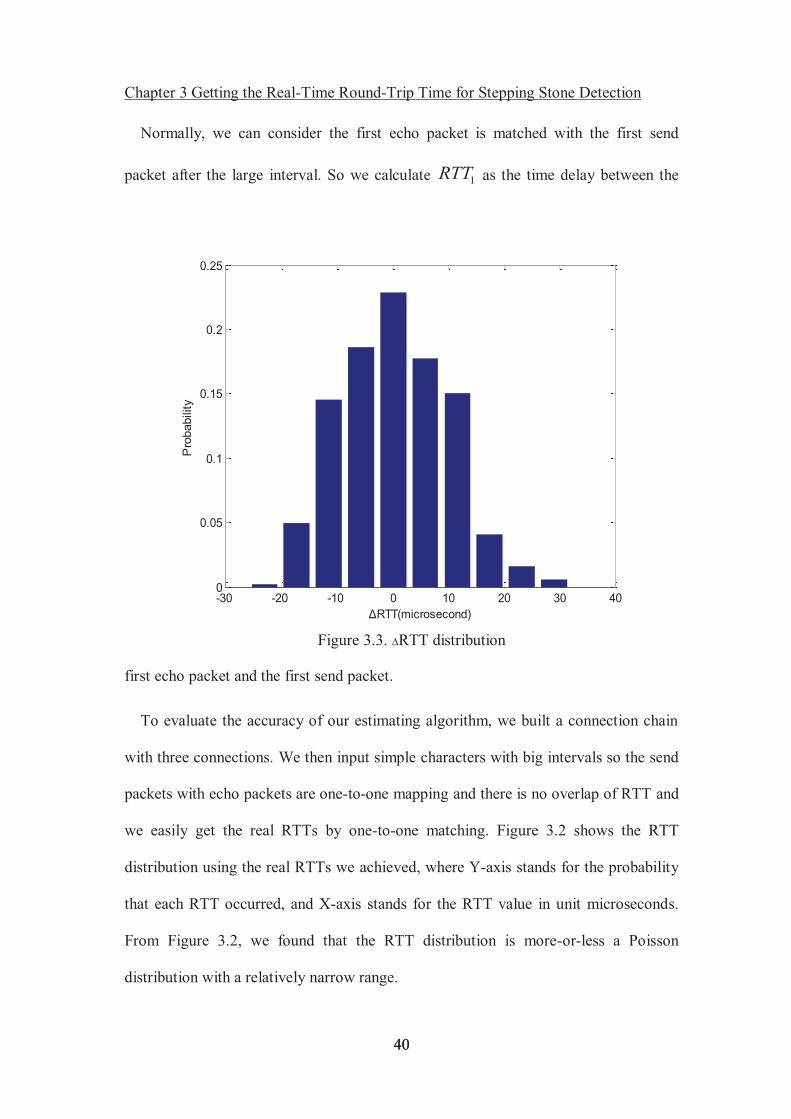
Figure 5.8. The impact to correlated connections by fixed jitter for SAPD
0 200 400 600 800 1000 1200 1400 1600 1800 20000
10
20
30
40
50
60
70
80
90
100
Fixed delay(ms)
Rat
e(%
)
UFCPCPTrue Negative
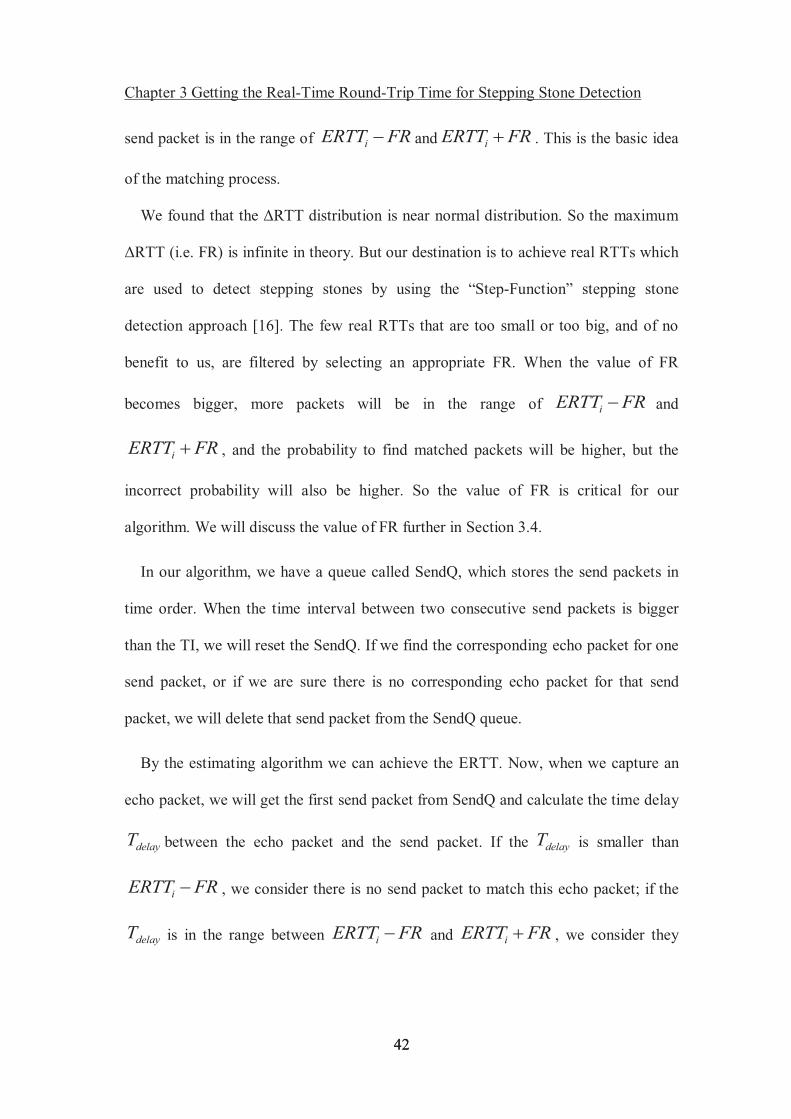
Figure 5.9. The impact to normal connections by fixed delay for SAPD
Chapter 5 Detecting Chaffed and Jittered Stepping Stone Connections
110
reason why the true positive for SAPD starts to significantly drop from a smaller fixed
0 200 400 600 800 1000 1200 1400 1600 1800 20000
10
20
30
40
50
60
70
80
90
100
Fixed delay(ms)
Rat
e(%
)
UFCP for SAPDUVCP for APDTrue Positive for SAPDTrue Positive for APD
Figure 5.10. Comparing for APD and SAPD by fixed delay
0 500 1000 1500 2000 2500 30000
10
20
30
40
50
60
70
80
90
100
Max Jitter(ms)
Rate
(%)
UFCP for SAPDTrue Positive for SAPDUVCP for APDTrue Positive for APD
Figure 5.11. Comparing for APD and SAPD by jitter
Chapter 5 Detecting Chaffed and Jittered Stepping Stone Connections
111
delay than APD. From Figure 5.9, we found the true negative is 100%, as UFCP for
SAPD rises slightly quicker than UVCP for APD.
0 500 1000 1500 2000 2500 30000
10
20
30
40
50
60
70
80
90
100
Max Jitter(ms)
Rat
e(%
)
UFCPCPTrue Positive
Figure 5.12. Impact to correlated connections by jitter with SAPD
0 500 1000 1500 2000 2500 30000
10
20
30
40
50
60
70
80
90
100
Max jittter(ms)
Rat
e(%
)
UFCPCPTrue Negative
Figure 5.13. Impact to normal connections by jitter with SAPD
Chapter 5 Detecting Chaffed and Jittered Stepping Stone Connections
112
Figure 5.12 and Figure 5.13 shows the results by fixed delay. Figure 5.11 shows the
results compared with APD. We find the true positive for SAPD drops quicker than
APD.
As a result, we conclude the accuracy for SAPD starts to drop significantly from a
smaller dropping point than for APD, and its accuracy drops quicker than APD.
Therefore, APD is more suitable for detecting connections than SAPD if there are
relative big jitters.
5.5.2.3 Accuracy Comparison
We compared our methods and previous approaches from four perspectives:
1. The accuracy for identifying normal connections and correlated connections
2. The accuracy for identifying normal connections and correlated connections
with inserted chaffs
3. The accuracy for identifying normal connections and correlated connections
with added jitters
4. The accuracy for identifying normal connections and correlated connections
with both the insertion of chaffs and the addition of jitters
Table 5.5. Parameters values for sketching and S-III
Approach Parameters
Sketching slot=1500ms thresh=71
S-III max delay = 3000ms
Chapter 5 Detecting Chaffed and Jittered Stepping Stone Connections
113
For previous approaches, we selected and implemented sketching and S-III. S-III
was proposed by Zhang et al. [9], whose experiments demonstrated it is more
effective in detecting stepping stones with jitter and chaff than most other methods.
Sketching [35] is the latest approach which, to some extent, is resistant to both chaff
and packet jitters. During the experiments, we found the result of sketching and S-III
is largely affected by the different parameters, and with the parameters shown in Table
5.5, we can achieve the best results for them.
To reach the above four destinations, we ran the stepping stone detection
approaches on the original captured data or on the chaff inserting delay with the
addition of jitters or without the addition of jitters.
Figure 5.14 shows the accuracy of the original data for the different monitoring
times. We find both APD and SAPD have around 95% accuracy when monitoring
10 20 30 40 50 60 70 80 90 100 110 1200
10
20
30
40
50
60
70
80
90
100
Monitoring time(s)
Accu
racy
(%)
Max jitter=0ms Chaff rate=0
SAPDAPDsketchingS-III
Figure 5.14. Accuracy with no jitter and chaff
Chapter 5 Detecting Chaffed and Jittered Stepping Stone Connections
114
time is 10 seconds, and this increases to 100% accuracy when the monitoring time is
bigger than 50s. The accuracy for sketching is around 70%, when monitoring time is
10 seconds, and this increases to 100% accuracy when the monitoring time is larger
than 70s. The normal accuracy for SIII is only around 80%.
Figure 5.15 shows the accuracy for chaff inserting data of different chaff rates when
monitoring time is 60 seconds. We find that APD and SAPD is hardly affected by
chaffs, and sketching is only affected to a small degree by chaff packets, while the
accuracy of S-III drops significantly with the chaff rate rising.
The accuracy for original data with different jitter added with a monitoring time of
60 seconds is shown in Figure 5.16. Figure 5.16, which shows that APD, SAPD and
S-III are rarely affected by jitters, while the accuracy of sketching drops significantly
with the chaff rate rising.
0 0.2 0.4 0.6 0.80
10
20
30
40
50
60
70
80
90
100Monitoring time=60s Max jitter=0ms
Chaff rate
Accu
racy
(%)
APDSAPDsketchingS-III
0 0.2 0.4 0.6 0.8
50
60
70
80
90
100
Chaff rate
Accu
racy
(%)
APDSAPDSketchingS-III
Figure 5.15. Accuracy with chaff only
Chapter 5 Detecting Chaffed and Jittered Stepping Stone Connections
115
Figure 5.17 shows the accuracy for insertion of chaff data (chaff rate is 0.4) with
1000ms max jitter added. From Figure 5.17, we find the accuracy for SAPD and APD
0 200 400 600 800 10000
10
20
30
40
50
60
70
80
90
100
Max jitter(ms)
Accu
racy
(%)
Monitoring time=60s Chaff rate=0
APDSAPDSketchingS-III
Figure 5.16. Accuracy with jitter only
10 20 30 40 50 60 70 80 90 100 110 1200
10
20
30
40
50
60
70
80
90
100
Monitoring time(s)
Accu
racy
(%)
Max jitter = 1000ms chaff rate =0.4
APDSAPDSketchingS-III
Figure 5.17. Accuracy with chaff and jitter
Chapter 5 Detecting Chaffed and Jittered Stepping Stone Connections
116
is around or more than 90%, while other methods have an accuracy of around 65%
when the chaff rate is 0.4 and jitter is 1000ms. In addition, SAPD and APD will reach
around 100% accuracy if the monitoring time is long enough. Meanwhile, SAPD
demonstrates it is slightly more effective than APD in resisting to chaff and jitter.
5.6 Summary
In this chapter, based on the two Poisson processing models, we formulated and
proved two separate upper bounds of probability that normal connections present with
the timing causality of correlated connections. In addition, based on the two upper
bounds of probability, we proposed APD and SAPD algorithms which can detect
stepping stones accurately even if there are large jitters and a high chaff rate.
Compared to APD, SAPD has lower less computation costs, but its accuracy drops
quicker than APD when jitters are relative big. Our experiments show that both APD
and SAPD are increasingly resistant to chaffs and jitters than sketching and S-III
which are shown having high resistance to chaffs and jitters in previous researches. At
the same time, both APD and SAPD maintain a high accuracy for the detection of data
with no chaffs or jitters.
Chapter 6 Experimental Analysis for Stepping Stone Detection Approaches
117
Chapter 6
Experimental Analysis for Stepping Stone
Detection Approaches
Many network-based passive stepping stone detection approaches have been
suggested in this thesis. However, there are still two big issues for the previous
experimental design. One issue is the lack of application in Internet environments.
Another is the absence of high quantitative comparative studies. In this chapter, we
implement 13 stepping stone detection algorithms, exact the SSH data from public
traces that have millions of packets and obtain genuine stepping stone connection
chain data from the Internet. We establish a set of criteria and run these algorithms
through several scenarios with different datasets. Based on the experimental results
and analysis, we give our conclusion in real-time application of stepping stone
detection approaches, the accuracy of stepping stone detection approaches, the
impaction of assumption, chaffs and jitters. In addition, we give suggestions for
improving some stepping stone detection approaches.
Chapter 6 Experimental Analysis for Stepping Stone Detection Approaches
118
6.1 Introduction
Since the problem of stepping stones was first discovered by Staniford-Chen and
Heberlein [1], many network-based passive approaches have been proposed to detect
encrypted stepping stones. However, there are still two big issues for the previous
experimental design.
Firstly, experiments should be conducted in Internet environments, which has been
addressed in the two stepping stone survey papers [15] and [100]. Currently, most
research has been conducted in a lab environment, such as running simulations on a
local area network (LAN), or by simulated data. While these present ideal situations,
when introduced to Internet queuing delays, packet dropping may occur which has
been proven in [44]. The question remains: can stepping stone approaches be suitable
for this situation, especially when some of the approaches assume there is no packet
drop?
Secondly, it needs high quantitative comparative studies. Currently most research
does not compare previous methods. In fact some only do the analysis in theory. Even
if certain approaches did compare the results using the insufficient criterion, they
would be are inconvincible. Zhang et al. in [9] compared his four algorithms with the
previous five algorithms, however their experiments were not based on genuine
stepping stone data. Although they use public SSH data, it cannot simulate genuine
stepping stone data, especially if there is no packet drop in their simulation.
In this chapter, our aim is to present high quantitative comparative experimental
results using various testing methods with multiple datasets, including a genuine
Chapter 6 Experimental Analysis for Stepping Stone Detection Approaches
119
Internet stepping stone dataset. To achieve this, we implement a total of 13 algorithms,
exact the SSH data from the public traces that have millions of packets and obtain data
from the genuine stepping stone connection chains from the Internet. We also
establish a set of criteria and run these algorithms with different durations, different
drop rates, different chaff rates, different delays and different jitters. In addition, based
on the experimental results, we provide answers to the following questions:
1. Can the approaches, with the assumption of no packet drops, be applied in real
Internet environments?
2. Which approaches have high accuracy?
3. Which approaches have high accuracy during a short duration?
4. Which approaches can resist chaffs or jitters?
The rest of this chapter is organised as follows. In Section 6.2, we introduce the
design of our experiments, including the implementation of stepping stone detection
approaches, private dataset and public dataset. Section 6.3 provides an analysis of
comparative experimental results. Finally, in Section 6.4, we provide a summary of
this chapter.
6.2 Design of Experiments
6.2.1 The Implementation of Stepping Stone Detection Approaches
We implemented most of the network-based passive stepping stone detection
approaches, including ON/OFF [2], Deviation [3], IPD [4], DA [8], DMV [21], DM
Chapter 6 Experimental Analysis for Stepping Stone Detection Approaches
120
[10], S-I [9], S-II [9], S-III [9], S-III [9], sketching [35], PDBC, APD and SAPD. The
essence of DM [10] is the same as S-I [9], therefore we only show the results of S-I
later in the analysis and experiments. The details for every algorithm can be found in
previous chapters. In this section, we only concentrate on the difference between our
implementation and the original algorithms, real-time application analysis and the
definition of parameters.
Most algorithms failed to indicate the length of connection streams or how many
packets they needed for the detection of stepping stones. Therefore, we added a
duration parameter to every algorithm. The duration parameter is the amount of time
connection streams last for every detection process. In real-time application, duration
means the monitoring time for stepping stone connections. For the same duration, the
algorithm with a higher accuracy is considered more accurate. A larger duration
means more processing and more monitoring time, i.e. slow responsiveness. Therefore,
for application in Internet environments, we prefer the algorithm with a higher
accuracy for the shortest duration.
Real-time application means less storage with lower one-off computing demands. If
an algorithm has a multiple layer circle from the beginning of the duration, it means
that it needs to store all packets during the duration and has to perform the detection
process when all packets are collected. Therefore, this kind of algorithm is not suited
for real-time application.
Before we introduce all algorithms, we list all the parameters for every algorithm in
Table. 6.1. PDBC, APD and SAPD are approaches proposed in Chapter 4 and Chapter
5, so we will not go into any further detail.
Chapter 6 Experimental Analysis for Stepping Stone Detection Approaches
121
The ON/OFF approach proposed by Zhang et al. [2] is the first approach designed
to detect encrypted stepping stone data. In their approach, they calculated the
correlation of different connections by using each connection’s OFF periods. The
design is simple and the correlated OFF period can be calculated in real-time.
Table 6.1. Parameters of stepping stone detection approaches
Approach Parameter Denotation
ON/OFF idleT When there is no data traffic on a connection for more than idleT , the connection is considered to be in an OFF period
� Two OFF periods are correlated if their ending times differ by ��
� If the ratio of the number of correlated OFF periods to the smaller number of OFF periods in one of compared connection �� , then the two compared connections are correlated connections
Deviation dev If the deviations calculated from connection b to connection a dev� , a and b are correlated connections
IPD Window size
The number of packets used to calculate correlation points
CP� Maximum correlation points value � Correlation Value threshold
DA/DMV p� Maximum number of packets that may be sent in maximum tolerable delay bound
S-I(DM)/ S-III,
� Maximum tolerable delay bound
S-II/ SIV � Maximum tolerable delay bound
other Depend on the approach it used together
Sketching TSL The length of timeslots by forming the time axis
# If the sketches difference between two connections #� , the two connections are considered correlated connections
PDBC � Maximum packet delay difference on bidirection � Maximum correlated rate
APD/SAPD No No
Chapter 6 Experimental Analysis for Stepping Stone Detection Approaches
122
However it does have several parameters, and these parameters should be adjusted for
different network situations, especially the � parameter, which determines if two OFF
periods are correlated. In application, � should be larger than the arrival time delay
for the same packet between two compared connections. For satellite links, it may be
of significant value, but for a LAN link it may be of insignificant value. The
inappropriate selection of � will lead ON/OFF to fail in detecting stepping stones.
But it is possible to automatically improve the ON/OFF by calculating � with the
EBA algorithm (as proposed in Chapter 3) according to the streams.
The deviation algorithm proposed by Yoda et al. [3] uses the idea that the sequence
number vs. the time curves of correlated connections should be close to each other.
This algorithm is not designed for real-time application, since the computation is very
complex and all packet timing and sequence number information needs to be stored
during the duration.
IPD, as proposed by Wang et al. [4] uses the inter-packet delay of packets to
correlate connections. While it was designed for quick responsiveness it is not suitable
for real-time application, since finding the correlated point consumes too much time
and all inter-packet delay information needs to be stored during the duration.
DA [8] and DMV [21] are packet number based algorithms. They assume there is
no packet drop during the relay of stepping stones, and all packets sent by the
upstream connection should arrive at the downstream connection in � (Maximum
tolerable delay bound). The accuracy of their real application is doubted due to this
unrealistic assumption, however their design is simple and can be used in real-time.
The original DMV algorithm has a packet number parameter which indicates the
Chapter 6 Experimental Analysis for Stepping Stone Detection Approaches
123
packet number required. With our implementation, we replaced it with duration. In the
DA algorithm, there is a packet number upbound computed by the parameter p� ,
which is the maximum number of packets that may be sent in maximum tolerable
delay bound. If the packet number during the duration is smaller than the upbound, we
output the non correlated connections result.
S-I [9], S-II [9], S-III [9] and SIV [9] are timing based approaches which have
similar assumptions to DA and DMV, and therefore we doubt their accuracy in real
application as well. In addition, the maximum tolerable delay parameters � in these
algorithms will lose their meaning in real application because some packets sent by
the upstream connections may never appear on the downstream connections. On the
other hand, S-I is not suitable for real-time application because there is a multiple
layer circle from the beginning of the duration. S-II and SIV do the packet filtering
function first, but they have to be used together with other approaches. So, whether S-
II and SIV can be used in real-time application depends on the algorithms used with
them. During our implementation, we follow [9] and use the Deviation [3] approach in
SII and SIV.
The sketching approach proposed by Coskun et al. [35] is based on succinct packet-
timing sketches of network steams. Coskun et al. claim that it can be run efficiently in
real-time. However they failed to consider the value of timefor calculating sketches. In
our later experiments, we found the selection of time-slot length parameter TSL
significantly affected the accuracy of sketching. In addition, the correct selection of
TSL is related to the inter-packet delay on connections. Therefore, sketching
Chapter 6 Experimental Analysis for Stepping Stone Detection Approaches
124
approaches can be improved by automatically calculating the TSL parameter according
to every actual connection stream.
From the above analysis, we conclude that the IPD, deviation and SI (DM) are not
suitable for real-time application.
6.2.2 Private Dataset
Genuine stepping stone data from the Internet is the best source of data for testing the
real application of stepping stone detection approaches. However, it is very difficult to
get a publicly available stepping stone dataset. Even if you do find one, it is very
difficult to prove it really is a stepping stone without TCP content.
Therefore, we used our captured genuine stepping stone dataset from the self-built
connection chains on the Internet from Chapter 4. This dataset includes two
connection chains which are composed of four connections respectively, with every
connection lasting three minutes. This dataset can be considered ideal data for testing
stepping stone detection approaches, in that:
1. It is genuine stepping stone data, and we know which connections are
correlated connections, and which connections are normal connections in
advance. There are a total of 16 normal connection pairs and 12 correlated
connection pairs. In addition, there are not only neighboured correlated
connections (connections relayed by one stepping stone), but also remote
correlated connections (connections relayed by multiple stepping stones).
Chapter 6 Experimental Analysis for Stepping Stone Detection Approaches
125
2. There are more than 7% retransmission packets on some connections, which is
higher than the normal 1%-6% Internet retransmission rate [53], and the
packet number differences in some connection chains is more than 17%. This
means there are many packets drops and merges during the packet
transmission on connection chains.
Similar to the methods introduced in Chapter 4, we ran stepping stone detection
approaches with this dataset from a specified starting epoch for a specified duration,
and then output the results of every connection pair. In order to obtain more results,
every 500ms along the stream was selected as the starting epoch. For example, for
every connection pair or normal connection pair, was 240 results for 60 seconds
duration on the three minute captured dataset. This gave us a total of 240*(12+16)
results for 60 seconds duration. From these results we obtained our accuracy, which is
the ratio of the number of correct results to the number of total results.
Besides the natural packet drops, packet merge and packet retransmission during
packet transmission, chaffs and jitters may be added by attackers to evade detection.
To test the impaction of chaffs, we created chaff inserting data by introducing chaff
packets into the original captured data at random times with different chaff rates, the
ratio of the number of introduced chaff packets to the number of original send packets.
Then we were able to follow a similar method to the original dataset, by running the
stepping stone detection approaches with chaff inserting data to check the impact of
chaffs.
To test the impaction of jitters, we modified the stepping stone detection algorithms.
When we achieved the packet pairs by the RTT getting algorithm on the connection
Chapter 6 Experimental Analysis for Stepping Stone Detection Approaches
126
with a bigger RTT for the APD and SAPD algorithm, we subtracted a random number
chosen from the interval [0, max Jitter] to the arrival epoch of the send packet in the
packet pair. For other stepping stone detection algorithms, because they only consider
data from one direction, we directly added a random delay chosen from the interval [0,
max Jitter] to the arrival epoch of each packet on one of the compared connections.
This means using the real stepping stone dataset, we can test:
1. How accurate a stepping stone detection approach can be for real internet
applications.
2. The impaction of chaffs to stepping stone detection approaches.
3. The impaction of jitters to stepping stone detection approaches.
6.2.3 Public Dataset
To prove and reinforce the experimental results by the private dataset, we extracted
separately one of the longest SSH connections from four different Auckland-VIX
traces [52] captured in 2008, with every extracted connection lasting for about 30
minutes. Since correlated connections must occur during the same time period, we
altered the start packet arrival time for every extracted connection to zero, and
changed the arrival time of later packets on this connection to the time delay with the
start packet of the connection. We refer to these four extracted connections as the
original connections.
Next, we created the correlated connections for the original connections by
subtracting a send delay from the send packets arrival epoch and adding an echo delay
Chapter 6 Experimental Analysis for Stepping Stone Detection Approaches
127
to the echo packet arrival epoch. The send delay and the echo delay can be different,
and are the sum of a specified fixed delay and jitter, which is a random amount chosen
from the interval [0, maxDelay]. If the created arrival epoch for a send or echo packet
is earlier than the arrival epoch for a front send or echo packet, we add 1 micro-
seconds to the front arrival epoch as the created arrival epoch. This means we have
four correlated connection pairs. We refer to these four created connections as the
upstream connections.
Since every original connection is exacted from a different trace, they should be
uncorrelated, which is the same for upstream connections. Except for the above four
correlated connection pairs, every other connection pair among the four original
connections and four upstream connections is a normal connection pair.
For the four original connections and the four upstream connections, we follow the
procedure of the private dataset, obtain the stepping stone detection results and
calculate the accuracy. Since the difference between the number of correlated
connection pairs and the number of normal connection pairs is large, it is sometimes
the case that the accuracy cannot reflect the actual results. We also use the true
positive (the ratio that correlated connections are accurately judged as correlated
connections) and true negative (the ratio that normal connections accurately judged as
normal connections) to illuminate the accuracy.
The existence of packet drops is inevitable during packet relay on stepping stones.
To simulate this situation, we selectively deleted packets from the original
connections with a specified drop rate, the ratio of the number of deleted packets to
the number of original packets. It should be noted that the result is different for the
Chapter 6 Experimental Analysis for Stepping Stone Detection Approaches
128
deletion of packets from upstream connections and the deletion of packets from
original connections. Deleting packets from upstream connections is similar to adding
chaffs. We refer to these four created connections as the drop connections. For the
four drop connections and four upstream connections, we follow the previous
procedure and achieve results based on accuracy.
During our experiments, we generated four group datasets, one group composed of
four original connections and four upstream connections with small delay (100ms)
and small jitter (20ms); one group composed of four original connections and four
upstream connections with big delay (200ms) and big jitter (50ms); one group
Chapter 6 Experimental Analysis for Stepping Stone Detection Approaches
140
6.3.3 Experimental Results Summary
By examining the experimental results and previous analysis, we can make the
following conclusions.
1. IPD, deviation and SI (DM) are not suitable for real-time application.
2. Approaches with the assumption of no packet drops are not suitable for use in real
Internet environments.
3. When there are no packet drops, nearly all approaches, except IPD, can achieve
100% accuracy if the duration is large enough.
4. In real Internet environments, PDBC, APD, SAPD, ON/OFF and sketching can
achieve high accuracy if the duration is big enough.
5. In real Internet environments, PDBC, APD, SAPD can achieve high accuracy if
the duration is small. PDBC is more accurate than APD or SAPD in very small
durations.
6. PDBC, APD and SAPD are hardly affected by chaffs.
7. APD and SAPD are hardly affected by jitters.
Therefore, if we want to apply a stepping stone detection approach in Internet
environments with quick responsiveness, we would select PDBC; if we want a
stepping stone detection approach to have high accuracy, even with chaff and jitter
perturbations, we would select APD or SAPD.
In addition, during experiments, for nearly all approaches except APD and SAPD,
we attempted to use different parameters for different datasets. The accuracy is
occasionally low because we didn’t find the appropriate value for the parameters,
especially the TSL parameter for the sketching approach and the � parameter for
Chapter 6 Experimental Analysis for Stepping Stone Detection Approaches
141
ON/OFF. From this point, APD and SAPD have no parameter, and can be easily
suited to any dataset. As we mentioned before, the ON/OFF can be improved by
calculating the � parameter, and the sketching approach can be improved by
calculating the TSL parameter according to steams.
6.4 Summary
The insufficient application of stepping stone detection approaches in real Internet
environments, and the absence of high quantitative comparative studies using stepping
stone detection approaches are still current issues for stepping stone research. In this
chapter, we implemented a total of 13 stepping stone detection algorithms, exacted
SSH data from public traces that have millions of packets and obtained genuine
stepping stone connection chain data from the Internet. We established a set of criteria
and ran these algorithms in several scenarios with different dataset. Based on the
experimental results and analysis, we give the conclusion about the real-time
application of stepping stone detection approaches, the accuracy of stepping stone
detection approaches, the impaction of assumption, chaffs and jitters. In addition, we
also provided suggestions for improving stepping stone detection approaches.
Chapter 7 Conclusions and Future Work
142
Chapter 7
Conclusions and Future Work
This chapter summarises the main contributions of this thesis on detecting stepping
stone in real Internet environments, and presents the significance of this research.
Finally, we make suggestions for improving our research in the future.
7.1 Conclusions
7.1.1 Major Contributions
The Internet has become increasingly critical, but at the same time, Internet attacks
have increased significantly. One of the most important reasons for this is that
attackers are able to easily hide their identities and evade punishment by relaying their
attacks through stepping stones. To date, stepping stone detection systems have
already been proposed, however challenges still remain when applied in Internet
environments and whether they will resist evasion. The aim of the research in this
thesis has been to develop stepping stone detection systems, which can provide
Chapter 7 Conclusions and Future Work
143
effective and efficient stepping stone detection in real Internet environments, and identify
evasion techniques used by attackers. We have achieved these aims, and the main
contributions of our research can be summarised as follows.
� We proposed a real-time RTT getting algorithm for stepping stone detection.
The proposed Estimation Based Algorithm (EBA) can provide RTTs for RTT
based stepping stone detection systems to identify correlated connections, and
it also can provide RTTs for non-RTT based stepping stone detection systems
to calculate important parameters. The experiments show that our algorithm is
far more precise than other real-time RTT getting algorithms. We also present
theory analysis from the probability point, which shows that our algorithm has
a high matching rate and has a high accuracy rate similar to the complicated
non real-time SDBA [51] approach. By proposing the EBA, the stepping stone
detection systems [48] which cannot be applied in practice and those [2] which
are hard to select parameters for, may become practical.
� We proposed the Packet Delay Bidirectional Comparison (PDBC) scheme,
which is a simple but practical stepping stone detection system. It has no
assumption of no-packet-dropping, and it is designed with high efficiency. Our
experiments show that the proposed scheme can achieve more than 90%
accuracy by monitoring for 2 seconds and can achieve more than 95% accuracy
by monitoring for 10 seconds. This is in addition to low computation cost.
Chapter 7 Conclusions and Future Work
144
Compared to most stepping stone detection systems, it has the quickest
responsiveness when applied in Internet environments.
� We initially proposed the upper bounds of probability that normal streams
present with the timing feature of stepping stone attack streams, and applied
them first to stepping stone detection. We also designed the Abnormal
Probability Detection algorithm (APD) and the Speedy Abnormal Probability
Detection algorithm (SAPD) which can accurately detect stepping stones even
if there is big jitter and a high chaff rate. We compare the two proposed
stepping stone detection systems with many previous ones and the experiments
show that the two proposed systems are more resistant to chaffs and jitters than
previous ones. These two stepping stone detection systems also maintain high
accuracy for detecting stepping stone attack streams with no chaffs and jitter
perturbations. In addition, no parameters need to be adjusted in the APD and
SAPD algorithms, therefore it is suitable for application in practice.
� We presented high quantitative comparative experimental analysis of network
based passive stepping stone detection systems. Based on the implementation
of the 13 stepping stone detection systems, the exaction of SSH data from
public traces with millions of packets, and the capturing of genuine stepping
stone connection chains data from the Internet, we tested these stepping stone
detection systems in several scenarios using uniform criteria. According to the
experimental results and analysis, we give the conclusion about the real-time
application of stepping stone detection systems, the accuracy of stepping stone
Chapter 7 Conclusions and Future Work
145
detection systems, the impaction of assumption, the impaction of chaffs and
jitters. In addition, we presented some suggestions improvement suggestion for
previous stepping stone detection systems.
7.1.2 Significance of this Thesis
The proposed RTT getting algorithm for stepping stones, and the stepping stone
detection schemes described in this thesis can bring significant benefits to both
academia and industry. The significance of this thesis may be summarized as follows:
� Networks have dramatically changed the daily activities of people, particularly
in how we communicate and how we learn and conduct business.
Unfortunately, while enjoying the convenience of the Internet, we also have to
deal with network security problems. Attackers from anywhere may attack a
site at any time causing near irreparable damage. One of the reasons for this is
that attackers can very easily hide their identities and evade the desired
punishment by relaying their attacks through stepping stones. Therefore, this
research into stepping stone detection systems in Internet environments is very
important and highly practical.
� The RTT getting algorithm is critical for stepping stone detection. Due to the
absence of a real-time precise RTT getting algorithm, some stepping stone
detection systems [48] cannot be applied in practice, and some of them can’t be
Chapter 7 Conclusions and Future Work
146
easily employed [2]. Therefore, the proposed RTT getting algorithm will
accelerate the application of stepping stone detection systems in industry and
also improve the research of stepping stone detection systems in academia.
� The profound analysis presented in the comparative experimental study on
network based passive stepping stones can provide advantages to further research
in this area. At the same time, it provides a sound reference for the application of
stepping stone detection systems in industry.
� Since we focus our research on real application, the proposed stepping stone
detection schemes and RTT getting algorithm described in this thesis can be
directly adopted by industry, which has the potential to change the current
stagnant application of stepping stone detection systems in industry.
7.2 Future Work
This thesis has developed several stepping stone detection systems and compared
most network based passive stepping stone detection systems. However, there is room
for further improvement. Below, we outline some issues that have arisen from this
thesis and future directions for this work. This list is intended to be neither detailed
nor comprehensive, but merely suggests some possible ideas for developing future
work explored in this thesis first.
Chapter 7 Conclusions and Future Work
147
� Improve some aspects of the experiments conducted. Experiments about chaffs
and jitters were based on simulation. So in future work, we would like to use
real-life SSH data with chaffs and jitters using the SNEAK tool [46], or by
directly modifying the SSH client and server software. Secondly, the scale of
data in our experiments was not large enough, so we would like to collect more
private or public data to conduct a scalable experiment in the future.
� Improve some aspects of the algorithms. When there were very large jitters, the
EBA RTT getting algorithm does not work well. In this scenario, we would like
to consider the RTT with big fluctuation as an anomaly, and be able to notify
the stepping stone detection system. Secondly, while we presented some
improvements for other approaches, in the future work, we would like to
implement and evaluate these.
� Detect non-interactive connections. In this thesis, our research focuses on
interactive connections. Although attackers normally launch attacks via
interactive connections, one-way communication is still possible. In future
work, we will consider applying the probability bounds to one-way
communication.
� Develop a stepping stone detection device. In this thesis, all of our proposed
algorithms can be run in real-time, however in our experiments we ran them
Chapter 7 Conclusions and Future Work
148
off-line. In future work, we will consider the development of a real stepping
stone detection device which can be run on the Internet.
� Identify legal stepping stone connections. In this thesis, our aim is to detect
connections in the same connection chain. But some of them may not be attack
traffic, as normal users may also construct a connection chain. While this may
be so, the traffic mode is usually different for normal users and attackers. In
future work, we will consider a system to identify between legal connections
and stepping stone connections.
Bibliography
149
Bibliography
[1] S. Staniford-Chen and L.T. Herberlein: “Holding Intruders Accountable on the Internet”, Proc. 1995 IEEE Symposium on Security and Privacy, 1995, pp. 39-49. [2] Y. Zhang and V. Paxson: “Detecting Stepping-Stones”, Proc. 9th USENIX Security Symposium, 2000, pp. 67-81. [3] K. Yoda and H. Etoh: “Finding a Connection Chain for Tracing Intruders”, Proc. 6th European Symposium on Research in Computer Security (LNCS 1985), 2000, pp. 31-42. [4] X. Wang, D.S. Reeves, and S.F. Wu: “Inter-packet delay based correlation for tracing encrypted connection through Stepping-Stone”, Proc. 7th European Symposium on Research in Computer Security (ESORICS 2002), 2002, pp. 244-263. [5] D.L. Donoho, A.G. Flesia, U. Shankar, V. Paxson, J. Coit, and S. Staniford: “Multiscale Stepping-Stone detection: Detecting pairs of jittered interactive streams by exploiting maximum tolerable delay”, Proc. 5th International Symposium on Recent Advances in Intrusion Detection (RAID 2002), 2002, pp. 49-64 [6] X. Wang and D.S. Reeves: “Robust correlation of encrypted attack traffic through Stepping-Stones by manipulation of interpacket delays”, Proc. 10th ACM Conference on Computer and Communication Security (CCS 2003), 2003, pp. 20-29. [7] W.T. Strayer, C.E. Jones, I. Castineyra, J.B. Levin, and R.R. Hain: “An integrated architecture for attack attribution”, BBN Technologies, Tech. Rep. BBN REPORT-8384, 2003. [8] A. Blum, D. Song, and S. Venkataraman: “Detection of interactive Stepping-Stones: Algorithm and confidence bounds”, The 7th International Symposium on Recent Advances in Intrusion Detection (RAID 2004), 2004. [9] L. Zhang, A. G. Persaud, A. Johson, Y. Guan: “Stepping- Stone Attack Attribution in Non-Cooperative IP Networks”, in Proc. Of the 25th IEEE International Performance Computing and Conference (IPCCC 2006), 2006.
Bibliography
150
[10] T. He and L. Tong: “A Signal Processing Perspective to Stepping-Stone Detection”, in Proc. 2006 Conference on Information Sciences and Systems, (Princeton, NJ), March 2006. [11] P. Peng, P. Ning, and D. S. Reeves: “On the Secrecy of Timing-Based Active Watermarking Trace-Back Techniques”, in Proc. of the 2006 IEEE Symposium on Security and Privacy (S&P), May 2006, pp. 334–349. [12] K. H. Yung: “Detecting long connection chains of interactive terminal sessions”, in RAID 2002, Lecture Notes in Computer Science, vol. 2516, Jan 2002, pp. 1–16. [13] J. Yang and S. Huang: “A Real-Time algorithm to Detect Long Connection Chains of Interactive Terminal Sessions”, Proceedings of InfoSecu04, Shanghai, China, 2004, pp.198-203. [14] J. Yang and S.-H. Huang: “Matching tcp packets and its application to the detection of long connection chains on the internet”, in AINA 2005 19th International Conference on Advanced Information Networking and Applications, March 2005, pp. 1005–1010. [15] A. Almulhem and I. Traore: “A Survey of Connection-Chains Detection Techniques”, 2007 IEEE Pacific Rim Conference on Communications, Computers and Signal Processing, (2007) [16] J. Yang, and S-H. .S. Huang: “Matching TCP/IP packets to Detect Stepping-Stone Intrusion”, International Journal of Computer Science and Network Security (IJCSNS), vol. 6, no. 10, Oct. 2006, pp. 269-276. [17] P. Peng, P. Ning, D. S. Reeve, and X. Wang: “Active Timing-Based Correlation of Perturbed Traffic Flows with Chaff Packets”, in Proc. Of the 2nd International Workshop on Security in Distributed Computing Systems (SDCS), Jun. 2005, pp. 107–113. [18] X. Wang, D. S. Reeves, S. F. Wu, and J. Yuill: “Sleepy Watermark Tracing: An Active Network-Based Intrusion Response Framework”, in Proc. of the 16th International Conference on Information Security (IFIP/Sec), Jun. 2001, pp. 369–384. [19] X. Wang, D. S. Reeves, P. Ning, and F. Feng: “Robust network-based attack attribution through probabilistic watermarking of packet flows”, Technical Report TR-2005-10, Department of Computer Science, NC State Univ., 2005. [20] T. He and L. Tong: “Detecting Encrypted Stepping-Stone Connections”, Tech. Rep. ACSPTR- 01-06-02, Cornell University, January 2006.
Bibliography
151
[21] T. He and L. Tong: “Detecting Encrypted Interactive Stepping-Stone Connections”, in Proc. 2006 IEEE International Conference on Acoustics, Speech, and Signal Processing, (Toulouse, France), May 2006. [22] L. Zhang, A. G. Persaud, A. Johnson, and Y. Guan: “Detection of Stepping-Stone attack under delay and chaff perturbations”, presented at the 25th IEEE Int. Perform. Comput. Commun. Conf. (IPCCC), Phoenix, AZ, 2006. [23] T. He, P. Venkitasubramaniam, and L. Tong: “Packet Scheduling Against Stepping-Stone Attacks with Chaff”, Proceedings of IEEE MILCOM, Cornell University, October, 2006 [24] T. He and L. Tong: “Detecting Information Flows: “Improving Chaff Tolerance by Joint Detection”, CISS 2007: 51-56 [25] Y.J. Pyun and D. S. Reeves: "Strategic Deployment of Network Monitors for Attack Attribution", to appear in Proc. of the 4th Intl. Conf. on Broadband Communications, Networks, and Systems (IEEE Broadnets 2007), September 2007 [26] J. Yang, S-H. S. Huang, and M. D. Wan: “A clustering partitioning algorithm to find TCP packet round-trip time for intrusion detection”, Advanced Information Networking and Applications, 2006. AINA 2006. 20th International Conference on Volume 1, Issue , 18-20 April 2006 Page(s): 6 pp [27] M.N. Omar, M.A. Maarof, A. Zainal: “Solving time gap problems through the optimization of detecting Stepping-Stone algorithm”, Computer and Information Technology, 2004. CIT '04. The Fourth International Conference on Date: 14-16 Sept. 2004, Pages: 391 – 396 [28] J. Yang and S-H. S. Huang: “Correlating Temporal Thumbprints for Tracing Intruders”, To appear in Proceedings of 3rd International Conference on Computing, Communications and Control Technologies (CCCT’05), Austin, TX, July (2005). [29] W.T. Strayer, C. Jones, B. Schwartz, S. Edwards, W. Milliken, and A. Jackson: “Efficient Multi-Dimensional Flow Correlation”, In Proceedings of the 32nd IEEE Conference on Local Computer Networks (October 15 - 18, 2007). IEEE Computer Society, Washington, DC, 531-538 [30] W.T. Strayer, C.E. Jones, B.I. Schwartz,J. Mikkelson, and C. Livadas: “Architecture for multi-stage network attack traceback” In Proceedings of the the IEEE Conference on Local Computer Networks 30th Anniversary (November 15 - 17, 2005). IEEE Computer Society, Washington, DC, 776-785 [31] M.N. Omar, M.A. Maarof and A. Zainal: “The Optimization of Stepping-Stone Detection: Packet Capture Steps”, Jurnal Teknologi, vol. 44, no. (D), Jun 2006, pp. 1-14.
Bibliography
152
[32] Y. Tang, Y. Liverpool and T.E. Daniels: “Monitor placement for Stepping-Stone analysis”, Performance, Computing, and Communications Conference, 2006. IPCCC 2006. 25th IEEE International Date: 10-12 April 2006, Pages: 8 pp. 509-512 [33] S-H. S. Huang, R. Lychev and J. Yang: “Stepping-Stone Detection Via Request-Response Traffic Analysis”, ATC 2007: 276-285 [34] Y. J. Pyun, Y. H. Park, X. Y. Wang, D. S. Reeves, and P. Ning: "Tracing Traffic Through Intermediate Hosts that Repacketize Flows", in Proc. of the 26th Annual IEEE Conf. on Computer Communications (Infocom 2007), May 2007 [35] B. Coskun and N. Memon,: “Efficient Detection of Delay-Constrained Relay Nodes”, Computer Security Applications Conference, 2007. ACSAC 2007. Twenty-Third Annual Date: 10-14 Dec. 2007, Pages: 353 – 362 [36] A. Chantler and R. Broadhurst: “Social Engineering and Crime Prevention in Cyberspace“, Technical Report, Justice, Queensland University of Technology, 2006 [37] E. Messmer: “Cyber Espionage: A growing Threat to Business”, PC World, January 21, 2008 [38] B. Coskun and N. Memon: “Online Sketching of Network Flows for Real-Time Stepping-Stone Detection”, in Proc. of the Annual Computer Security Applications Conference, pp 473-483, 2009 [39] P. Li, W. Zhou and Y. Wang: “Getting the Real-Time Precise Round-Trip Time for Stepping Stone Detection”, in Proc 4th International Network and System Security(NSS), Melbourne, Australia, 2010 [40] G. Gu, J. Zhang, and W. Lee: “BotSniffer: Detecting botnet command and control channels in network traffic”. In Proceedings of the 15th Annual Network and Distributed System Security Symposium (NDSS’08), 2008. [41] G. Gu, R. Perdisci, J. Zhang, and W. Lee. “Botminer: Clustering analysis of network traffic for protocol and structure independent botnet detection”. In USENIX Security, 2008. [42] S. Kent and R. Atkinson: “RFC 2401: Security Architecture for the Internet Protocol”, IETF, September 1998. draft-ietfipsec-arch-sec [43] T. Ylonen.: “IETF Internet Draft: SSH Protocol Architecture”, IETF, March 2005. draft-ietf-secsharchitecture-22 [44] M. N. Omar, L. Siregar, and R. Budiart: “Dropped Packet Problems in Stepping-Stone Detection”, IJCSNS International Journal of Computer Science and Network Security, VOL.8 No.2, February 2008
Bibliography
153
[45] M. Venkateshaiah and M. Wright: “Evading Stepping-Stone Detection Under the Cloak of Streaming Media”, Tech. Report, Department of Computer Science and Engineering, University of Texas at Arlington, Arlington, TX 76019, 2007. [46] J. D. Padhye and M. Wright: “Stepping-Stone Network Attack Kit (SNEAK) For Evading Timing-based Detection Methods Under The Cloak Of Constant Rate Multimedia Streams”, Computer Science & Engineering, 17-Sep-2008 [47] M. Venkateshaiah and M. Wright: “Evading Existing Stepping-Stone Detection Methods Using Buffering”, Computer Science & Engineering, 23-Aug-2007 [48] J. Yang and S-H. S. Huang, "Improved Thumbprint and Its Application for Intrusion Detection," Proceedings of the Third International Conference on Computer Network and Mobile Computing (ICCNMC), Zhangjiajie, China, August 2-4, 2005, pp. 433-442 [49] A. Kampasi, Y. Zhang, G. Di Crescenzo, A. Ghosh, and R.Talpade: "Improving Stepping-Stone Detection Algorithms using Anomaly Detection Techniques". The University of Texas at Austin, Department of Computer Sciences. Report# TR-07-28 (regular report). May 21, 2007. 8 pages. [50] S. C. Lee and C. Shields: “Tracing the Source of Network Attack: A Technical, Legal, and Societal Problem”. In Proceedings of the 2001 IEEE Workshop on Information Assurance and Security, West Point, NY, June 2001. [51] J. Yang and S. Huang: “Probabilistic Analysis of an Algorithm to Compute TCP Packet Round-Trip Time for Intrusion Detection”, Journal of Computers and Security, Elsevier Ltd., 2007, pp137-144, Vol. 26 [52] http://www.wand.net.nz/wits/auck/9/ [53] C. Chen, M. Mangrulkar, N. Ramos and M. Sarkar: “Trends in TCP/IP Retransmissions and Resets”, Technical Report, URL: http://cseweb.ucsd.edu/classes/wi01/cse222/projects/reports/tcp-flags-13.pdf [54] H.-C. Wu and S.-H. S. Huang: “Detecting steppingstone with chaff perturbations,” in AINAW ’07: Proceedings of the 21st International Conference on Advanced Information Networking and Applications Workshops, 2007, pp. 85–90. [55] D. Knuth: "The Art of Computer Programming", 3rd ed., vol. 1, 1997, p.98 [56] D.L., Mills: Internet Delay Experiments. IETF document, http://www.ietf.org/rfc/rfc889.txt (1983) [57] Department of the Air Force and Air Force Materiel Command: “Network attack traceback,” April 2005.
Bibliography
154
[58] H-C. Wu and S-H. S. Huang: “Performance of Neural Networks in Stepping-Stone Intrusion Detection”, Networking, Sensing and Control, 2008. ICNSC 2008. IEEE International Conference on Date: 6-8 April 2008, Pages: 608 – 613 [59] X. Wang: “The loop fallacy and serialization in tracing intrusion connections through Stepping-Stones.”, SAC 2004: 404-411 [60] X. Wang: "The Loop Fallacy and Deterministic Serialization in Tracing Intrusion Connections Through Stepping-Stones", in International Journal of Security and Networks, Vol. 1, No. 3/4, 2006 [61] J. Postel: “RFC793 - Transmission Control Protocol”, September 1981, http://www.faqs.org/rfcs/rfc793.html [62] J. Postel: “RFC 768 - User Datagram Protocol”, August 1980, http://www.faqs.org/rfcs/rfc768.html [63] J. Postel: “RFC 792 - Internet Control Message Protocol”, September 1981, http://www.faqs.org/rfcs/rfc792.html [64] Z. Trabelsi, W. El-Hajj, S. Hamdy: “Implementation of an ICMP-based covert channel for file and message transfer”, Electronics, Circuits and Systems, 2008. ICECS 2008. 15th IEEE International Conference on Date: Aug. 31 2008-Sept. 3 2008, Pages: 894 – 897 [65] J. Postel and J. Reynolds : “RFC 854 - Telnet Protocol Specification”, May 1983, http://www.faqs.org/rfcs/rfc854.html [66] T. Ylonen and C. Lonvick : “RFC 4251 - The Secure Shell (SSH) Protocol Architecture”, January 2006, http://www.ietf.org/rfc/rfc4251.txt [67] J. Oikarinen and D. Reed: “RFC 1459 - Internet Relay Chat Protocol”, May 1993, http://www.ietf.org/rfc/rfc1459.txt [68] J. Yang and S. Huang: “Mining TCP/IP Packets to Detect Stepping-Stone Intrusion”, Journal of Computers and Security, Elsevier Ltd., pp 479-484, Vol. 26 (2007) [69] Q. Li and D.L. Mills: “On the long-range dependence of packet round-trip delays in Internet”, In: Proc. international conference on communications (ICC’98), Atlanta, USA, No. 1, pp 1185–92 (1998) [70] T. Elteto and S. Molna.: “On the Distribution of Round-Trip Delays in TCP/IP Networks”, In: Proc. the 24th Annual IEEE Conference on Local Computer Networks, p172 (1999)
Bibliography
155
[71] J. Yang and S. Huang: “Probabilistic Analysis of an Algorithm to Compute TCP Packet Round-Trip Time for Intrusion Detection”, Journal of Computers and Security, Elsevier Ltd., 2007, pp137-144, Vol. 26. [72] Y. Zhang, J. Yang and C. Ye, “ Modeling and Detecting Stepping-Stone Intrusion”, IJCSNS International Journal of Computer Science and Network Security, VOL.9 No.7, July 2009 [73] W. Feller.: Probability Theory and its Applications. Volume 1. John Wiley and Sons, Inc. (1968) [74] V. Paxson and S. Floyd: Wide-area tra_c: The failure of poisson modeling. IEEE/ACM Transactions on Networking 3 (1995) 226-244 [75] OpenSSH, http://www.openssh.com. [76] Cygwin,http://www.cygwin.com/ [77] Wireshark, http://www.wireshark.org/ [78] Putty, http://www.chiark.greenend.org.uk/~sgtatham/putty/ [79] KpyM, http://www.kpym.com/2/kpym/index.htm [80] Jackson network, http://en.wikipedia.org/wiki/Jackson_network [81] Little’s law, http://en.wikipedia.org/wiki/Little's_law [82] Poisson distribution, http://en.wikipedia.org/wiki/Poisson_distribution [83] Expected value, http://en.wikipedia.org/wiki/Expected_value [84] Probability theory, http://en.wikipedia.org/wiki/Probability_theory [85] Normal distribution, http://en.wikipedia.org/wiki/Normal_distribution [86] Exponential distribution, http://en.wikipedia.org/wiki/Exponential_distribution [87] Jensen’s inequality, http://en.wikipedia.org/wiki/Jensen's_inequality [88] Chebyshev’s inequality, http://en.wikipedia.org/wiki/Chebyshev's_inequality [89] DDoS, http://en.wikipedia.org/wiki/Denial-of-service_attack [90] Queueing theory, http://en.wikipedia.org/wiki/Queueing_theory
Bibliography
156
[91] M. N. Omar and R. Budiarto: “Hybriding Intelligent Host-Based and Network-Based Stepping Stone Detections”, Machine Learning and Systems Engineering, Lecture Notes in Electrical Engineering, 2010, Volume 68, 83-95 [92] J. Xin, L. Zhang, B.Aswegan, J. Dickerson, T. Daniels and Y. Guan: “A Testbed for Evaluation and Analysis of Stepping Stone Attack Attribution Techniques”, Testbeds and Research Infrastructures for the Development of Networks and Communities, 2006. TRIDENTCOM 2006. 2nd International Conference 9 pp. – 378 [93] J. Aikat, J. Kaur, F.D. Smith and K. Jeffay: “Variability in TCP round-trip times”, Proceedings of the ACM SIGCOMM Internet Measurement Conference, 2003, IMC, pp. 279-284. [94] P. Karn and C. Partridge: “Improving round-trip time estimates in reliable transport protocols”, Proceedings of the ACM workshop on Frontiers in computer communications technology, p.2-7, August 11-13, 1987, Stowe, Vermont, United States [95] F. Leu: “Intrusion Detection, Forecast and Traceback Against DDoS Attacks”,2009, http://jitas.im.cpu.edu.tw/2009/2.pdf [96] W. Zhou. Keynote III: Detection and traceback of DDoS attacks. in Computer and Information Technology, 2008. CIT 2008. 8th IEEE International Conference on. 2008. [97] H. Jung, H. Kim, Y. Seo, G. Choe, S. Min, C. Kim and K. Koh: “Caller Identification System in the Internet Environment,” Proceedings of 4th USENIX Security Symposium, vol. 246, 1993. [98] S. Snapp, J. Brentano, G. Dias, T. Goan, L. Heberlein, C. Ho, K. Levitt, B. Mukher-jee, S. Smaha, T. Grance, et al.: “DIDS (Distributed Intrusion Detection System)-Motivation, Architecture, and an Early Prototype,” Proceedings of the 14th National Computer Security Conference, pp. 167–176, 1991. [99] T. Yan M. Veeraraghavan: “Networks of Queues”, 2004, http://www.ece.virginia.edu/mv/edu/715/lectures/QNet.pdf [100] R. Shullich, J. Chu, P. Ji, and W. Chen: “A Survey of Research in Stepping-Stone Detection”, Proceedings of International Conference on Internet Studies (NETs2010), Taiwan, 2010