This article was downloaded by: [University of Missouri Columbia], [Cuizhen Wang] On: 01 April 2013, At: 08:44 Publisher: Taylor & Francis Informa Ltd Registered in England and Wales Registered Number: 1072954 Registered office: Mortimer House, 37-41 Mortimer Street, London W1T 3JH, UK Geocarto International Publication details, including instructions for authors and subscription information: http://www.tandfonline.com/loi/tgei20 Detecting winter wheat phenology with SPOT-VEGETATION data in the North China Plain Linlin Lu a , Cuizhen Wang b , Huadong Guo a & Qingting Li a a Center for Earth Observation and Digital Earth, Chinese Academy of Sciences, Beijing, China b Department of Geography, University of Missouri, Columbia, USA Accepted author version posted online: 23 Jan 2013.Version of record first published: 25 Mar 2013. To cite this article: Linlin Lu , Cuizhen Wang , Huadong Guo & Qingting Li (2013): Detecting winter wheat phenology with SPOT-VEGETATION data in the North China Plain, Geocarto International, DOI:10.1080/10106049.2012.760004 To link to this article: http://dx.doi.org/10.1080/10106049.2012.760004 PLEASE SCROLL DOWN FOR ARTICLE Full terms and conditions of use: http://www.tandfonline.com/page/terms-and- conditions This article may be used for research, teaching, and private study purposes. Any substantial or systematic reproduction, redistribution, reselling, loan, sub-licensing, systematic supply, or distribution in any form to anyone is expressly forbidden. The publisher does not give any warranty express or implied or make any representation that the contents will be complete or accurate or up to date. The accuracy of any instructions, formulae, and drug doses should be independently verified with primary sources. The publisher shall not be liable for any loss, actions, claims, proceedings, demand, or costs or damages whatsoever or howsoever caused arising directly or indirectly in connection with or arising out of the use of this material.
Transcript
This article was downloaded by: [University of Missouri Columbia], [Cuizhen Wang]On: 01 April 2013, At: 08:44Publisher: Taylor & FrancisInforma Ltd Registered in England and Wales Registered Number: 1072954 Registeredoffice: Mortimer House, 37-41 Mortimer Street, London W1T 3JH, UK
Geocarto InternationalPublication details, including instructions for authors andsubscription information:http://www.tandfonline.com/loi/tgei20
Detecting winter wheat phenology withSPOT-VEGETATION data in the NorthChina PlainLinlin Lu a , Cuizhen Wang b , Huadong Guo a & Qingting Li aa Center for Earth Observation and Digital Earth, ChineseAcademy of Sciences, Beijing, Chinab Department of Geography, University of Missouri, Columbia, USAAccepted author version posted online: 23 Jan 2013.Version ofrecord first published: 25 Mar 2013.
To cite this article: Linlin Lu , Cuizhen Wang , Huadong Guo & Qingting Li (2013): Detecting winterwheat phenology with SPOT-VEGETATION data in the North China Plain, Geocarto International,DOI:10.1080/10106049.2012.760004
To link to this article: http://dx.doi.org/10.1080/10106049.2012.760004
PLEASE SCROLL DOWN FOR ARTICLE
Full terms and conditions of use: http://www.tandfonline.com/page/terms-and-conditions
This article may be used for research, teaching, and private study purposes. Anysubstantial or systematic reproduction, redistribution, reselling, loan, sub-licensing,systematic supply, or distribution in any form to anyone is expressly forbidden.
The publisher does not give any warranty express or implied or make any representationthat the contents will be complete or accurate or up to date. The accuracy of anyinstructions, formulae, and drug doses should be independently verified with primarysources. The publisher shall not be liable for any loss, actions, claims, proceedings,demand, or costs or damages whatsoever or howsoever caused arising directly orindirectly in connection with or arising out of the use of this material.
Detecting winter wheat phenology with SPOT-VEGETATION data inthe North China Plain
Linlin Lua*, Cuizhen Wangb, Huadong Guoa and Qingting Lia
aCenter for Earth Observation and Digital Earth, Chinese Academy of Sciences, Beijing, China;bDepartment of Geography, University of Missouri, Columbia, USA
(Received 10 July 2012; final version received 14 December 2012)
Monitoring phenological change in agricultural land improves our understanding ofthe adaptation of crops to a warmer climate. Winter wheat–maize and winter wheat–cotton double-cropping are practised in most agricultural areas in the North ChinaPlain. A curve-fitting method is presented to derive winter wheat phenology fromSPOT-VEGETATION S10 normalized difference vegetation index (NDVI) data prod-ucts. The method uses a double-Gaussian model to extract two phenological metrics,the start of season (SOS) and the time of maximum NDVI (MAXT). The results arecompared with phenological records at local agrometeorological stations. The SOSand MAXT have close agreement with in situ observations of the jointing date andmilk-in-kernel date respectively. The phenological metrics detected show spatial vari-ations that are consistent with known phenological characteristics. This study indi-cates that time-series analysis with satellite data could be an effective tool formonitoring the phenology of crops and its spatial distribution in a large agriculturalregion.
Keywords: winter wheat; phenology; SPOT-VEGETATION; time series
1. Introduction
Global land surface temperature has increased during the twentieth century by about0.74 °C (IPCC 2007). According to the 2007 report of the Intergovernmental Panel onClimate Change, the ‘best estimate’ of future warming is 3.4 °C by 2100, with a likelyrange from 2.0 to 5.4 °C. In China, the annual mean air temperature is predicted toincrease 2.3–3.3 °C by 2050 compared with 2000 levels (PRC 2007). Phenologicaldevelopments such as leaf expansion and grain-filling are key physiological processesof crops and are strongly influenced by temperature (Sadras & Monzon 2006). Pheno-logical development in agricultural land indicates a crop’s adaptation to its environ-ment. Therefore, monitoring phenological changes in croplands could improve ourunderstanding of their biological responses to a warmer climate.
The phenology of a specific crop type can be documented at local agrometeorologicalstations (e.g. Schwartz 1994; Menzel et al. 2006). When recorded at plot scales, however,these ground observations limit our interpretation of large-scale phenological patterns andthe biological responses to global climate change (Schwartz et al. 2006). Remote sensingtechnologies provide promising data sources for monitoring phenology because of the
large spatial coverage and frequent observations of satellite systems. Long-term time-ser-ies satellite images have been applied in phenology studies in recent decades. Amongthese data-sets, the most common ones are those acquired by the advanced very high res-olution radiometer (AVHRR) onboard the National Oceanic and Atmospheric Adminis-tration (NOAA) satellite series since 1982 (Justice et al. 1985; Reed et al. 1994; Moulinet al. 1997; Myneni et al. 1997). The AVHRR-normalized difference vegetation index(NDVI) products are developed to examine phenological characteristics all over theglobe. The NDVI represents normalized spectral variation and optimally representsgreenness and productivity on vegetated land surfaces (Kidwell 1998). More recently,phenological studies have been enhanced with more data-sets that have coarse resolutionsand global coverage, such as those from the VEGETATION sensor onboard SPOT-4since 1998 and the Moderate Resolution Imaging Spectroradiometer (MODIS) sensorsonboard the Terra and Aqua satellites since 1999 and 2002, respectively. These instru-ments record more accurate radiometric and geometric properties of Earth’s surfacebecause of their improved atmospheric correction and cloud-screening techniques (Hueteet al. 2002; Maisongrande et al. 2004).
Various methods have been developed to derive vegetation phenology. A commonmethod is to assign an NDVI threshold to mark the onset of vegetative growth (Lloyd1990). This threshold, however, varies with vegetation types, soils and climate condi-tions (Reed et al. 1994). It is difficult to define a unique, single threshold to representthe onset of greenness in large geographic regions. In order to explore the variability ofphenological characters for different land cover types, the strategy of trend analysis ofNDVI time series on a pixel-by-pixel basis has been proposed. Phenological modelsand curve-fitting methods were used to identify the occurrence of significant phenologi-cal events (Zhang et al. 2003). The TIMESAT programme is developed to process timeseries of vegetation indices derived from satellite-based spectral measurements (Jönsson& Eklundh 2002, 2004). These methods have been successfully applied in deciduousforests and grasslands that are less disturbed by human activities (Heumann et al. 2007;Soudani et al. 2008). For example, Fisher and Mustard (2007) and Fisher et al. (2006)used two multiplicative sigmoid models modified from Zhang et al. (2003) to extractthe phenological metrics of deciduous forests from MODIS and Landsat images. Del-bart et al. (2006) extracted phenological data in boreal regions using a normalized dif-ference water index derived from SPOT-VEGETATION imagery.
The phenological characteristics of croplands, however, can be complicated. Zhanget al. (2006) found that crops might have multiple growth and senescence cycles underdifferent agricultural practices, making it more challenging to extract phenological met-rics. Specific methods are developed to detect phenological stages of main crops inChina (Zhang et al. 2004; Lu & Guo 2009). The phenological growth stages of winterwheat are first monitored with NOAA NDVI data in the North China Plain (Xin et al.2001). However, the short growth cycle of rotated crops and high level of noise some-times make it difficult to determine the growth and senescence cycles of winter wheatwithin a single year (Yan et al. 2010). The objective of this study is to develop a curve-fitting approach to enhance phenological extraction for winter wheat from a time seriesof SPOT-VEGETATION products. A simulation is developed to extract wheat phenol-ogy in the North China Plain, an important wheat production region in China. Thesatellite-derived vegetation phenology is then analysed and compared with observationrecords at local agrometeorological stations.
2 L. Lu et al.
Dow
nloa
ded
by [U
nive
rsity
of M
isso
uri C
olum
bia]
, [C
uizh
en W
ang]
at 0
8:44
01
Apr
il 20
13
2. Materials and methods
2.1. Study region and data-set
2.1.1. Study region and crop phenology
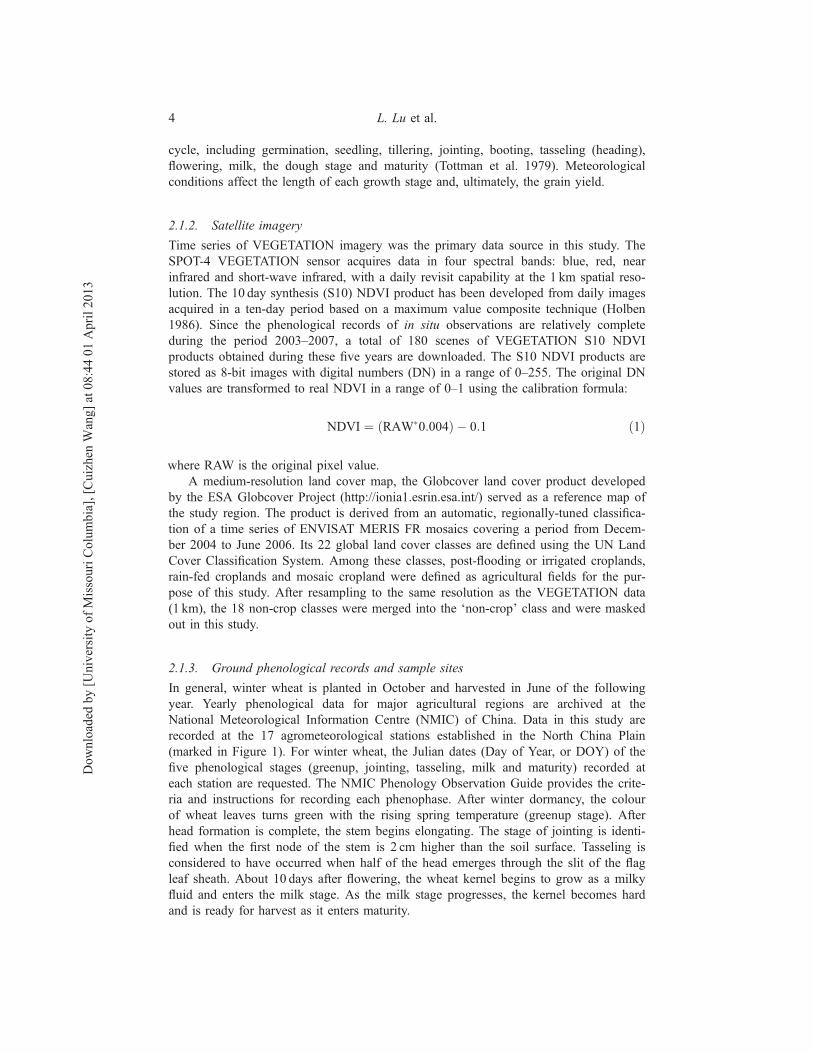
The North China Plain is the largest agricultural region in China. It extends from 113°to 120° E longitude and 32° to 42°N latitude, covering three provinces (Shandong,Hebei and Henan) and two municipalities (Beijing and Tianjin) in northern China(Figure 1). The total area of the North China Plain is about 541,000 sq km. This landproduces 64.53million tonnes of wheat, which is 56% of the country’s total wheatproduction in 2011 (National Bureau of Statistics of China 2011). Within the context ofclimate change, it is very important to monitor winter wheat phenology in the plain forfood security in China.
The landscape of the plain is dominated by wide, gentle alluvial and diluvialfloodplains with an average elevation of 70m above sea level. The climate is a typicaltemperate monsoon followed by a mild winter and there are, about 200 frost-free daysper year. More than 60% of the plain is covered by cultivated agricultural lands. Exceptfor the northern part of the plain, where spring maize and spring cotton (single-croppingsystem) are planted due to the cold climate, winter wheat–maize and winter wheat–cotton double-cropping is commonly practised in the plain. The growth cycle of winterwheat is about 230–260 days. It is sown in late September to early October, and beginsto grow until entering a dormant stage as the temperature drops in winter. The plantrenews its active growth cycle in the spring and is generally harvested in early summer.Winter wheat progresses through several major growth stages during its life
Figure 1. The study region and local agrometeorological stations. The underlying image is aVEGETATION NDVI composition acquired on May 1 (R), July 1 (G), and November 21 (B),2005. Winter wheat fields have a red/magenta tone in the image.
Geocarto International 3
Dow
nloa
ded
by [U
nive
rsity
of M
isso
uri C
olum
bia]
, [C
uizh
en W
ang]
at 0
8:44
01
Apr
il 20
13
cycle, including germination, seedling, tillering, jointing, booting, tasseling (heading),flowering, milk, the dough stage and maturity (Tottman et al. 1979). Meteorologicalconditions affect the length of each growth stage and, ultimately, the grain yield.
2.1.2. Satellite imagery
Time series of VEGETATION imagery was the primary data source in this study. TheSPOT-4 VEGETATION sensor acquires data in four spectral bands: blue, red, nearinfrared and short-wave infrared, with a daily revisit capability at the 1 km spatial reso-lution. The 10 day synthesis (S10) NDVI product has been developed from daily imagesacquired in a ten-day period based on a maximum value composite technique (Holben1986). Since the phenological records of in situ observations are relatively completeduring the period 2003–2007, a total of 180 scenes of VEGETATION S10 NDVIproducts obtained during these five years are downloaded. The S10 NDVI products arestored as 8-bit images with digital numbers (DN) in a range of 0–255. The original DNvalues are transformed to real NDVI in a range of 0–1 using the calibration formula:
NDVI ¼ ðRAW�0:004Þ � 0:1 ð1Þ
where RAW is the original pixel value.A medium-resolution land cover map, the Globcover land cover product developed
by the ESA Globcover Project (http://ionia1.esrin.esa.int/) served as a reference map ofthe study region. The product is derived from an automatic, regionally-tuned classifica-tion of a time series of ENVISAT MERIS FR mosaics covering a period from Decem-ber 2004 to June 2006. Its 22 global land cover classes are defined using the UN LandCover Classification System. Among these classes, post-flooding or irrigated croplands,rain-fed croplands and mosaic cropland were defined as agricultural fields for the pur-pose of this study. After resampling to the same resolution as the VEGETATION data(1 km), the 18 non-crop classes were merged into the ‘non-crop’ class and were maskedout in this study.
2.1.3. Ground phenological records and sample sites
In general, winter wheat is planted in October and harvested in June of the followingyear. Yearly phenological data for major agricultural regions are archived at theNational Meteorological Information Centre (NMIC) of China. Data in this study arerecorded at the 17 agrometeorological stations established in the North China Plain(marked in Figure 1). For winter wheat, the Julian dates (Day of Year, or DOY) of thefive phenological stages (greenup, jointing, tasseling, milk and maturity) recorded ateach station are requested. The NMIC Phenology Observation Guide provides the crite-ria and instructions for recording each phenophase. After winter dormancy, the colourof wheat leaves turns green with the rising spring temperature (greenup stage). Afterhead formation is complete, the stem begins elongating. The stage of jointing is identi-fied when the first node of the stem is 2 cm higher than the soil surface. Tasseling isconsidered to have occurred when half of the head emerges through the slit of the flagleaf sheath. About 10 days after flowering, the wheat kernel begins to grow as a milkyfluid and enters the milk stage. As the milk stage progresses, the kernel becomes hardand is ready for harvest as it enters maturity.
4 L. Lu et al.
Dow
nloa
ded
by [U
nive
rsity
of M
isso
uri C
olum
bia]
, [C
uizh
en W
ang]
at 0
8:44
01
Apr
il 20
13
As marked in Figures 1 and 3 of the 17 sites are used as training sites and the other14 serve as validation sites. The three training sites, Dingzhou, Jining and Zhengzhou,expand from the north to the south of the plain.
2.2. Time-series analysis and phenological metrics extraction
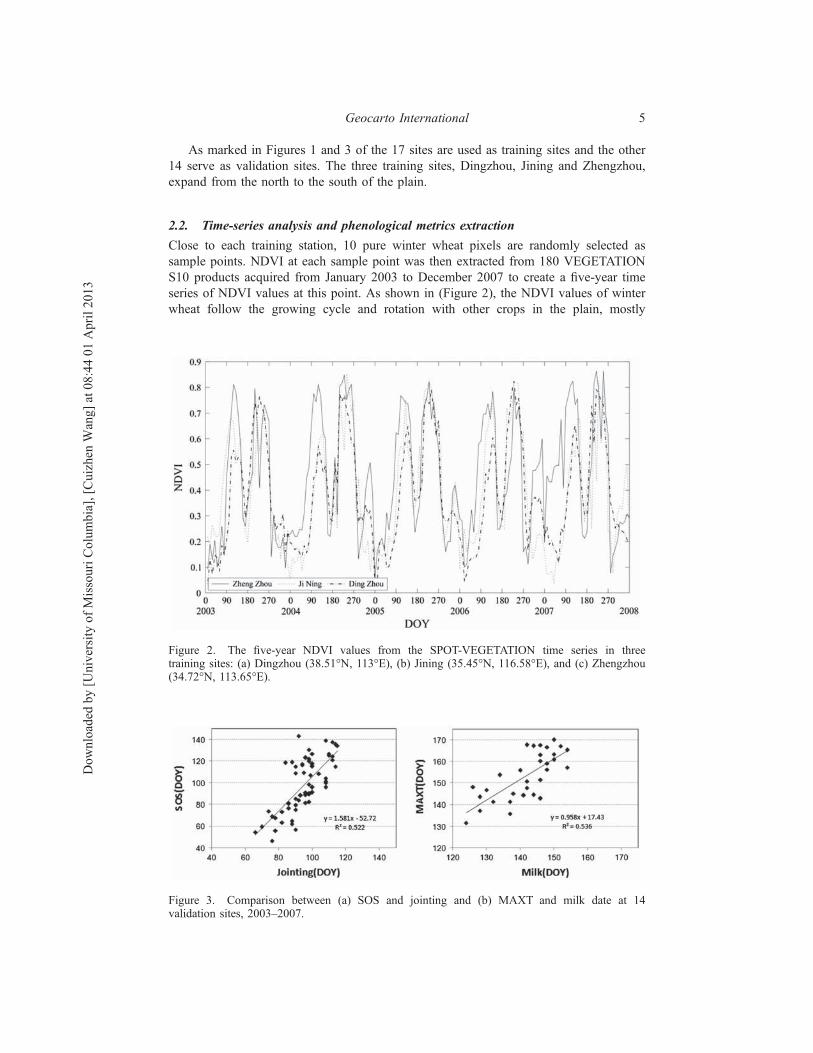
Close to each training station, 10 pure winter wheat pixels are randomly selected assample points. NDVI at each sample point was then extracted from 180 VEGETATIONS10 products acquired from January 2003 to December 2007 to create a five-year timeseries of NDVI values at this point. As shown in (Figure 2), the NDVI values of winterwheat follow the growing cycle and rotation with other crops in the plain, mostly
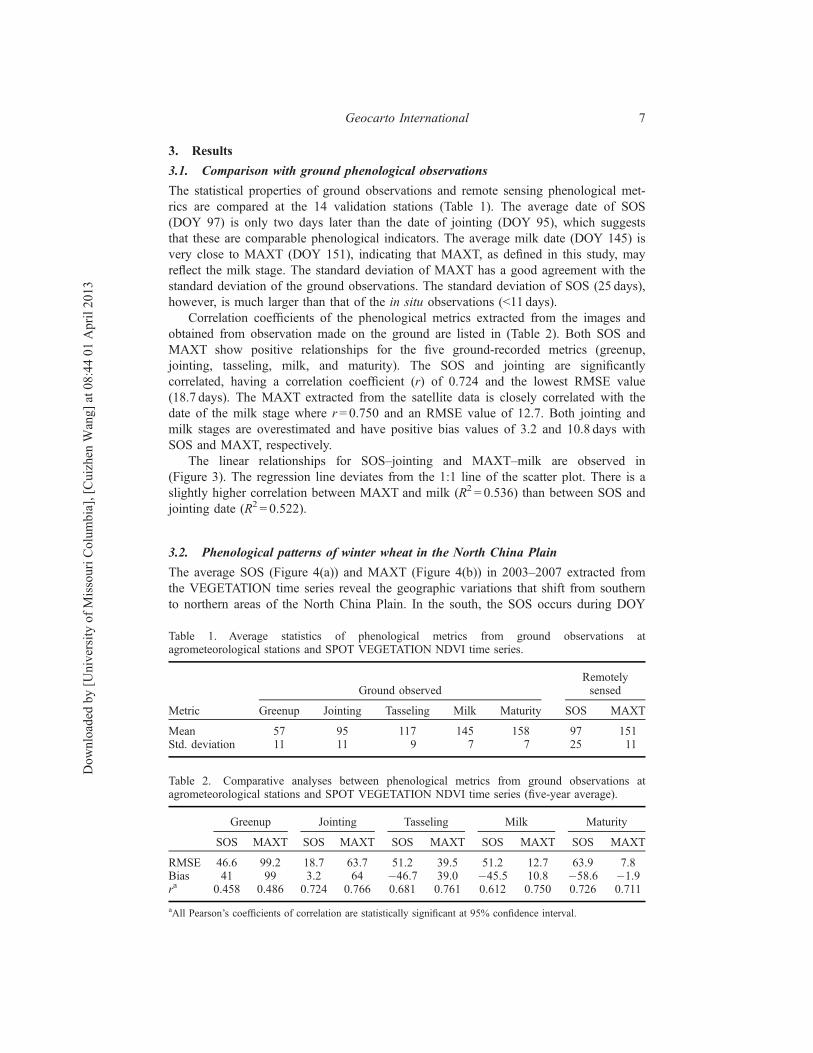
Figure 3. Comparison between (a) SOS and jointing and (b) MAXT and milk date at 14validation sites, 2003–2007.
Figure 2. The five-year NDVI values from the SPOT-VEGETATION time series in threetraining sites: (a) Dingzhou (38.51°N, 113°E), (b) Jining (35.45°N, 116.58°E), and (c) Zhengzhou(34.72°N, 113.65°E).
Geocarto International 5
Dow
nloa
ded
by [U
nive
rsity
of M
isso
uri C
olum
bia]
, [C
uizh
en W
ang]
at 0
8:44
01
Apr
il 20
13
maize. The NDVI curves in (Figure 2) display similar patterns and show peak valuesduring April and May (DOY 90–150). There is an NDVI minimum in June (DOY150–180) after winter wheat is harvested. From July to October (DOY 180–270), thesecond growth cycle of double-cropping can be observed.
Time-series curves reveal growth trends, but are still affected by temporal variationscaused by residual clouds and atmospheric conditions. In this study, time-series curvesare smoothed with the Savitzky–Golay filter (Savitzky & Golay 1964). Using a second-degree least-square polynomial fit, the filter effectively preserves primary curvatures(Chen et al. 2004) while smoothing out noises from residual clouds and other effects(Wang et al. 2011).
In this study, two important phenological indicators of winter wheat are examined.One is referred to as the ‘start of season’ (SOS) that represents the start of the activegrowth cycle in the spring. It is defined as the date when the derivative of the NDVIcomposite series reaches its maximum. As the steepest point of the Gaussian function,it can be envisioned as the date when most leaves are likely to emerge (Fisher et al.2006; Bradley et al. 2007; Fisher & Mustard 2007). The other is referred to as the ‘timeof maximum NDVI’ (MAXT) that represents the transition between the end of vegeta-tive stage and the beginning of the reproductive cycle for development of reproductiveorgans. It is defined as the the date of the maximum NDVI value in the time-seriescurve.
With sample points at the training sites, statistical properties of the five-year timeseries are analysed. For a typical double-cropped winter wheat pixel, the variationin NDVI between two growth cycles can be represented by a combination of twosymmetric Gaussian functions. The equation can be given as:
vðtÞ ¼ a1e� ðt � b1Þ2c21
þ a2e� ðt � b2Þ2c22
ð2Þ
where v(t) is the NDVI observed at time t (DOY). Parameters a1, b1, c1, a2, b2 and c2are fitting parameters, among which a1 and a2 are the amplitudes of the two Gaussianfunctions.
The parameters in Equation (2) are determined in an iterative process with prede-fined convergence criteria. Given an initial estimate for each coefficient, the modelparameters are calculated using the Levenberg–Marquardt method following a non-lin-ear least-square fit (Levenberg 1944; Marquardt 1963). With Equation (2), the NDVItrajectory is simulated and dates of phenological metrics (SOS and MAXT) areextracted.
At the 14 validation sites, correlation analysis is performed to compare the twodata-sets, the phenological metrics derived from VEGETATION data and ground pheno-logical records. To reduce the impact of the spatial heterogeneity around each station,25 wheat pixels at each ground station were randomly selected within a distance of5 km and their average SOS and MAXT values were calculated to represent the image-derived results at this station. The statistics used for the correlation analysis were thePearson correlation coefficient, the root mean square error (RMSE) and the bias (aver-age residual) between remotely sensed phenological metrics and predicted values fromground observations. The RMSE was used to evaluate the prediction uncertainty relativeto in situ observations. The bias was used to evaluate the overestimation (positive bias)or underestimation (negative bias) of phenological dates.
6 L. Lu et al.
Dow
nloa
ded
by [U
nive
rsity
of M
isso
uri C
olum
bia]
, [C
uizh
en W
ang]
at 0
8:44
01
Apr
il 20
13
3. Results
3.1. Comparison with ground phenological observations
The statistical properties of ground observations and remote sensing phenological met-rics are compared at the 14 validation stations (Table 1). The average date of SOS(DOY 97) is only two days later than the date of jointing (DOY 95), which suggeststhat these are comparable phenological indicators. The average milk date (DOY 145) isvery close to MAXT (DOY 151), indicating that MAXT, as defined in this study, mayreflect the milk stage. The standard deviation of MAXT has a good agreement with thestandard deviation of the ground observations. The standard deviation of SOS (25 days),however, is much larger than that of the in situ observations (<11 days).
Correlation coefficients of the phenological metrics extracted from the images andobtained from observation made on the ground are listed in (Table 2). Both SOS andMAXT show positive relationships for the five ground-recorded metrics (greenup,jointing, tasseling, milk, and maturity). The SOS and jointing are significantlycorrelated, having a correlation coefficient (r) of 0.724 and the lowest RMSE value(18.7 days). The MAXT extracted from the satellite data is closely correlated with thedate of the milk stage where r= 0.750 and an RMSE value of 12.7. Both jointing andmilk stages are overestimated and have positive bias values of 3.2 and 10.8 days withSOS and MAXT, respectively.
The linear relationships for SOS–jointing and MAXT–milk are observed in(Figure 3). The regression line deviates from the 1:1 line of the scatter plot. There is aslightly higher correlation between MAXT and milk (R2 = 0.536) than between SOS andjointing date (R2 = 0.522).
3.2. Phenological patterns of winter wheat in the North China Plain
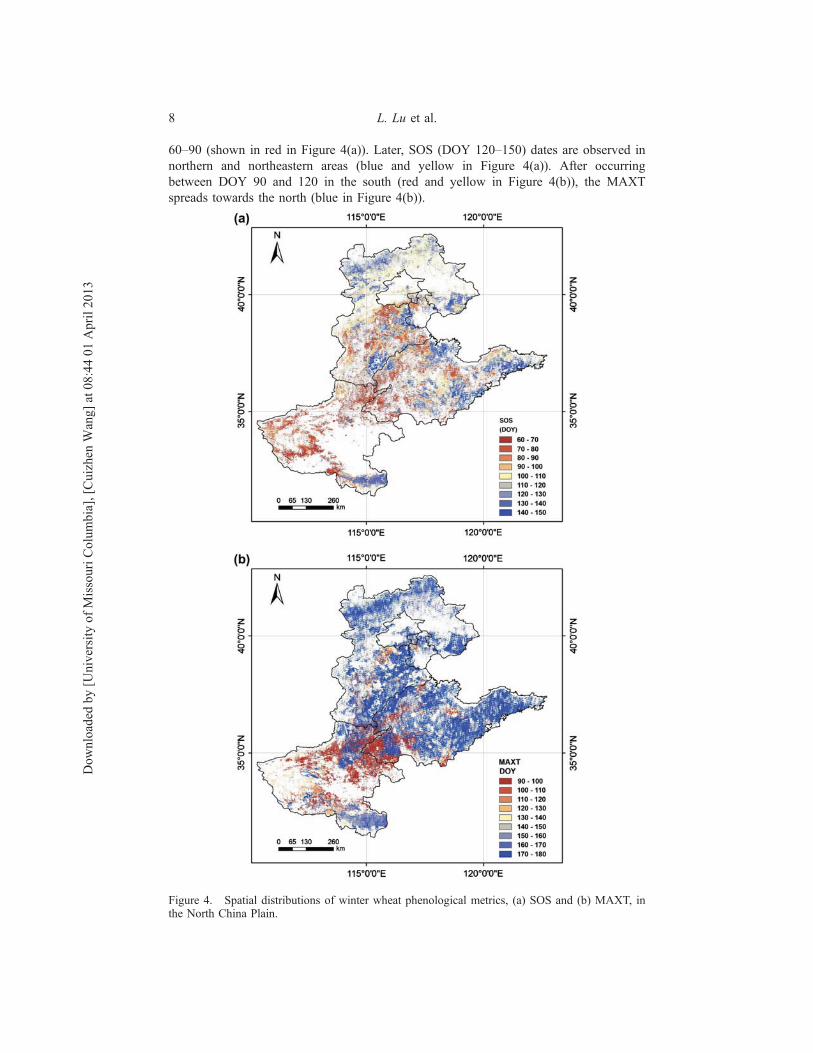
The average SOS (Figure 4(a)) and MAXT (Figure 4(b)) in 2003–2007 extracted fromthe VEGETATION time series reveal the geographic variations that shift from southernto northern areas of the North China Plain. In the south, the SOS occurs during DOY
Table 1. Average statistics of phenological metrics from ground observations atagrometeorological stations and SPOT VEGETATION NDVI time series.
Ground observedRemotelysensed
Metric Greenup Jointing Tasseling Milk Maturity SOS MAXT
Table 2. Comparative analyses between phenological metrics from ground observations atagrometeorological stations and SPOT VEGETATION NDVI time series (five-year average).
aAll Pearson’s coefficients of correlation are statistically significant at 95% confidence interval.
Geocarto International 7
Dow
nloa
ded
by [U
nive
rsity
of M
isso
uri C
olum
bia]
, [C
uizh
en W
ang]
at 0
8:44
01
Apr
il 20
13
60–90 (shown in red in Figure 4(a)). Later, SOS (DOY 120–150) dates are observed innorthern and northeastern areas (blue and yellow in Figure 4(a)). After occurringbetween DOY 90 and 120 in the south (red and yellow in Figure 4(b)), the MAXTspreads towards the north (blue in Figure 4(b)).
Figure 4. Spatial distributions of winter wheat phenological metrics, (a) SOS and (b) MAXT, inthe North China Plain.
8 L. Lu et al.
Dow
nloa
ded
by [U
nive
rsity
of M
isso
uri C
olum
bia]
, [C
uizh
en W
ang]
at 0
8:44
01
Apr
il 20
13
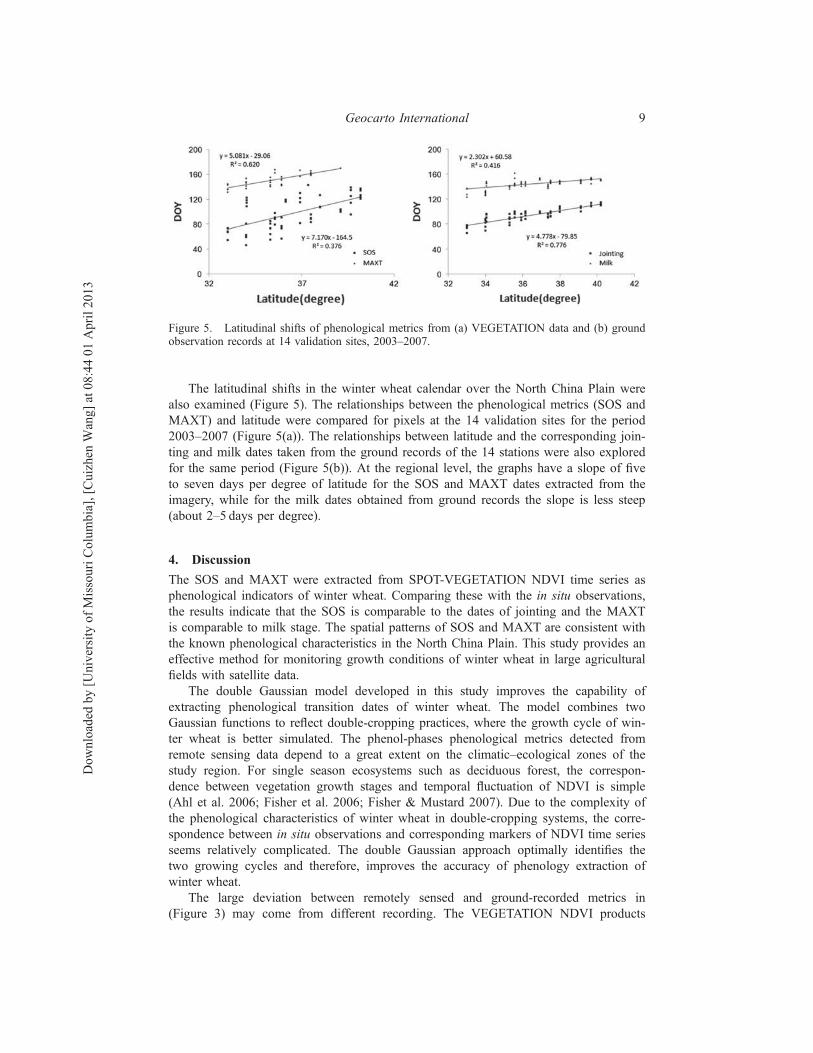
The latitudinal shifts in the winter wheat calendar over the North China Plain werealso examined (Figure 5). The relationships between the phenological metrics (SOS andMAXT) and latitude were compared for pixels at the 14 validation sites for the period2003–2007 (Figure 5(a)). The relationships between latitude and the corresponding join-ting and milk dates taken from the ground records of the 14 stations were also exploredfor the same period (Figure 5(b)). At the regional level, the graphs have a slope of fiveto seven days per degree of latitude for the SOS and MAXT dates extracted from theimagery, while for the milk dates obtained from ground records the slope is less steep(about 2–5 days per degree).
4. Discussion
The SOS and MAXT were extracted from SPOT-VEGETATION NDVI time series asphenological indicators of winter wheat. Comparing these with the in situ observations,the results indicate that the SOS is comparable to the dates of jointing and the MAXTis comparable to milk stage. The spatial patterns of SOS and MAXT are consistent withthe known phenological characteristics in the North China Plain. This study provides aneffective method for monitoring growth conditions of winter wheat in large agriculturalfields with satellite data.
The double Gaussian model developed in this study improves the capability ofextracting phenological transition dates of winter wheat. The model combines twoGaussian functions to reflect double-cropping practices, where the growth cycle of win-ter wheat is better simulated. The phenol-phases phenological metrics detected fromremote sensing data depend to a great extent on the climatic–ecological zones of thestudy region. For single season ecosystems such as deciduous forest, the correspon-dence between vegetation growth stages and temporal fluctuation of NDVI is simple(Ahl et al. 2006; Fisher et al. 2006; Fisher & Mustard 2007). Due to the complexity ofthe phenological characteristics of winter wheat in double-cropping systems, the corre-spondence between in situ observations and corresponding markers of NDVI time seriesseems relatively complicated. The double Gaussian approach optimally identifies thetwo growing cycles and therefore, improves the accuracy of phenology extraction ofwinter wheat.
The large deviation between remotely sensed and ground-recorded metrics in(Figure 3) may come from different recording. The VEGETATION NDVI products
Figure 5. Latitudinal shifts of phenological metrics from (a) VEGETATION data and (b) groundobservation records at 14 validation sites, 2003–2007.
Geocarto International 9
Dow
nloa
ded
by [U
nive
rsity
of M
isso
uri C
olum
bia]
, [C
uizh
en W
ang]
at 0
8:44
01
Apr
il 20
13
contain land surface information at 1 km by 1 km resolution at ten-day intervals. Groundrecords at local stations, on the other hand, are the dates of occurrence of a limitednumber of phenological events at plot scales. Although closely related, these two typesof data could be different from each other in spatial and temporal dimensions. Specifi-cally, the greenup dates at stations are recorded as the dates when some plants areobserved in field to start growth while the majority of plants still appeared dormant. Inearly growing days, the plants are short and in recovery from winter dormancy. TheNDVI at this time is inevitably influenced by the soil background and surrounding veg-etation in the case of data with a 1 km by 1 km resolution. Through comparative analy-sis, the image-extracted SOS correlates well with the jointing stage instead of greenupfor winter wheat (Table 2). Instead, the SOST correlates better with the jointing stageand has a bias value of 3.2 days. A possible reason for the higher correlation betweenMAXT and milk than between SOS and jointing dates is the reduced background noisewhen plants reach peak growth.
The latitudinal shift observed in this study agrees with the results of past studies.Zhang et al. (2003) reported that the onset of greenness in both natural and cultivatedcroplands displayed a shift of around two days per latitude degree along a 40° to 45° Nlatitude transect in North America. Wang et al. (2011) also found that corn and soybeanfields in the US Midwest have a shift of two days per degree in their peak dates, whilepasturelands have a peak date shift of three days per degree. As shown in (Figure 5),the shift of SOS and MAXT may indicate that the remote sensing images captured thespatial heterogeneity of winter wheat phenology in the plain, such as the delay in thejointing stage along latitudinal transect that is related to climate variation in a largeregion. However, the relatively larger magnitude of the shift in remote sensing data canbe attributed to the uncertainties of phenological metrics estimation which might becaused by the mixed pixels that are common in km-resolution images, data noisetogether with the ten-day intervals of the time-series data.
This study demonstrates an efficient way to monitor large agricultural regions domi-nated by specific crops. In multi-crop agricultural lands, different phenological modelscan be established and integrated to extract phenological features for a specific crop forfurther investigation.
5. Conclusion
This study develops a double Gaussian model to fit the growth cycle of winter wheat indouble-cropping practices. With this approach, the SOS and time of maximum NDVI(MAXT) are extracted from a time series of SPOT-VEGETATION data in the NorthChina Plain. By comparing the results with the five-year phenological ground recordsof 14 validation sites, the SOS and MAXT derived from the satellite data were foundto be in close agreement with the jointing dates and milk-in-kernel dates, respectively,that were derived from the in situ observations. The spatial variations of winter wheatphenology are captured using the satellite data. This spatially explicit information couldbe used to assist crop monitoring in a large region.
AcknowledgementsThe authors are grateful to the China Meteorological Administration for providing thephenological observation data. We also thank Dr Per Jönsson, Malmo University, and Dr LarsEklundh, Lund University, for their help with the TIMESAT software application. This research is
10 L. Lu et al.
Dow
nloa
ded
by [U
nive
rsity
of M
isso
uri C
olum
bia]
, [C
uizh
en W
ang]
at 0
8:44
01
Apr
il 20
13
supported by the Director Foundation of Center for Earth Observation and Digital Earth, ChineseAcademy of Sciences and the National Natural Science Foundation of China under grant no.41101393.
References
Ahl DE, Gower ST, Burrows SN, Shabanov NV, Myneni RB, Knyazikhin Y. 2006. Monitoringspring canopy phenology of a deciduous broadleaf forest using MODIS. Remote Sens Envi-ron. 104:88–95.
Bradley BA, Jacob RW, Hermance JF, Mustard JF. 2007. A curve fitting procedure to deriveinter-annual phenologies from time series of noisy satellite NDVI data. Remote Sens Environ.106:137–145.
Chen J, Jönsson P, Tamura M, Gu Z, Matsushita B, Eklundh L. 2004. A simple method forreconstructing a high-quality NDVI time-series data set based on the Savitzky–Golay filter.Remote Sens Environ. 91:332–344.
Delbart N, Le Toan T, Kergoat L, Fedotova V. 2006. Remote sensing of spring phenology in bor-eal regions: a free of snow-effect method using NOAA-AVHRR and SPOT-VGT data (1982–2004). Remote Sens Environ. 101:52–62.
Fisher JI, Mustard JF. 2007. Cross-scalar satellite phenology from ground, Landsat, and MODISdata. Remote Sens Environ. 109:261–273.
Fisher JI, Mustard JF, Vadeboncoeur MA. 2006. Green leaf phenology at Landsat resolution: scal-ing from the field to the satellite. Remote Sens Environ. 100:265–279.
Heumann BW, Seaquist JW, Eklundh L, Jönsson P. 2007. AVHRR derived phenological changein the Sahel and Soudan, Africa, 1982–2005. Remote Sens Environ. 108:385–392.
Holben BN. 1986. Characteristics of maximum-value composite images from temporal AVHRRdata. Int J Remote Sens. 7:1417–1434.
Huete A, Didan K, Miura T, Rodriguez EP, Gao X, Ferreira LG. 2002. Overview of the radiometric andbiophysical performance of the MODIS vegetation indices. Remote Sens Environ. 83:195–213.
IPCC. 2007. Summary for policymakers. In: Climate Change 2007: The Physical Science Basis.Contribution of Working Group I to the Fourth Assessment Report of the IntergovernmentalPanel on Climate Change, Cambridge, United Kingdom and New York, NY, USA.
Jönsson P, Eklundh L. 2002. Seasonality extraction by function fitting to time-series of satellitesensor data. IEEE Trans Geosci Remote Sens. 40:1824–1832.
Jönsson P, Eklundh L. 2004. TIMESAT – a program for analyzing time-series of satellite sensordata. Comput Geosci. 30:833–845.
Justice CO, Townshend JRG, Holben BN, Tucker CJ. 1985. Analysis of the phenology of globalvegetation using meteorological satellite data. Int J Remote Sens. 6:1271–1318.
Kidwell KB. 1998. NOAA polar orbiter data user’s guide, US. Washington (DC): Department ofCommerce.
Levenberg K. 1944. A method for the solution of certain problems in least squares. Q. Appl.Math. 2:164–168.
Lloyd D. 1990. A phenological classification of terrestrial vegetation cover using shortwave vege-tation index imagery. Int. J. Remote Sens. 11:2269–2279.
Lu L, Guo H. 2009. Extraction method of winter wheat phenology from time series of SPOT/VEGETATION data (in Chinese). Trans. Chinese Soc. Agri. Eng.. 9:174–179.
Maisongrande P, Duchemin B, Dedieu G. 2004. VEGETATION/SPOT: an operational mission forthe Earth monitoring; presentation of new standard products. Int J Remote Sens. 25:9–14.
Marquardt DW. 1963. An algorithm for least-squares estimation of nonlinear parameters. SIAM JAppl Math. 11:431–441.
Menzel A, Sparks TH, Estrella N, Koch E, Aasa A, Ahas R, Alm-Kübler K, Bissolli P, Bras-lavská O, Briede A, et al. 2006. European phenological response to climate change matchesthe warming pattern. Glob Change Biol. 12:1969–1976.
Geocarto International 11
Dow
nloa
ded
by [U
nive
rsity
of M
isso
uri C
olum
bia]
, [C
uizh
en W
ang]
at 0
8:44
01
Apr
il 20
13
Moulin S, Kergoat L, Viovy N, Dedieu G. 1997. Global-scale assessment of vegetation phenologyusing NOAA/AVHRR satellite measurements. J. Clim, 10: 1154–1170.
Myneni RB, Keeling CD, Tucker CJ, Asrar G, Nemani RR. 1997. Increased plant growth in thenorthern high latitudes from 1981 to 1991. Nature. 386:698–702.
National Bureau of Statistics of China. 2011. China statistical yearbook 2011. Beijing: ChinaStatistics Press.
PRC [People’s Republic of China]. 2007. China’s national assessment report on climate change(in Chinese). Beijing: Science Publishing House.
Sadras VO, Monzon JP. 2006. Modelled wheat phenology captures rising temperature trends:shortened time to flowering and maturity in Australia and Argentina. Field Crops Res..99:136–146.
Savitzky A, Golay MJE. 1964. Smoothing and differentiation of data by simplified least squaresprocedures. Anal Chem. 36:1627–1639.
Schwartz MD. 1994. Monitoring global change with phenology: the case of the spring greenwave. Int J Biometeorol. 38:18–22.
Schwartz MD, Ahas R, Aasa A. 2006. Onset of spring starting earlier across the Northern Hemi-sphere. Glob Change Biol. 12:343–351.
Soudani K, Maire G, Dufrêne E, François C, Delpierre N, Ulrich E, Cecchini S. 2008. Evaluationof the onset of green-up in temperate deciduous broadleaf forests derived from Moderate Res-olution Imaging Spectroradiometer (MODIS) data. Remote Sens Environ. 112:643–2655.
Tottman DR, Makepeace RJ, Broad H. 1979. An explanation of the decimal code for the growthstages of cereals, with illustrations. Annals Appl Biol. 93:221–234.
Wang C, Fritschi FB, Stacey G, Yang Z. 2011. Phenology-based assessment of perennial energycrops in North American tallgrass prairie. Ann Assoc Am Geogr. 101:742–751.
Xin J, Yu Z, Driess PM. 2001. Monitoring phenological key stages of winter wheat with NOAANDVI data (in Chinese). J Remote Sens. 5:442–447.
Yan H, Xiao X, Huang H. 2010. Satellite observed crop calendar and its spatial-temporal character-istics in multiple cropping area of Huang-Huai-Hai Plain (in Chinese). Acta Ecologica Sinica.30:2416–2423.
Zhang XY, Friedl MA, Schaaf CB, Strahler AH, Hodges JCF, Gao F, Reed BC, Huete A. 2003.Monitoring vegetation phenology using MODIS. Remote Sens Environ. 84:471–475.
Zhang F, Wu B, Liu C, Luo Z. 2004. Methods of monitoring crop phonological stages using timeseries of vegetation indicator. Trans Chinese Soc Agri Eng. 20:155–159.
Zhang XY, Friedl MA, Schaaf CB. 2006. Global vegetation phenology from Moderate ResolutionImaging Spectroradiometer (MODIS): evaluation of global patterns and comparison within situ measurements. J Geo Res G: Biogeosci. 111(G04017).