DETECTION AND CLASSIFICATION OF BRIDGE CROSSING EVENTS WITHGROUND-BASED INTERFEROMETRIC RADAR DATA AND MACHINE LEARNING
APPROACHES
M. Arnolda, , S. Kellerb
a ci-tec GmbH, 76137 Karlsruhe, Germany - [email protected] Institute of Photogrammetry and Remote Sensing, Karlsruhe Institute of Technology, 76131 Karlsruhe, Germany -
In this paper, we investigate the potential of detecting and classifying vehicle crossings (events) on bridges with ground-based interfero-metric radar (GBR) data and machine learning (ML) approaches. The GBR data and image data recorded by a unmanned aerial vehicle,used as ground truth, have been measured during field campaigns at three bridges in Germany non-invasively. Since traffic load of thebridges has taken place during the measurement, we have been able to monitor the bridge dynamics in terms of a vertical displacement.We introduce a methodological approach with three steps including preprocessing of the GBR data, feature extraction and well-chosenML models. The impact of the preprocessing approaches as well as of the selected features on the classification results is evaluated.In case of the distinction between event and no event, adaptive boosting with low-pass filtering achieves the best classification results.Regarding the distinction between different class types of vehicles, random forest performs best utilising low-pass filtered GBR data.Our results reveal the potential of the GBR data combined with the respective methodological approach to detect and to classify eventsunder real-world conditions. In conclusion, the preliminary results of this paper provide a basis for further improvements such asadvanced preprocessing of the GBR data to extracted additional features which then can be used as input for the ML models.
1. INTRODUCTION
Worldwide, the service life of newly constructed bridge infras-tructure is designed for several decades. In Germany, the targetedlifetime is about one hundred years. However, increasing trafficfrequency and vehicle loads may have a negative effect on thestructural integrity. For example, excitations due to crossing traf-fic may have higher amplitudes or may be qualitatively differentcompared to the considerations when planning the bridge. There-fore, a frequent monitoring is crucial for public safety.
Conventional systems used for structural health monitoring(SHM), e.g. strain gauges, require a permanent installation toan infrastructure such as a bridge. The installation process and along-term maintenance can be difficult for only remotely accessi-ble bridges. In addition, commonly used systems are often inva-sive meaning their installation introduces damage at the structure.Furthermore, analytical approaches of SHM, such as OperationalModal Analysis (OMA), investigate solely the response of thebridge based on, for example, the acceleration. In this case, how-ever, the cause of the acceleration is not considered explicitly dueto the difficulties of measuring the exact excitation. At the sametime, changes of the bridge’s behaviour and its dynamics can becaused by changes of the traffic volume itself (e.g. Magalhaes etal., 2012). Detecting changes of a bridge’s characteristics underdynamic conditions of traffic is an essential part of SHM. Alto-gether, there is a need for an innovative approach in SHM whichincludes non-invasive measurements of the dynamic behaviour ofthe bridge and which is able to detect and distinguish changes inthe resulting data either caused by traffic or the structure itself.
To achieve these objectives, a first approach is to extract vehi-cle crossings on the bridge based on the signal data so that thecausing excitations can be defined. In this contribution, we are
following this approach to detect vehicle crossings on a bridge.For this purpose, we rely on a ground-based interferometric radar(GBR) as a sensor recording the bridge dynamics stimulated byvehicles crossing the bridge. We use solely the GBR data com-bined with machine learning (ML) approaches to detect and clas-sify vehicle crossings. We avoid threshold-based methods, sincethey need adjustment for each structure, preventing a generali-sation. To evaluate our proposed approach and its ability in thecontext of SHM, we choose a dataset which we have recorded inthree real-world measurement campaigns at bridges in Germany.Among others, an important challenge arises from the excitationof the bridge caused by unspecified, random daily traffic. Themain contributions of this paper are:
• a detailed description of the measurement setup with theGBR sensor monitoring three bridges,
• a profound analysis of time-series data extracted from theGBR measurements to calculate the vertical displacementof the bridge caused by vehicle crossings,
• a schematic approach including all steps starting with thetime-series data, preprocessing and subsequent feature ex-traction,
• an appropriate ML framework with eight models applied to(1) detect and (2) classify vehicle crossings (events),
• and finally a comprehensive evaluation of the proposedmethodological approach according to the classification per-formance.
We give a short overview of related work regarding distinct ap-proaches in bridge monitoring, event detection and vehicle clas-sification in Section 2. In the following section, we describe themeasurement setup at three different bridges with a GBR sen-sor. Section 4 introduces the acquired GBR time-series data anddescribes the generation of bridge displacement data. Addition-
ISPRS Annals of the Photogrammetry, Remote Sensing and Spatial Information Sciences, Volume V-1-2020, 2020 XXIV ISPRS Congress (2020 edition)
ally, we present and analyse the vehicle crossing events. Sec-tion 5 contains the proposed methodological approach consistingof three steps: preprocessing, feature extraction, as well as MLmodels to detect and classify vehicle crossings. The results arepresented and discussed focusing on the feature importance ofthe ML models in Section 6. Finally, we conclude our studies inSection 7 with a brief summary and an outlook to further researchtopics.
2. RELATED WORK
Alternatively to acceleration-based or strain-based monitoring ofbridges (see e.g. Cho et al., 2010), the GBR-based measurementshave gained a growing reputation in structural health monitoring(SHM). This increasing interest mainly results from its simpleusage and the non-invasive measuring principle to recognise thevertical displacement of a bridge. Gentile and Bernardini (2010)introduces a new microwave radar-system (IBIS-S) and comparesits sensitivity to acceleration sensors. To increase the sensitivityof the GBR signal, so-called corner reflectors can be installedat the bridge. In general, the displacement sensitivity exceeds0.02 mm depending on the underlying measurement setup. TheIBIS-S is used to perform static and dynamic measurements on abridge near Florence, Italy in order to acquire its natural frequen-cies (Pieraccini et al., 2007). Furthermore, Hsu et al. (2016) carryout a long-term monitoring of two highway bridges in Taiwan.After measuring each bridge annually and over 5 to 6 years, onebridge has shown a change in its natural frequencies as well as aclear visual degradation. As an alternative measurement setup ofthe IBIS-S, Michel and Keller (2020) proposes and evaluates themirror mode during measurements at a bridge in Karlsruhe, Ger-many. This setup allows the usage of corner reflectors without theneed for a permanent installation of these reflectors directly at thebridge. A corner reflector is placed opposite the GBR beneath thebridge reflecting the beam which is scattered from the flat surfaceof the bridge underside back to the GBR.
In the context of vehicle classification, deep learning combinedwith data recorded by visual sensors is commonly used (Nguyenet al., 2018). Further sensors applied for event detection andclassification are strain gauge sensors. For example, Zhang etal. (2008) presents a strain-based method to classify vehicles infive different categories and estimates the speed of each vehicle.The sensors have been embedded below the surface of a stateroad in China. A support vector machine (SVM) is applied forthe classification tasks utilising the number of axes and the speedfunction as input features. Yan et al. (2008) exploits a principalcomponent analysis (PCA) on strain time-series data. A bridge-deck in the USA has been equipped with 16 gauges at both thetop and the bottom side of the panel. Additionally synchronisedvideo clips have been archived in order to correlate a portion ofthe signal to its corresponding vehicle. Based on the resultingPCA components, an artificial neural network (ANN) with twolayers is trained to classify five distinct vehicle classes. Duringtheir measurement campaign, Rajab et al. (2014) have installedmulti-element piezoelectric sensors beneath the surface of a road-way in the USA. Based on this data, they extract vehicle length,axle spacing and the number of tires as features for subsequentlythreshold-based classification with a overall accuracy of 86.9 %.
3. MEASUREMENT SETUP
To evaluate our approach for detection and classification of vehi-cle crossings on a bridge based on GBR measurement and ML,we rely on a dataset which has been recorded during several mea-surement campaigns in 2019 on three bridges in Germany. Since
real-world conditions are given at all three bridges, the possibilityto transfer the applied approach to further bridges is maintained.The measurement setups at all monitored bridges are describedin Section 3.1. Subsequently, we give a brief introduction of theGBR measurement principles (see section 3.2). A more detailedexplanation of the GBR measurement principles with respect tothe processing of the raw data is given at Coppi et al. (2010).
3.1 Measurements at Three Selected Bridges
Three selected German bridges are the centerpiece of the mea-surement campaigns. They have been monitored over severalhours at different days and, thus, cover a broad variance of envi-ronmental influences. We have equipped two of the three bridgeswith corner reflectors to gain a high signal-to-noise ratio (SNR)of the GBR data. Table 1 provides an overview of selected detailsof all three bridges.
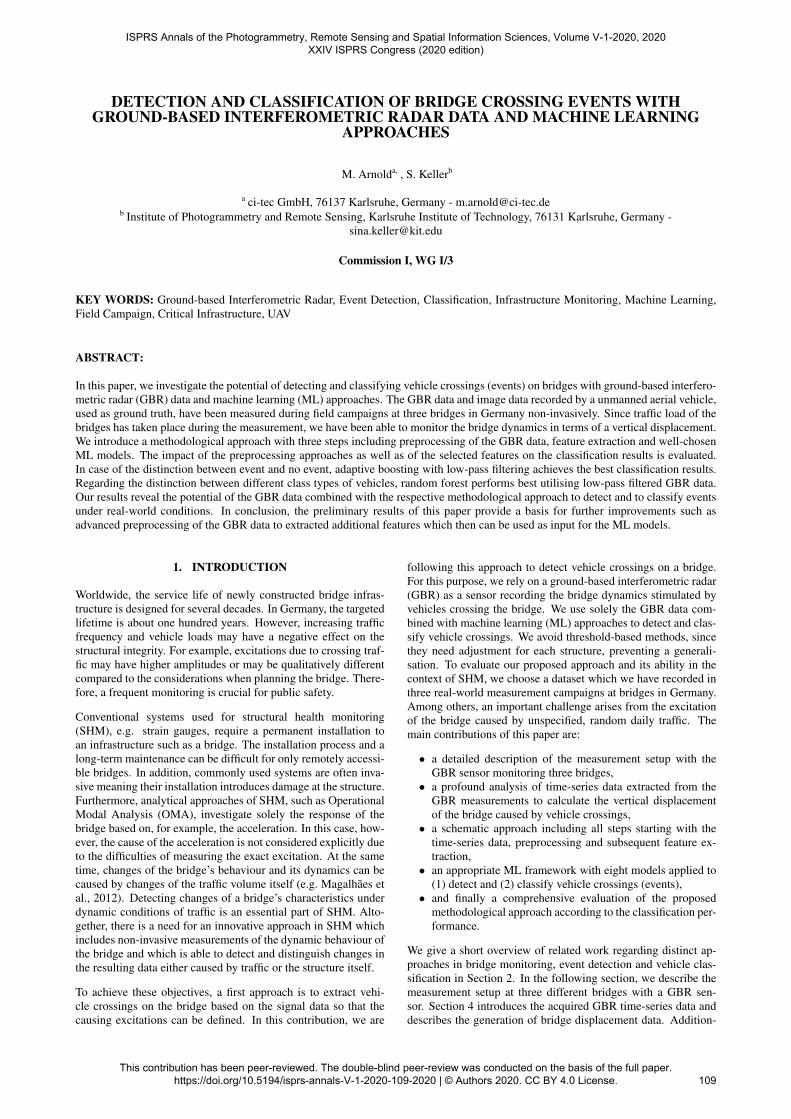
With respect to the vehicle crossings, we can divide the bridgesinto two groups. The vehicles crossing bridges A and B driveat a constant speed. In contrast, bridge C serves as entrance andexit to the state road on top of it. Therefore, vehicles will ac-celerate and decelerate while crossing. In our analysis, we focussolely on a single field of each bridge for reasons of comparabil-ity. Figure 1 shows the respective measurement setups at each ofthe three bridges from different perspectives. To explain the mea-suring principle of the GBR and to illustrate the GBR raw data,we use the bridge A in the following subsections as an example.
3.2 Measurements with the GBR
Two fundamental measurement principles are combined in theIBIS-S GBR to ensure the precise measurement of spatial dis-placements: frequency modulation and interferometry. By ap-plying frequency modulation, the GBR monitors several pointsin line of sight (LOS) which we refer to as range bins. With thespeed of light c = 3× 10⁸ m s−2 and a bandwidth B = 200 MHz,the spatial resolution ∆r is
∆r =c
2 ·B = 0.75m. (1)
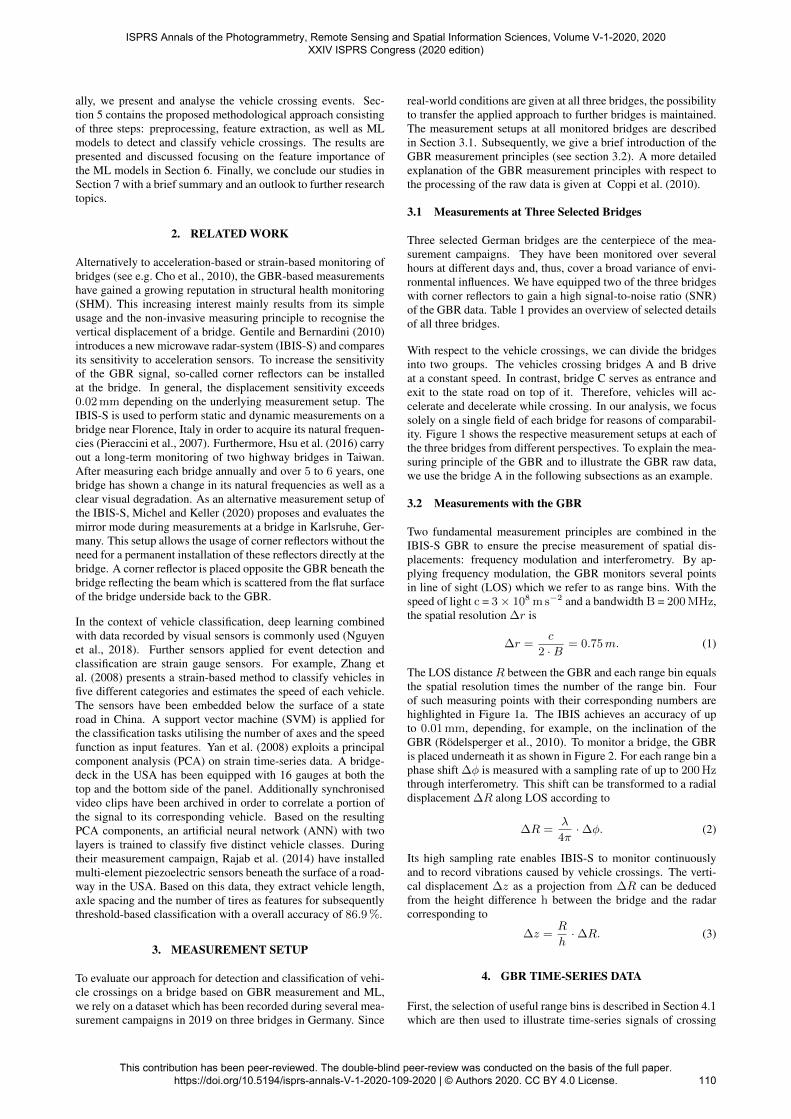
The LOS distanceR between the GBR and each range bin equalsthe spatial resolution times the number of the range bin. Fourof such measuring points with their corresponding numbers arehighlighted in Figure 1a. The IBIS achieves an accuracy of upto 0.01 mm, depending, for example, on the inclination of theGBR (Rodelsperger et al., 2010). To monitor a bridge, the GBRis placed underneath it as shown in Figure 2. For each range bin aphase shift ∆φ is measured with a sampling rate of up to 200 Hzthrough interferometry. This shift can be transformed to a radialdisplacement ∆R along LOS according to
∆R =λ
4π·∆φ. (2)
Its high sampling rate enables IBIS-S to monitor continuouslyand to record vibrations caused by vehicle crossings. The verti-cal displacement ∆z as a projection from ∆R can be deducedfrom the height difference h between the bridge and the radarcorresponding to
∆z =R
h·∆R. (3)
4. GBR TIME-SERIES DATA
First, the selection of useful range bins is described in Section 4.1which are then used to illustrate time-series signals of crossing
ISPRS Annals of the Photogrammetry, Remote Sensing and Spatial Information Sciences, Volume V-1-2020, 2020 XXIV ISPRS Congress (2020 edition)
Structure Type Fields Length Width Reflectors Lanes Natural Freq.
Bridge A Beam/plate mixing system 2 57.0 m 13.6 m Yes 2 3.66 HzBridge B Plate girder bridge/Girder Grid Bridge 1 26.36 m 11.69 m Yes 2 3.75 HzBridge C Plate girder bridge/Girder Grid Bridge 4 116.62 m 14.65 m No 2 3.42 Hz
(a) (b) (c)
Figure 1. (a) View of bridge A recorded by a unmanned aerial vehicle. The rectangle marks the GBR position and its inclination.Crosses represent points with a high SNR. (b) A side view of the measurement setup of bridge B. The GBR and two corner reflectorsare highlighted. (c) The GBR position at bridge C. No reflectors have been attached to the lower side of the bridge.
h
R
ΔRΔz
Figure 2. Schema of the measuring principle of the GBR exem-plary illustrated for bridge A. R is the distance in LOS betweeneach range bin and the GBR, h the height difference betweenthe GBR and the lower side of the bridge. ∆R represents themeasured displacement in LOS and ∆z is the respective verticalprojection.
events in Section 4.2. We refer to crossing events as vehicle cross-ings of the bridge. Second, we will define classes to distinguishbetween events (see Section 4.3).
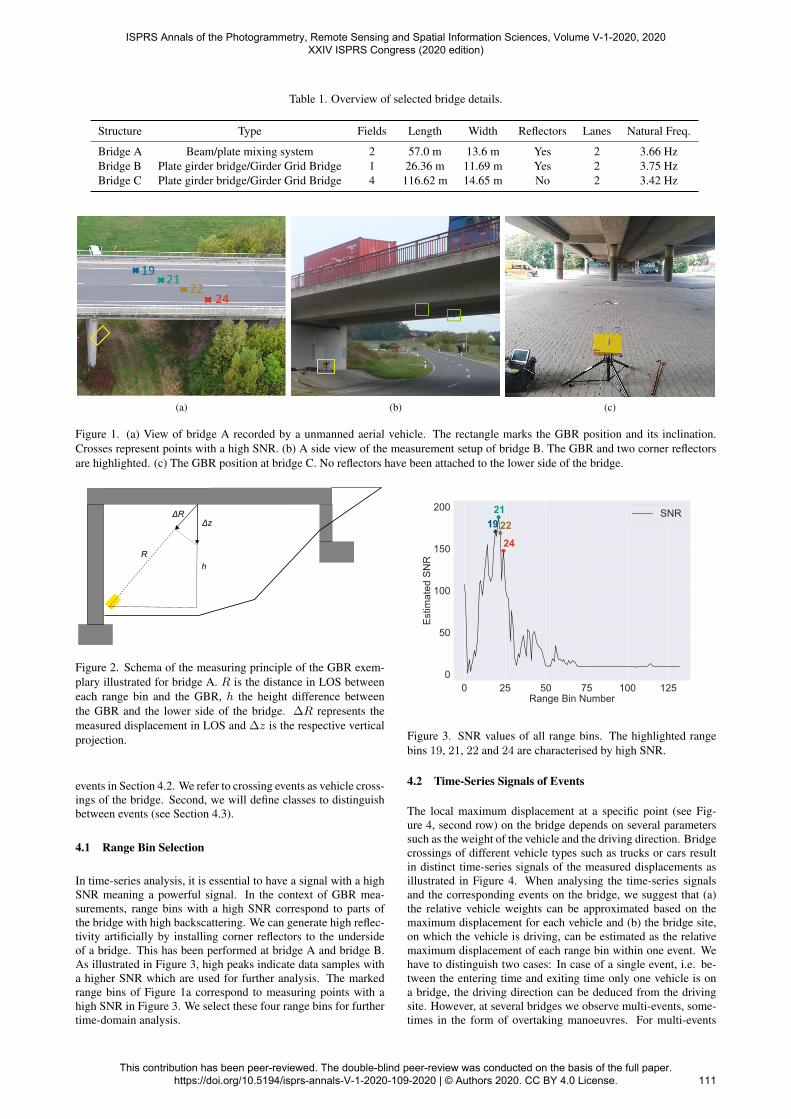
4.1 Range Bin Selection
In time-series analysis, it is essential to have a signal with a highSNR meaning a powerful signal. In the context of GBR mea-surements, range bins with a high SNR correspond to parts ofthe bridge with high backscattering. We can generate high reflec-tivity artificially by installing corner reflectors to the undersideof a bridge. This has been performed at bridge A and bridge B.As illustrated in Figure 3, high peaks indicate data samples witha higher SNR which are used for further analysis. The markedrange bins of Figure 1a correspond to measuring points with ahigh SNR in Figure 3. We select these four range bins for furthertime-domain analysis.
0 25 50 75 100 125Range Bin Number
0
50
100
150
200
Estim
ated
SN
R
1921
2224
SNR
Figure 3. SNR values of all range bins. The highlighted rangebins 19, 21, 22 and 24 are characterised by high SNR.
4.2 Time-Series Signals of Events
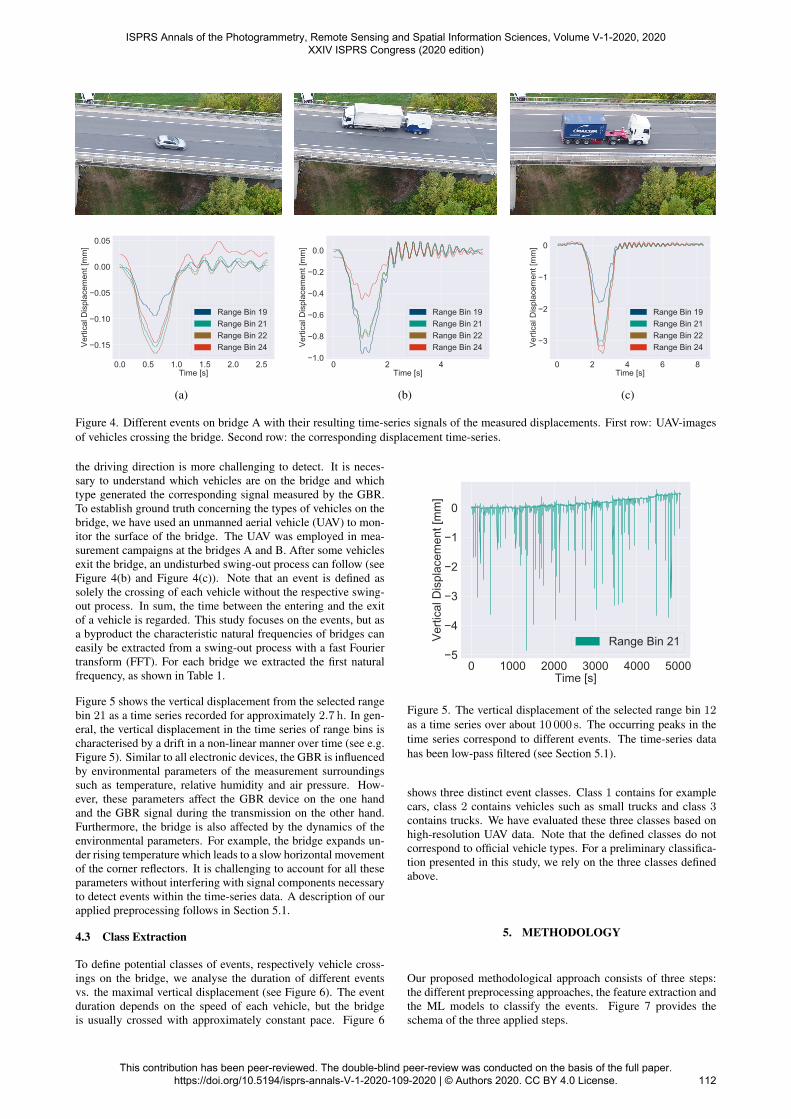
The local maximum displacement at a specific point (see Fig-ure 4, second row) on the bridge depends on several parameterssuch as the weight of the vehicle and the driving direction. Bridgecrossings of different vehicle types such as trucks or cars resultin distinct time-series signals of the measured displacements asillustrated in Figure 4. When analysing the time-series signalsand the corresponding events on the bridge, we suggest that (a)the relative vehicle weights can be approximated based on themaximum displacement for each vehicle and (b) the bridge site,on which the vehicle is driving, can be estimated as the relativemaximum displacement of each range bin within one event. Wehave to distinguish two cases: In case of a single event, i.e. be-tween the entering time and exiting time only one vehicle is ona bridge, the driving direction can be deduced from the drivingsite. However, at several bridges we observe multi-events, some-times in the form of overtaking manoeuvres. For multi-events
ISPRS Annals of the Photogrammetry, Remote Sensing and Spatial Information Sciences, Volume V-1-2020, 2020 XXIV ISPRS Congress (2020 edition)
Figure 4. Different events on bridge A with their resulting time-series signals of the measured displacements. First row: UAV-imagesof vehicles crossing the bridge. Second row: the corresponding displacement time-series.
the driving direction is more challenging to detect. It is neces-sary to understand which vehicles are on the bridge and whichtype generated the corresponding signal measured by the GBR.To establish ground truth concerning the types of vehicles on thebridge, we have used an unmanned aerial vehicle (UAV) to mon-itor the surface of the bridge. The UAV was employed in mea-surement campaigns at the bridges A and B. After some vehiclesexit the bridge, an undisturbed swing-out process can follow (seeFigure 4(b) and Figure 4(c)). Note that an event is defined assolely the crossing of each vehicle without the respective swing-out process. In sum, the time between the entering and the exitof a vehicle is regarded. This study focuses on the events, but asa byproduct the characteristic natural frequencies of bridges caneasily be extracted from a swing-out process with a fast Fouriertransform (FFT). For each bridge we extracted the first naturalfrequency, as shown in Table 1.
Figure 5 shows the vertical displacement from the selected rangebin 21 as a time series recorded for approximately 2.7 h. In gen-eral, the vertical displacement in the time series of range bins ischaracterised by a drift in a non-linear manner over time (see e.g.Figure 5). Similar to all electronic devices, the GBR is influencedby environmental parameters of the measurement surroundingssuch as temperature, relative humidity and air pressure. How-ever, these parameters affect the GBR device on the one handand the GBR signal during the transmission on the other hand.Furthermore, the bridge is also affected by the dynamics of theenvironmental parameters. For example, the bridge expands un-der rising temperature which leads to a slow horizontal movementof the corner reflectors. It is challenging to account for all theseparameters without interfering with signal components necessaryto detect events within the time-series data. A description of ourapplied preprocessing follows in Section 5.1.
4.3 Class Extraction
To define potential classes of events, respectively vehicle cross-ings on the bridge, we analyse the duration of different eventsvs. the maximal vertical displacement (see Figure 6). The eventduration depends on the speed of each vehicle, but the bridgeis usually crossed with approximately constant pace. Figure 6
0 1000 2000 3000 4000 5000Time [s]
5
4
3
2
1
0
Verti
cal D
ispl
acem
ent [
mm
]
Range Bin 21
Figure 5. The vertical displacement of the selected range bin 12as a time series over about 10 000 s. The occurring peaks in thetime series correspond to different events. The time-series datahas been low-pass filtered (see Section 5.1).
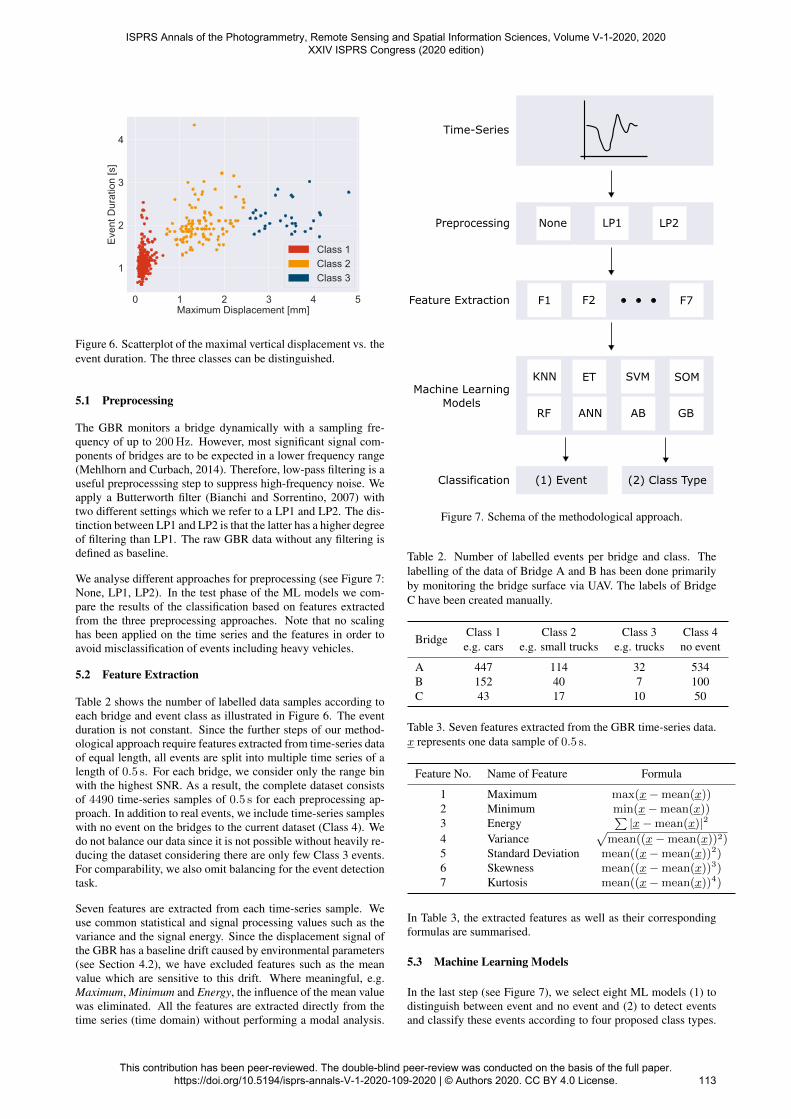
shows three distinct event classes. Class 1 contains for examplecars, class 2 contains vehicles such as small trucks and class 3contains trucks. We have evaluated these three classes based onhigh-resolution UAV data. Note that the defined classes do notcorrespond to official vehicle types. For a preliminary classifica-tion presented in this study, we rely on the three classes definedabove.
5. METHODOLOGY
Our proposed methodological approach consists of three steps:the different preprocessing approaches, the feature extraction andthe ML models to classify the events. Figure 7 provides theschema of the three applied steps.
ISPRS Annals of the Photogrammetry, Remote Sensing and Spatial Information Sciences, Volume V-1-2020, 2020 XXIV ISPRS Congress (2020 edition)
Figure 6. Scatterplot of the maximal vertical displacement vs. theevent duration. The three classes can be distinguished.
5.1 Preprocessing
The GBR monitors a bridge dynamically with a sampling fre-quency of up to 200 Hz. However, most significant signal com-ponents of bridges are to be expected in a lower frequency range(Mehlhorn and Curbach, 2014). Therefore, low-pass filtering is auseful preprocesssing step to suppress high-frequency noise. Weapply a Butterworth filter (Bianchi and Sorrentino, 2007) withtwo different settings which we refer to a LP1 and LP2. The dis-tinction between LP1 and LP2 is that the latter has a higher degreeof filtering than LP1. The raw GBR data without any filtering isdefined as baseline.
We analyse different approaches for preprocessing (see Figure 7:None, LP1, LP2). In the test phase of the ML models we com-pare the results of the classification based on features extractedfrom the three preprocessing approaches. Note that no scalinghas been applied on the time series and the features in order toavoid misclassification of events including heavy vehicles.
5.2 Feature Extraction
Table 2 shows the number of labelled data samples according toeach bridge and event class as illustrated in Figure 6. The eventduration is not constant. Since the further steps of our method-ological approach require features extracted from time-series dataof equal length, all events are split into multiple time series of alength of 0.5 s. For each bridge, we consider only the range binwith the highest SNR. As a result, the complete dataset consistsof 4490 time-series samples of 0.5 s for each preprocessing ap-proach. In addition to real events, we include time-series sampleswith no event on the bridges to the current dataset (Class 4). Wedo not balance our data since it is not possible without heavily re-ducing the dataset considering there are only few Class 3 events.For comparability, we also omit balancing for the event detectiontask.
Seven features are extracted from each time-series sample. Weuse common statistical and signal processing values such as thevariance and the signal energy. Since the displacement signal ofthe GBR has a baseline drift caused by environmental parameters(see Section 4.2), we have excluded features such as the meanvalue which are sensitive to this drift. Where meaningful, e.g.Maximum, Minimum and Energy, the influence of the mean valuewas eliminated. All the features are extracted directly from thetime series (time domain) without performing a modal analysis.
Figure 7. Schema of the methodological approach.
Table 2. Number of labelled events per bridge and class. Thelabelling of the data of Bridge A and B has been done primarilyby monitoring the bridge surface via UAV. The labels of BridgeC have been created manually.
BridgeClass 1 Class 2 Class 3 Class 4e.g. cars e.g. small trucks e.g. trucks no event
A 447 114 32 534B 152 40 7 100C 43 17 10 50
Table 3. Seven features extracted from the GBR time-series data.x represents one data sample of 0.5 s.
Feature No. Name of Feature Formula
1 Maximum max(x−mean(x))2 Minimum min(x−mean(x))3 Energy
∑|x−mean(x)|2
4 Variance√
mean((x−mean(x))2)5 Standard Deviation mean((x−mean(x))2)6 Skewness mean((x−mean(x))3)7 Kurtosis mean((x−mean(x))4)
In Table 3, the extracted features as well as their correspondingformulas are summarised.
5.3 Machine Learning Models
In the last step (see Figure 7), we select eight ML models (1) todistinguish between event and no event and (2) to detect eventsand classify these events according to four proposed class types.
ISPRS Annals of the Photogrammetry, Remote Sensing and Spatial Information Sciences, Volume V-1-2020, 2020 XXIV ISPRS Congress (2020 edition)
Table 4. Overview of the results of event vs. no event classification for the ML models under consideration. The classificationperformance is expressed by the overall accuracy (OA), precision (P) and recall (RC). The highlighted figures represent the bestclassification results for each preprocessing approach.
ModelBaseline LP1 LP2
OA P RC OA P RC OA P RCin % in % in % in % in % in % in % in % in %
We apply the following ML-Models for the classification task: k-nearest-neighbours1 (KNN), extremely randomised trees1 (ET),support vector machines1 (SVM), self-organising maps2 (SOM),random forest1 (RF), artificial neural-network1 (ANN), adaptiveboosting1 (AB) and gradient boosting1 (GB).
Before the training the complete dataset is randomly split into atraining subset and test subset in the ration 80:20. All selectedML models are trained on the training subset using the extractedfeatures as input and the class labels as target label. The hyper-parameters for each model are found using grid search. Note thatonly the SOM performs the training phase unsupervised while allother models are supervised learners. For details on the SOMspecifications see Riese et al. (2019).
During the subsequent test phase, the trained classification mod-els classify (1) the events meaning event vs. no event as wellas (2) the four classes based on the extracted features of the testsubset. The predicted classes are compared to the labelled val-ues. The classification performance is expressed by the overallaccuracy (OA), precision (P) and recall (RC). Ensemble modelssuch as ET and AB provide the feature importance of the inputfeatures as further information of the classification task.
6. RESULTS AND DISCUSSION
The main objective of this study is to evaluate the potential ofML models to detect and classify events based on GBR data frombridge monitoring. Such events are, for example, vehicle cross-ings on the bridge.
Table 4 shows the results for the event vs. no event classifica-tion task of the selected ML models and the three preprocessingapproaches. When comparing the baseline, i.e. no applied pre-processing and hence more high frequency noise, to the LP1 andLP2 filtered preprocessing approach, we obtain a better classi-fication performance in terms of OA. By applying the two low-pass filters as preprocessing, the eight ML models perform differ-ently. Within the ensemble methods, ET, for example, achievesthe highest OA for the unfiltered input data. The filtered inputdata leads to a lower OA. In contrast, RF performs the best withthe most filtered input data (OA of 83.2 %) as well as AB with anOA of 83.8 %. With focus on P and RC, both measures are lowdespite OAs over 70 %. The reasons for this is the unbalancedinput data (see Section 5.2).
1scikit-learn2Implementation from Riese (2019)
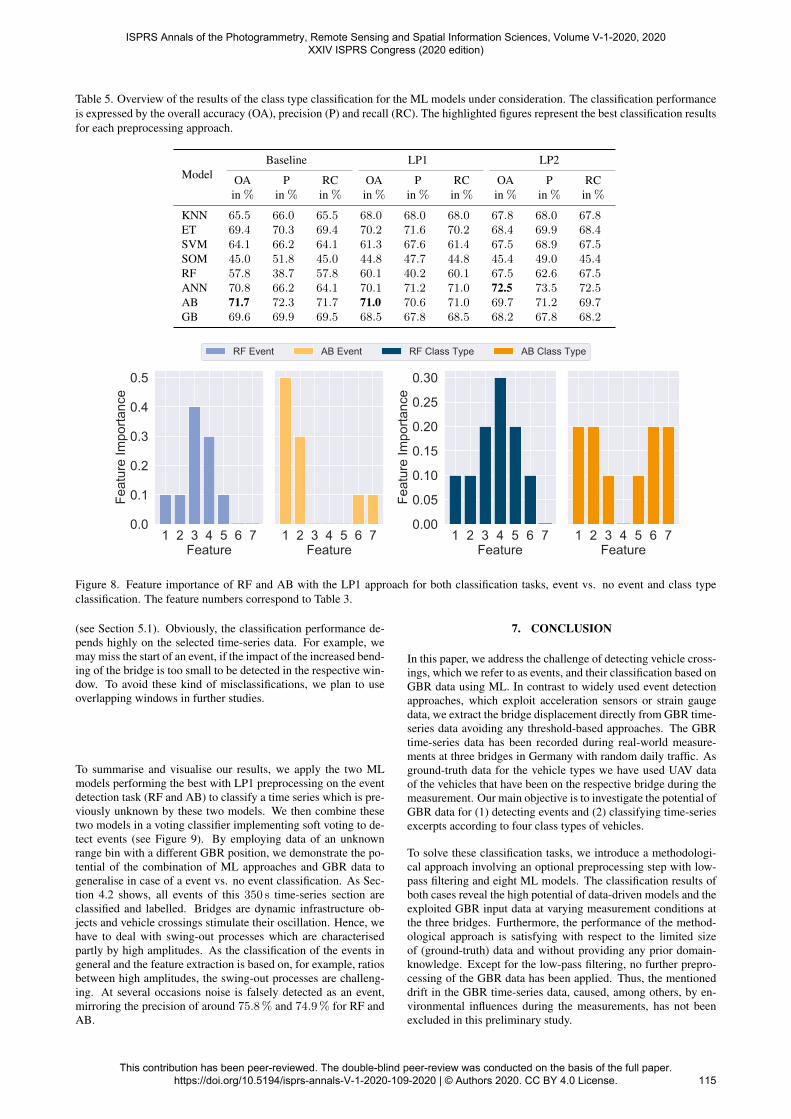
The classification results of the class type classification are simi-lar to the results of the event vs. no event classification. For LP1vs. LP2 half of the ML models achieve higher OA with the LP2preprocessing approach (see Table 5). As the class type classifi-cation is a more sophisticated task than the distinction betweenevent and no event, high-frequency noise has a more negativeeffect on the classification performance (see Table 5, Baselinecolumns). ANN trained on the LP2-filtered data has the highestOA of 77.5 %. With the LP1 filtered data, AB classifies the classtypes best. Although with LP1 RF is the best ML classifier forthe event vs. no event classification, it performs poorly in the taskof distinguishing several vehicle classes based on the same data.Since the difference in OA between LP1 and LP2 event detectionfor RF and AB is only small, we will use LP1 in the remainder inorder to avoid suppressing potential significant bridge deforma-tions.
Figure 8 shows the relative feature importance of the input fea-tures (see Table 3) of the LP1 preprocessing approach providedby the ensemble models, RF and AB. We select these two MLmodels since RF is the best ML model to detect events with LP1preprocessing and AB is the best ML model to classify class typeswith the LP1 preprocessing. As for the differences in the classifi-cation performance of RF and AB, the latter has a balanced classi-fication performance for the two underlying tasks, while RF has asignificant lower OA for LP1 class type classification. When onlyfocusing on the features which are important for both classifica-tion tasks, RF priors the features energy, variance and standarddeviation in this order. However, AB either omits all three fea-tures or rates them low. Especially the relative weighting of thevariance shows strong deviations within both models. This find-ing suggests that the feature variance can be useful as an indicatorfor event detection (event vs. no event) but it can be omitted forthe decision of the class type. We can observe, that the featurekurtosis is dropped by RF completely as for AB, it is an impor-tant feature for the class type classification.
In sum, the classification performance of the ML models is sat-isfying. The best classification performance independent of theclassification tasks is an OA of 83.8 %. We state that for any clas-sification improvement, the selection of the class types dependingon the vehicles needs to be enhanced. In addition, we cannot cre-ate further features out of the GBR data due to the included drift.Thus, we need to apply advanced preprocessing approaches toeliminate this drift and to extract more potential features. Alsonote that the impact of further features in the ML classificationtasks needs to be evaluated with respect to each model. To al-low for an unknown weight range, we have omitted data scalingwhich can be another factor influencing the prediction accuracy
ISPRS Annals of the Photogrammetry, Remote Sensing and Spatial Information Sciences, Volume V-1-2020, 2020 XXIV ISPRS Congress (2020 edition)
Table 5. Overview of the results of the class type classification for the ML models under consideration. The classification performanceis expressed by the overall accuracy (OA), precision (P) and recall (RC). The highlighted figures represent the best classification resultsfor each preprocessing approach.
ModelBaseline LP1 LP2
OA P RC OA P RC OA P RCin % in % in % in % in % in % in % in % in %
Figure 8. Feature importance of RF and AB with the LP1 approach for both classification tasks, event vs. no event and class typeclassification. The feature numbers correspond to Table 3.
(see Section 5.1). Obviously, the classification performance de-pends highly on the selected time-series data. For example, wemay miss the start of an event, if the impact of the increased bend-ing of the bridge is too small to be detected in the respective win-dow. To avoid these kind of misclassifications, we plan to useoverlapping windows in further studies.
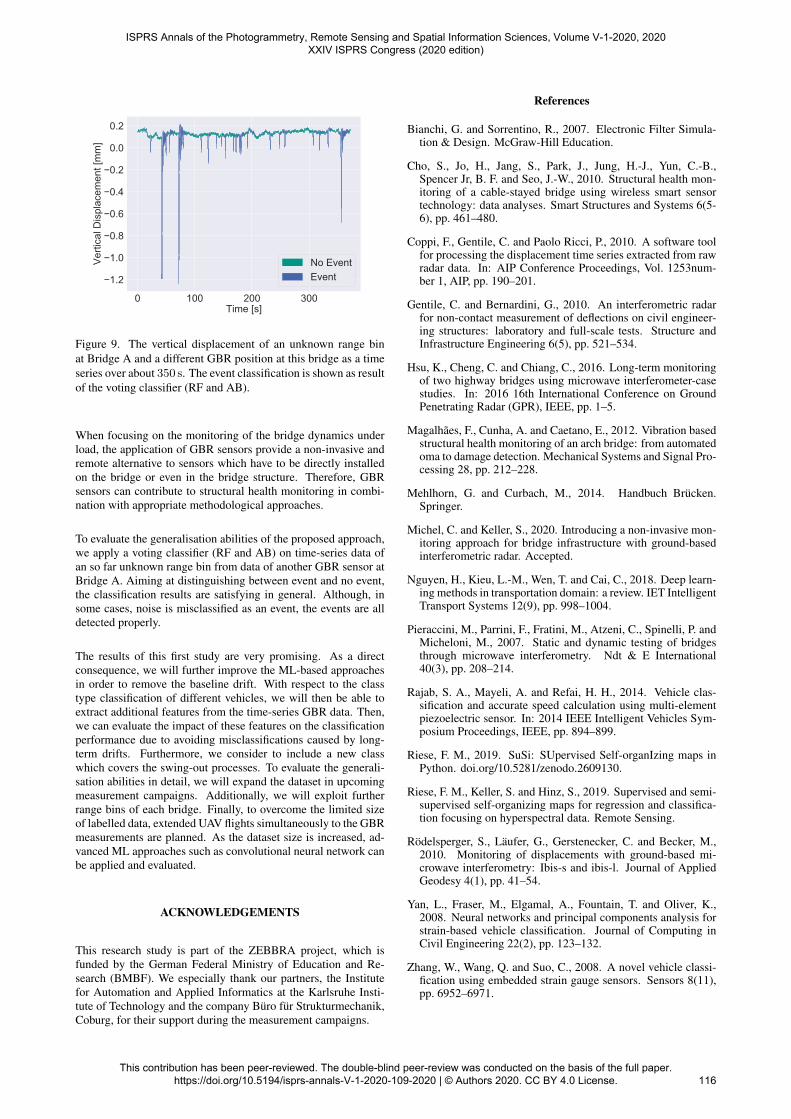
To summarise and visualise our results, we apply the two MLmodels performing the best with LP1 preprocessing on the eventdetection task (RF and AB) to classify a time series which is pre-viously unknown by these two models. We then combine thesetwo models in a voting classifier implementing soft voting to de-tect events (see Figure 9). By employing data of an unknownrange bin with a different GBR position, we demonstrate the po-tential of the combination of ML approaches and GBR data togeneralise in case of a event vs. no event classification. As Sec-tion 4.2 shows, all events of this 350 s time-series section areclassified and labelled. Bridges are dynamic infrastructure ob-jects and vehicle crossings stimulate their oscillation. Hence, wehave to deal with swing-out processes which are characterisedpartly by high amplitudes. As the classification of the events ingeneral and the feature extraction is based on, for example, ratiosbetween high amplitudes, the swing-out processes are challeng-ing. At several occasions noise is falsely detected as an event,mirroring the precision of around 75.8 % and 74.9 % for RF andAB.
7. CONCLUSION
In this paper, we address the challenge of detecting vehicle cross-ings, which we refer to as events, and their classification based onGBR data using ML. In contrast to widely used event detectionapproaches, which exploit acceleration sensors or strain gaugedata, we extract the bridge displacement directly from GBR time-series data avoiding any threshold-based approaches. The GBRtime-series data has been recorded during real-world measure-ments at three bridges in Germany with random daily traffic. Asground-truth data for the vehicle types we have used UAV dataof the vehicles that have been on the respective bridge during themeasurement. Our main objective is to investigate the potential ofGBR data for (1) detecting events and (2) classifying time-seriesexcerpts according to four class types of vehicles.
To solve these classification tasks, we introduce a methodologi-cal approach involving an optional preprocessing step with low-pass filtering and eight ML models. The classification results ofboth cases reveal the high potential of data-driven models and theexploited GBR input data at varying measurement conditions atthe three bridges. Furthermore, the performance of the method-ological approach is satisfying with respect to the limited sizeof (ground-truth) data and without providing any prior domain-knowledge. Except for the low-pass filtering, no further prepro-cessing of the GBR data has been applied. Thus, the mentioneddrift in the GBR time-series data, caused, among others, by en-vironmental influences during the measurements, has not beenexcluded in this preliminary study.
ISPRS Annals of the Photogrammetry, Remote Sensing and Spatial Information Sciences, Volume V-1-2020, 2020 XXIV ISPRS Congress (2020 edition)
Figure 9. The vertical displacement of an unknown range binat Bridge A and a different GBR position at this bridge as a timeseries over about 350 s. The event classification is shown as resultof the voting classifier (RF and AB).
When focusing on the monitoring of the bridge dynamics underload, the application of GBR sensors provide a non-invasive andremote alternative to sensors which have to be directly installedon the bridge or even in the bridge structure. Therefore, GBRsensors can contribute to structural health monitoring in combi-nation with appropriate methodological approaches.
To evaluate the generalisation abilities of the proposed approach,we apply a voting classifier (RF and AB) on time-series data ofan so far unknown range bin from data of another GBR sensor atBridge A. Aiming at distinguishing between event and no event,the classification results are satisfying in general. Although, insome cases, noise is misclassified as an event, the events are alldetected properly.
The results of this first study are very promising. As a directconsequence, we will further improve the ML-based approachesin order to remove the baseline drift. With respect to the classtype classification of different vehicles, we will then be able toextract additional features from the time-series GBR data. Then,we can evaluate the impact of these features on the classificationperformance due to avoiding misclassifications caused by long-term drifts. Furthermore, we consider to include a new classwhich covers the swing-out processes. To evaluate the generali-sation abilities in detail, we will expand the dataset in upcomingmeasurement campaigns. Additionally, we will exploit furtherrange bins of each bridge. Finally, to overcome the limited sizeof labelled data, extended UAV flights simultaneously to the GBRmeasurements are planned. As the dataset size is increased, ad-vanced ML approaches such as convolutional neural network canbe applied and evaluated.
ACKNOWLEDGEMENTS
This research study is part of the ZEBBRA project, which isfunded by the German Federal Ministry of Education and Re-search (BMBF). We especially thank our partners, the Institutefor Automation and Applied Informatics at the Karlsruhe Insti-tute of Technology and the company Buro fur Strukturmechanik,Coburg, for their support during the measurement campaigns.
References
Bianchi, G. and Sorrentino, R., 2007. Electronic Filter Simula-tion & Design. McGraw-Hill Education.
Cho, S., Jo, H., Jang, S., Park, J., Jung, H.-J., Yun, C.-B.,Spencer Jr, B. F. and Seo, J.-W., 2010. Structural health mon-itoring of a cable-stayed bridge using wireless smart sensortechnology: data analyses. Smart Structures and Systems 6(5-6), pp. 461–480.
Coppi, F., Gentile, C. and Paolo Ricci, P., 2010. A software toolfor processing the displacement time series extracted from rawradar data. In: AIP Conference Proceedings, Vol. 1253num-ber 1, AIP, pp. 190–201.
Gentile, C. and Bernardini, G., 2010. An interferometric radarfor non-contact measurement of deflections on civil engineer-ing structures: laboratory and full-scale tests. Structure andInfrastructure Engineering 6(5), pp. 521–534.
Hsu, K., Cheng, C. and Chiang, C., 2016. Long-term monitoringof two highway bridges using microwave interferometer-casestudies. In: 2016 16th International Conference on GroundPenetrating Radar (GPR), IEEE, pp. 1–5.
Magalhaes, F., Cunha, A. and Caetano, E., 2012. Vibration basedstructural health monitoring of an arch bridge: from automatedoma to damage detection. Mechanical Systems and Signal Pro-cessing 28, pp. 212–228.
Mehlhorn, G. and Curbach, M., 2014. Handbuch Brucken.Springer.
Michel, C. and Keller, S., 2020. Introducing a non-invasive mon-itoring approach for bridge infrastructure with ground-basedinterferometric radar. Accepted.
Nguyen, H., Kieu, L.-M., Wen, T. and Cai, C., 2018. Deep learn-ing methods in transportation domain: a review. IET IntelligentTransport Systems 12(9), pp. 998–1004.
Pieraccini, M., Parrini, F., Fratini, M., Atzeni, C., Spinelli, P. andMicheloni, M., 2007. Static and dynamic testing of bridgesthrough microwave interferometry. Ndt & E International40(3), pp. 208–214.
Rajab, S. A., Mayeli, A. and Refai, H. H., 2014. Vehicle clas-sification and accurate speed calculation using multi-elementpiezoelectric sensor. In: 2014 IEEE Intelligent Vehicles Sym-posium Proceedings, IEEE, pp. 894–899.
Riese, F. M., 2019. SuSi: SUpervised Self-organIzing maps inPython. doi.org/10.5281/zenodo.2609130.
Riese, F. M., Keller, S. and Hinz, S., 2019. Supervised and semi-supervised self-organizing maps for regression and classifica-tion focusing on hyperspectral data. Remote Sensing.
Rodelsperger, S., Laufer, G., Gerstenecker, C. and Becker, M.,2010. Monitoring of displacements with ground-based mi-crowave interferometry: Ibis-s and ibis-l. Journal of AppliedGeodesy 4(1), pp. 41–54.
Yan, L., Fraser, M., Elgamal, A., Fountain, T. and Oliver, K.,2008. Neural networks and principal components analysis forstrain-based vehicle classification. Journal of Computing inCivil Engineering 22(2), pp. 123–132.
Zhang, W., Wang, Q. and Suo, C., 2008. A novel vehicle classi-fication using embedded strain gauge sensors. Sensors 8(11),pp. 6952–6971.
ISPRS Annals of the Photogrammetry, Remote Sensing and Spatial Information Sciences, Volume V-1-2020, 2020 XXIV ISPRS Congress (2020 edition)