Brady, T., S. Cardimona and N. Anderson, "Detection and Delineation of Underground Fuel Storage Tanks and Associated Utility Lines Using Electromagnetic Induction and Ground Penetrating Radar Methods," International Conference on the Application of Geophysical Technologies to Planning, Design, Construction, and Maintenance of Transportation Facilities, St. Louis, MO, in press, 2000. 1 Detection and Delineation of Underground Fuel Storage Tanks and Associated Utility Lines Using Electromagnetic Induction and Ground Penetrating Radar Methods Thomas Brady*^, Steve Cardimona*, and Neil Anderson* *Department of Geology and Geophysics, University of Missouri–Rolla, Rolla, MO, 65401; [email protected]^Now at Veritas Geophysical Services, Houston, Texas ABSTRACT The proposed expansion of selected highways in Missouri required several gas stations to be demolished. During demolition of a gas station property, damage can occur to the underground fuel storage tanks and associated utility lines. Noninvasive mapping of these features prior to excavation can greatly reduce problems associated with unexpected tank discovery. In this study, nonintrusive geophysical methods were used to map the underground fuel storage tanks and associated utility lines. The application of geophysical tools ensured the detection and delineation of the underground fuel storage tanks using noninvasive, nondestructive, and time efficient methods. A variety of geophysical methods was considered. To accomplish the goals of the project in a time efficient manner without compromising resolution, the electromagnetic induction and ground penetrating radar techniques were chosen. The complementary use of ground penetrating radar and electromagnetic methods increased the likelihood of detecting subsurface anomalies. The locations of the existing tanks and associated utility lines can be interpreted in both ground penetrating radar profiles and contoured electromagnetic induction maps. Electromagnetic induction maps provided an excellent cost effective initial survey for the detection of the underground storage tanks. Ground penetrating radar proved important for the accurate delineation of these tanks. The integrated use of ground penetrating radar and electromagnetic induction methods allowed us to create a map of exact tank locations at each site in this study. INTRODUCTION The locations of underground fuel storage tanks on gas station properties are not always accurately known. This leads to problems during excavation or demolition of the gas station property. For example, if a tank is unexpectedly encountered and ruptured, hydrocarbon contamination of the ground and ground water can occur. Recently, proposed highway expansion in Missouri has necessitated identifying the location of the underground fuel storage tanks to aid in the demolition of the gas station structures. In an effort to ensure that any abandoned tanks were not unexpectedly encountered, the geophysics group at the University of Missouri–Rolla was asked to acquire geophysical data at the sites with a view to mapping the location of the tanks. The primary objective of the project was to detect and delineate the underground fuel storage tanks and associated utility lines using cost effective geophysical techniques that were both nondestructive and noninvasive. This paper summarizes the data acquisition and interpretation from two sites. The geophysical techniques used in the detection and delineation of the underground fuel storage tanks are employed to guide excavation. Geophysical methods are especially needed where the existence of the tanks is unknown in order to avoid puncturing the tanks or piping which could cause contamination of the soils as well as to avoid delays associated with tank discovery during highway construction.
Transcript
Brady, T., S. Cardimona and N. Anderson, "Detection and Delineation of Underground Fuel Storage Tanks and Associated Utility Lines Using Electromagnetic Induction and Ground Penetrating Radar Methods," International Conference on the Application of Geophysical Technologies to Planning, Design, Construction, and Maintenance of Transportation Facilities, St. Louis, MO, in press, 2000.
1
Detection and Delineation of Underground Fuel Storage Tanks and Associated Utility Lines Using Electromagnetic Induction and Ground Penetrating Radar
Methods
Thomas Brady*^, Steve Cardimona*, and Neil Anderson* *Department of Geology and Geophysics, University of Missouri–Rolla,
The proposed expansion of selected highways in Missouri required several gas stations to be
demolished. During demolition of a gas station property, damage can occur to the underground fuel storage tanks and associated utility lines. Noninvasive mapping of these features prior to excavation can greatly reduce problems associated with unexpected tank discovery.
In this study, nonintrusive geophysical methods were used to map the underground fuel storage tanks and associated utility lines. The application of geophysical tools ensured the detection and delineation of the underground fuel storage tanks using noninvasive, nondestructive, and time efficient methods. A variety of geophysical methods was considered. To accomplish the goals of the project in a time efficient manner without compromising resolution, the electromagnetic induction and ground penetrating radar techniques were chosen. The complementary use of ground penetrating radar and electromagnetic methods increased the likelihood of detecting subsurface anomalies.
The locations of the existing tanks and associated utility lines can be interpreted in both ground penetrating radar profiles and contoured electromagnetic induction maps. Electromagnetic induction maps provided an excellent cost effective initial survey for the detection of the underground storage tanks. Ground penetrating radar proved important for the accurate delineation of these tanks. The integrated use of ground penetrating radar and electromagnetic induction methods allowed us to create a map of exact tank locations at each site in this study.
INTRODUCTION
The locations of underground fuel storage tanks on gas station properties are not always accurately known. This leads to problems during excavation or demolition of the gas station property. For example, if a tank is unexpectedly encountered and ruptured, hydrocarbon contamination of the ground and ground water can occur.
Recently, proposed highway expansion in Missouri has necessitated identifying the location of the underground fuel storage tanks to aid in the demolition of the gas station structures. In an effort to ensure that any abandoned tanks were not unexpectedly encountered, the geophysics group at the University of Missouri–Rolla was asked to acquire geophysical data at the sites with a view to mapping the location of the tanks. The primary objective of the project was to detect and delineate the underground fuel storage tanks and associated utility lines using cost effective geophysical techniques that were both nondestructive and noninvasive.
This paper summarizes the data acquisition and interpretation from two sites. The geophysical techniques used in the detection and delineation of the underground fuel storage tanks are employed to guide excavation. Geophysical methods are especially needed where the existence of the tanks is unknown in order to avoid puncturing the tanks or piping which could cause contamination of the soils as well as to avoid delays associated with tank discovery during highway construction.
Brady, T., S. Cardimona and N. Anderson, "Detection and Delineation of Underground Fuel Storage Tanks and Associated Utility Lines Using Electromagnetic Induction and Ground Penetrating Radar Methods," International Conference on the Application of Geophysical Technologies to Planning, Design, Construction, and Maintenance of Transportation Facilities, St. Louis, MO, in press, 2000.
2
SITE LOCATION AND SURVEY DESIGN Fastop Gas Station
The Fastop Gas station is located at the intersection of Highways 291 and 150 in Lee’s Summit, MO (Figure 1). The Fastop Gas Station has four areas where the nature of the underground fuel storage tanks is unknown. These four areas include an active tank farm, two suspect tank farms, and a former tank farm. The active tank farm includes three underground storage tanks. There are two locations where the existence of tanks is unknown, termed suspect tanks. The former tank farm location was investigated to determine the ability of the electromagnetic induction and ground penetrating radar equipment to detect the infill. After the tank farm was removed, foreign soil was used to fill in the excavated area.
The geophysical survey for the Fastop area was separated into ten sections to increase the speed of data collection and minimize data size to increase processing efficiency (Figure 1). The important areas include Area A (suspect tanks and utility lines), Area E (suspect tanks), Area F (former tank farm), and Area G (active tank farm).
Figure 1: Fastop Gas Station property including active and suspect tank farms, and showing GPR line locations A-A’ and B-B’. Letters A-J designate sub-sections of the complete survey.
Brady, T., S. Cardimona and N. Anderson, "Detection and Delineation of Underground Fuel Storage Tanks and Associated Utility Lines Using Electromagnetic Induction and Ground Penetrating Radar Methods," International Conference on the Application of Geophysical Technologies to Planning, Design, Construction, and Maintenance of Transportation Facilities, St. Louis, MO, in press, 2000.
3
Simspon Oil Service Station
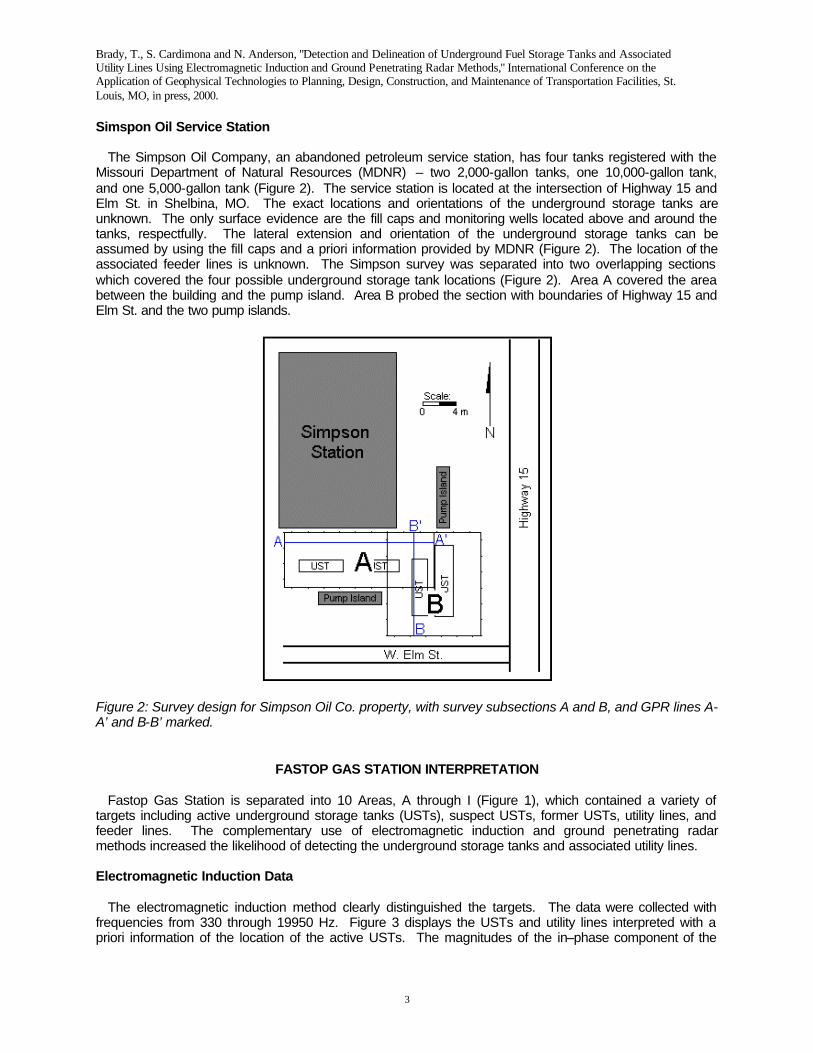
The Simpson Oil Company, an abandoned petroleum service station, has four tanks registered with the Missouri Department of Natural Resources (MDNR) – two 2,000-gallon tanks, one 10,000-gallon tank, and one 5,000-gallon tank (Figure 2). The service station is located at the intersection of Highway 15 and Elm St. in Shelbina, MO. The exact locations and orientations of the underground storage tanks are unknown. The only surface evidence are the fill caps and monitoring wells located above and around the tanks, respectfully. The lateral extension and orientation of the underground storage tanks can be assumed by using the fill caps and a priori information provided by MDNR (Figure 2). The location of the associated feeder lines is unknown. The Simpson survey was separated into two overlapping sections which covered the four possible underground storage tank locations (Figure 2). Area A covered the area between the building and the pump island. Area B probed the section with boundaries of Highway 15 and Elm St. and the two pump islands.
Figure 2: Survey design for Simpson Oil Co. property, with survey subsections A and B, and GPR lines A-A’ and B-B’ marked.
FASTOP GAS STATION INTERPRETATION
Fastop Gas Station is separated into 10 Areas, A through I (Figure 1), which contained a variety of targets including active underground storage tanks (USTs), suspect USTs, former USTs, utility lines, and feeder lines. The complementary use of electromagnetic induction and ground penetrating radar methods increased the likelihood of detecting the underground storage tanks and associated utility lines. Electromagnetic Induction Data
The electromagnetic induction method clearly distinguished the targets. The data were collected with frequencies from 330 through 19950 Hz. Figure 3 displays the USTs and utility lines interpreted with a priori information of the location of the active USTs. The magnitudes of the in–phase component of the
Brady, T., S. Cardimona and N. Anderson, "Detection and Delineation of Underground Fuel Storage Tanks and Associated Utility Lines Using Electromagnetic Induction and Ground Penetrating Radar Methods," International Conference on the Application of Geophysical Technologies to Planning, Design, Construction, and Maintenance of Transportation Facilities, St. Louis, MO, in press, 2000.
4
secondary magnetic field, essentially the absolute values of the in–phase component, are plotted using a contouring program. By plotting the absolute value of the in–phase component, the anomalies were enhanced.
The Active USTs are located just north of the building in section G (Figure 1). The Active USTs produce a halo effect that is indicative of buried metal objects. The anomaly at the edge of the building next to the tanks was caused by a surface 50–gallon drum that was present during the initial day of data collection, but not present during the subsequent days of data collection. Therefore, the anomaly is not located on the neighboring section. This shows the importance of surface features in the survey area while using the electromagnetic induction equipment. The UST signature in Area G is used throughout the interpretation of the Fastop Gas Station site as a typical tank signature to compare with other anomalies.
A sewer line is also evident that extends from the building to the septic tank in the northwest corner of Area G. The signature of the sewer line is subtle because the sewer line is composed of concrete. The conductivity contrast between the concrete and the surrounding soil is not very large; therefore, the detection of a sewer line was thought unlikely in the past.
Figure 3: Fastop Gas Station using the 19950 Hz EM induction data – a relative color scale is used to show signal amplitude variation for qualitative anomaly detection
Brady, T., S. Cardimona and N. Anderson, "Detection and Delineation of Underground Fuel Storage Tanks and Associated Utility Lines Using Electromagnetic Induction and Ground Penetrating Radar Methods," International Conference on the Application of Geophysical Technologies to Planning, Design, Construction, and Maintenance of Transportation Facilities, St. Louis, MO, in press, 2000.
5
Area A (Figure 1) is denoted by the location of the utility lines, feeder lines and an above–ground sign. The utility lines are clearly distinguishable in the high frequency (e.g. 19950 Hz) contoured data as presented in Figure 3. The contoured electromagnetic induction map aids in the interpretation of the feeder lines and the associated hydrocarbon contamination. However, the utility lines and feeder line are not evident in the low frequency (e.g. 330 Hz) contoured electromagnetic induction data due to the size of the respective lines. One of the utility lines leads from the building to a sign in the northwest corner of Area A, illustrated as a conductivity high on the contoured electromagnetic induction map.
Area A contains one of the suspect tank locations. The nature of these tanks is unknown by the Missouri Department of Transportation. The owner of the Fastop Gas Station is not certain of the UST removal prior to the addition of the new active tank farm, but believes the USTs have been removed. The interpretation of the data confirms MoDOT’s belief that the tanks were previously removed.
Areas B, C, and D (Figure 1) display the contrast between the hydrocarbon contamination and the pump islands. However, the contrast between the hydrocarbon contamination (resistive) and the pump islands (conductive) is not evident by plotting the EM induction data by the magnitude of the in–phase component because the absolute value will make the resistive and conductive anomalies appear similar.
Areas E and F (Figure 1) area relatively subdued compared with the other areas; however, Areas E and F offer subtle features that prove the usefulness of the EM induction method. Area F displays a slight anomaly that is only evident in the plots of the magnitude of the in–phase component of the secondary magnetic field. The anomaly is interpreted to be the disturbed ground and possible hydrocarbon leakage caused by the former tank farm. By plotting the absolute value of the components of the secondary magnetic field, the difference between the disturbed ground and light hydrocarbon contamination cannot be determined. The ground penetrating radar technique should be able to distinguish between the disturbed ground and the hydrocarbon contamination. Area E is the location of the suspect tank farm. An anomaly was not present in the area of the suspect tanks. The interpretation of the electromagnetic induction data is that the USTs have been previously removed resulting in no tank signature in the EM induction maps.
Area H (Figure 1), just north of Highway 150, contains an anomaly that is evident only on the plot of the magnitude of the in–phase component and not obvious in the in–phase component data. The grape–shaped anomaly is similar to the anomaly in Area J, which was interpreted as standing water. The linear feature looks like a utility line; however, that has not been confirmed.
Areas I and J (Figure 1) are relatively free of anomalies that are related to the goals of this project. In the north–east section of the Area J, an anomaly is present. The anomaly is caused by scrap metal located on the surface. The anomaly in the center of Area J is caused by standing water, which was on the surface during the collection of the data. Ground Penetrating Radar Data
The ground penetrating radar method delineated most of the underground storage tanks successfully. The ground penetrating radar method clearly defined the USTs and septic tank located on site; however, GPR did not detect the utility lines or feeder lines effectively. The locations of the ground penetrating radar profiles are in Figure 1.
Area A, Area F, and Area G show distinct results that illustrate the utility of the integrated electromagnetic induction and ground penetrating radar techniques. The other Areas did not show significant results to warrant additional figures. The interpretation of the ground penetrating radar profiles provided additional information to improve the a priori knowledge of the lateral and vertical positioning of the tanks. GPR improved both the horizontal and vertical resolution. The interpretation of the GPR data allowed for more accurate depth control and delineation of the sides of the tanks.
Area G (Figure 1) contains the underground fuel storage tanks and septic line. Figure 4 shows a disturbed area from 20 to 28 meters along the profile interpreted as the underground septic tank for the Fastop building. The septic tank was not imaged on the electromagnetic induction data because the concrete structure did not provide a conductive anomaly. Another anomaly is evident in Figure 4, located at 7 meters along the profile. This anomaly is interpreted as the septic line running from the building to the septic tank as interpreted in the contoured electromagnetic induction map.
Brady, T., S. Cardimona and N. Anderson, "Detection and Delineation of Underground Fuel Storage Tanks and Associated Utility Lines Using Electromagnetic Induction and Ground Penetrating Radar Methods," International Conference on the Application of Geophysical Technologies to Planning, Design, Construction, and Maintenance of Transportation Facilities, St. Louis, MO, in press, 2000.
6
Area G is the location of the active underground fuel storage tank farm. Three tanks are located in close proximity to one another. Figure 5 shows the USTs between 7 and 12 meters along the profile. The radar data is nonmigrated; therefore, the USTs will appear as a disturbed area rather than horizontal bright spots. The disturbed zone in Figure 5 is not a typical tank signature. A typical tank signature is a diffraction, but there are no diffractions evident in the GPR profile, just a disturbed area. The reason for the lack of diffractions in the GPR profile is the spacing of the USTs.
Figure 4: GPR data from Area G using a 400 MHz antenna (Profile A-A’ on Figure 1) – buried concrete septic tank between 20-28 meters along the profile (I) and a sewer line at 7 meters along the profile (II)
Brady, T., S. Cardimona and N. Anderson, "Detection and Delineation of Underground Fuel Storage Tanks and Associated Utility Lines Using Electromagnetic Induction and Ground Penetrating Radar Methods," International Conference on the Application of Geophysical Technologies to Planning, Design, Construction, and Maintenance of Transportation Facilities, St. Louis, MO, in press, 2000.
7
Figure 5: GPR data from Area G using a 400 MHz antenna (Profile B-B’ on Figure 1) – buried USTs between 7 and 12 meters along the profile (I)
The close proximity of the USTs creates interference in the GPR profile. Therefore, without the use of the electromagnetic induction technique, the USTs would be difficult to detect because the GPR signature looks similar to disturbed ground, or an area where the USTs have been replaced by infill. The infilled soil usually does not completely subside for more than five years. The electromagnetic induction technique confirmed a conductive body at the same location as the anomaly in the GPR profile; therefore, the anomaly in the integrated electromagnetic induction and ground penetrating radar data is interpreted as the active tank farm. The majority of the northern section of the Fastop Gas Station Property has been excavated. Area G (Figure 1) contained the active tank farm, sewer line, and septic tanks. All of these anomalies were found in the locations determined by the integrated electromagnetic induction and ground penetrating radar data. During the excavation of Area A (Figure 1), the suspect tanks were not found confirming the electromagnetic induction and ground penetrating radar data.
SIMPSON OIL COMPANY INTERPRETATION
Simpson Oil Company, located in Shelbina, Missouri, has four suspect underground fuel storage tank locations (Figure 2). Two grids covered the area of the suspect tanks. The electromagnetic induction and ground penetrating radar data discovered that all four underground fuel storage tanks existed; however, the USTs were not situated in their expected spatial location. Electromagnetic Induction Data
The electromagnetic induction data was plotted as the absolute value of the in–phase and quadrature components of the secondary magnetic field using the low frequency (e.g. 330 Hz) data. The two underground fuel storage tanks just north of the pump island are interpreted in Figure 6. The surface features, including the fill caps, confirm the placement of the two tanks as found in the contoured electromagnetic induction maps. Because of the close proximity of the USTs, only two anomalies are
Brady, T., S. Cardimona and N. Anderson, "Detection and Delineation of Underground Fuel Storage Tanks and Associated Utility Lines Using Electromagnetic Induction and Ground Penetrating Radar Methods," International Conference on the Application of Geophysical Technologies to Planning, Design, Construction, and Maintenance of Transportation Facilities, St. Louis, MO, in press, 2000.
8
evident. The conductivities recorded by the electromagnetic induction equipment blend the USTs together creating one large anomaly from two tanks. This makes it difficult to distinguish between the tanks using only the EMI technique. However, when the ground penetrating radar technique is implemented along with the electromagnetic induction technique, the individual tanks can be delineated.
The high frequency (e.g. 19950 Hz) data is considerably noisier than the low frequency data caused by surface features and surrounding conductive artifacts. The feeder line was not imaged due to large amount of electromagnetic noise. The anomaly in the eastern section of Figure 6 is interpreted as a water line running along Highway 15. The water line was marked on the pavement by the water company while marking utility lines on the premises; however, the water line was incorrectly marked. The water line was marked half a meter outside the survey area to the east. As shown in Figure 6, the water line is located within the survey area.
Figure 6: Simpson Oil Company, electromagnetic induction data (a) 330 Hz, in–phase – USTs and water
line are evident; (b) 330 Hz, quadrature – only the water line is evident Ground Penetrating Radar Data
The ground penetrating radar data provided the ability to delineate the USTs with much greater accuracy than the electromagnetic induction method. In contrast to the electromagnetic induction equipment, the interpreted GPR data yields accurate depth approximations. Area A contains 4 USTs and Area B, which overlaps Area A, contains 2 USTs (Figure 2). The ground penetrating radar data for the Simpson Oil Co. property was not migrated; therefore, the tanks are imaged as a diffraction and will not have sharp delineation of the tank edges.
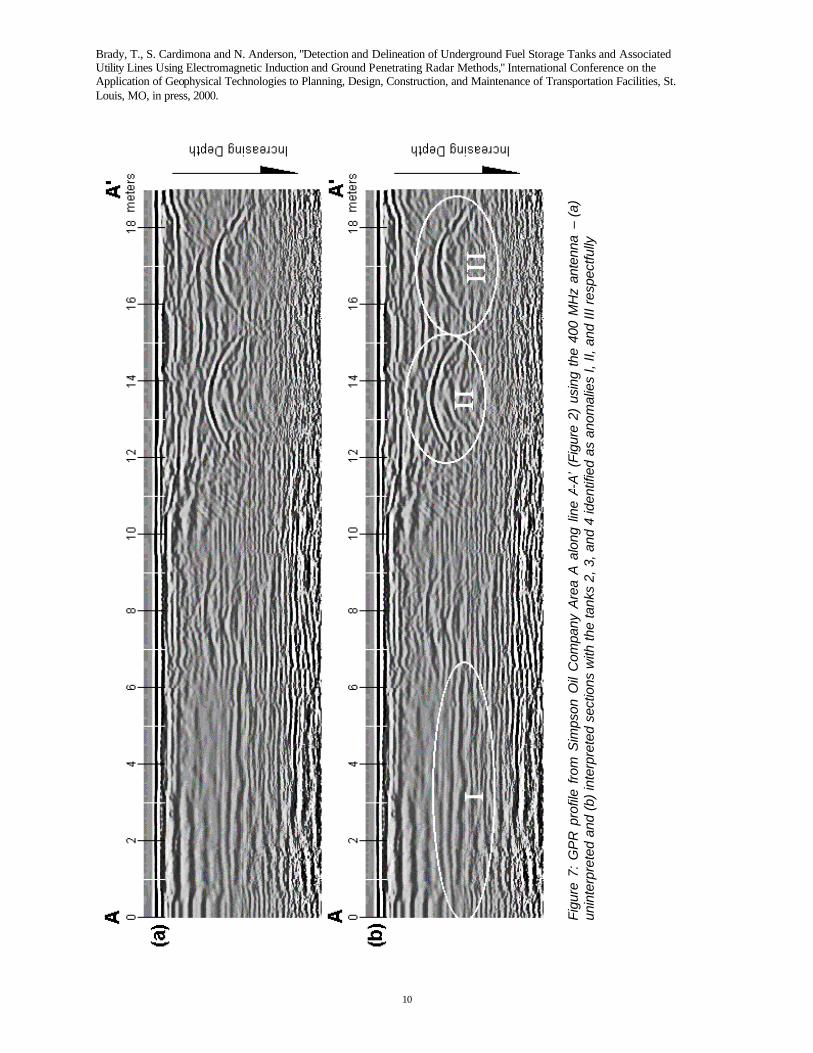
Area A (Figure 2) contains 4 USTs and associated feeder lines that required delineation to aid in the removal of the USTs and demolition of the site. Figure 4.8 shows three UST locations. One of the tanks, oriented parallel with the survey line (A–A’), is positioned from 2 to 9 meters along the profile (I) and the second and third tanks, oriented perpendicular to the survey line, are centered at 13 and 17 meters (II and III) along the profile, respectively. The USTs oriented perpendicular to the survey lines are more easily detected because they form a narrow diffraction rather than the oblong diffraction created by the tanks oriented parallel with the survey line.
One of the depth approximations methods utilizes the diffraction within the ground penetrating radar profiles; however, the diffractions for Tanks 1 and 2 are more difficult to estimate and therefore less accurate. The depths to Tanks 3 and 4 were calculated using the hyperbolic spreading function. The depth to Tank 3 is approximately 1.4 meters and the depth to Tank 4 is approximately 1.2 meters. Tank 1 and 2 are aligned parallel with the survey line unlike Tanks 3 and 4, which are orientated perpendicular to the survey line. The depth to Tanks 1 and 2 are approximately 1.5 meters deep. These depths were determined by using the dielectric constant determined in the depth calculations for Tanks 3 and 4.
Brady, T., S. Cardimona and N. Anderson, "Detection and Delineation of Underground Fuel Storage Tanks and Associated Utility Lines Using Electromagnetic Induction and Ground Penetrating Radar Methods," International Conference on the Application of Geophysical Technologies to Planning, Design, Construction, and Maintenance of Transportation Facilities, St. Louis, MO, in press, 2000.
9
Area B overlaps Area A and contains two USTs including Tanks 3 and 4 (Figure 2), both of which are also located in Area A. The interpreted GPR profiles from Area B are used to delineate the underground storage tanks with further precision. In contrast to Area A where the USTs are perpendicular to the survey direction, Tanks 3 and 4 are parallel with the survey direction in Area B. The USTs are more difficult to detect when the tanks are parallel with the survey line; however, the edges of the tanks can be more accurately mapped.
The feeder line is located in both Area A and Area B, connecting the two pump islands with the USTs. The feeder line is evident in most of the ground penetrating radar profiles, but is absent from several lines. The feeder line is mapped from the GPR profiles along the lines indicated in Figure 4.10. The dashed lines of Figure 4.10 indicate the estimated location of the feeder line in areas where it was not evident in the GPR data.
The complementary use of the electromagnetic induction and ground penetrating radar methods enabled the a priori information to be corrected and the location of the USTs to be plotted in their correct spatial location. Figure 9 shows the proper location of the USTs as taken from the interpreted contoured electromagnetic induction map and ground penetrating radar profiles (cf. Figure 2). The USTs in Area A were found to be located in different positions and orientations than expected. The tanks are numbered 1 through 4 from west to east, respectfully. Tank 1 was interpreted to be closer to the pump islands than what the a priori information suggested. Tank 2, parallel with Tank 1, is located approximately two meters north of Tank 1. Tanks 3 and 4, oriented perpendicular to Tanks 1 and 2, are repositioned to the west.
Brady, T., S. Cardimona and N. Anderson, "Detection and Delineation of Underground Fuel Storage Tanks and Associated Utility Lines Using Electromagnetic Induction and Ground Penetrating Radar Methods," International Conference on the Application of Geophysical Technologies to Planning, Design, Construction, and Maintenance of Transportation Facilities, St. Louis, MO, in press, 2000.
10
Figu
re 7
: G
PR
pro
file
from
Sim
pson
Oil
Com
pany
Are
a A
alo
ng l
ine
A-A
’ (Fi
gure
2)
usin
g th
e 40
0 M
Hz
ante
nna
– (a
) un
inte
rpre
ted
and
(b)
inte
rpre
ted
sect
ions
with
the
tank
s 2,
3, a
nd 4
iden
tifie
d as
ano
mal
ies
I, II,
and
III r
espe
ctfu
lly
Brady, T., S. Cardimona and N. Anderson, "Detection and Delineation of Underground Fuel Storage Tanks and Associated Utility Lines Using Electromagnetic Induction and Ground Penetrating Radar Methods," International Conference on the Application of Geophysical Technologies to Planning, Design, Construction, and Maintenance of Transportation Facilities, St. Louis, MO, in press, 2000.
11
Fig
ure
8: G
PR
pro
file
of A
rea
B f
rom
Sim
pson
Oil
Com
pany
alo
ng li
ne B
-B’ (
Figu
re 2
) us
ing
the
400
MH
z an
tenn
a –
(a)
unin
terp
rete
d an
d (b
) in
terp
rete
d se
ctio
ns w
ith th
e U
ST
(I)
Brady, T., S. Cardimona and N. Anderson, "Detection and Delineation of Underground Fuel Storage Tanks and Associated Utility Lines Using Electromagnetic Induction and Ground Penetrating Radar Methods," International Conference on the Application of Geophysical Technologies to Planning, Design, Construction, and Maintenance of Transportation Facilities, St. Louis, MO, in press, 2000.
12
Figure 9: Simpson Oil Co. (cf. Figure 2) – the USTs in their proper spatial locations and the location of the
feeder line (dashed line is the assumed position of the feeder line)
CONCLUSIONS
The Missouri Department of Transportation was required to excavate several gas station sites to make room for the expansion of the adjacent highways. There was a necessity to locate underground fuel storage tanks and associated utility lines at these gas station properties to aid in the excavation of the site and to eliminate costs created by the problems associated with destruction or damage of unknown USTs. The location of these tanks has been found through this study using nondestructive and nonintrusive geophysical techniques.
The integrated use of the ground penetrating radar and electromagnetic induction techniques increased the accuracy of anomaly identification. Where one of the electromagnetic techniques seemed to falter, the other technique helped to identify the anomaly. The electromagnetic induction had limited success in detection of utility and feeder lines because the conductivity contrast between the background soil and the utility/feeder lines is small, especially when the clay content is relatively high. The Fastop Gas Station was very successful in the detection of utility lines; however, at the other sites, the detection of the utility lines using the EMI technique was limited in part by the large amount of background noise. Where surface noise created anomalies in the electromagnetic induction data, the ground penetrating radar data proved that those anomalies were not underground fuel storage tanks. Where ground penetrating radar showed some anomalies that were difficult to detect, the electromagnetic induction data did not show confirmation of underground storage tanks or associated utility lines, so the interpretation could be made that the anomaly in the ground penetrating radar was created by soil variation.
The electromagnetic induction and ground penetrating radar techniques were chosen from a variety of geophysical methods because of the ability of the methods to detect and delineate the underground storage tanks and associated utility lines. The electromagnetic induction and ground penetrating radar techniques were also cost effective. The complementary use of the electromagnetic induction and
Brady, T., S. Cardimona and N. Anderson, "Detection and Delineation of Underground Fuel Storage Tanks and Associated Utility Lines Using Electromagnetic Induction and Ground Penetrating Radar Methods," International Conference on the Application of Geophysical Technologies to Planning, Design, Construction, and Maintenance of Transportation Facilities, St. Louis, MO, in press, 2000.
13
ground penetrating radar techniques was successful in the detection and delineation of the underground fuel storage tanks and associated utility lines. The electromagnetic induction technique provided an excellent initial detection of the USTs using a cost effective system. The ground penetrating radar delineated the tanks more clearly and provided better depth approximations.