Detection and Production of Methane Hydrate Phase 2 Rice University & University of Houston George J. Hirasaki, Lead PI CONTRACT NO. DE-FC26-05NT42960 NETL Project Manager: Kelly Rose Presentation to US DOE NETL January 9, 2007
Transcript
Detection and Production of Methane Hydrate
Phase 2Rice University &
University of HoustonGeorge J. Hirasaki, Lead PI
CONTRACT NO. DE-FC26-05NT42960NETL Project Manager: Kelly Rose
Presentation to US DOE NETL
January 9, 2007
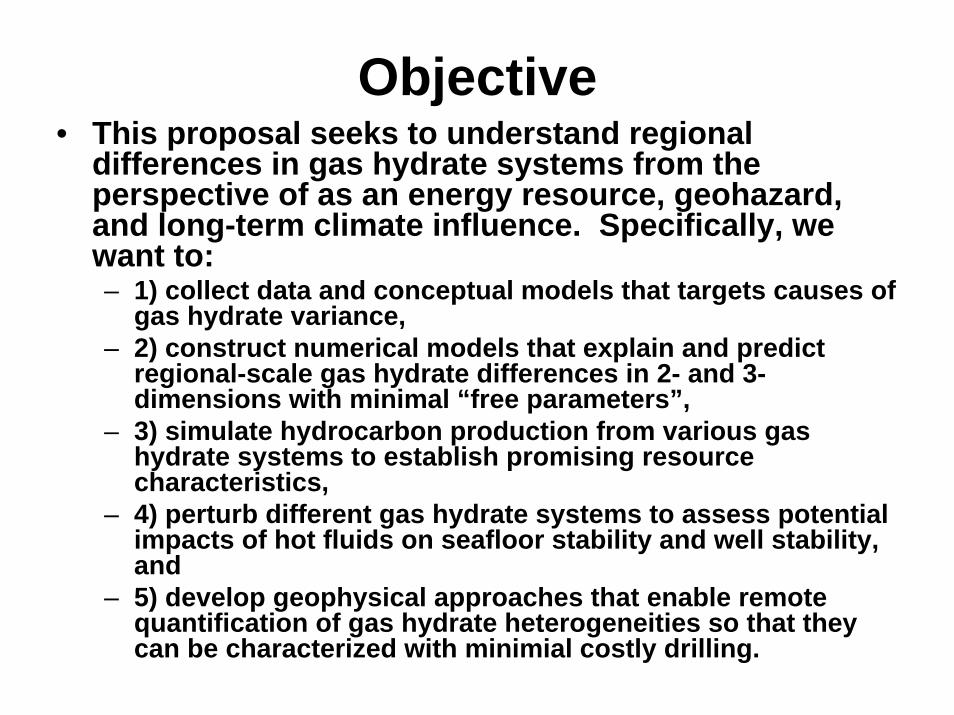
Objective• This proposal seeks to understand regional
differences in gas hydrate systems from the perspective of as an energy resource, geohazard, and long-term climate influence. Specifically, we want to: – 1) collect data and conceptual models that targets causes of
gas hydrate variance, – 2) construct numerical models that explain and predict
regional-scale gas hydrate differences in 2- and 3-dimensions with minimal “free parameters”,
– 3) simulate hydrocarbon production from various gas hydrate systems to establish promising resource characteristics,
– 4) perturb different gas hydrate systems to assess potential impacts of hot fluids on seafloor stability and well stability, and
– 5) develop geophysical approaches that enable remote quantification of gas hydrate heterogeneities so that they can be characterized with minimial costly drilling.
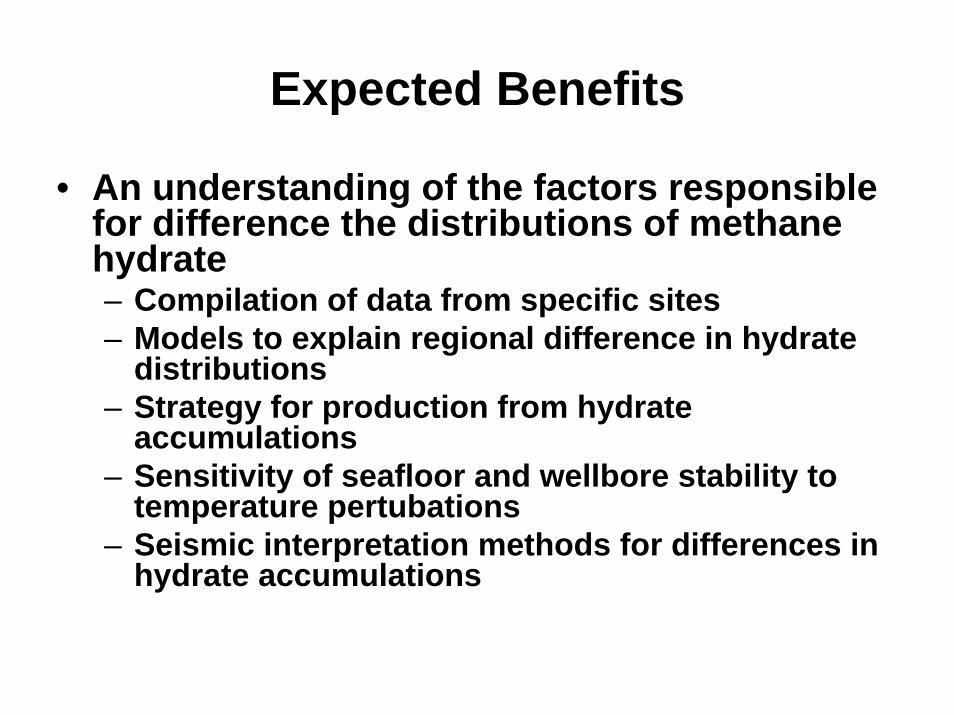
Expected Benefits
• An understanding of the factors responsible for difference the distributions of methane hydrate– Compilation of data from specific sites– Models to explain regional difference in hydrate
distributions– Strategy for production from hydrate
accumulations– Sensitivity of seafloor and wellbore stability to
temperature pertubations– Seismic interpretation methods for differences in
hydrate accumulations
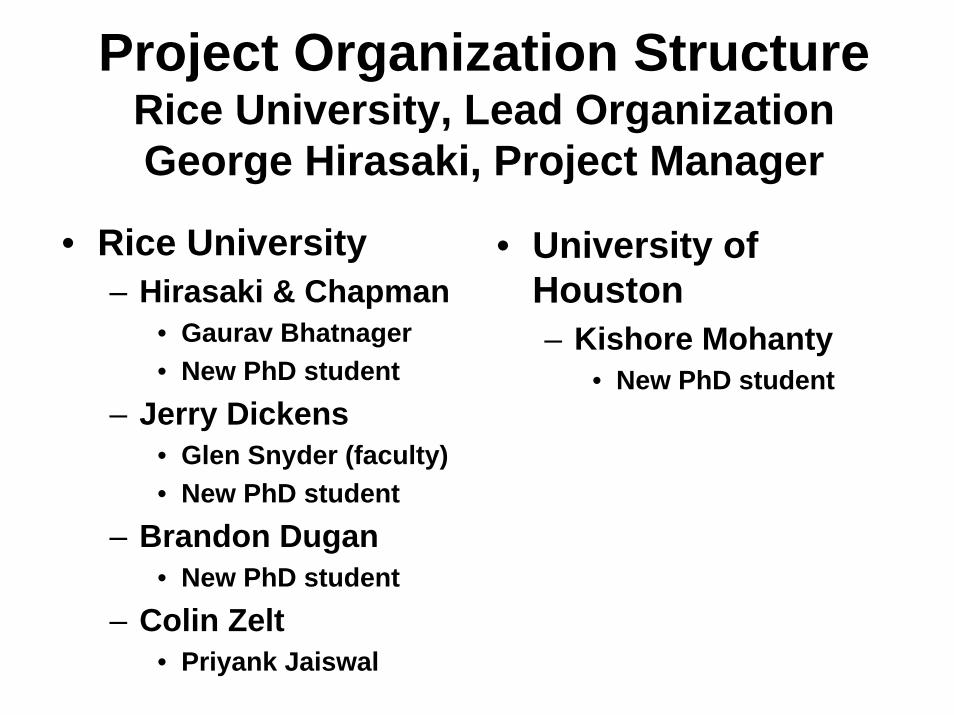
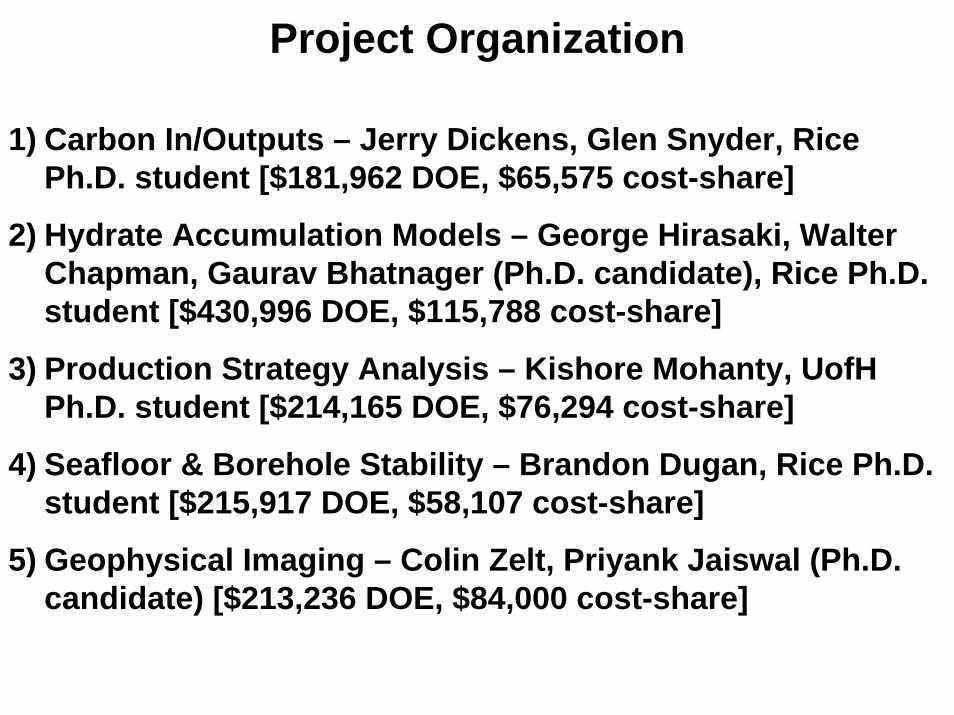
Project Organization StructureRice University, Lead OrganizationGeorge Hirasaki, Project Manager
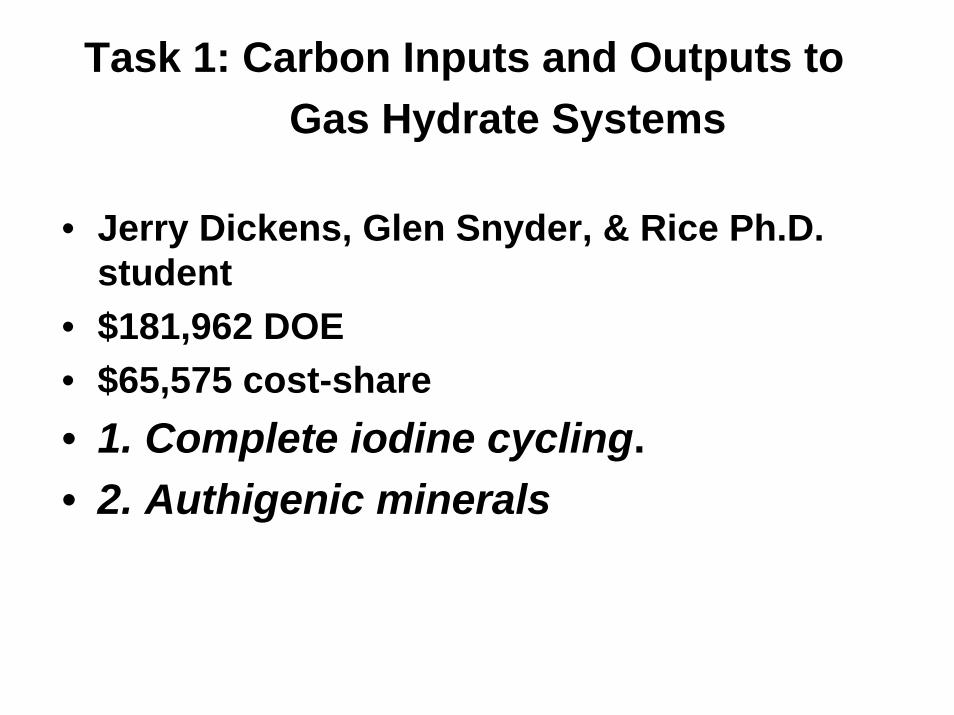
• Rice University– Hirasaki & Chapman
• Gaurav Bhatnager• New PhD student
– Jerry Dickens• Glen Snyder (faculty)• New PhD student
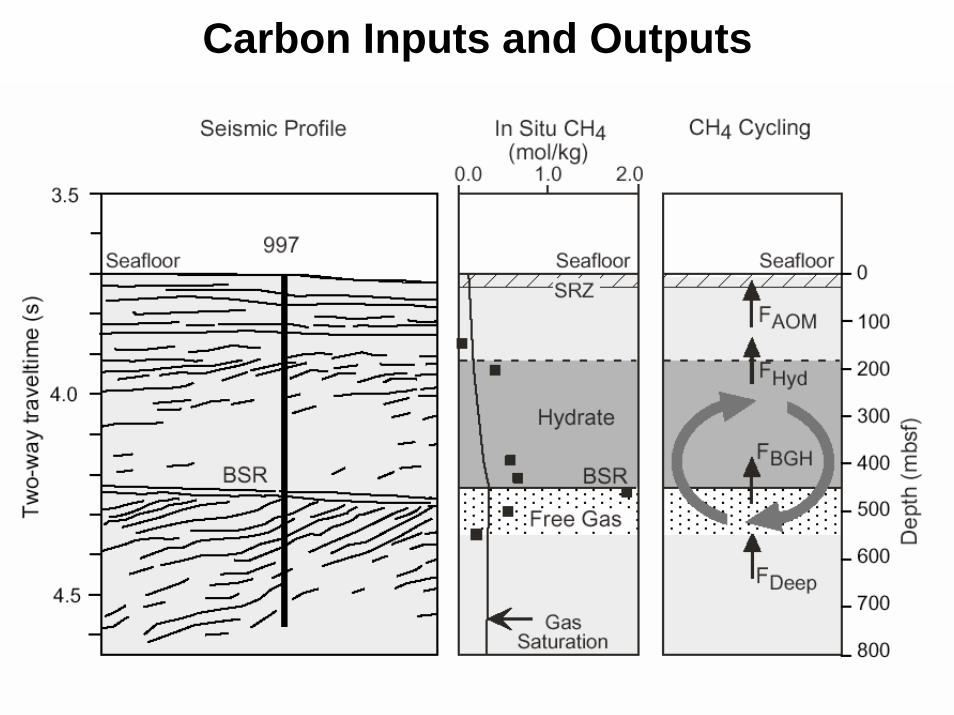
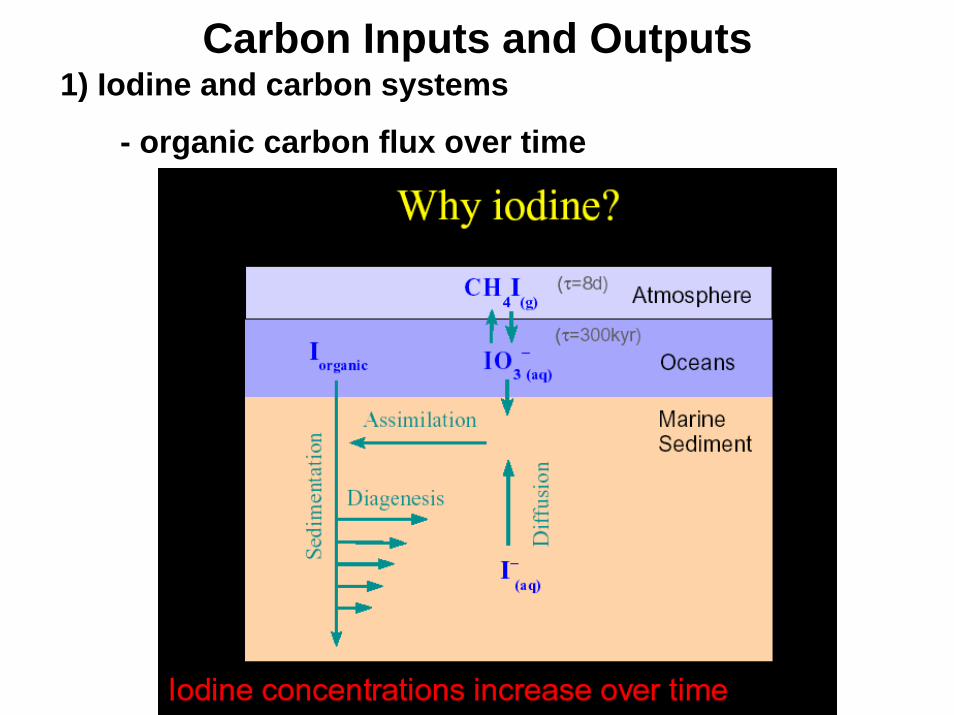
Carbon Inputs and Outputs1) Iodine and carbon systems
- organic carbon flux over time
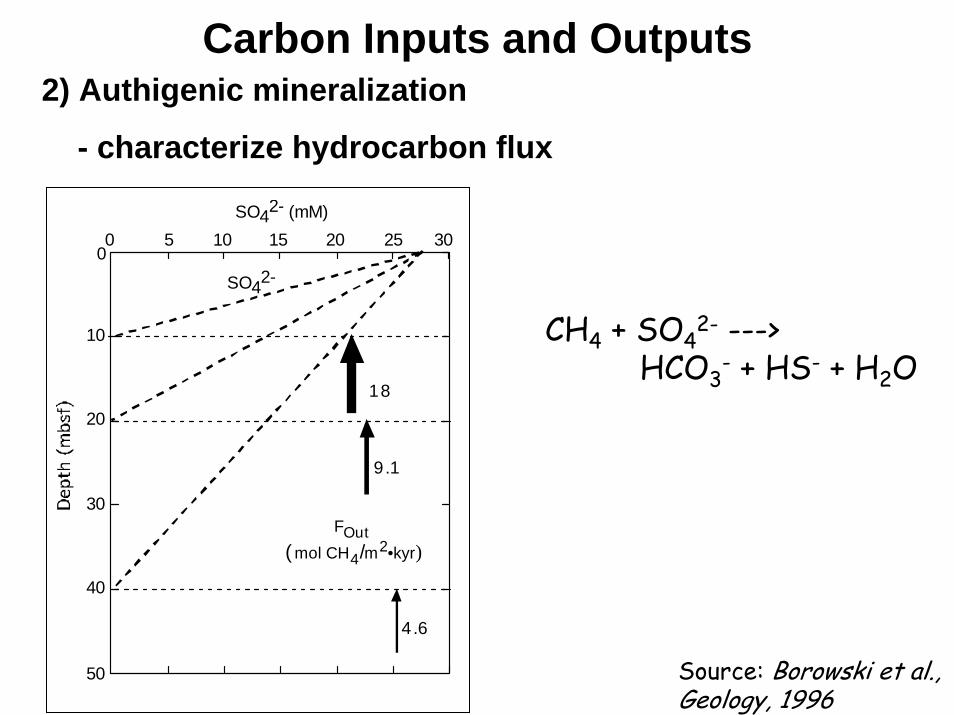
Carbon Inputs and Outputs2) Authigenic mineralization
- characterize hydrocarbon flux
0 5 10 20 25 30150
10
20
30
40
SO42- (mM)
FOut
9.1
4.6
18
( mol CH4/m2•kyr)
50
SO42-
Source: Borowski et al., Geology, 1996
CH4 + SO42- --->
HCO3- + HS- + H2O
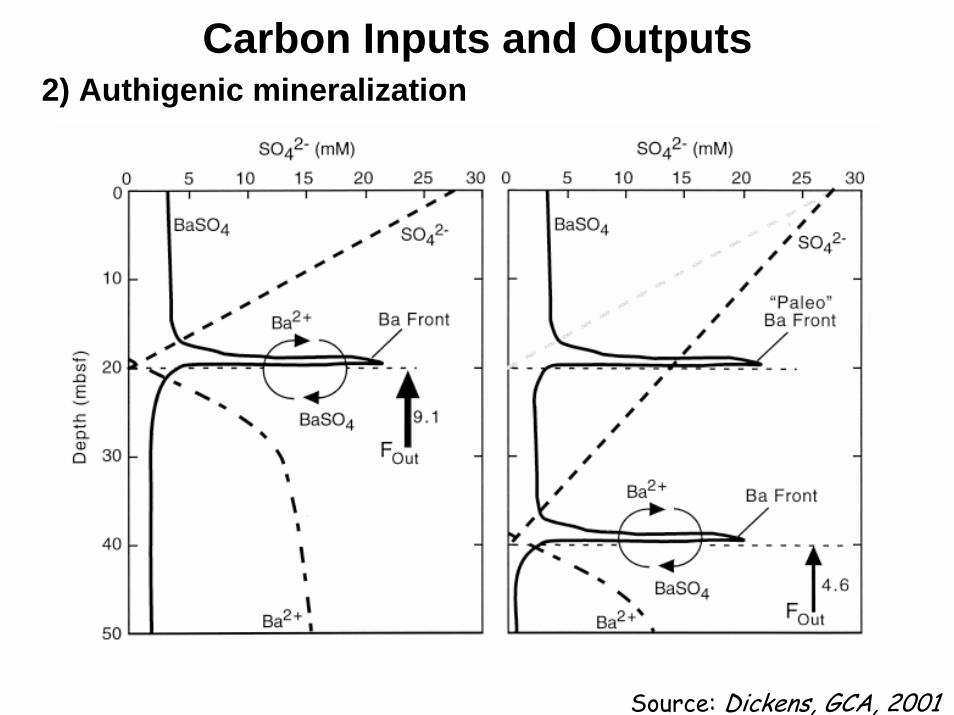
Carbon Inputs and Outputs2) Authigenic mineralization
- characterize hydrocarbon flux
Source: Dickens, GCA, 2001
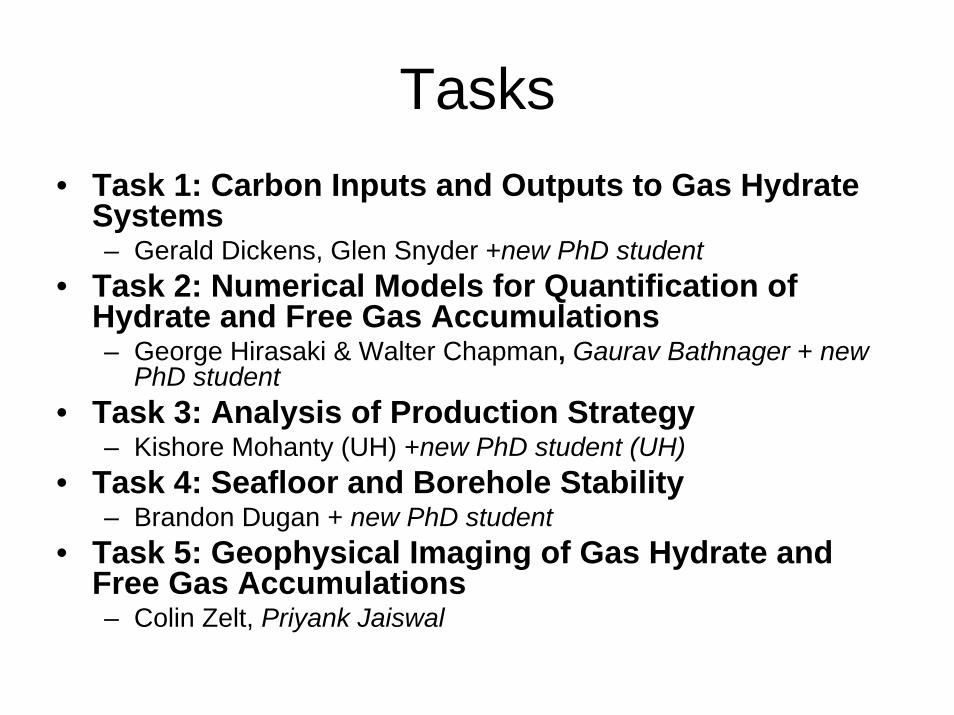
Task 2: Numerical Models for Quantification of Hydrate and Free Gas Accumulations
• 1: Model development. • 2: Conditions for existence of gas hydrate• 3: Compositional effect on BSR• 4: Amplitude Attenuation and chaotic zones
due to hydrate distribution• 5: Processes leading to overpressure• 6: Concentrated hydrate and free gas• 7: Focused free gas, heat and salinity• 8: Sulfate profile as indicator of methane flux
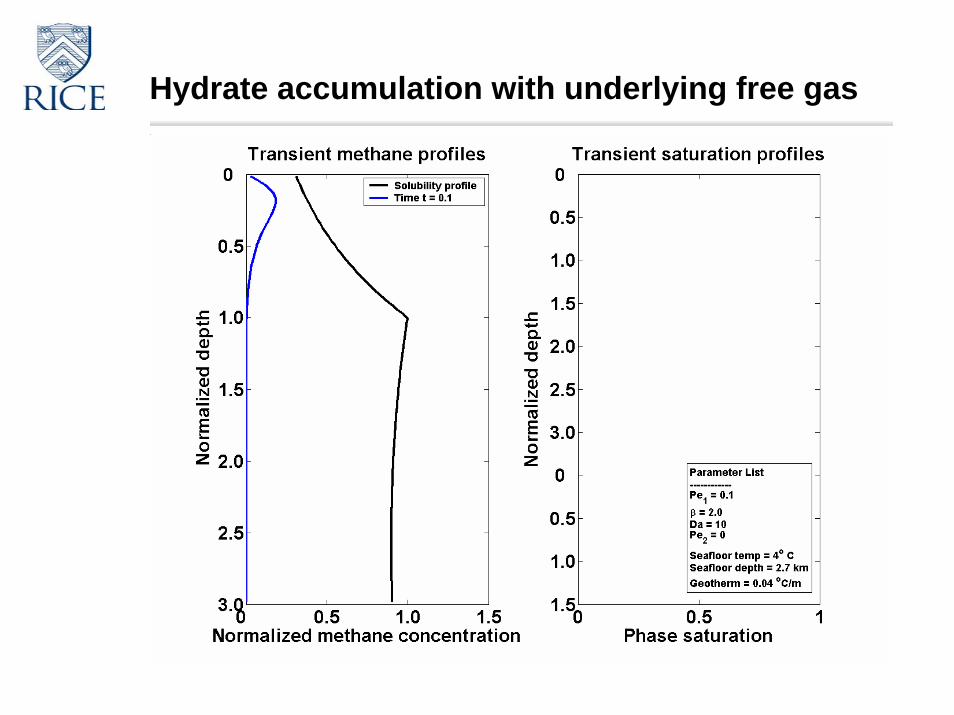
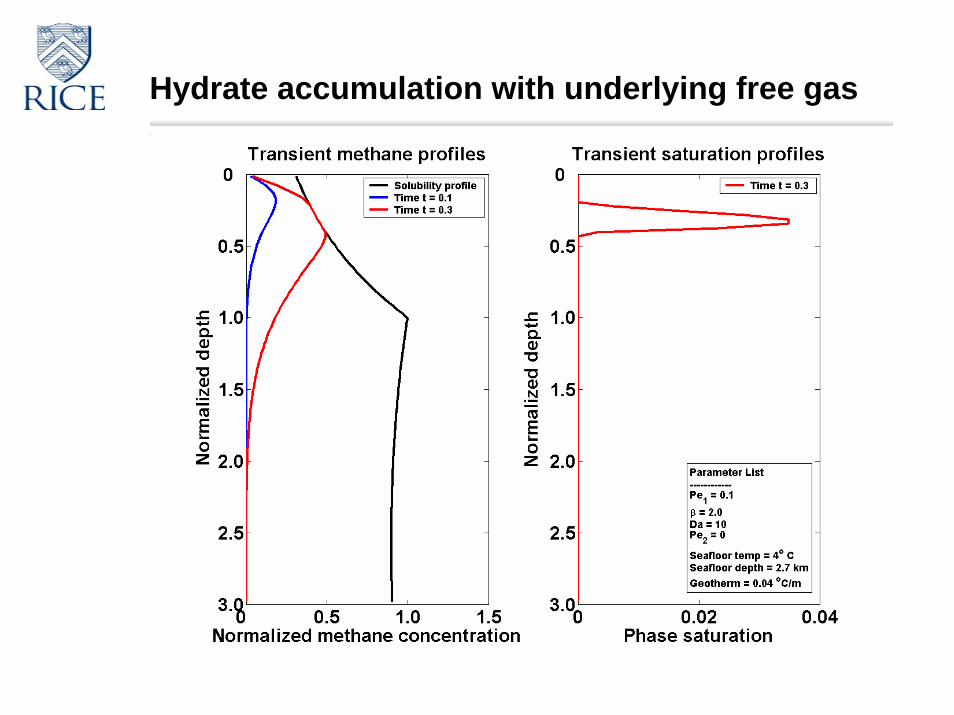
Hydrate accumulation with underlying free gas
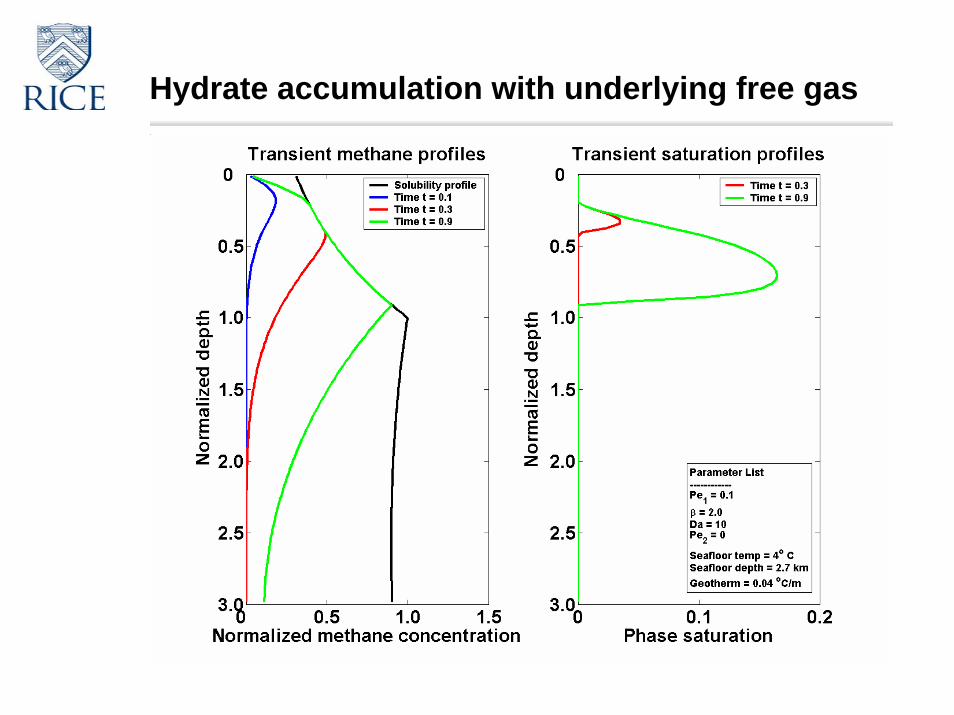
Hydrate accumulation with underlying free gas
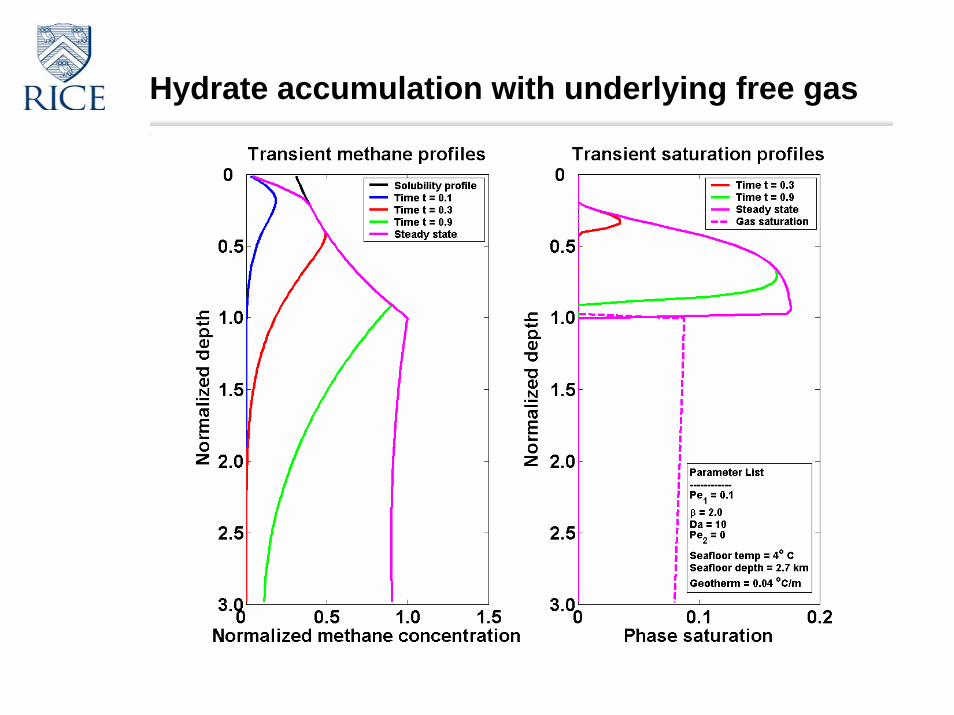
Hydrate accumulation with underlying free gas
Hydrate accumulation with underlying free gas
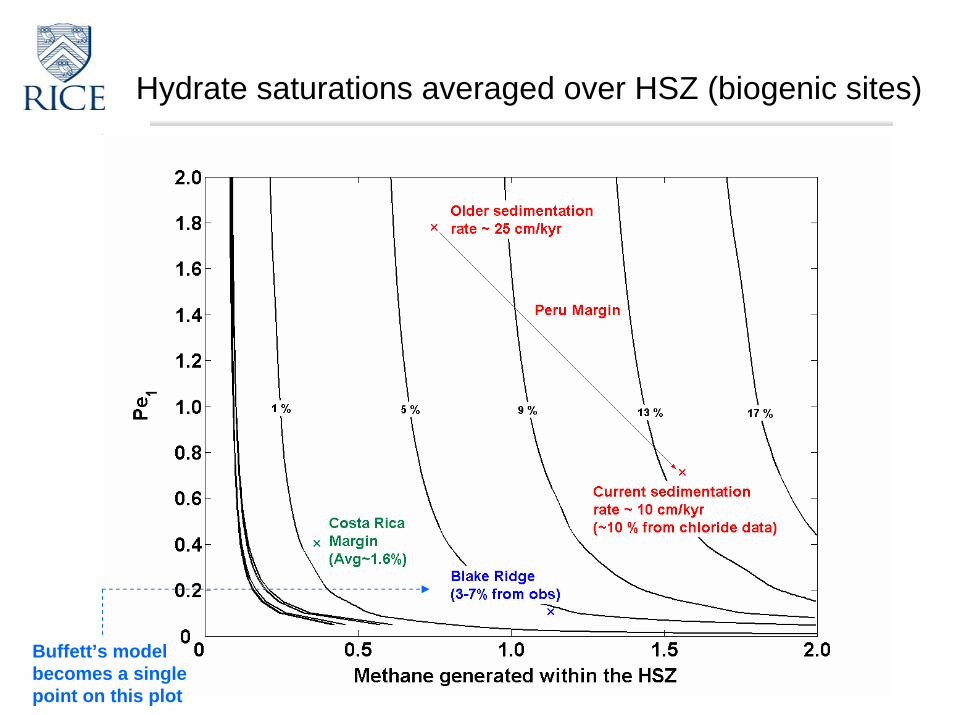
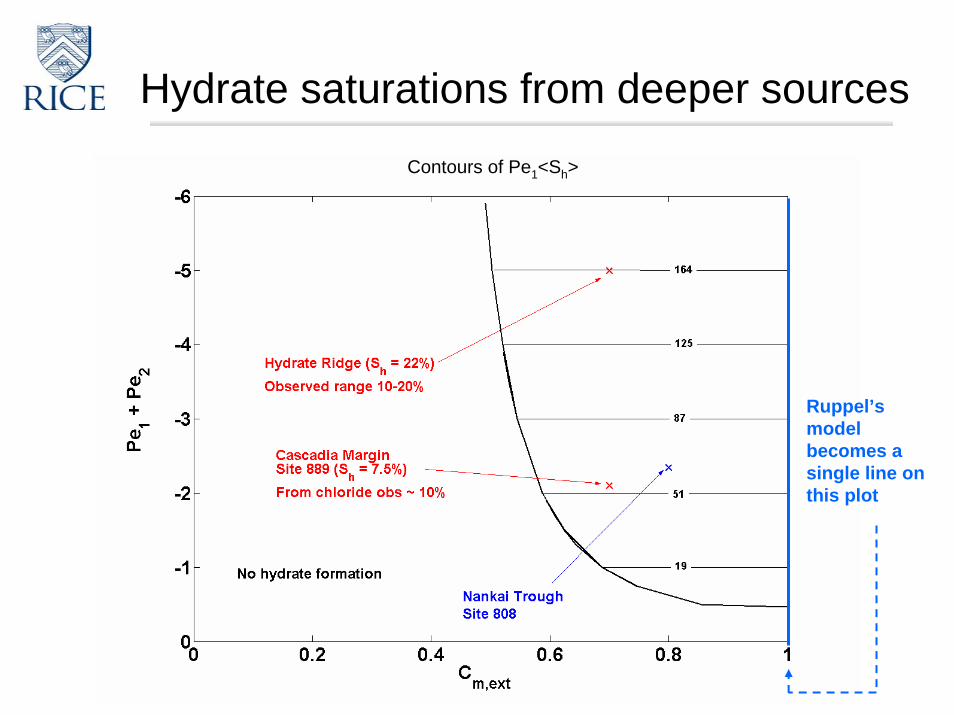
Hydrate saturations averaged over HSZ (biogenic sites)
Buffett’s model becomes a single point on this plot
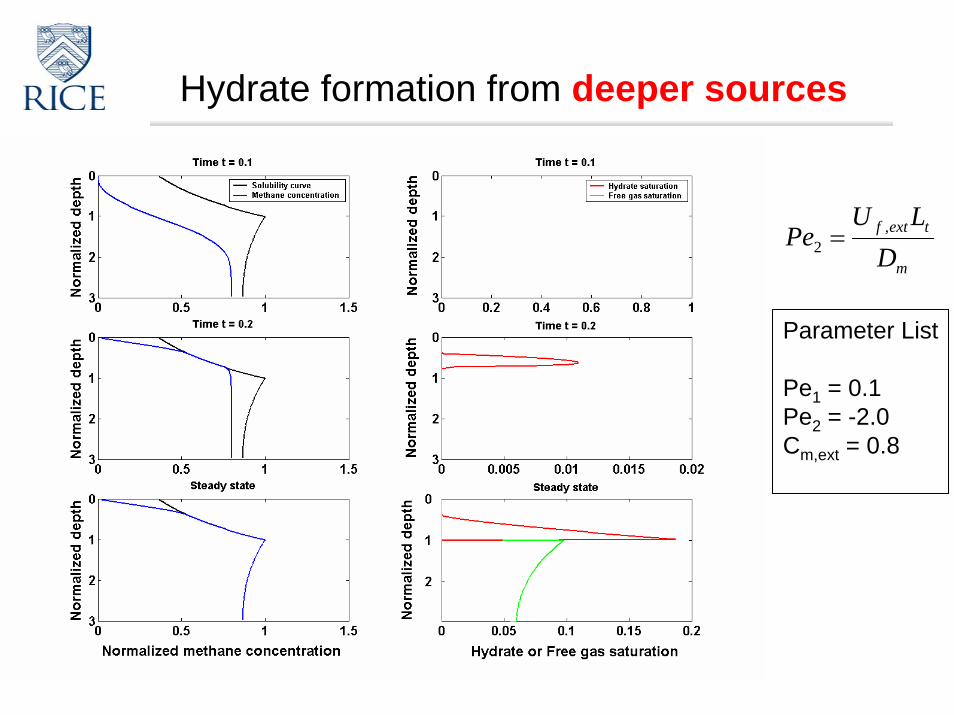
Hydrate formation from deeper sources
Parameter List
Pe1 = 0.1Pe2 = -2.0Cm,ext = 0.8
m
textf
DLU
Pe ,2 =
Hydrate saturations from deeper sourcesContours of Pe1<Sh>
Ruppel’s model becomes a single line on this plot
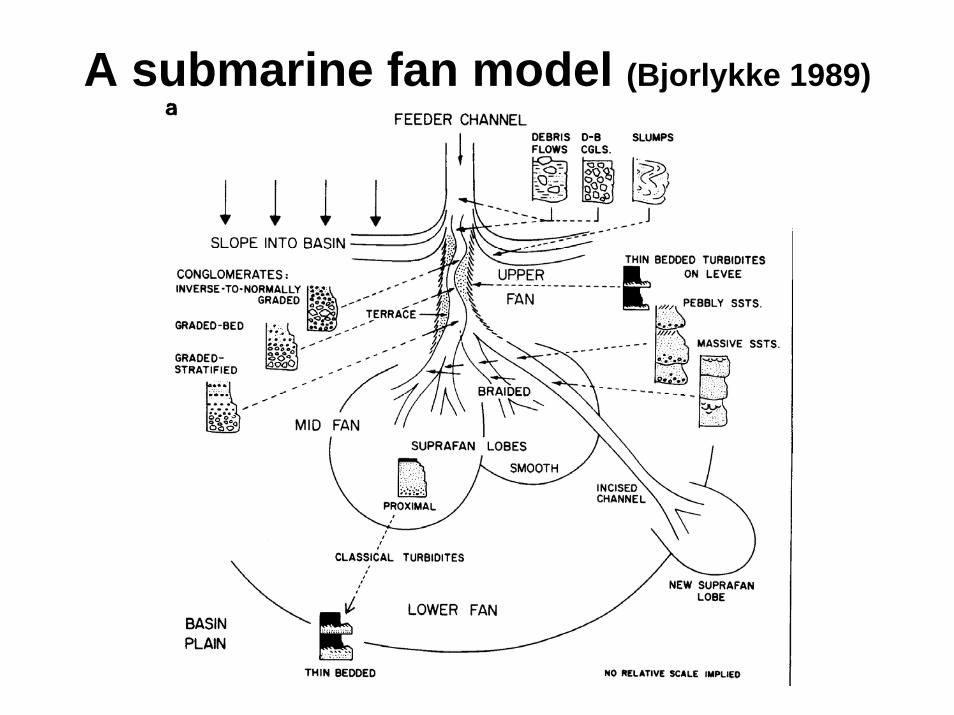
A submarine fan model (Bjorlykke 1989)
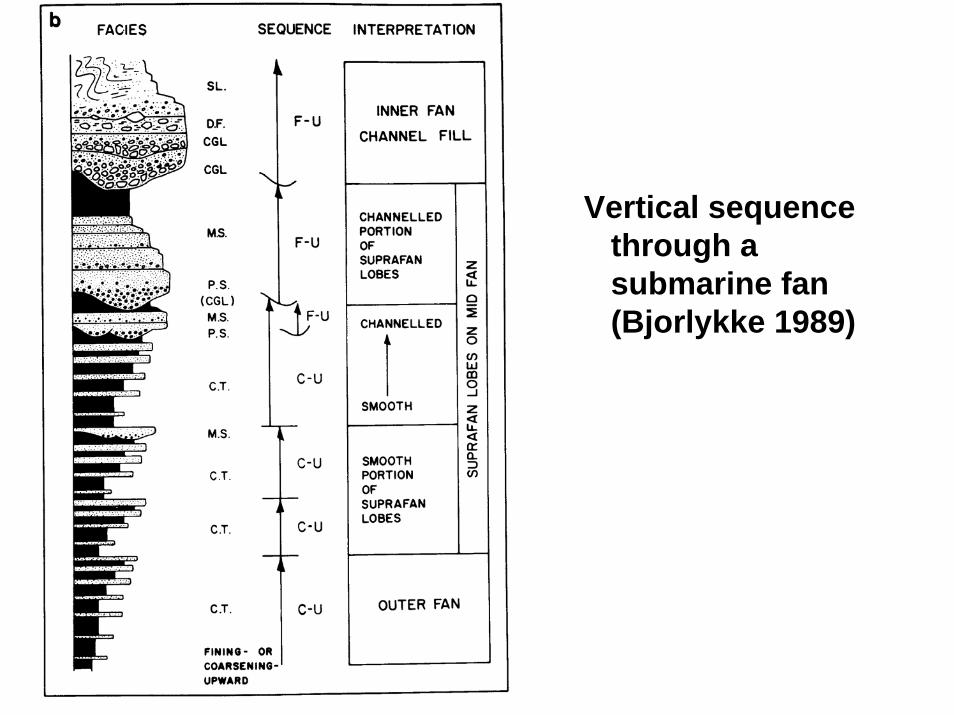
Vertical sequence through a submarine fan (Bjorlykke 1989)
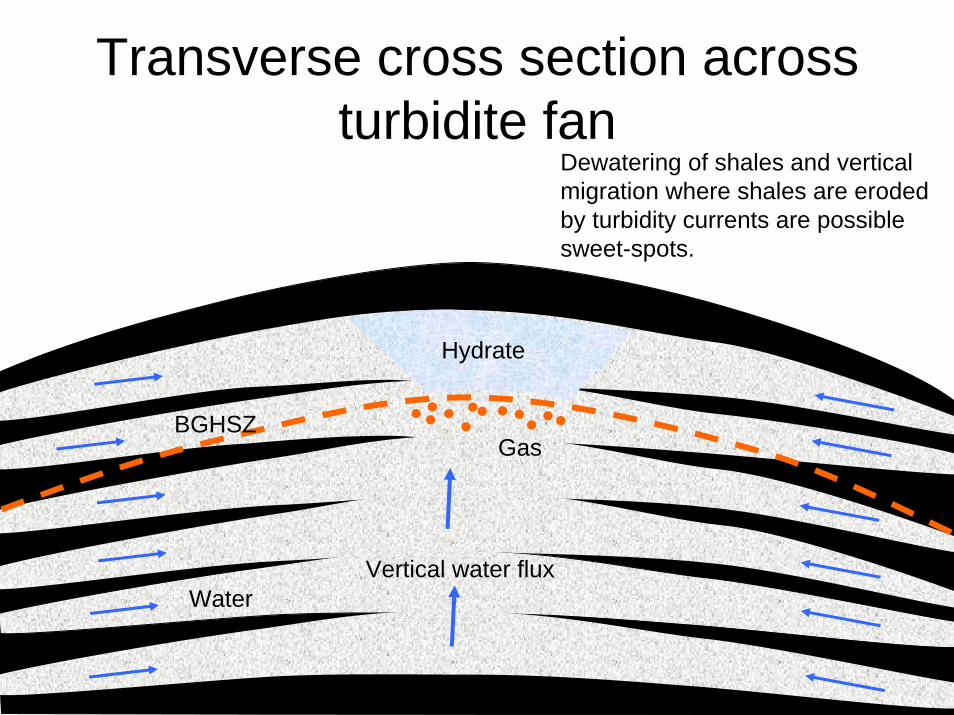
Transverse cross section across turbidite fan
Hydrate
Gas
WaterVertical water flux
BGHSZ
Dewatering of shales and vertical migration where shales are eroded by turbidity currents are possible sweet-spots.
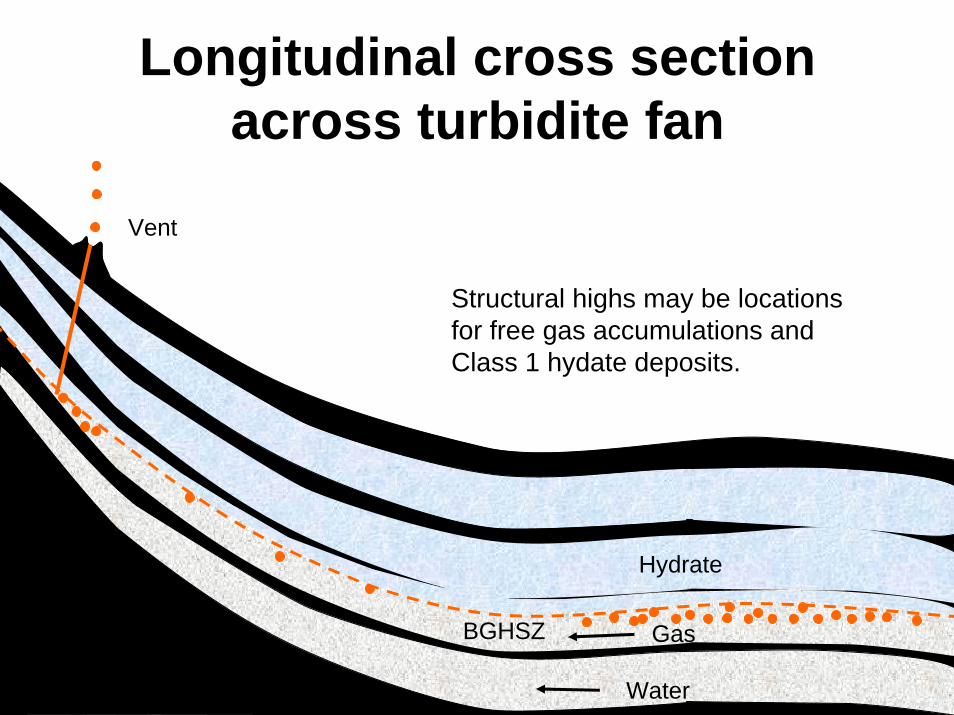
Longitudinal cross section across turbidite fan
BGHSZ Gas
Water
Hydrate
Vent
Structural highs may be locations for free gas accumulations and Class 1 hydate deposits.
Attributes Favoring Economic Hydrate Deposits
• Local upward water flux expected for compacting turbidite fan system– Shales will dewater during compaction;
source rock for biogenic methane– Location with thick, continuous shales will
have water flowing parallel with bedding– Vertical flow between sands possible
where turbidity currents erode clay layer– Vertical flow regions are possible hydrate
sweet-spots in permeable sands
Attributes Favoring Economic Hydrate Deposits
• Crest or channels of submarine turbidite fans– Continuous sands, fining upward separated by
shale layer– Erosion of shale due to turbidity flows gives
vertical groundwater flow paths for hydrate accumulation
– Anticline structure favor accumulation of free gas along nose; Class 1 deposit
– Upstructure along nose, free gas will accumulate and GHSZ will thin until instability results in chimney or vent for escape of free gas and water
Attributes Favoring Economic Hydrate Deposits
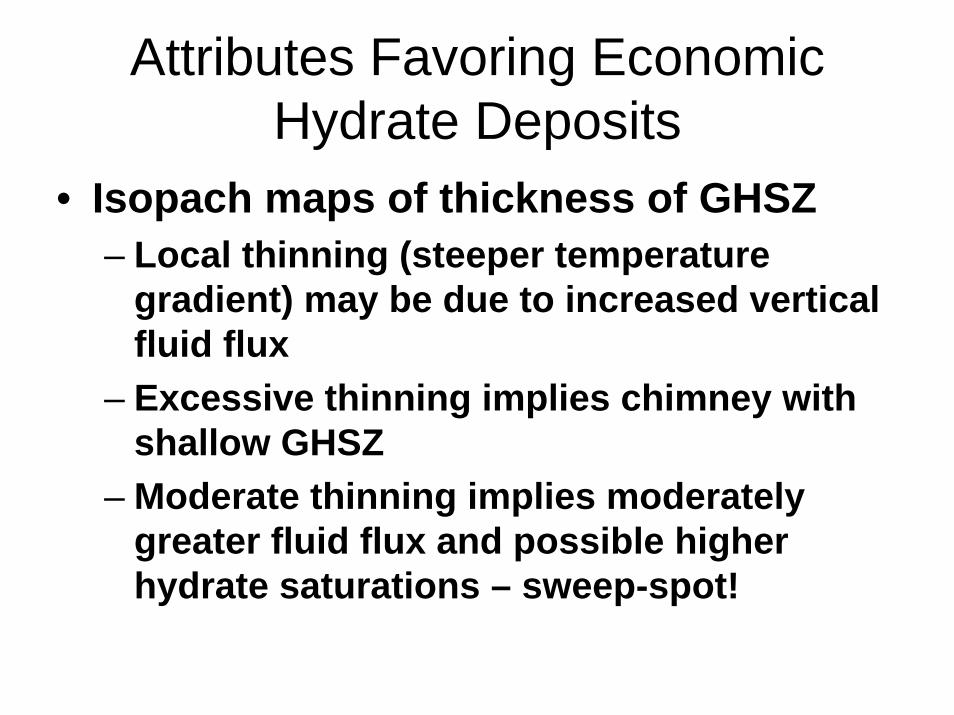
• Isopach maps of thickness of GHSZ – Local thinning (steeper temperature
gradient) may be due to increased vertical fluid flux
– Excessive thinning implies chimney with shallow GHSZ
– Moderate thinning implies moderately greater fluid flux and possible higher hydrate saturations – sweep-spot!
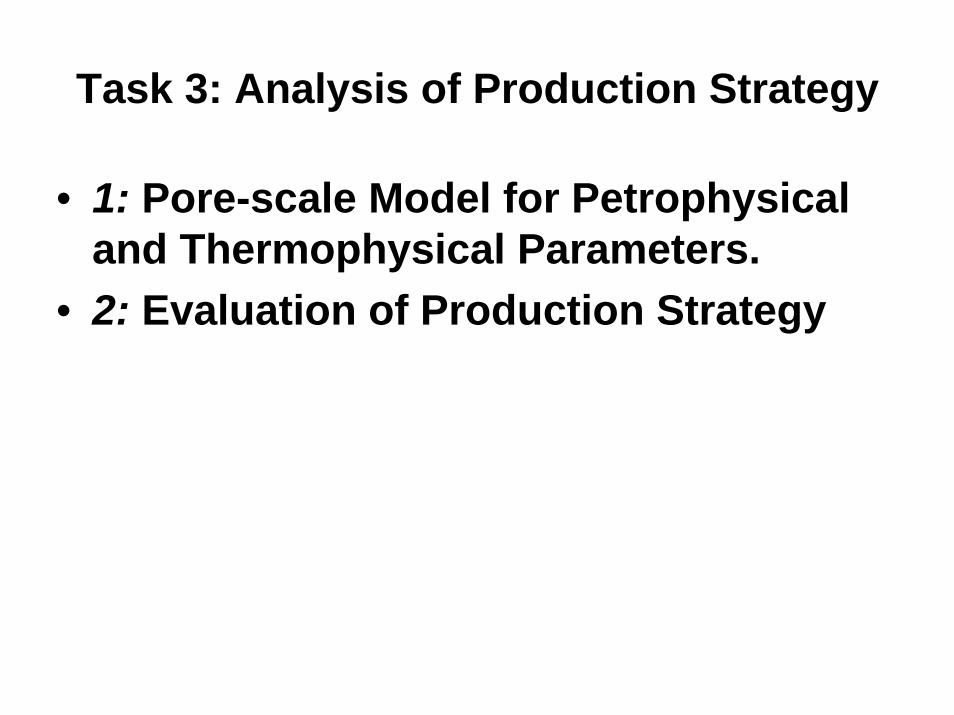
Task 3: Analysis of Production Strategy
• 1: Pore-scale Model for Petrophysical and Thermophysical Parameters.
• 2: Evaluation of Production Strategy
Attributes Favoring Economic Hydrate Deposits
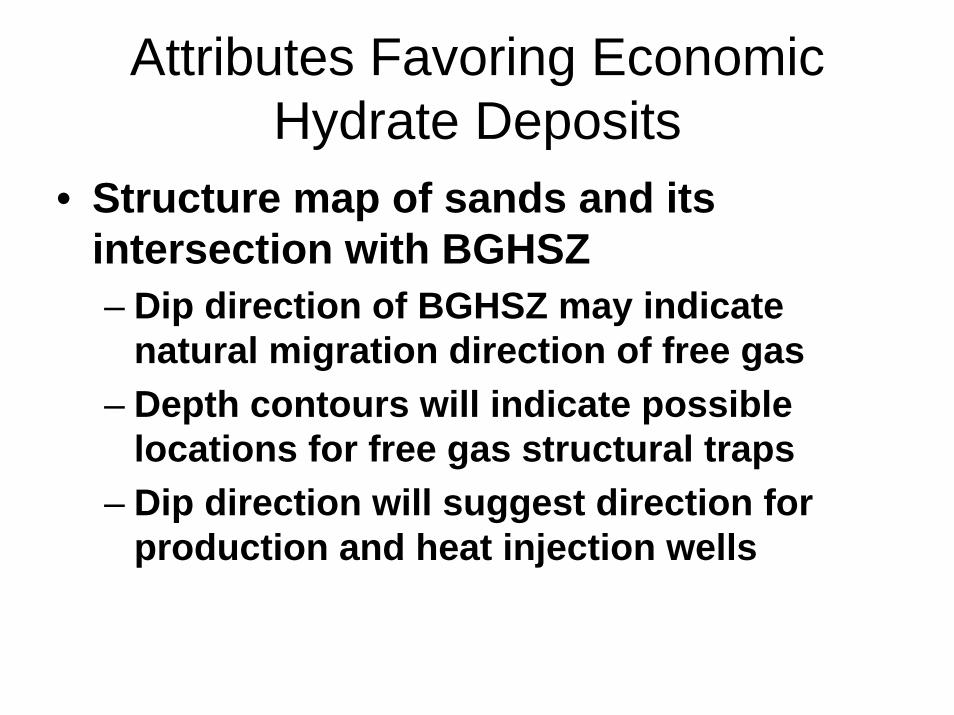
• Structure map of sands and its intersection with BGHSZ– Dip direction of BGHSZ may indicate
natural migration direction of free gas– Depth contours will indicate possible
locations for free gas structural traps– Dip direction will suggest direction for
production and heat injection wells
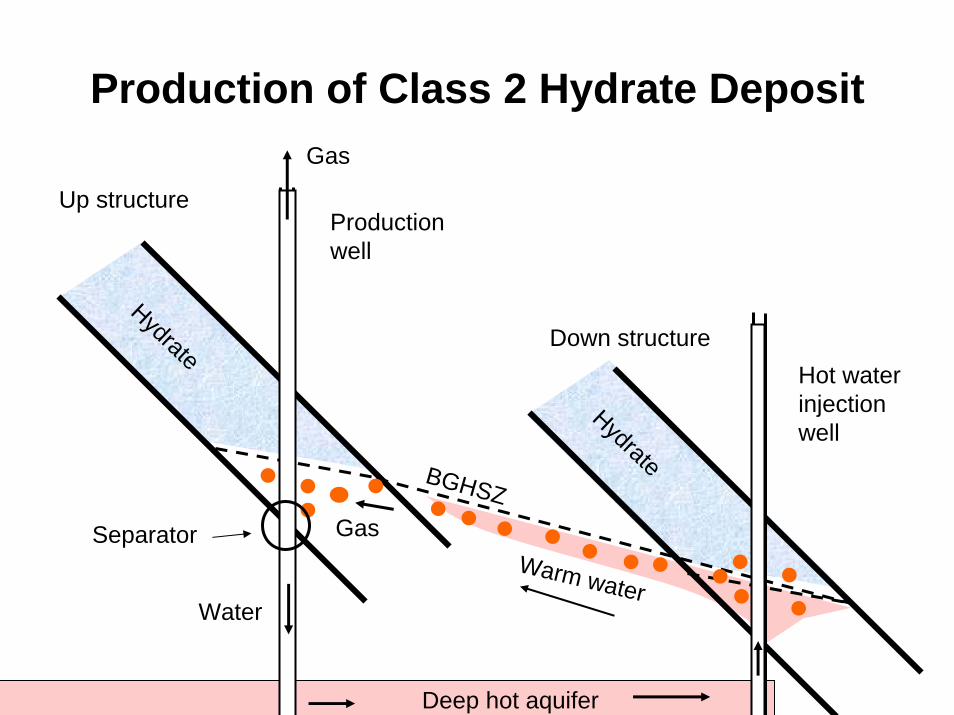
Production of Class 2 Hydrate Deposit
Hydrate
HydrateBGHSZ
Down structure
Production well
Hot water injection well
Warm water
Gas
Up structure
Gas
Water
Deep hot aquifer
Separator
Task 4: Seafloor and Borehole Stability
Problems/Risks
1) Up-scaling
- lab to field extrapolation (space and time)
2) Sample Disturbance
- limited to samples collected for geotech work
- impacts of pressure/temperature cycles on specimens with hydrate
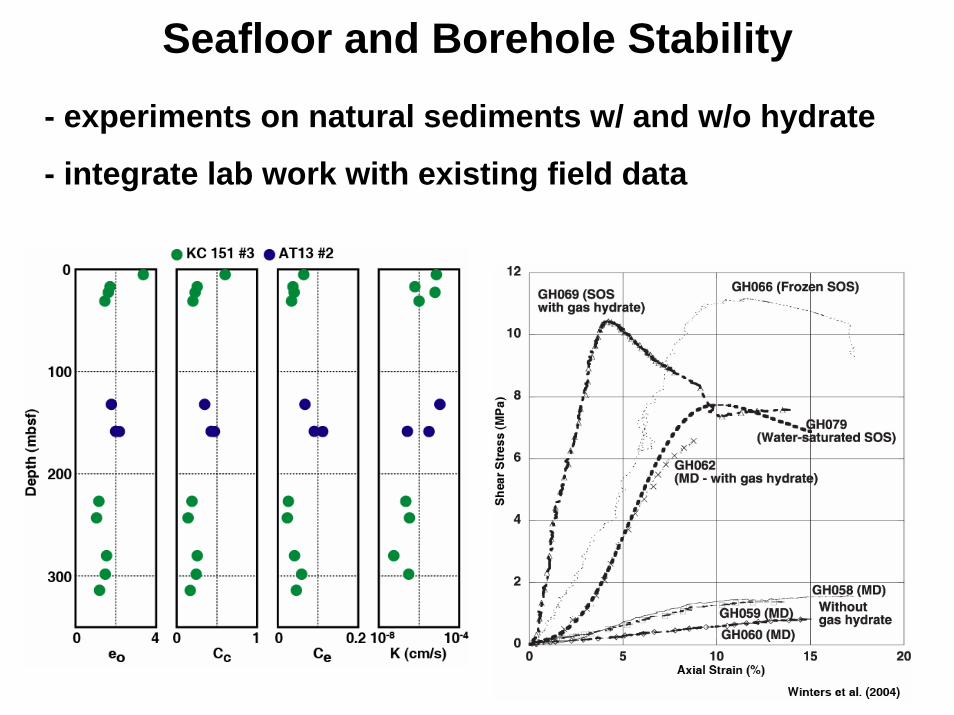
Seafloor and Borehole Stability
- experiments on natural sediments w/ and w/o hydrate
- integrate lab work with existing field data
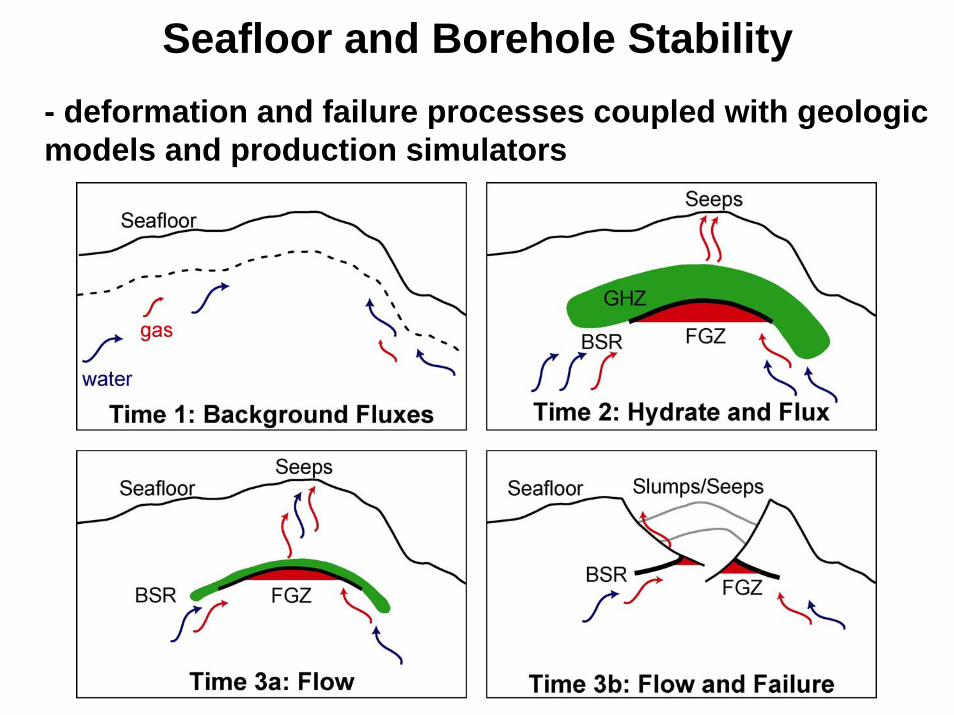
- deformation and failure processes coupled with geologic models and production simulators
Seafloor and Borehole Stability
Task 5: Geophysical Imaging of Gas Hydrate and Free Gas Accumulations
• 1: Preliminary processing and inversion of seismic data.
• 2: Final 1-D elastic and 2-D acoustic waveform inversion.
• 3: Rock physics modeling.
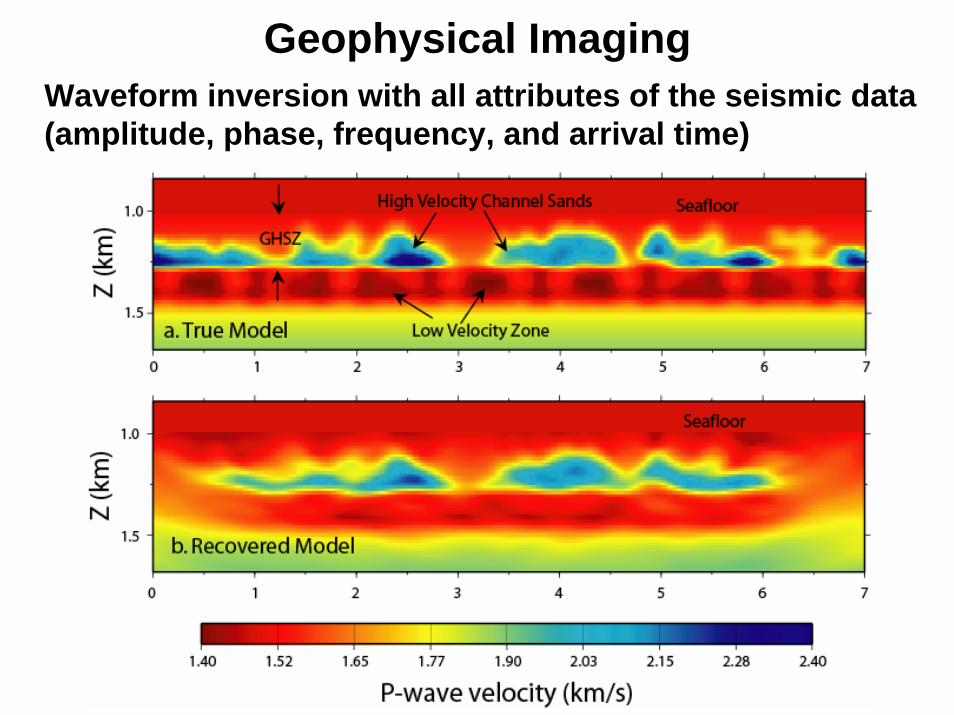
Geophysical ImagingWaveform inversion with all attributes of the seismic data (amplitude, phase, frequency, and arrival time)
• (a) Channel stratigraphy constructed after K-G basin (India) interpretations.
• The channel axis form pathways for fluid migration thus accumulating gas-hydrates.
• Base of hydrate stability zone coincides with base of channel systems.• Free-gas dispersed in the underlying sediments• Gas-hydrates and free-gas respectively increase and decrease the P-
wave velocities of their host sediments.
• (b) recovered using waveform inversion applied on synthetic seismic data simulated from (a)
• Synthetic data had broad bandwidth (1-21 Hz; low frequencies are critical for good recovery) and high signal to noise ratio.
• Waveform inversion utilizes all attributes of the seismic data (amplitude, phase, frequency, and arrival time to solve for velocity perturbations) as opposed to conventional seismic imaging.
Geophysical Imaging
Geophysical Imaging
• Key Objectives• Develop a regional 2-D acoustic model • At selected locations develop 1-D elastic model
• Challenges• Finding a suitable seismic dataset
– Broad frequency spectrum– High signal-to-noise ratio
• Finding supplementary information– Cores– Well logs
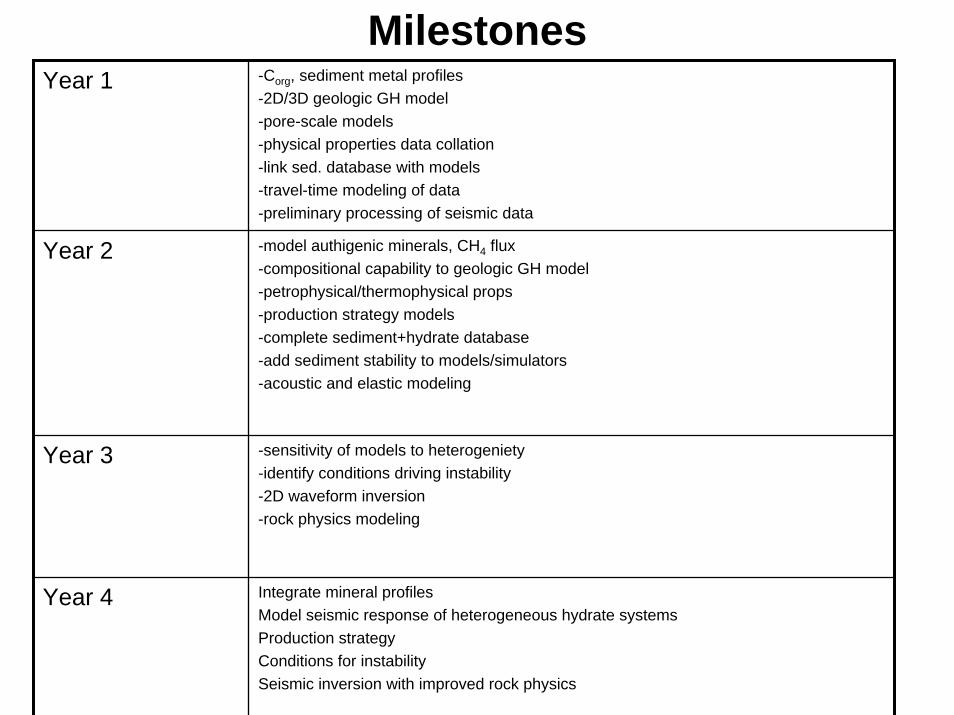
MilestonesYear 1 -Corg, sediment metal profiles
-2D/3D geologic GH model-pore-scale models-physical properties data collation-link sed. database with models-travel-time modeling of data-preliminary processing of seismic data
Year 2 -model authigenic minerals, CH4 flux-compositional capability to geologic GH model-petrophysical/thermophysical props-production strategy models-complete sediment+hydrate database-add sediment stability to models/simulators-acoustic and elastic modeling
Year 3 -sensitivity of models to heterogeniety-identify conditions driving instability-2D waveform inversion-rock physics modeling
Year 4 Integrate mineral profilesModel seismic response of heterogeneous hydrate systemsProduction strategyConditions for instabilitySeismic inversion with improved rock physics
Budget
2007 2008 2009 2010 Total
DOE $316,520 $331,135 $356,049 $259,335 $1,263,039
Cost -Share
$130,349 $112,029 $114,882 $118,711 $475,971
Total $446,869 $443,164 $470,931 $378,086 $1,739,010
Text for George to go with the slide
• The P-wave velocities of the synthetic model in (a) have been recovered in (b) using waveform inversion of synthetic seismic data. Waveform inversion utilizes all attributes of the seismic data (amplitude, phase, frequency, and arrival time to solve for velocity perturbations) as oppsoed to conventional seismic imaging.
• The model in (a) reflects a channel stratigraphy constructed after interpretations in the K-G basin. The axis of channels provide pathways for focused fluid migration thus becoming seats of gas-hydrate accumulation. The net effect of the gas-hydrates is enhancement of the P-wave velocity of the channel axes. Free-gas dispersed in the underlying sediments decreases the P-wave velocities.


![Methane Hydrate in Confined Spaces ‐ An …...methane hydrate may be twice that of all other fuels combined.[6] Indeed, the future exploitation of methane hydrate from marine turned](https://static.documents.pub/doc/80x56/5fbd4d959cef473df80642b6/methane-hydrate-in-confined-spaces-a-an-methane-hydrate-may-be-twice-that.jpg)


