Page 1
Accepted Manuscript
Title: Detection and quantification of the selective EP4receptor antagonist CJ-023423 (grapiprant) in canine plasmaby HPLC with spectrofluorimetric detection
Author: Virgina De Vito Alessandro Saba Hong-Ki Lee HelenOwen Amnart Poapolathep Mario Giorgi
PII: S0731-7085(15)30224-7DOI: http://dx.doi.org/doi:10.1016/j.jpba.2015.11.004Reference: PBA 10327
To appear in: Journal of Pharmaceutical and Biomedical Analysis
Received date: 26-5-2015Revised date: 2-11-2015Accepted date: 3-11-2015
Please cite this article as: Virgina De Vito, Alessandro Saba, Hong-Ki Lee, HelenOwen, Amnart Poapolathep, Mario Giorgi, Detection and quantification of the selectiveEP4 receptor antagonist CJ-023423 (grapiprant) in canine plasma by HPLC withspectrofluorimetric detection, Journal of Pharmaceutical and Biomedical Analysishttp://dx.doi.org/10.1016/j.jpba.2015.11.004
This is a PDF file of an unedited manuscript that has been accepted for publication.As a service to our customers we are providing this early version of the manuscript.The manuscript will undergo copyediting, typesetting, and review of the resulting proofbefore it is published in its final form. Please note that during the production processerrors may be discovered which could affect the content, and all legal disclaimers thatapply to the journal pertain.
Page 2
1
Detection and quantification of the selective EP4 receptor antagonist CJ-023423 (grapiprant) in
canine plasma by HPLC with spectrofluorimetric detection
Virgina De Vito,a Alessandro Saba,b Hong-Ki Lee,c Helen Owen,d Amnart Poapolathep,e Mario
Giorgif*
a Department of Veterinary Medicine, University of Sassari, Via Vienna 2, 07100, Sassari, Italy
b Department of Surgical, Medical, Molecular Pathology and Critical Area, University of Pisa, Italy
c School of Veterinary Science, University of Queensland, Gatton Campus, Gatton, QLD, 4343,
Australia
d College of Veterinary Medicine, Chungnam National University, Daejeon, South Korea
c Department of Veterinary Pharmacology, Faculty of Veterinary Medicine, University of Kasetsart,
Bangkok, Thailand
e Department of Veterinary Sciences, University of Pisa, Via Livornese (lato monte), 56122 San Piero a
Grado, Pisa, Italy
*Corresponding author. Tel.: +39 50 2210154; fax: +39 50 2210182.
E-mail address: [email protected] (M. Giorgi)
Page 3
2
Graphical Abstract
Grapiprant
Page 4
3
Highlights
Grapiprant is a new active ingredient under development for the control of pain and inflammation
A validated HPLC method with spectrofluorimetric detection has been developed
The chromatographic runs were specific with no interfering peaks at the retention times of the analyte
and IS
LOD and LLOQ were 3 and 10 ng/ml
This method is suitable for pharmacokinetic investigations such as guiding dose adjustment
Page 5
4
Abstract
Grapiprant, a novel pharmacologically active ingredient, acts as a selective EP4 receptor antagonist
whose physiological ligand is prostaglandin E2 (PGE2). It is currently under development for use in
humans and dogs for the control of pain and inflammation associated with osteoarthritis. The aim of the
present study was to develop an easy and sensitive method to quantify grapiprant in canine plasma and
to apply the method in a canine patient. Several parameters, both in the extraction and detection method
were evaluated. The final mobile phase consisted of ACN:AcONH4 (20 mM) solution, pH 4 (70:30,
v/v) at a flow rate of 1 mL/min. The elution of grapiprant and IS (metoclopramide) was carried out in
isocratic mode through a Synergi Polar-RP 80A analytical column (150 mm × 4.6 mm). The best
excitation and emission wavelengths were 320 and 365 nm, respectively. Grapiprant was extracted
from the plasma using CHCl3, which gave a recovery of 88.1 ± 10.22% and a lower limit of
quantification (LLOQ) of 10 ng/mL. The method was validated in terms of linearity, limit of detection
(LOD), LLOQ, selectivity, accuracy and precision, extraction recovery, stability, and inter-laboratory
cross validation, according to international guidelines. The chromatographic runs were specific with no
interfering peaks at the retention times of the analyte and IS, as confirmed by HPLC-MS experiments.
In conclusion, this was a simple and effective method using HPLC-FL to detect grapiprant in plasma,
which may be useful for future pharmacokinetic studies.
Abbreviation: Prostaglandin E2 (PGE2); Internal Standard (IS); Acetonitrile (ACN); Methanol
(MeOH); Dichloromethane (CH2Cl2); Diethyl ether (Et2O); Chloroform (CHCl3); 2-propanol (C3H8O);
Ethyl acetate (AcOEt); Ammonium acetate (AcONH4); Hydrochloric acid (HCl); Sodium hydroxide
(NaOH); Electrospray ionization source (ESI); Positive ion mode (Ps); Negative ion mode (Ng); Limit
of detection (LOD); Lower limit of quantification (LLOQ); Quality control (QC); Relative error (RE);
Standard deviation (SD); Probability level (P); Percentage relative standard deviation (RSD); The area
under the concentration versus time curve (AUC0-).
Keywords: CJ-023,423; Grapiprant, Fluorescence; HPLC; Dog
Page 6
5
1. Introduction
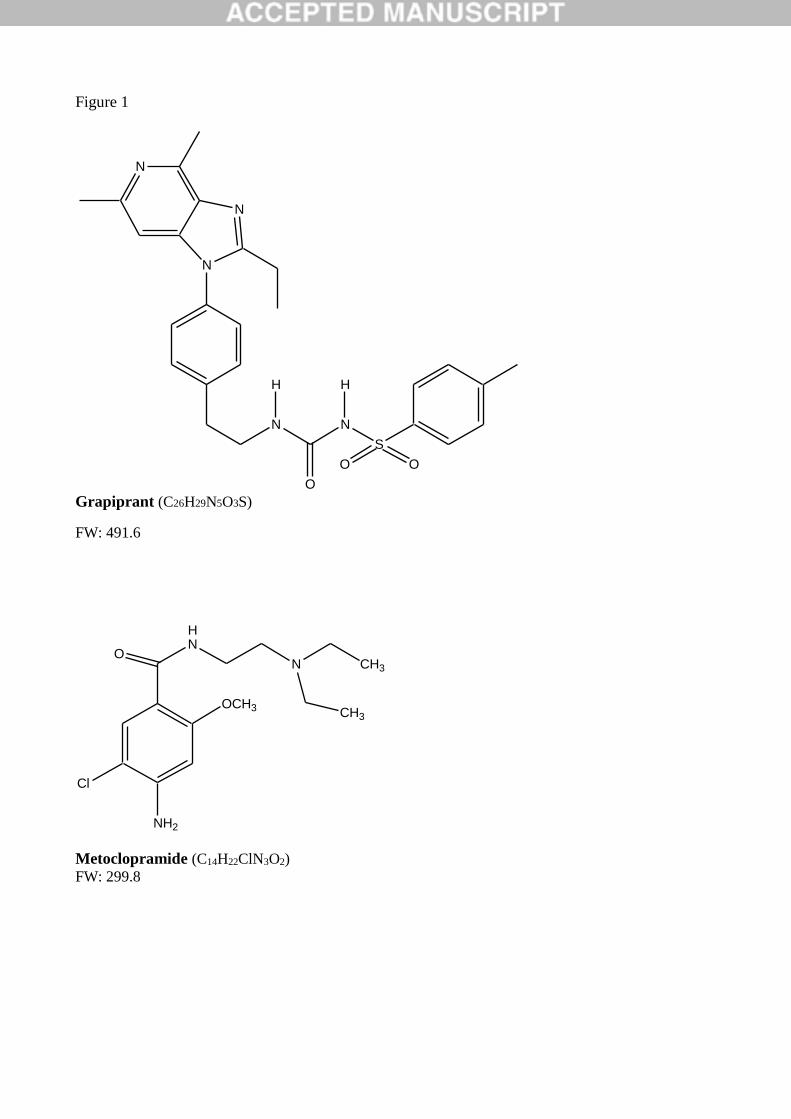
CJ-023423, 1-[2-[4-(2-ethyl-4,6-dimethylimidazo[4,5-c]pyridin-1-yl)phenyl]ethyl]-3-(4-
methylphenyl)sulfonylurea (Fig. 1), is a novel pharmacologically active ingredient. It has a molecular
weight of 491.61 g/mol, a predicted octanol-water partitioning coefficient of 4.56 and a very poor water
solubility (0.041 mg/L). CJ-023423, also called grapiprant, works as selective EP4 receptor antagonist
[1] whose physiological ligand is prostaglandin E2 (PGE2). The EP4 receptor is one of four G-protein
coupled receptors (EP1, EP2, EP3 and EP4) that mediate the action of PGE2. The EP4 receptor
mediates PGE2-elicited sensitization of sensory neurons [2] and studies have demonstrated that EP4 is
a major receptor in mediating pain associated with both rheumatoid and osteoarthritis [3, 4] and in
inflammation [1, 5]. Grapiprant is currently under development for use in humans and dogs for the
control of pain and inflammation associated with osteoarthritis [6]. Very few data are available on this
active ingredient so far and no data is reported concerning its quantification in biological matrices.
Since grapiprant is an under development drug at advanced stage [7] an easy and accurate method for
its detection in plasma is needed for pharmacokinetic studies. The aim of the present study was two-
fold: i) to develop an easy and sensitive method to quantify grapiprant in canine plasma, ii) to apply the
optimized method for the detection of its pharmacokinetics in a dog.
2. Materials and methods
2.1. Chemicals and reagents
Pure grapiprant analytical standard (> 99.0% purity) was obtained from Cayman Chemical (Ann
Arbor, MI, USA). The Internal Standard (IS) metoclopramide powder (> 99.0% purity) was supplied by
Sigma-Aldrich (St. Louis, MO, USA). Other compounds tested as IS were flupirtine, sulpiride and
trazodone, supplied in powder form by Sigma-Aldrich (St. Louis, MO, USA).
Page 7
6
HPLC grade acetonitrile (ACN), methanol (MeOH), dichloromethane (CH2Cl2), diethyl ether
(Et2O), chloroform (CHCl3), 2-propanol (C3H8O) and ethyl acetate (AcOEt) were purchased from Merck
(Darmstadt, Germany). Ammonium acetate (AcONH4) was purchased from Carlo Erba (Milano, Italy).
Hydrochloric acid (HCl) and sodium hydroxide (NaOH) were purchased from Sigma-Aldrich (St. Louis,
MO, USA). Deionised water was produced by a Milli-Q Millipore Water System (Millipore, MA, USA).
All the other reagents and materials were of analytical grade and supplied from commercial sources. The
aqueous and organic components of the mobile phase, degassed under pressure, were mixed by the
HPLC. The LC mobile phases were filtered through 0.2 μm cellulose acetate membrane filters (Sartorius
Stedim Biotech S.A., Aubagne Cedex, France) with a solvent filtration apparatus. Canine control plasma
samples (containing the same anti-coagulant used in samples from the treated dog) were supplied by the
blood bank of the Veterinary hospital at University of Pisa.
2.2. Standard solutions
Singular stock solutions of grapiprant and IS in MeOH were prepared, each with a concentration
of 1,000 μg/mL by using volumetric flasks. These were stored at -80° C.
To obtain a final concentration of 100 μg/mL, appropriate dilutions of stock standard solutions were
prepared by diluting 1 mL of each solution to 10 mL. Successively, these solutions of grapiprant and IS
were diluted in glass tubes (10 mL), to reach final concentrations of 10, 5 and 1 μg/mL. These were
stored at -20° C.
Page 8
7
2.3. Instrumentation and chromatographic conditions
2.3.1. HPLC-FL
The HPLC system was an LC Jasco (Como, Italy) consisting of quaternary gradient system (PU
980) and an in-line multilambda fluorescence detector (FP 1520). The chromatographic separation assay
was performed with a Synergi Polar-RP 80A analytical column (150 mm × 4.6 mm inner diameter, 4 µm
particle size [Phenomenex, Bologna, Italy]) preceded by a security guard column with the same
stationary phase [Phenomenex, Bologna, Italy]. The system was maintained at 25° C. A range of diverse
aqueous phases (compatible with the subsequent use of the triple quadrupole mass spectrometer) were
tested (10, 20, 50 mM AcONH4). Once the optimal aqueous phase was detected a range of pH (3.5, 4.0,
5.0 and 6.0) was assayed to optimize the chromatographic separation. The flow rate was tested in the
range 0.7-1.2 mL/min. The final mobile phase consisted of ACN:AcONH4 (20 mM) solution, pH 4
(70:30, v/v) at a flow rate of 1 mL/min. The elution of grapiprant and IS was carried out in isocratic
mode. The best excitation and emission wavelengths were found after scanning a 2 µg/mL grapiprant
solution by the fluorescence detector. They were set as 320 and 365 nm for excitation and emission,
respectively.
2.3.2. HPLC-MS
HPLC-MS chromatographic separation was performed by an Agilent Technologies (Santa Clara,
CA, USA) 1290 HPLC system which consisted of a high pressure pump, auto-sampler and column oven,
coupled to an AB-Sciex (Concord, Ontario, Canada) API 4000 triple quadrupole mass spectrometer,
equipped with Turbo V electrospray ionization source (ESI). Main parameters were as follows: mass
range m/z 50-700 Th; source temperature, 600° C; ionspray voltage in positive ion mode (Ps), 5.5 kV;
ionspray voltage in negative ion mode (Ng), -4.2 kV; declustering potential in Ps, 50 V; declustering
Page 9
8
potential in Ng, -50 V. HPLC runs were carried out by using the same parameters used for HPLC-FL
and reported in the previous section.
2.4. Sample extraction
The procedure was performed in a 15 mL snap cap polypropylene tube. A 0.5 mL aliquot of
plasma sample was added to 100 μL of IS (25 μg/mL). After vortexing for 30 sec, 4 mL of CHCl3 was
added, and the sample was vortexed (30 sec), shaken (60 osc/min, 10 min) and centrifuged at 21,913 g
for 10 min at 25° C. Three mL of the supernatant was collected in a separate clean snap cap polypropylene
tube. The organic phase was evaporated under a gentle stream of nitrogen and reconstituted with 500 μL
of mobile phase. 50 μL of this latter solution was injected onto the HPLC-FL.
2.5. Animal treatment and sampling
Blood samples were obtained from one healthy male Beagle dog administered with an
intravenous injection of grapiprant (0.5 mg/kg) in the right jugular vein. The drug was prior dissolved on
ethanol (10 mg/mL), then diluted with sterile water for injection (9:1 v:v) and immediately injected
(injection rate 5 mL/min). The blood (2 to 3 mL) was collected via catheter, previously inserted in the
left jugular vein, at assigned times (0, 15, 30, 45 min and 1, 2, 4, 6, 8, 10 and 24 h). The blood was
immediately placed into collection tubes containing lithium heparin. The samples were centrifuged at
1,006 g within 30 min of collection and the harvested plasma was frozen immediately and stored at -20°
C. Samples were analysed within 1 week from the collection. Immediately prior to the analysis, the
samples were thawed at room temperature. Standard animal care and handling were performing
according to the Directive 2010/63/UE. The dog was fed with standard food (Hill's Science Diet Pet
Food, Topeka, KS) to avoid potential food impurities (i.e. preservatives) in the blood.
Page 10
9
2.6. Bioanalytical method validation
The described method was validated in terms of linearity, limit of detection (LOD), lower limit
of quantification (LLOQ), selectivity, accuracy and precision, extraction recovery, stability, and inter-
laboratory cross validation, according to international guidelines on the bioanalytical method validation
[8].
2.6.1. Calibration curves
The peak area ratios of grapiprant (10, 25, 50, 75, 100, 150, 250 and 500 ng/mL) to IS were
plotted against corresponding nominal concentrations of grapiprant. Accuracy (percentage relative
error) for each calibration sample and correlation coefficient were determined in three assay batches.
Linearity of the regression curve in the range 10-500 ng/mL was assessed on the base of the residual
plot, the fit test and the back calculation (within 20% of known amount).
2.6.2. Selectivity and potential impact of breeds
Drug-free blank canine plasma from six individuals of 4 different breeds was extracted and then
assayed. The chromatograms were inspected for any endogenous peaks that could interfere with
retention time of grapiprant or IS. Since nothing is known about the metabolism of this drug in canine
species, in order to assess potential interferences due to metabolites formed in vivo, HPLC-MS analyses
were performed (see 2.4 HPLC-MS).
2.6.3. Accuracy and precision
Intra- and inter-batch reproducibility was examined by assessing accuracy and precision using
quality control (QC) samples (LLOQ, 10 ng/mL; LQC, 50 ng/mL; MQC, 200 ng/mL; HQC, 500
ng/mL; six replicates/concentration) that cover the calibration range. The relative error (RE) and
Page 11
10
percentage relative standard deviation (RSD) were calculated to assess accuracy and precision,
respectively. The acceptance criteria for RE and RSD were ± 15 and 15%, respectively, for LQC,
MQC, and HQC samples, and ± 20 and 20% for the LLOQ samples. Dilution integrity was investigated
using QC samples at 500 and 1000 ng/mL. The QC samples (six replicates/concentration) diluted by
10- and 50-fold, respectively, with blank canine plasma were extracted and then assayed. Accuracy and
precision at each dilution were determined to find whether RE and RSD did not exceed ± 15 and 15%,
respectively.
2.6.4. Extraction recovery
Extraction recovery was evaluated at three levels using LQC (50 ng/mL), MQC (200 ng/mL)
and HQC (500 ng/mL) samples for grapiprant and 5 g/mL for the IS. Extraction recovery was
determined by dividing the peak area of the analytes spiked to blank plasma before extraction by that
spiked after extraction. Then mean recovery at each concentration was represented from three
replicates.
2.6.5. Stability
Stability of grapiprant in canine plasma was assessed at two levels using the LQC and HQC
samples (three replicates/concentration). Bench-top stability in plasma up to 4 h, freeze–thaw stability
from -20° C to ambient temperature in plasma (up to three cycles), the stability in processed samples at
10° C for 23 h and the stability of grapiprant and the IS in stock solution at both 4° C (for 37 and 36
days for grapiprant and the IS, respectively) and ambient temperature (for 17 h), were evaluated.
Samples were considered stable when accuracy was within ± 15%.
Page 12
11
2.6.6. Inter-laboratory cross-validation
Sample analysis of grapiprant across the dog trial was performed in two different laboratories
(Veterinary Pharmacology and Chromatography, both at the University of Pisa). As a cross-validation
study is required to compare grapiprant concentrations in plasma across clinical trials as per the
bioanalytical guidance from the European Medicines Agency [8] and US Food and Drug
Administration [9], grapiprant concentrations in 9 plasma samples were determined at the two
laboratories. Percentage bias was calculated using the following equation:
% bias = (Clab1 − Clab2)
(Clab1 + Clab2)2
x 100
where Clab1 and Clab2 are plasma grapiprant levels in laboratory 1 and 2, respectively.
3. Theory and calculation
3.1. Quantification
When unknown samples were assayed, a control and a fortified blank sample were processed
simultaneously for quality control. LOD and LLOQ were determined as analyte concentrations giving
signal-to-noise ratios of 3 and 10, respectively.
3.2. Statistical analysis and pharmacokinetic evaluation
The statistical analyses were evaluated using the student-t test. The results were presented as
mean ± standard deviation (SD). All the analyses were conducted using GraphPad InStat (GraphPad
Software, Inc, La Jolla CA, USA). In all the experiments, differences were considered significant if the
Page 13
12
associated probability level (P) was lower than 0.05.
The pharmacokinetic calculations were carried out using WinNonlin v 5.3.1 (Pharsight Corp,
Sunnyvale, CA, USA). The area under the concentration versus time curve (AUC0-) was calculated
using the linear trapezoidal rule. Changes in plasma concentrations of grapiprant were evaluated using
the standard bi-compartmental analysis, and the relative pharmacokinetic parameters were determined
using standard compartmental equations [10].
4. Results and discussion
4.1. Detection method development
Derivation of the mobile phase was achieved using mobile phases that were suitable for the triple
quadrupole mass spectrometer. The ACN:AcONH4 (20 mM) 30:70 v/v, provided the best separation of
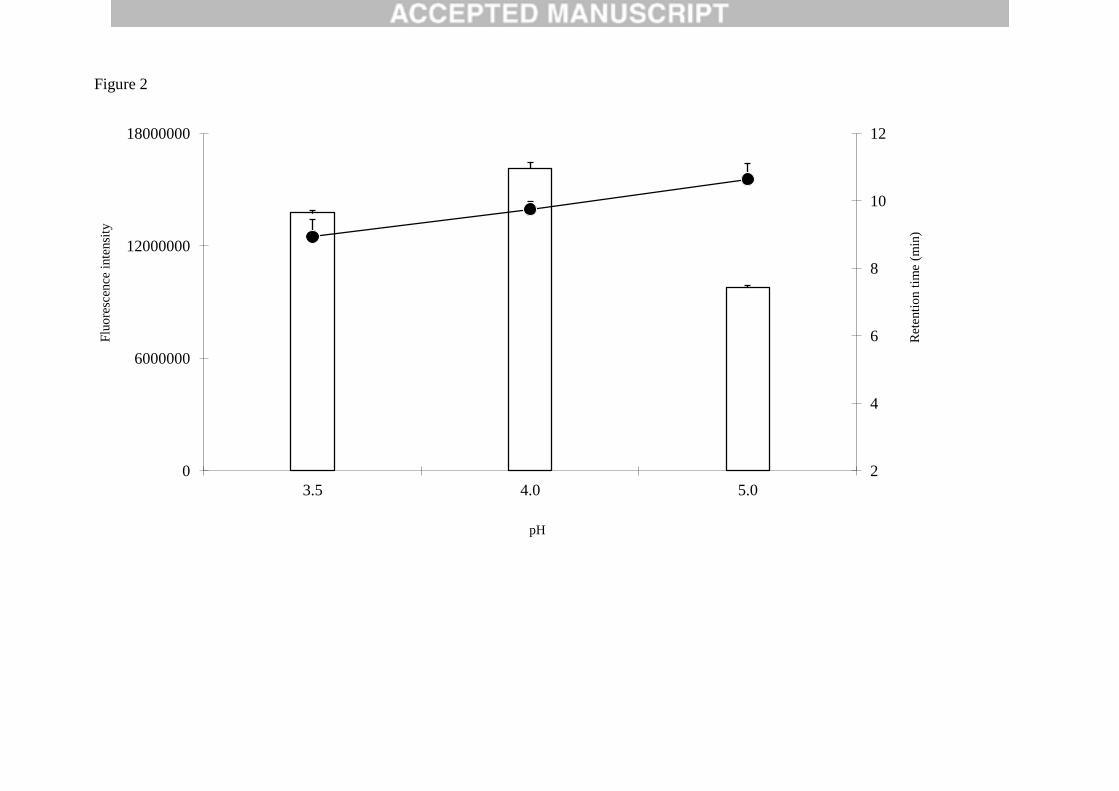
grapiprant from the matrix impurities. A range of buffer pH (3.5, 4.0, 5.0 and 6.0) was assayed to optimise
the chromatographic separation and analytes fluorescence intensity. The highest fluorescence intensity
of grapiprant was shown at pH 4.0, while retention times increased with increasing buffer pH. pH 5 and
6 buffers showed peak of grapiprant with both long retention time and broad shape. At pH 3.5 the peak
of grapiprant resulted partially overlapped to a matrix impurities, reducing the selectivity of the method.
The optimal pH value was 4.0 (Fig. 2).
Different flow rates between 0.7-1.2 mL/min were tested using Luna C18 (150x4.6 mm) with 3
µm particle size and Synergi Polar-RP 80A (150x4.6 mm) with 4 µm particle size as stationary phase.
The Synergi analytical column provided the best peak resolution. The final mobile phase resulted in
ACN:AcONH4 (20 mM) pH 4.0 (30:70 v/v) with a 1 mL/min flow rate. It was an excellent compromise
in terms of sensitivity and peak separation. Excitation and emission wavelengths were tested within the
ranges 200-300 and 310-450 nm, respectively. The wavelength values of 320 and 365 nm resulted in
Page 14
13
optimal excitation and emission, respectively.
For the IS, four compounds (metoclopramide, sulpiride, flupirtine and trazodone) with amenable
chemical features were evaluated. Among these, flupirtine showed a little extraction recovery (36 ± 9%)
while sulpiride showed a short retention time (about 2 min) co-eluting with the matrix impurities.
Metoclopramide and trazodone resulted two good options. Trazodone showed a good recovery and a
good sensitivity to the wave lengths used in the final method, but partially overlapped to an impurity
peak. Metoclopramide was the best candidate with a similar extraction recovery of grapiprant, an
excellent resolution and a short retention time (3.52 ± 0.2 min).
4.2. Optimization of the extraction method
The influence of both the kind of solvent (important tool for the selectivity of the method) and
number of extraction cycles, were studied in order to find the optimal extraction protocol for grapiprant.
Solvents such as CH2Cl2, AcOEt, Et2O, C3H8O and CHCl3 were examined. Variations in the proportions
of the selected extraction solvents (CH2Cl2:Et2O 3:7; AcOEt:CH2Cl2 3:7, 7:3 v/v; CHCl3:C3H8O 5:1;
AcOEt; CHCl3) were also assessed in terms of recovery and selectivity. CHCl3 was selected as the most
suitable organic solvent in terms of analyte extraction and minimization of matrix components
(interferents). The CHCl3 showed the best recovery of analyte (88.1 ± 10.22%) and IS (84.63 ± 9.36%).
In order to increase the recovery, acidic (0.1 N HCl) and alkaline (0.1 N NaOH) conditions were tested
in the CHCl3 extraction method. No improvement of selectivity and recovery was observed (Table 1).
Moreover, the influence of the number of extraction cycles on the extraction efficiency was also
evaluated. The extraction time was set to 10 min and the number of extraction cycles was varied from
one to two. A protocol using two extraction cycles did not significantly increase the recovery. Finally, a
single extraction cycle was selected to ensure an efficient extraction of grapiprant and IS.
Page 15
14
4.3. Method validation
It was necessary to validate each step in the analytical method because to date, methodology for
the determination of grapiprant from plasma samples through a fluorescence detector is yet to be
published.
4.3.1. Linearity
The calibration curve was linear in the investigated range of concentrations (10-500 ng/mL).
Linearity of the regression curve was assessed on the base of the residual plot, the fit test and the back
calculation. The linear regression equation is reported in Table 2.
According to EMA guidelines [8], limit of detection (LOD) and lower limit of quantification (LLOQ)
were calculated based on signal-to-noise approach. The LOD and LLOQ were 3 and 10ng/mL (Table 2),
suggesting a good sensitivity of the method.
4.3.2. Selectivity and potential interference of the breed
Representative chromatograms of grapiprant and IS are shown in Fig. 3. No endogenous
interference was observed at the elution time of grapiprant and IS in canine plasma from six individuals
of 4 different breeds (data not shown). The retention times of grapiprant and the IS were 9.75 ± 0.23 and
3.52 ± 0.2 min, respectively. No matrix impurities were found at the grapiprant and IS retention times.
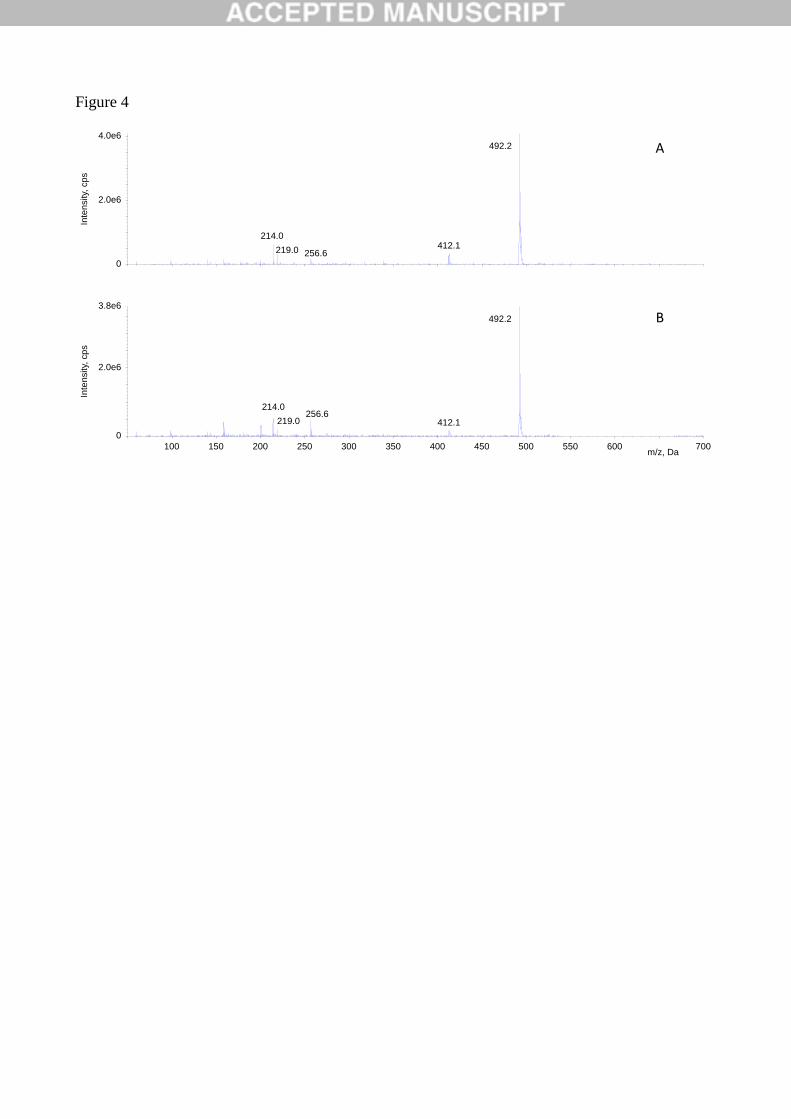
In addition, HPLC-MS analyses carried out by full scan acquisitions, both in positive and negative ion
mode, evaluated that no impurities due to potential metabolites co-eluted with grapiprant and IS peaks.
In particular, full scan acquisitions in positive ion mode exhibited peaks at 9.85 and 3.77 min, associated
to MS spectra containing [M+H]+ ions at m/z 492.2 and 300.2 Th, and attributable to grapiprant and IS,
respectively. On the contrary, acquisitions in negative ion mode did not provide any chromatographic
peak at the same retention times. The absence of any impurities co-eluting with IS and grapiprant was
Page 16
15
confirmed by the accurate comparison between the MS spectra from authentic standards and the spectra
from the above mentioned peaks. The MS spectra relative to grapiprant are shown in Fig. 4.
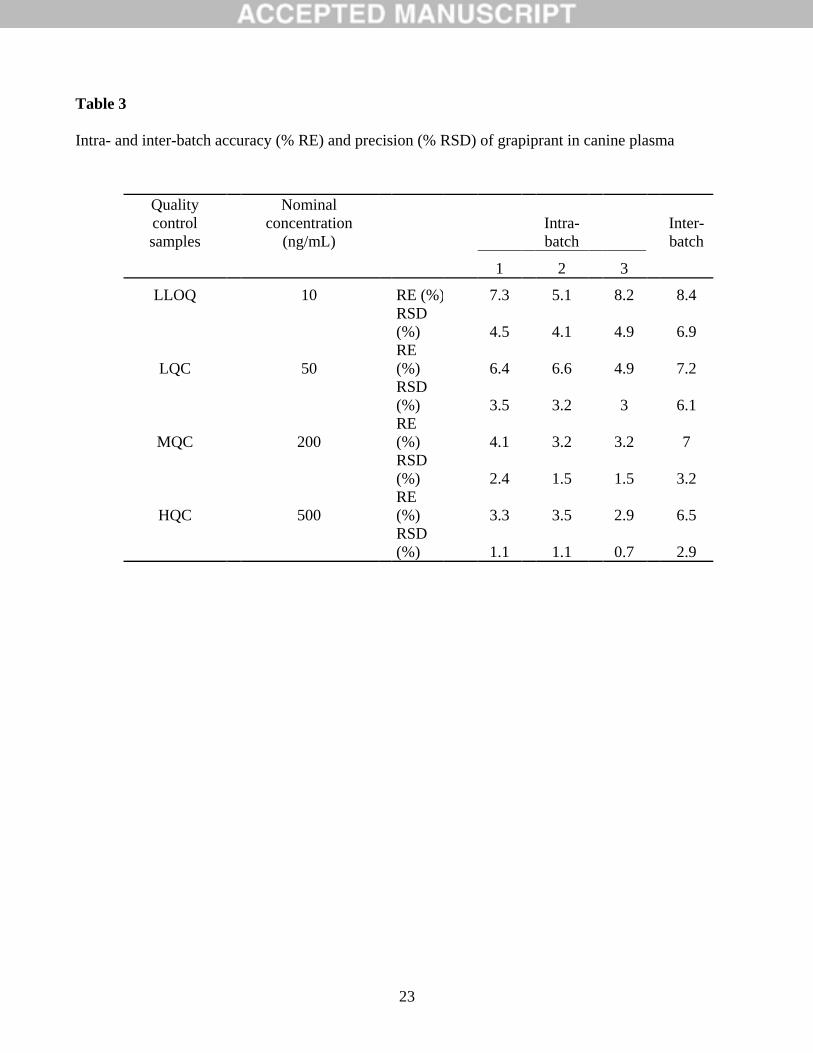
4.3.3. Accuracy and Precision
The intra- (n=6) and inter-batch (n=3) precision and accuracy for the grapiprant assay are shown
in Table 3. Four QC levels (LLOQ, LQC, MQC and HQC) were evaluated to determine RE (accuracy)
and RSD (precision). The intra-batch RE and RSD of LLOQ samples ranged from 5.1 to 8.2% and from
4.1 to 4.9%, respectively; the inter-batch RE and RSD were 8.4 and 6.9%, respectively. For LQC, MQC
and HQC samples, the intra-batch RE and RSD did not exceed 6.6 and 3.5%, respectively, and the inter-
batch RE and RSD were within 7.2 and 6.1%, respectively. These results were within the acceptance
criteria recommended by the bioanalytical guidelines of European Medicines Agency (2012) and US
Food and Drug Administration [9]. QC samples of grapiprant diluted 10-fold showed RE and RSD values
of -3.7 and 2.1%, respectively, and the RE and RSD values of 50-fold diluted samples were -1.96 and
7.3%, respectively.
4.3.4. Extraction recovery
The extraction recovery of grapiprant from canine plasma was 87.2, 92.2 and 89.3% at LQC,
MQC and HQC levels, respectively, and the recovery of the IS was 84.6%. A similar percentage
recovery (average 88.1 ± 10.22) was achieved between grapiprant across all concentrations tested and
the IS.
4.3.5. Stability
Stability studies were performed to ensure good reproducibility of the method. Results in all the
stability assessment showed that the accuracy was ≤ ± 8.5%. Bench-top stability in plasma was ensured
Page 17
16
for 4 h at ambient temperature and grapiprant was stable even after three freeze–thaw cycles from -20°
C to ambient temperature. Grapiprant in processed samples for injection was stable for 23 h at 10° C.
The stability of grapiprant and the IS in standard solution was ensured up to 37 and 36 days,
respectively, at 4° C, and for at least 17 h at ambient temperature. These findings indicated that the
storage of grapiprant in plasma samples at -20° C is adequate, and no stability-related problems would
be expected during routine analyses for pharmacokinetic study.
4.3.6. Cross-validation
Comparison of grapiprant levels in plasma for the inter-laboratory cross-validation study
showed that the two laboratories gave comparable results with bias ≤ ± 10.9%. These findings suggest
that the cross-validation study was successful and data obtained in the two different laboratories can be
compared. These results demonstrate that the method enables accurate quantification of grapiprant. The
validation parameters were in agreement with the EMA guidelines [8].
4.4. Application of the method
The applicability of this method has been verified by determining grapiprant concentration in
canine plasma after intravenous treatment of 0.5 mg/kg of grapiprant. HPLC analysis of the plasma
confirmed the presence of grapiprant in time-related amounts (Fig. 5). The amounts of the drug in plasma
ranged between 38.9 ng/mL (10 h) and 779 ng/mL (15 min). This latter sample was found to be outside
the linear range of the calibration curve (10-500 ng). It was subsequently diluted with mobile phase and
re-injected. The described method allowed monitoring of the concentration versus time curves of the
analyte and the calculation of the basic pharmacokinetic parameters (Table 4). The pharmacokinetic
profile showed a two-compartment elimination phase. One faster up to 4h (steep) and one slower 4 to 10
h (shallow). These data have to be carefully evaluated because the drug was administered as pure
Page 18
17
substance in a single dog. Additional studies with larger animal sample size administered with the
marketed drug formulation are necessary to obtain a sound pharmacokinetic evaluation.
Conclusion
The analytical method described in this work provides selective and accurate analysis of
grapiprant without the need for expensive clean up steps, solvent consuming flows or expensive devices.
The low LLOQ shows that the method could be useful for drug measurement even when administered in
sub-clinical doses. These features make the described method suitable for pharmacokinetic investigations
including drug-drug interaction, and potential future applications such as guidance for dose adjustment.
In summary, this is the first time that the HPLC-FL technique is reported detecting grapiprant.
This method (extraction, separation and applied techniques) is simple and efficacious for the
determination of grapiprant in canine plasma.
Acknowledgements
None of the authors has any financial or personal relationships that could inappropriately
influence or bias the content of the paper. This work was supported by athenaeum funds (University of
Pisa) PRA 2016 (3_PRA_2016_8). The preparation of manuscript was not supported by any external
funding.
Page 19
18
References
[1] K. Nakao, A. Murase, H. Ohshiro, T. Okumura, K. Taniguchi, Y. Murata, M. Masuda, T, Kato,
Y. Okumura, J. Takada, CJ-023,423, a Novel, Potent and Selective Prostaglandin EP4 Receptor
Antagonist with Antihyperalgesic Properties. J. Pharmacol. Exp. Ther. 322 (2007) 686-693.
[2] M.D. Southall, M.R. Vasko, Prostaglandin receptor subtypes, EP3C and EP4, mediate the
prostaglandin E2-induced cAMP production and sensitization of sensory neurons. J. Biol. Chem. 276
(2001) 16083-16091.
[3] P. Clark, S.E. Rowland, D. Denis, M.C. Mathieu, R. Stocco, H. Poirier, J. Burch, Y. Han, L.
Audoly, A.G. Therien, D. Xu, MF498 [N-{[4-(5,9-Diethoxy-6-oxo-6,8-dihydro- 7H-pyrrolo[3,4-
g]quinolin-7-yl)-3-methylbenzyl]sulfonyl}-2-(2- methoxyphenyl)acetamide], a selective E prostanoid
receptor 4 antagonist, relieves joint inflammation and pain in rodent models of rheumatoid and
osteoarthritis. J. Pharmacol. Exp. Ther. 325 (2008) 425-434.
[4] Q. Chen, K. Muramoto, N. Masaaki, Y. Ding, H. Yang, M. Mackey, W. Li, Y. Inoue, K.
Ackermann, H. Shirota, I. Matsumoto, M. Spyvee, S. Schiller, T. Sumida, F. Gusovsky, M. Lamphier,
A novel antagonist of the prostaglandin E(2) EP(4) receptor inhibits Th1 differentiation and Th17
expansion and is orally active in arthritis models. Br. J. Pharmacol. 160 (2010) 292-310.
[5] C.R. Lin, F. Amaya, L. Barrett, H. Wang, J. Takada, Samad T.A., C.J. Woolf, Prostaglandin E2
receptor EP4 contributes to inflammatory pain hypersensitivity. J. Pharmacol. Exp. Ther. 319 (2006)
1096-1103.
[6] L. Rausch-Derra, L. Rhodes. Safety of the EP4 Receptor Antagonist, GRAPIPRANT,
Administered Daily to Beagle Dogs for 9 Months at 1, 6 and 50 mg/kg. American College of
Veterinary Internal Medicine (ACVIM) Forum (2014)
[7] M. Giorgi, CJ-023,423 (Grapiprant) a potential novel active compound with antihyperalgetic
properties for veterinary patients. Am. J. Anim. Vet. Sci. 10 (2015) 53-56.
Page 20
19
[8] EMA: Guideline on bioanalytical method validation 2011. Guideline on bioanalytical method
validation. EMEA/CHMP/EWP/192217/2009 Rev. 1 Corr. 2**
[9] Guidance for Industry Bioanalytical Method Validation, 2013.
http://www.fda.gov/downloads/drugs/guidancecomplianceregulatoryinformation/guidances/ucm368107
.pdf
[10] M. Gibaldi, D. Perrier, Pharmacokinetics. Drugs and the pharmaceutical sciences, second ed.,
Marcel Dekker, New York, 1982.
Page 21
20
Figure captions
Fig. 1. Molecular structure of grapiprant.
Fig. 2. Effect of the pH on the retention time (spheres) and fluorescence intensity (bars) values.
Fig. 3. Chromatographic curves by HPLC-FL. (A) Chromatographic curve from canine control plasma.
(B) Chromatographic curve from a fortified sample (Grapiprant 100 ng/mL; IS 5 µg/mL). (C)
Chromatographic curve from the plasma sample collected in a treated dog (45 min). (D)
Chromatographic curve from a fortified sample (Grapiprant 10 ng/mL; IS 5 µg/mL).
Fig. 4. Comparison between MS spectra at tR = 9.85 from (A) authentic standard of grapiprant and (B)
the plasma sample collected in a treated dog at 45 min.
Fig. 5. Observed values of plasma concentrations of grapiprant (--) following a single intravenous
dose (0.5 mg/kg BW) in one adult beagle dog.
Page 22
Figure 1
N
N
N
N N
S
HH
O
O O
Grapiprant (C26H29N5O3S)
FW: 491.6
Cl
NH2
OCH3
HN
N CH3
O
CH3
Metoclopramide (C14H22ClN3O2)
FW: 299.8
Page 23
Figure 2
2
4
6
8
10
12
0
6000000
12000000
18000000
3.5 4.0 5.0
Ret
enti
on t
ime
(min
) nn
Flu
ore
scen
ce i
nte
nsi
ty n
n
pH
Page 24
Figure 3
Matrix
Matrix
IS
Grapiprant
IS
Matrix
Grapiprant
IS
Matrix
Grapiprant
A
B
C
D
Page 25
Figure 4
A
0
2.0e6
4.0e6
Inte
nsity,
cp
s
492.2
100 150 200 250 300 350 400 450 500 550 600 700
0
2.0e6
3.8e6
Inte
nsity,
cp
s
492.2
m/z, Da
B
412.1214.0
219.0 256.6
214.0
219.0256.6
412.1
Page 26
Figure 5
10
100
1000
0 2 4 6 8 10
Conce
ntr
atio
n (
ng/m
L)
Time (hours)
Page 27
21
Table 1
Single extraction recovery percentage (± SD) of grapiprant and IS spiked at 100 ng/mL and 5 g/mL,
respectively with different organic solvents
Organic solvents v/v ratio Recovery
Grapiprant IS
CH2Cl2 : Et2O 3:7 46.2±4.6 58.3±3.4
AcOEt:CH2Cl2 3:7 53.4±9.3 51.3±9.8
AcOEt:CH2Cl2 7:3 58.2±2.4 54.2±8.3
CHCl3:C3H8O 5:1 64.1±11.8 52.2±9.2
AcOEt 51.3±10.1 67.1±7.8.4
CHCl3 88.1±10.22 84.6±9.3
CHCl3/HCl 0.1 N 80.22±9.6 71.2±5.4
CHCl3/NaOH 0.1 N 74.3±8.2 86.4±7.4
Page 28
22
Table 2
Summary of validation parameters
Property Grapiprant
Linear range (ng/mL) 10-500
Calibration
equation y=0.013X-0.42
Correlation coefficient (r2) 0.99
LOQ (ng/mL) 10
LOD (ng/mL) 3
Recovery (%) 88.10±10.22
Page 29
23
Table 3
Intra- and inter-batch accuracy (% RE) and precision (% RSD) of grapiprant in canine plasma
Quality
control
samples
Nominal
concentration
(ng/mL)
Intra-
batch
Inter-
batch
1 2 3
LLOQ 10 RE (%) 7.3 5.1 8.2 8.4
RSD
(%) 4.5 4.1 4.9 6.9
LQC 50
RE
(%) 6.4 6.6 4.9 7.2
RSD
(%) 3.5 3.2 3 6.1
MQC 200
RE
(%) 4.1 3.2 3.2 7
RSD
(%) 2.4 1.5 1.5 3.2
HQC 500
RE
(%) 3.3 3.5 2.9 6.5
RSD
(%) 1.1 1.1 0.7 2.9
Page 30
24
Table 4
Predicted pharmacokinetic parameters
Parameters Grapiprant
R2 0.99
AUC (h ng/mL) 1339
HL (h) 6.07
Cl (mL Kg/h) 373
Vss (mL/Kg) 2162
R2, correlation between observed/predicted points; AUC0-
, area under the plasma concentration–time curve
extrapolated to infinity; HL, half life; Cl, total body
clearance; Vss, estimate of the volume of distribution at
steady state.