Page 1
Detection of Denial of Service Attacks
on Application Layer Protocols
Basil Elmasri
Submitted for the Degree of
Doctor of Philosophy
from the
University of Surrey
The Institute of Communication Systems (ICS)
Formerly the Centre for Communication Systems Research (CCSR)
Department of Electronic Engineering
Faculty of Engineering and Physical Sciences
University of Surrey
Guildford, Surrey GU2 7XH, UK
October 2014
Basil Elmasri 2014
Page 2
i
Abstract
This research investigates Denial of Service (DoS) attacks targeting the Internet’s Application
Layer protocols, namely Session Initiation Protocol (SIP), and SPDY, the proposed second
version of the Hyper Text Transfer Protocol (HTTP 2.0). The attack detection methodology was
set using a Statistical Process Control (SPC) technique and Monitoring charts, as well as
Cumulative Summation (CUSUM) and Exponential Weighted Moving Average (EWMA). The
techniques tackle different possible flooding attacks, typically through monitoring the incoming
messages. The system works by sensing sudden changes and detecting abnormal traffic increases
alerting for an attack, and then triggering an alarm on the DoS attack. The scenarios are designed
for SIP to simulate normal traffic behaviour and attack traffic behaviour; some scenarios were
set to have a large ratio of the non-acknowledged requests, and another scenario was set to
simulate a slight increase in the ratio. There was a scenario in which its traffic was imported from
another SIP related research. In addition, the thesis discusses the results of DoS attacks targeting
the SPDY protocol; one scenario is about a large increase in the total number of the sent requests
by a user towards a SPDY proxy, and another scenario is set with a slight increase. SPC was
tested on all previously mentioned scenarios; they have shown significant results in detecting the
attacks, either it was large sudden flooding, or slight low rate DoS flood, as the low rate DoS
attacks are very difficult and sometimes impossible to detect. SPC was tested to aim in false
attack alarms reduction, as they are also difficult to deal with. These techniques were applied in
two approaches: in the first approach, the Offline implementation, the statistical values of the
whole observations, the mean and the standard deviation, are found and then applied to the
equations. In the second approach, the Online implementation, the statistical values were updated
on getting a new observation and immediately applying the SPC equations; there has not been
any other research that discussed such an approach. The first approach represents a system with
previous knowledge and experience of the ongoing traffic. This reduces the overhead spent in
finding the mean and the standard deviation every time a new observation is added to the
sequence. The second approach represents a system that is newly starting with no knowledge, or
a system which was reset after detecting an attack. Finally, a framework was suggested to
effectively employ the previous contributions in detecting the flood of the traffic.
Key words: DoS, SIP, SPDY, HTTP, SPC, CUSUM, EWMA, traffic behaviour.
Email: [email protected]
WWW: http://www.surrey.ac.uk/
Page 3
ii
Acknowledgments
A sincere acknowledgement and loyalty to Professor Khader Elmasri, and Mrs Amineh
Haimour, my beloved parents for the kindness, moral support, strong positive
encouragement, patience, and the financial fund they have gifted me along the years of my
higher education; the completion of this work will be impossible without their care.
I would like also to deeply thank Dr. Aseel Elmasri, Ms. Bara Elmasri, Dr. Muhammad
Elmasri, and Ms. Tala Elmasri, my close siblings that I missed for the whole time I was
absent and for their support and encouragement.
In addition, not to forget my close best friends who I consider like my family, for all their
potential help and support at the time I needed someone close to trust their advice and
support, Dr. Juan Awad, Dr. Alia Ibrahim, Dr. Muhammad Alimari, Dr. Weam Abou
Hamdan, Mrs. Safa Sway, and Eng. Yosef Sayed.
Many special thanks to Dr. Haitham Cruickshank, for accepting me as his PhD student at
the University of Surrey, and for the continuous effort, direct supervision and help during
the years of PhD research and work. Also many special thanks to Prof. Zhilli Sun for his
support and his great opinion towards producing this thesis.
Page 4
Contents
iii
Table of Contents
Abstract ................................................................................................................................. i
Acknowledgments ................................................................................................................ ii
Table of Contents ................................................................................................................ iii
List of Figures ..................................................................................................................... vi
Glossary of Terms .............................................................................................................. xii
Introduction ....................................................................................................................... 1
Objectives ................................................................................................................ 1
Motivations .............................................................................................................. 2
Thesis Contribution .................................................................................................. 2
Thesis Outline .......................................................................................................... 5
The Computer Network Applications and Security .......................................................... 6
Networks and Internet Applications ........................................................................ 6
Session Initiation Protocol ....................................................................................... 7
Hyper Text Transfer Protocol (HTTP) .................................................................. 10
2.3.1 HTTP 2.0 / SPDY ............................................................................................ 11
Security Goals: CIA and DAD Triads ................................................................... 15
2.4.1 Confidentiality ................................................................................................. 16
2.4.2 Integrity ............................................................................................................ 17
2.4.3 Availability ...................................................................................................... 18
Computer Security and Denial of Service ............................................................. 18
2.5.1 Definition ......................................................................................................... 18
2.5.2 Previous Literature about DoS ......................................................................... 20
2.5.3 SIP security and DoS ....................................................................................... 22
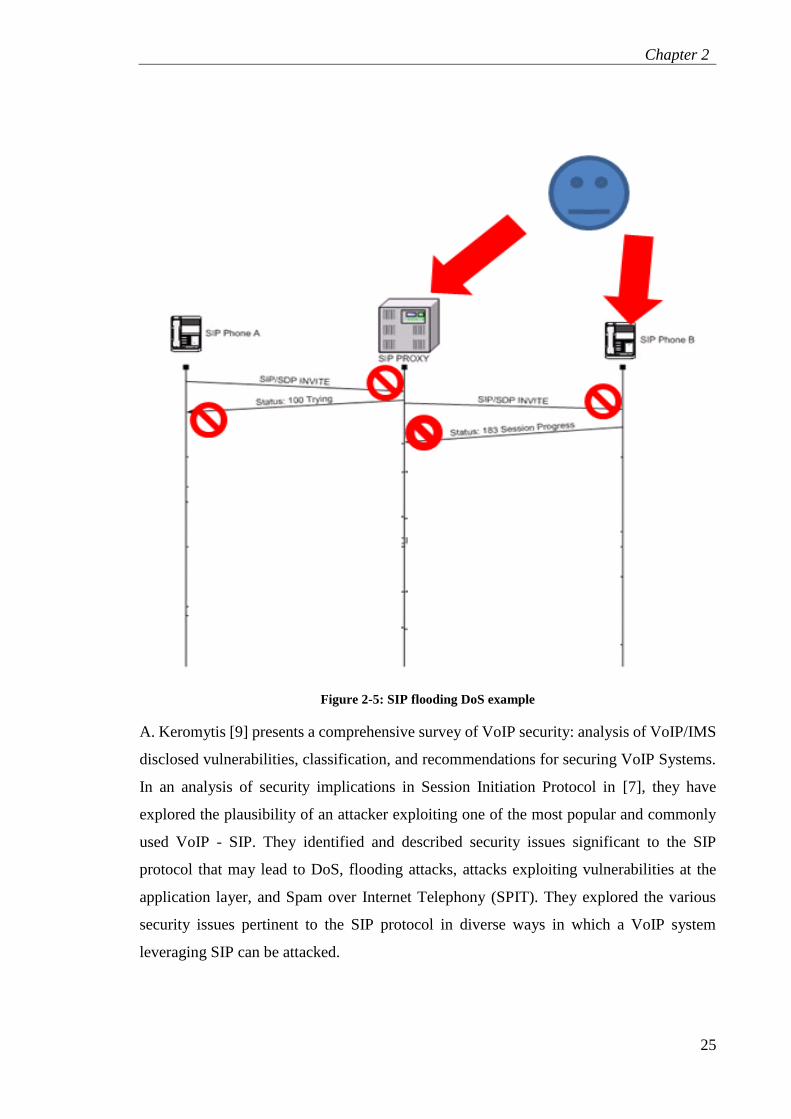
2.5.3.1 SIP message flooding ................................................................................. 24
2.5.4 HTTP and SPDY Security and DoS ................................................................ 28
OPNET Simulation Package .................................................................................. 31
Summary ................................................................................................................ 36
Page 5
Contents
iv
Quality Control: Statistical Process Charts (SPC) .......................................................... 37
Cumulative Summation (CUSUM) ........................................................................ 38
3.1.1 CUSUM Control Limits ................................................................................... 40
Exponentially Weighted Moving Average (EWMA) ............................................ 40
3.2.1 EWMA Control Limits .................................................................................... 41
Statistical Process Control and Denial of Service .................................................. 43
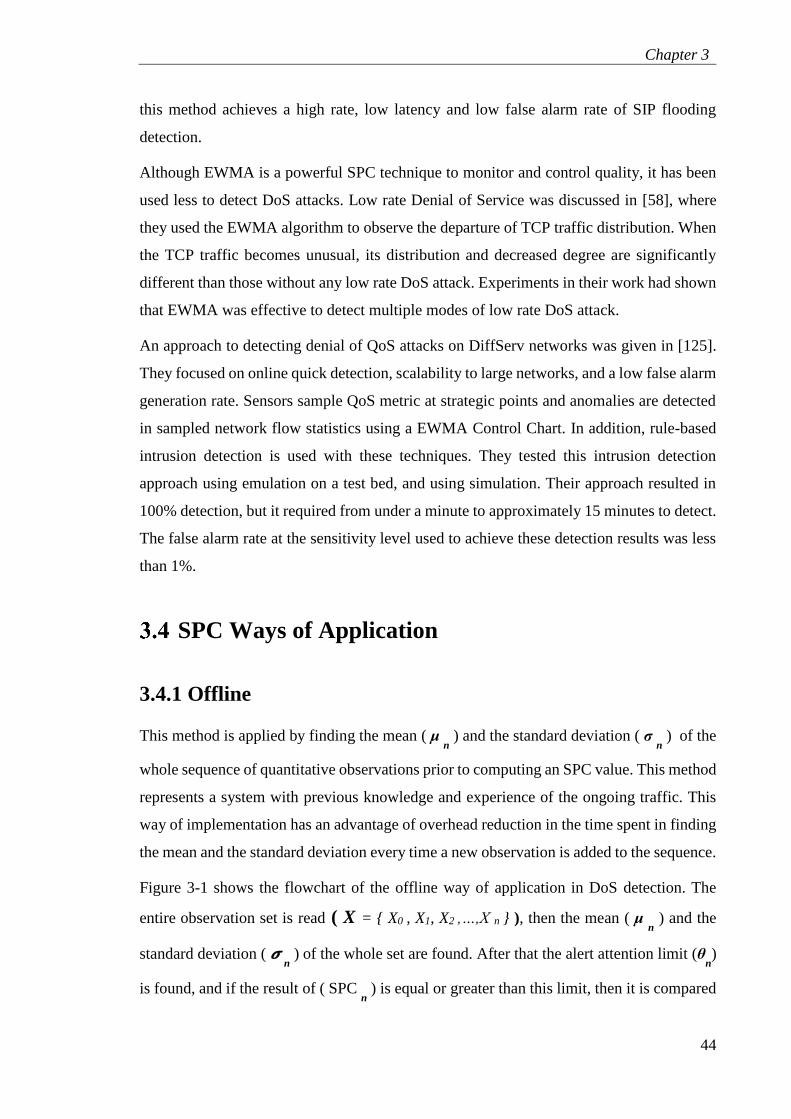
SPC Ways of Application ...................................................................................... 44
3.4.1 Offline .............................................................................................................. 44
3.4.2 Online ............................................................................................................... 45
Summary ................................................................................................................ 46
DoS Targeting SIP: Results and Analysis ...................................................................... 47
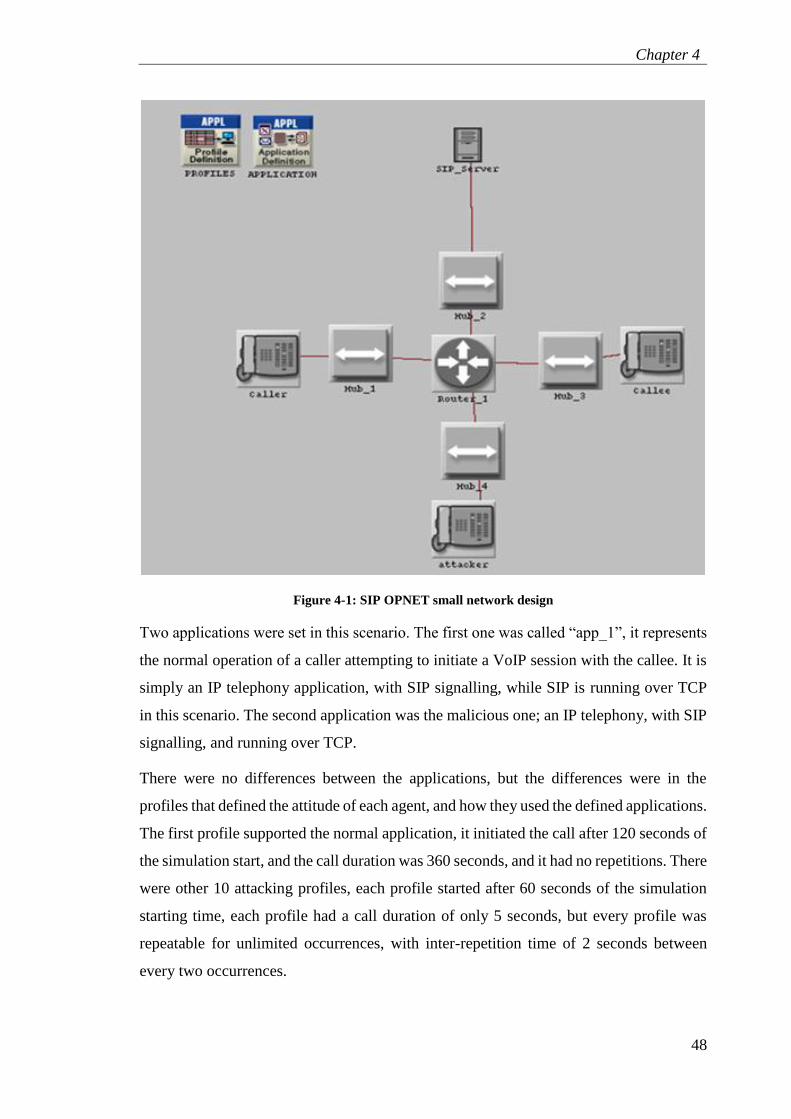
DoS impact on SIP: OPNET Simulation ............................................................... 47
4.1.1 Small network simulation ................................................................................ 47
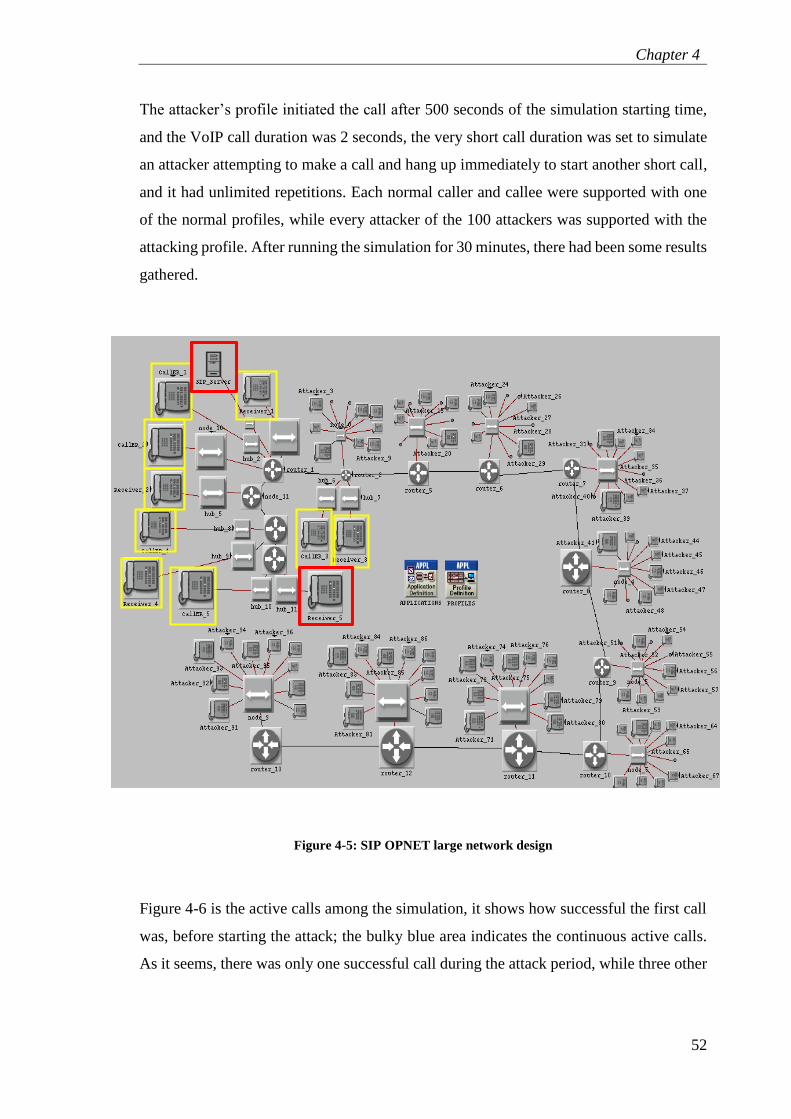
4.1.2 Large network simulation ................................................................................ 51
4.1.3 Experimental Limitations ................................................................................. 55
Traffic Generation .................................................................................................. 56
4.2.1 Simulation Generated Data set ......................................................................... 57
4.2.2 Imported Traffic ............................................................................................... 61
Detecting DoS attacks on SIP using CUSUM ....................................................... 62
4.3.1 Generated SIP Traffic Simulation Results using CUSUM .............................. 63
4.3.1.1 CUSUM on First Scenario: Large Differences .......................................... 63
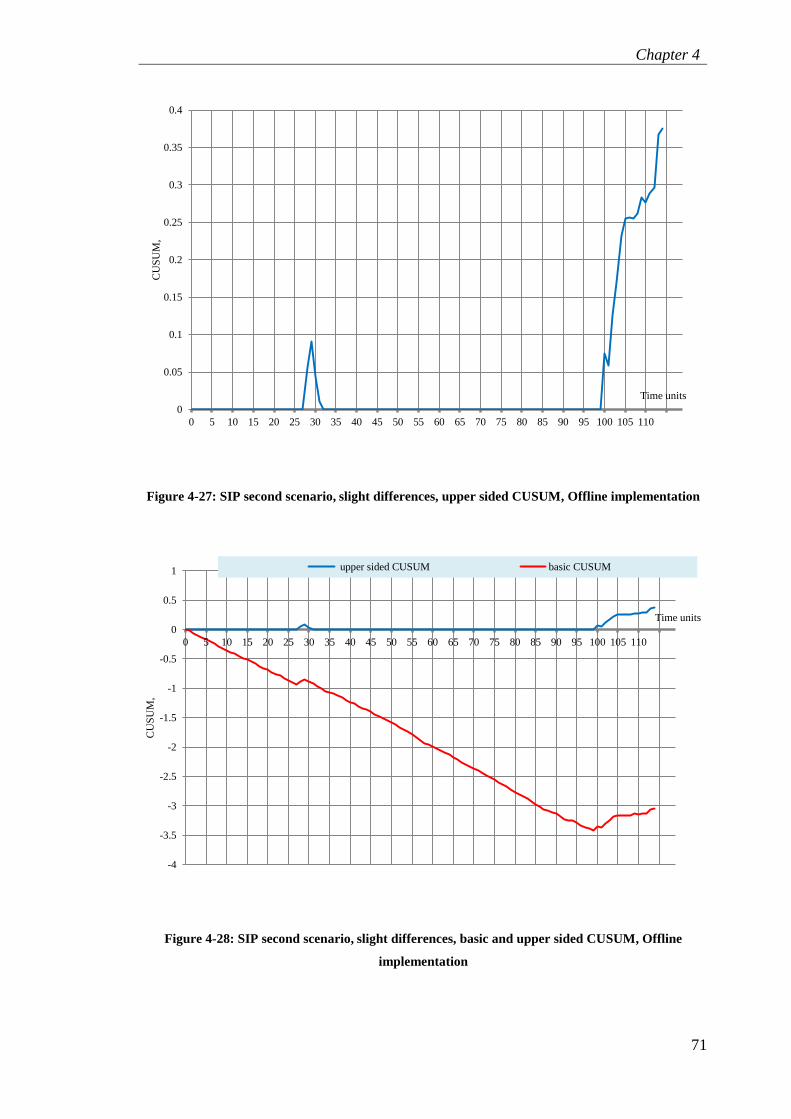
4.3.1.2 CUSUM on Second Scenario: Small Differences ..................................... 70
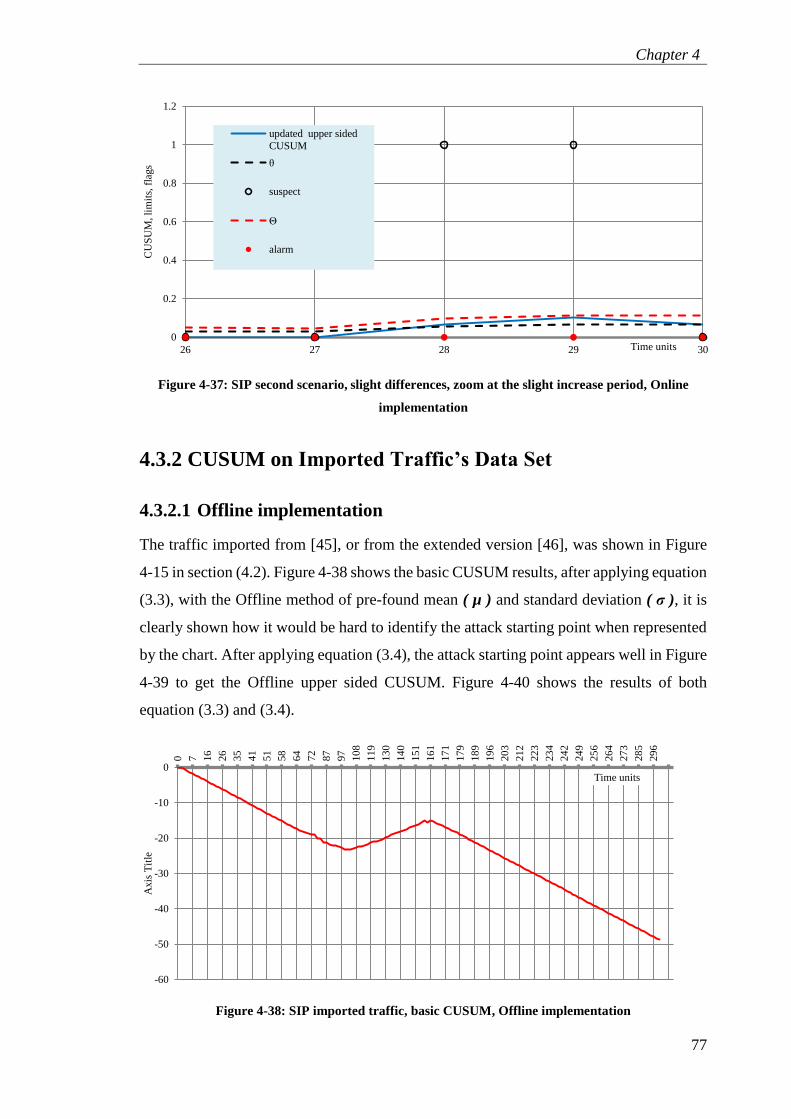
4.3.2 CUSUM on Imported Traffic’s Data Set ......................................................... 77
4.3.2.1 Offline implementation .............................................................................. 77
4.3.2.2 Online implementation ............................................................................... 79
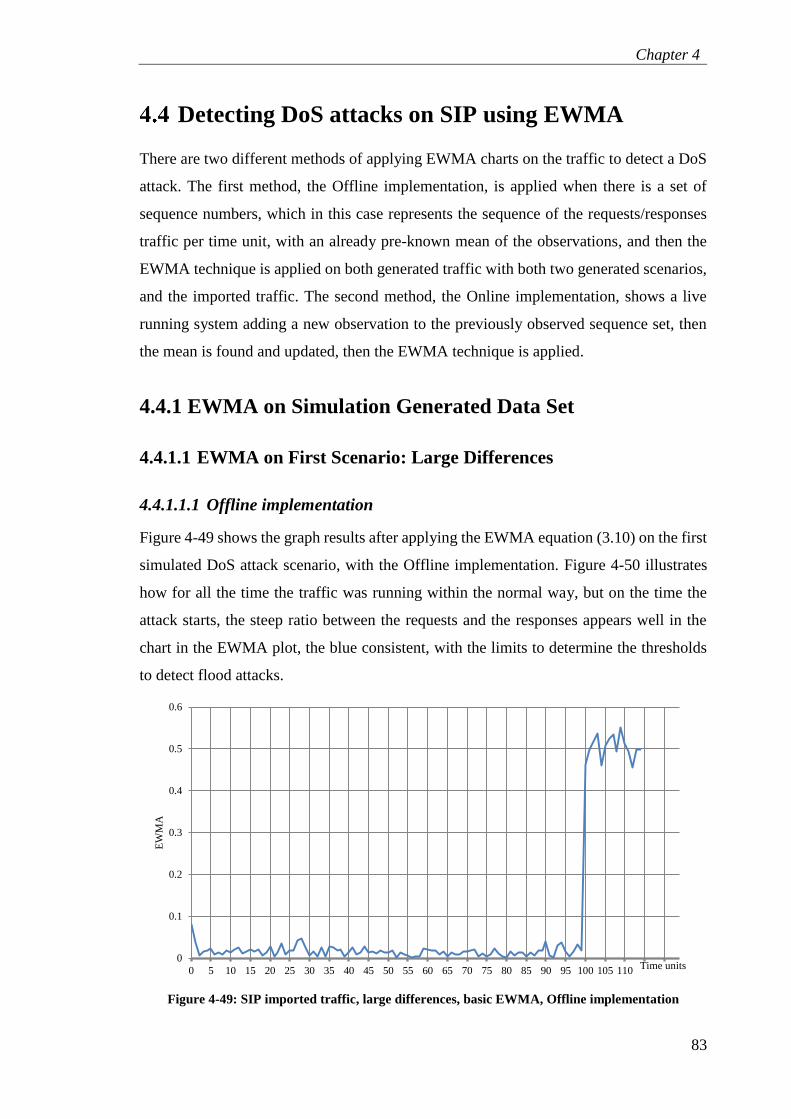
Detecting DoS attacks on SIP using EWMA ......................................................... 83
4.4.1 EWMA on Simulation Generated Data Set ..................................................... 83
4.4.1.1 EWMA on First Scenario: Large Differences ........................................... 83
4.4.1.2 EWMA on Second Scenario: Small Differences ....................................... 86
4.4.2 EWMA on SIP Imported Data Set ................................................................... 91
4.4.2.1 Offline implementation .............................................................................. 91
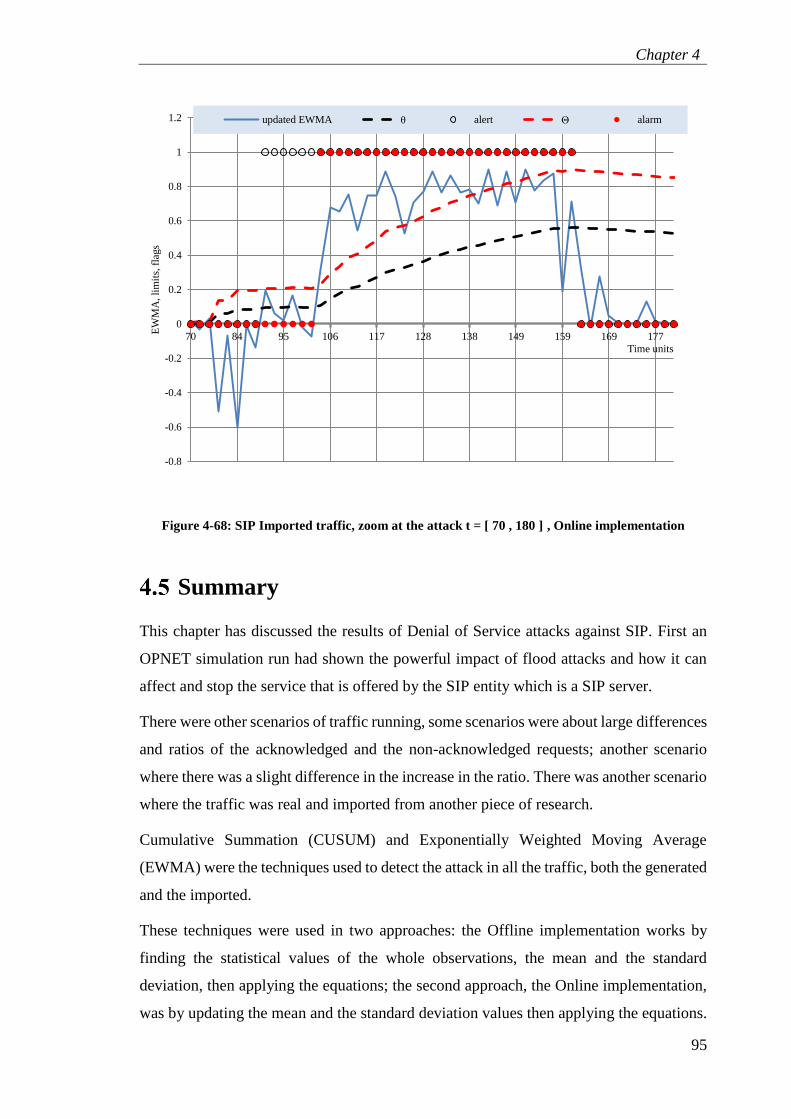
4.4.2.2 Online implementation ............................................................................... 93
Page 6
Contents
v
Summary ................................................................................................................ 95
DoS Targeting SPDY / HTTP 2.0: Results and Analysis ............................................... 98
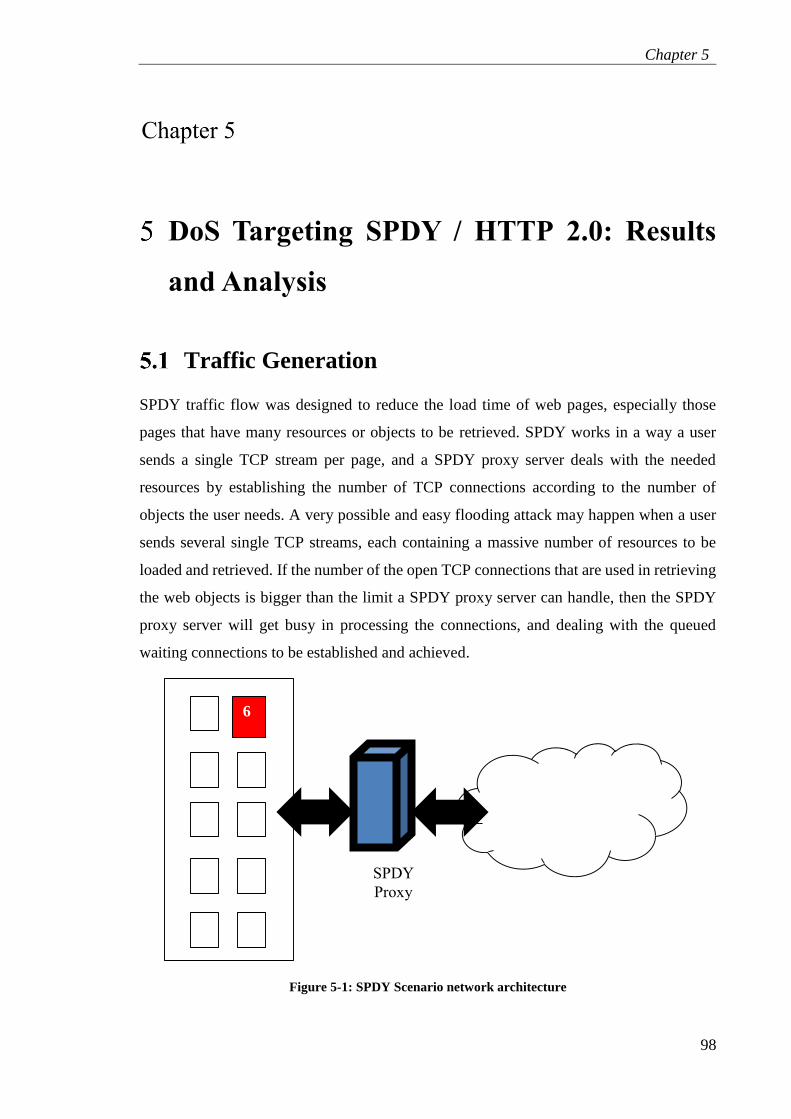
Traffic Generation .................................................................................................. 98
Detecting DoS attacks on SPDY using CUSUM ................................................. 100
5.2.1 CUSUM on SPDY First Scenario: Large increase ........................................ 100
5.2.1.1 Offline implementation ............................................................................ 100
5.2.1.2 Online implementation ............................................................................. 102
5.2.2 CUSUM on SPDY Second Scenario: Slight Increase ................................... 104
5.2.2.1 Offline implementation ............................................................................ 104
5.2.2.2 Online implementation ............................................................................. 106
Detecting DoS attacks on SPDY using EWMA .................................................. 109
5.3.1 EWMA on First Scenario: Large increase ..................................................... 109
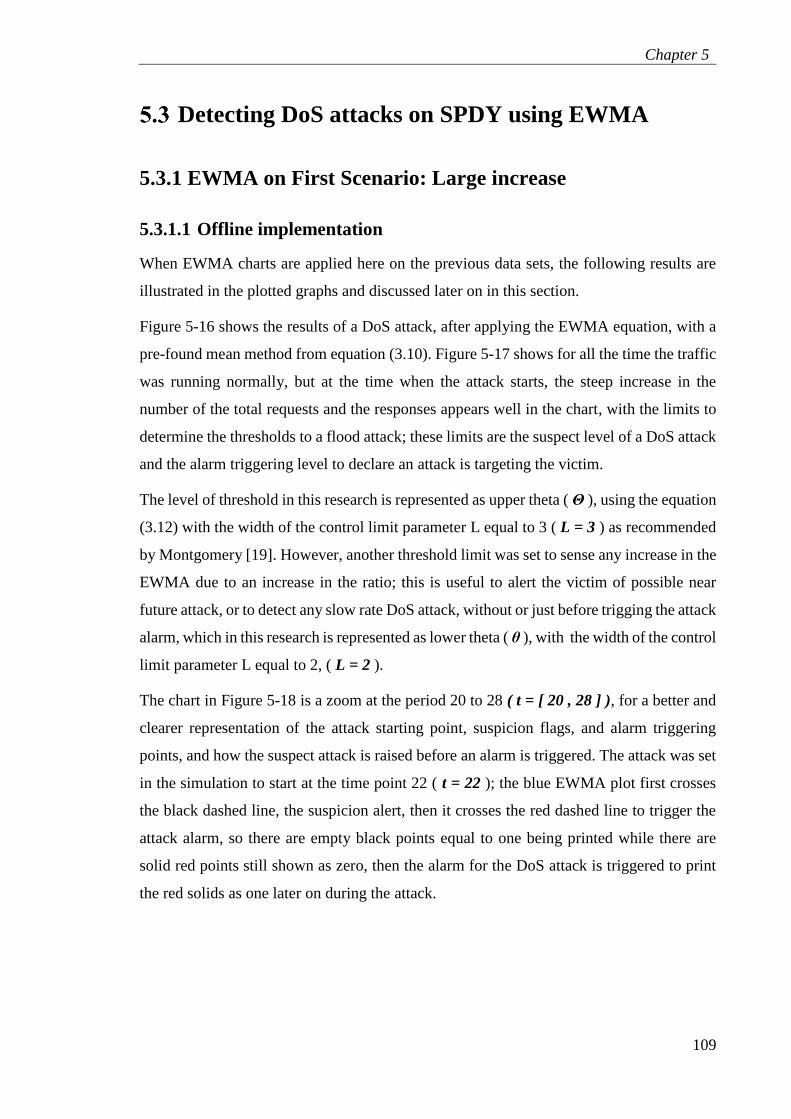
5.3.1.1 Offline implementation ............................................................................ 109
5.3.1.2 Online implementation ............................................................................. 111
5.3.2 EWMA on Second Scenario: Slight Increase ................................................ 112
5.3.2.1 Offline implementation ............................................................................ 112
5.3.2.2 Online implementation ............................................................................. 113
Summary .............................................................................................................. 115
A DoS resilience Framework ........................................................................................ 117
Architecture of the DoS resilient frame work ...................................................... 117
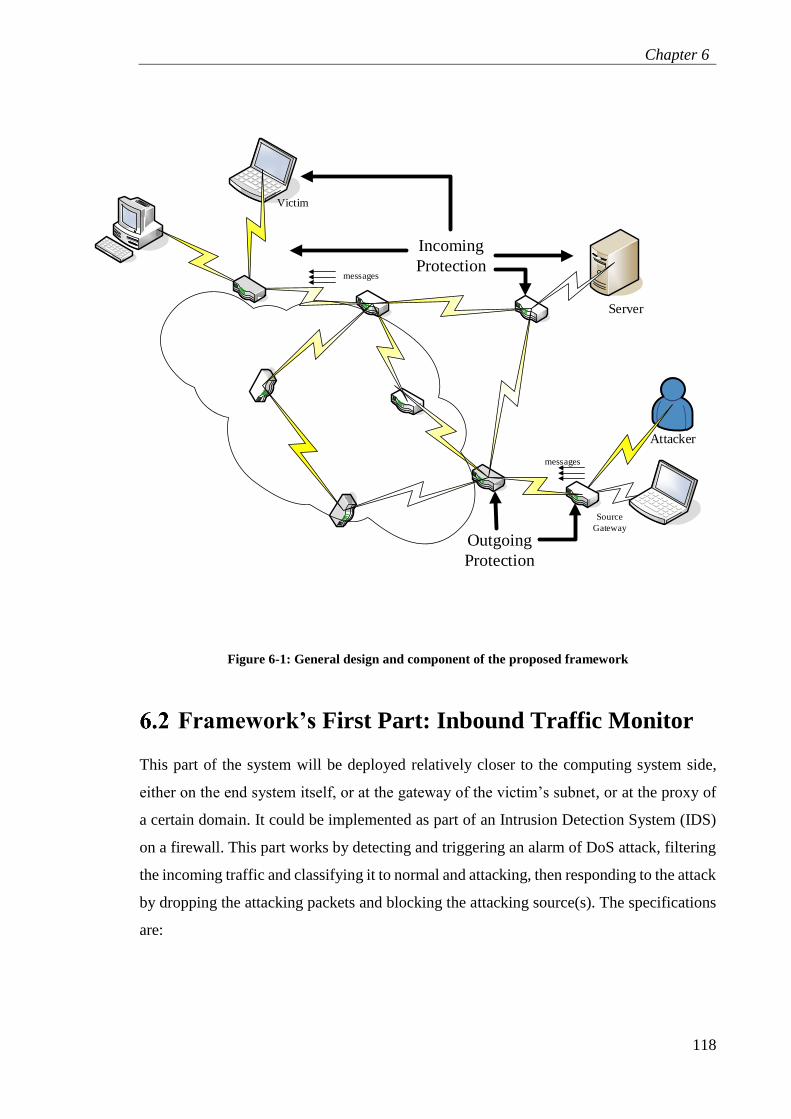
Framework’s First Part: Inbound Traffic Monitor ............................................... 118
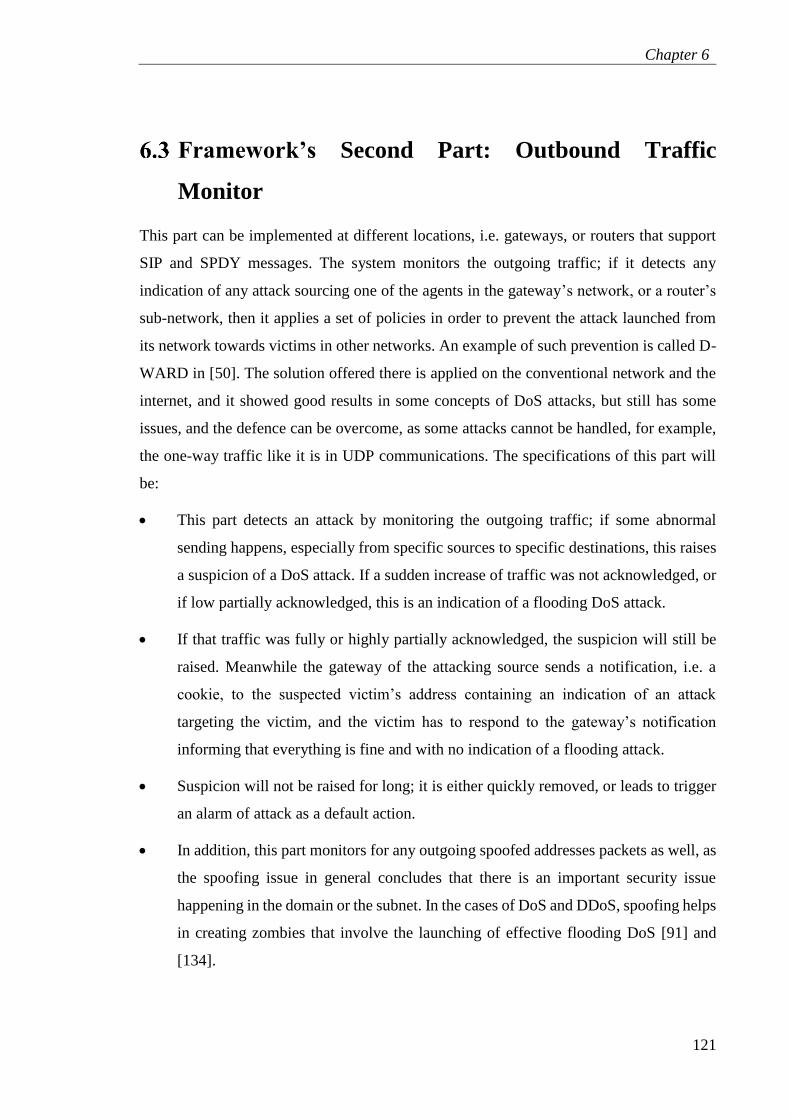
Framework’s Second Part: Outbound Traffic Monitor ........................................ 121
Framework’s Components Collaboration ............................................................ 124
Summary .............................................................................................................. 125
Conclusions and Future Work ...................................................................................... 126
Conclusions .......................................................................................................... 126
Future Work ......................................................................................................... 127
Bibliography .................................................................................................................... 128
Page 7
List of Figures
vi
List of Figures
Figure 1-1: Contributions Matrix ......................................................................................... 4
Figure 2-1: Five-layer Internet protocol stack ..................................................................... 6
Figure 2-2: SIP main flow of VoIP call transactions ........................................................... 9
Figure 2-3: SPDY communication flow ............................................................................ 13
Figure 2-4: Security CIA and DAD Triad ......................................................................... 16
Figure 2-5: SIP flooding DoS example .............................................................................. 25
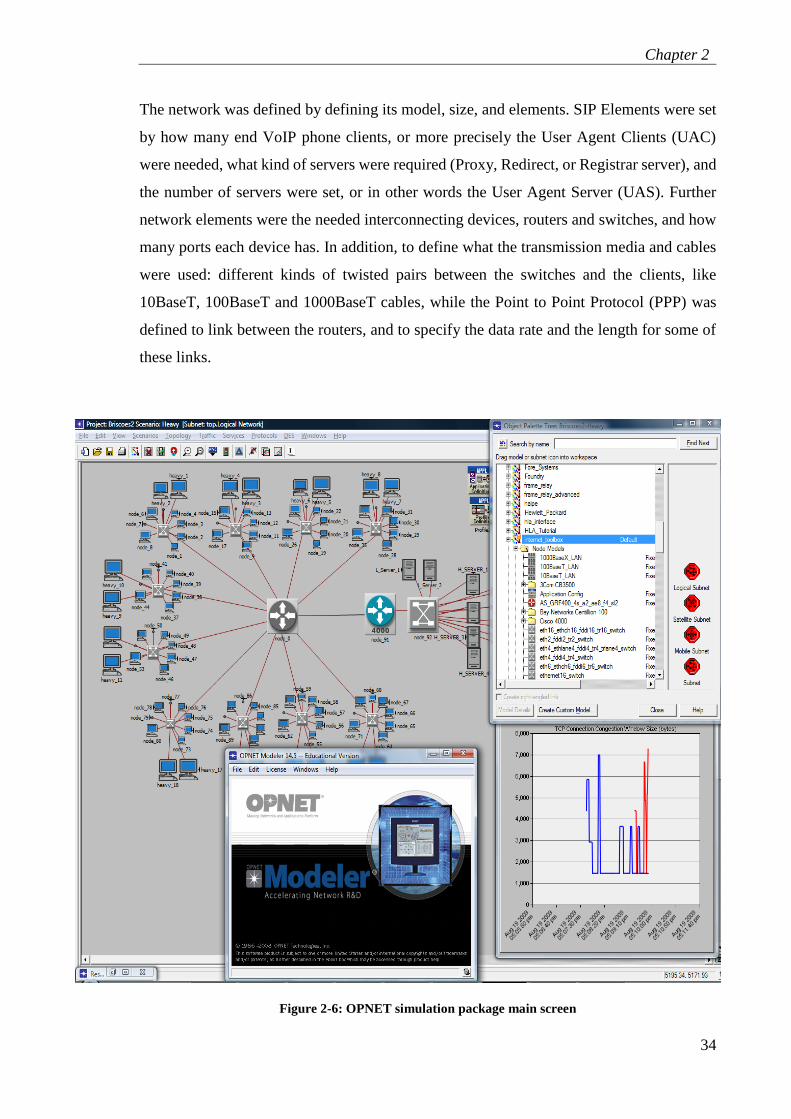
Figure 2-6: OPNET simulation package main screen ........................................................ 34
Figure 3-1: Flowchart for the Offline detection application .............................................. 45
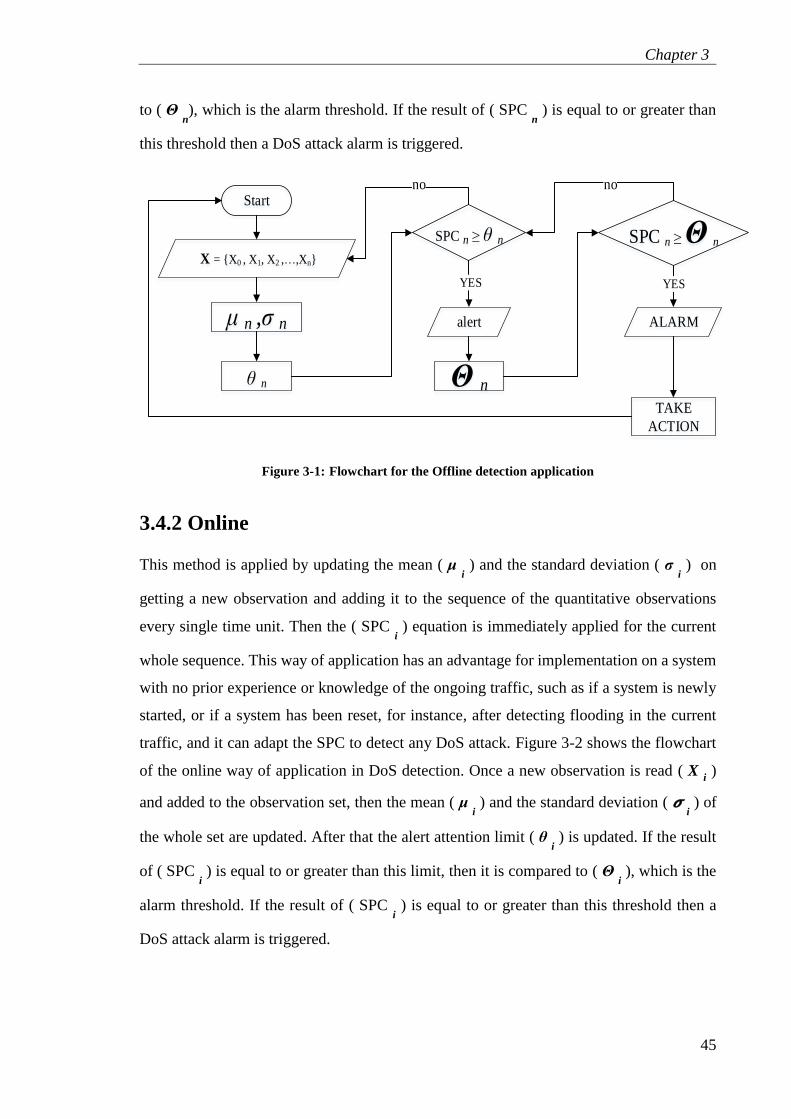
Figure 3-2: Flowchart for the Online detection application ............................................... 46
Figure 4-1: SIP OPNET small network design .................................................................. 48
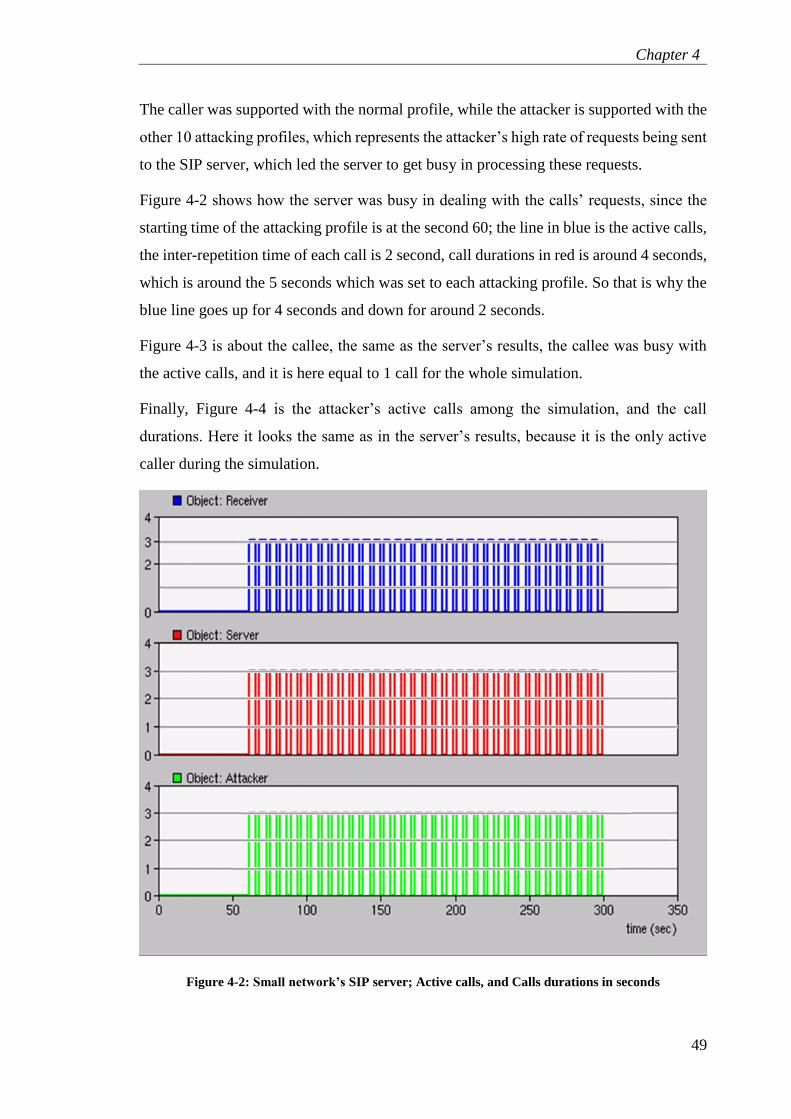
Figure 4-2: Small network’s SIP server; Active calls, and Calls durations in seconds ..... 49
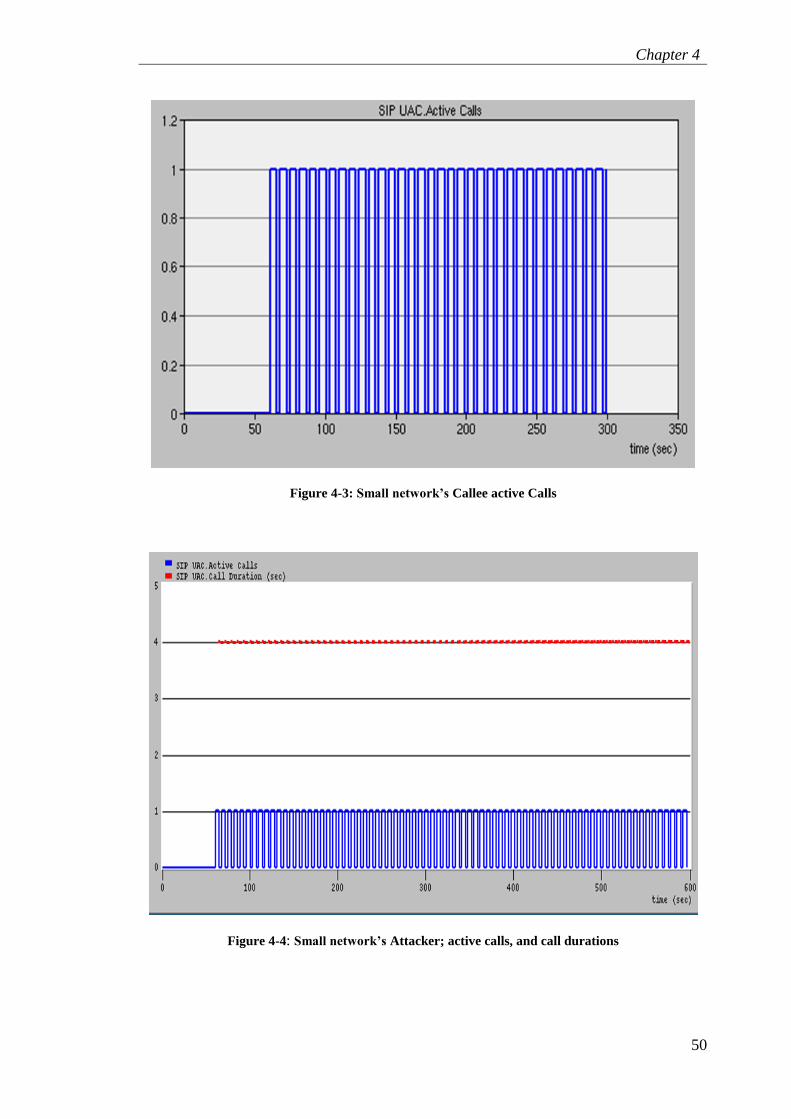
Figure 4-3: Small network’s Callee active Calls ............................................................... 50
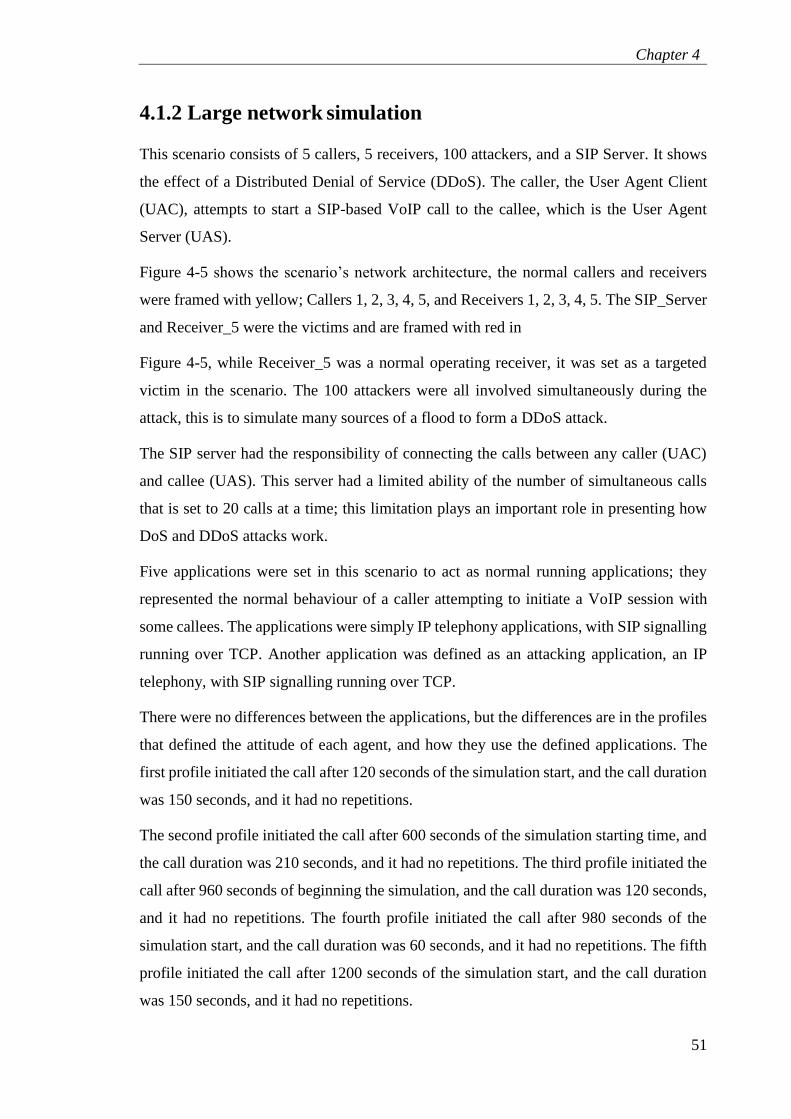
Figure 4-4: Small network’s Attacker; active calls, and call durations ............................. 50
Figure 4-5: SIP OPNET large network design .................................................................. 52
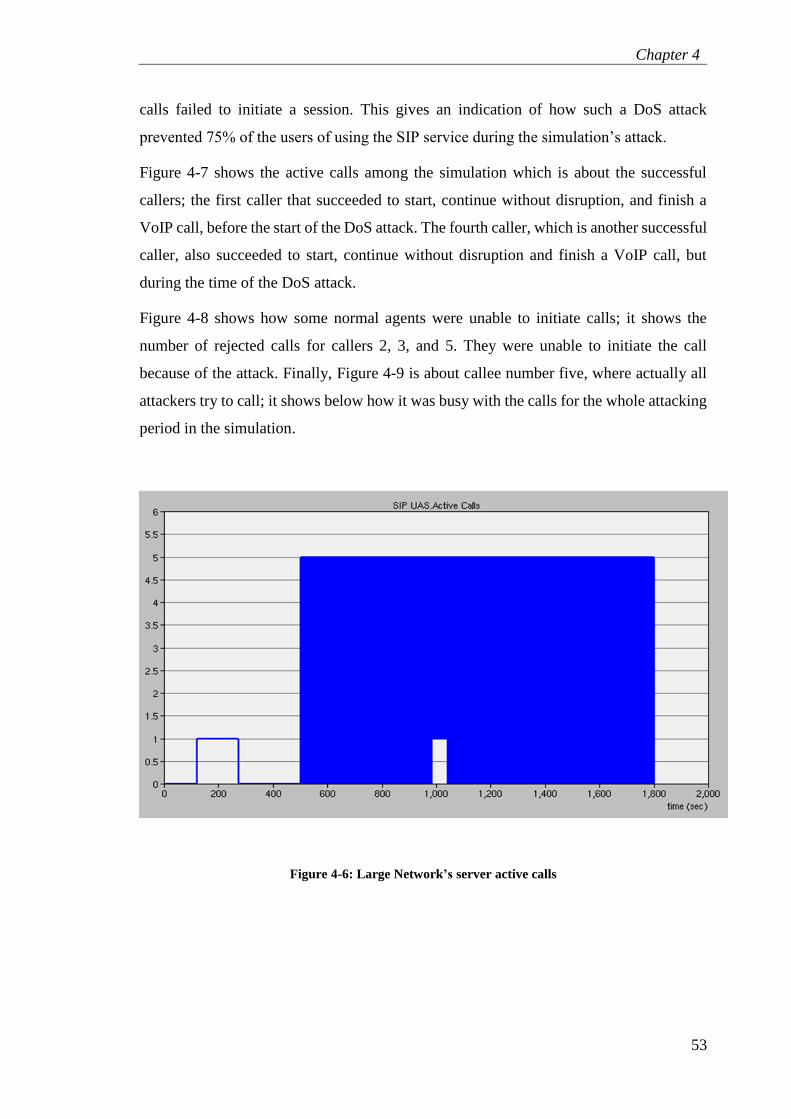
Figure 4-6: Large Network’s server active calls ................................................................ 53
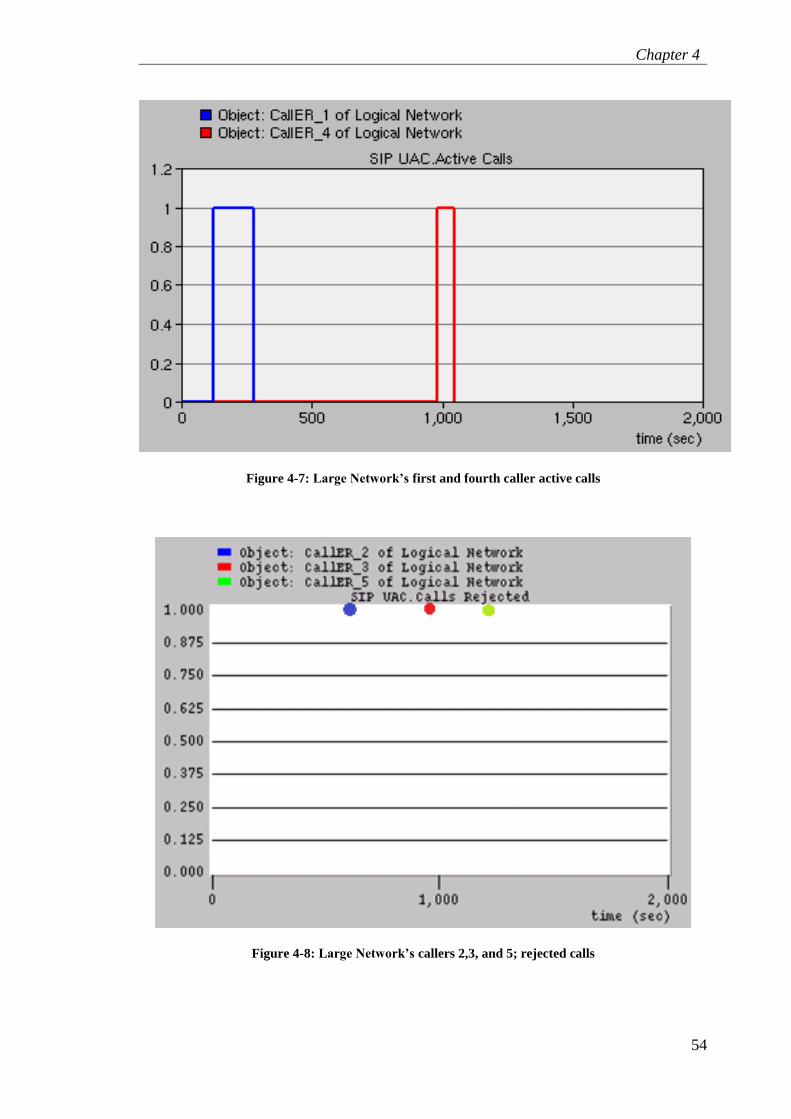
Figure 4-7: Large Network’s first and fourth caller active calls ........................................ 54
Figure 4-8: Large Network’s callers 2,3, and 5; rejected calls .......................................... 54
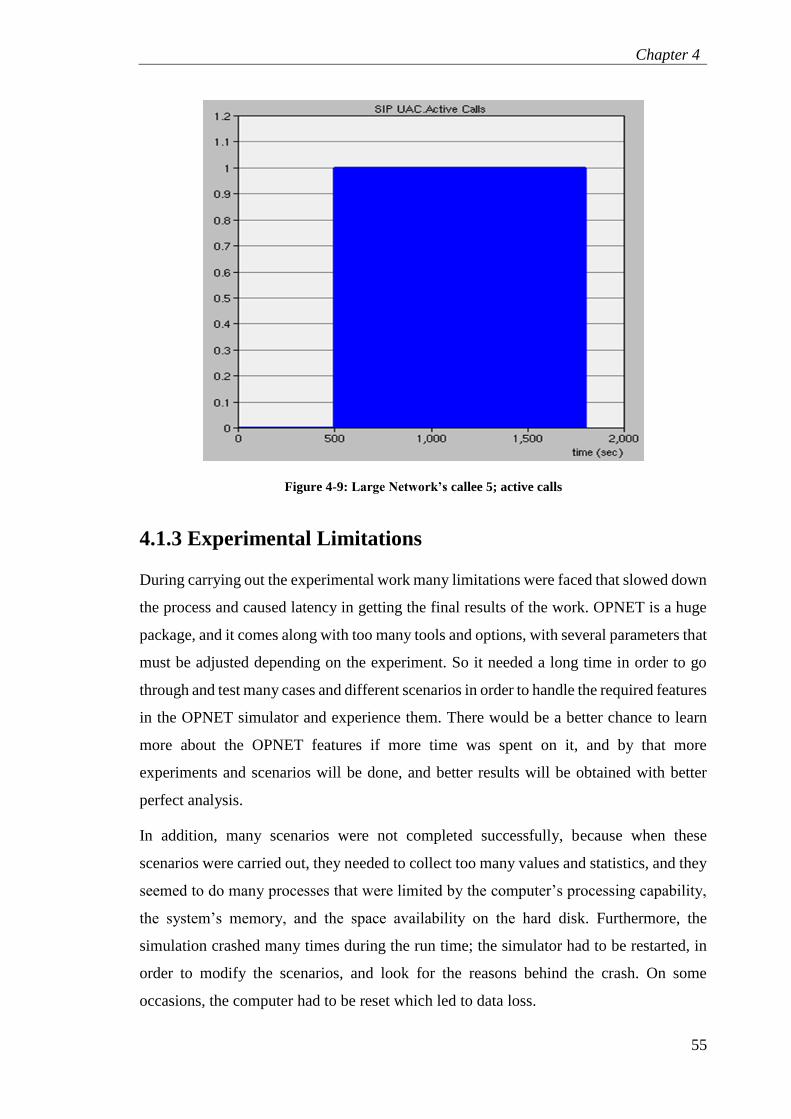
Figure 4-9: Large Network’s callee 5; active calls ............................................................ 55
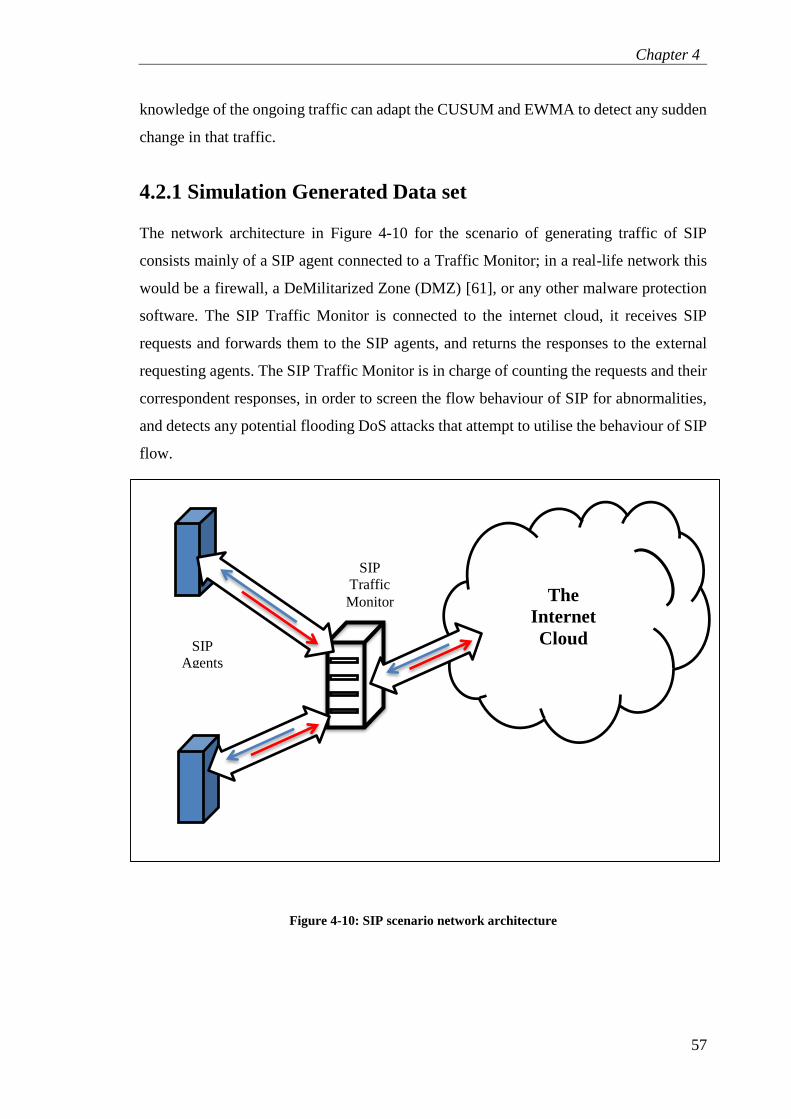
Figure 4-10: SIP scenario network architecture ................................................................. 57
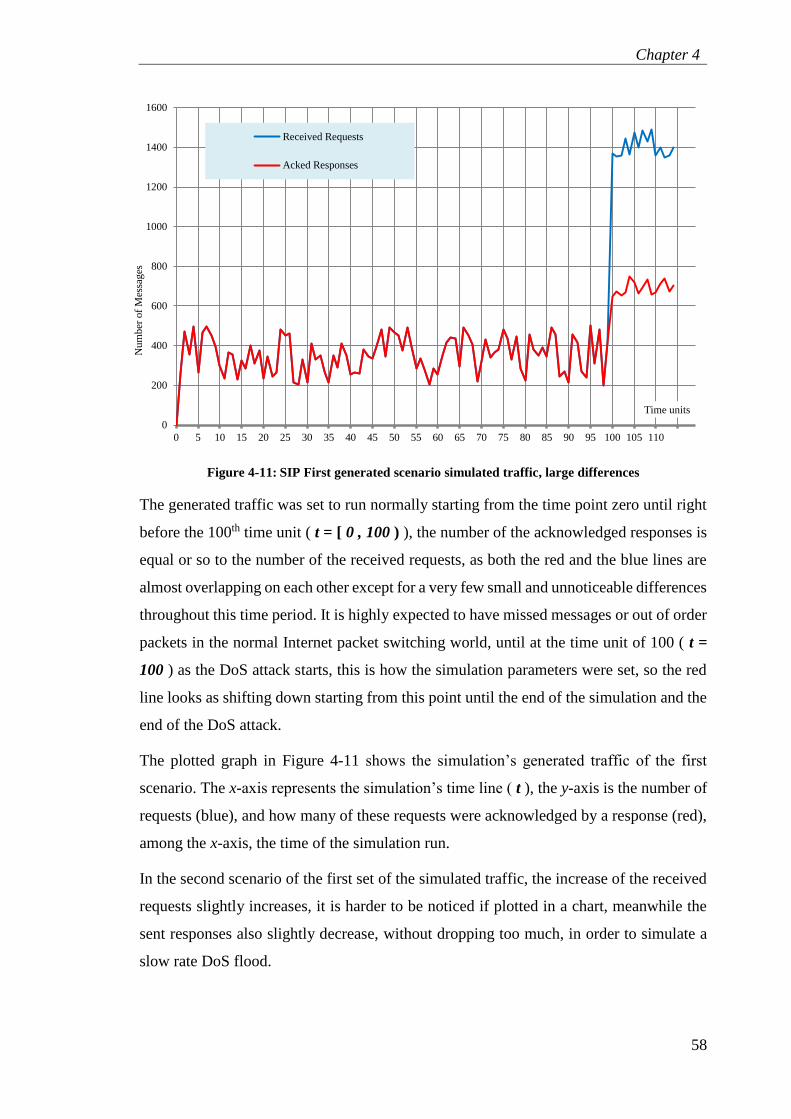
Figure 4-11: SIP First generated scenario simulated traffic, large differences .................. 58
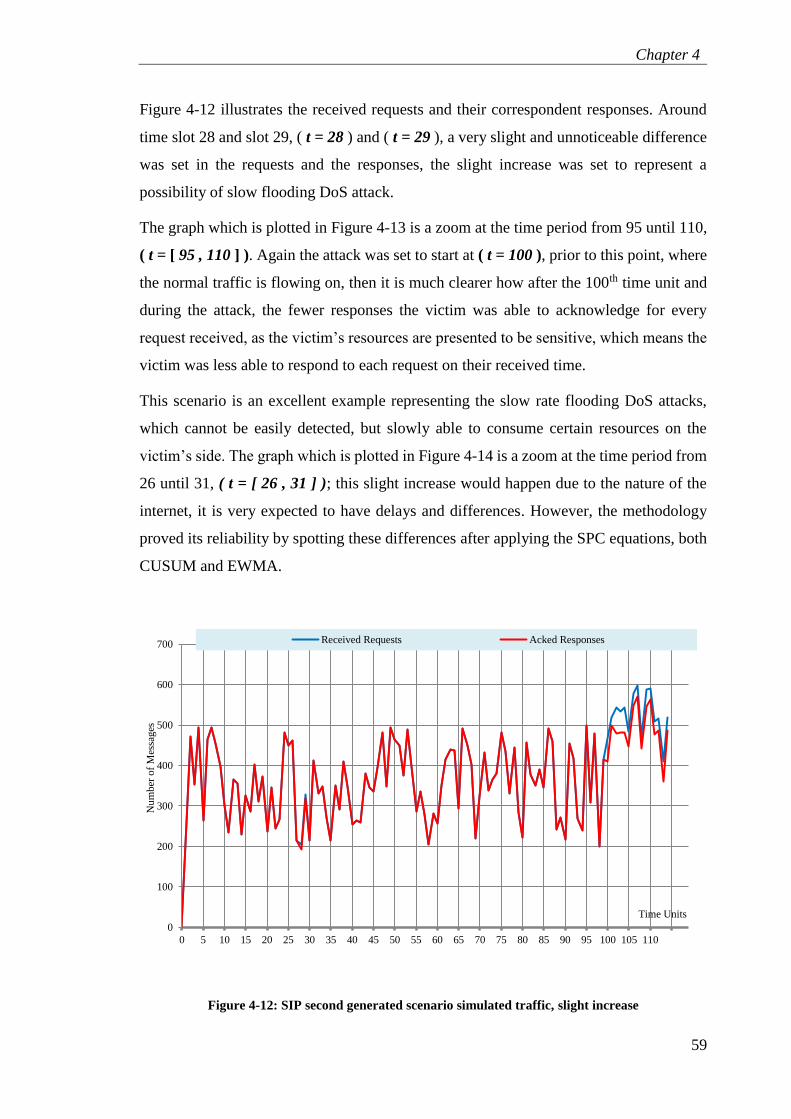
Figure 4-12: SIP second generated scenario simulated traffic, slight increase .................. 59
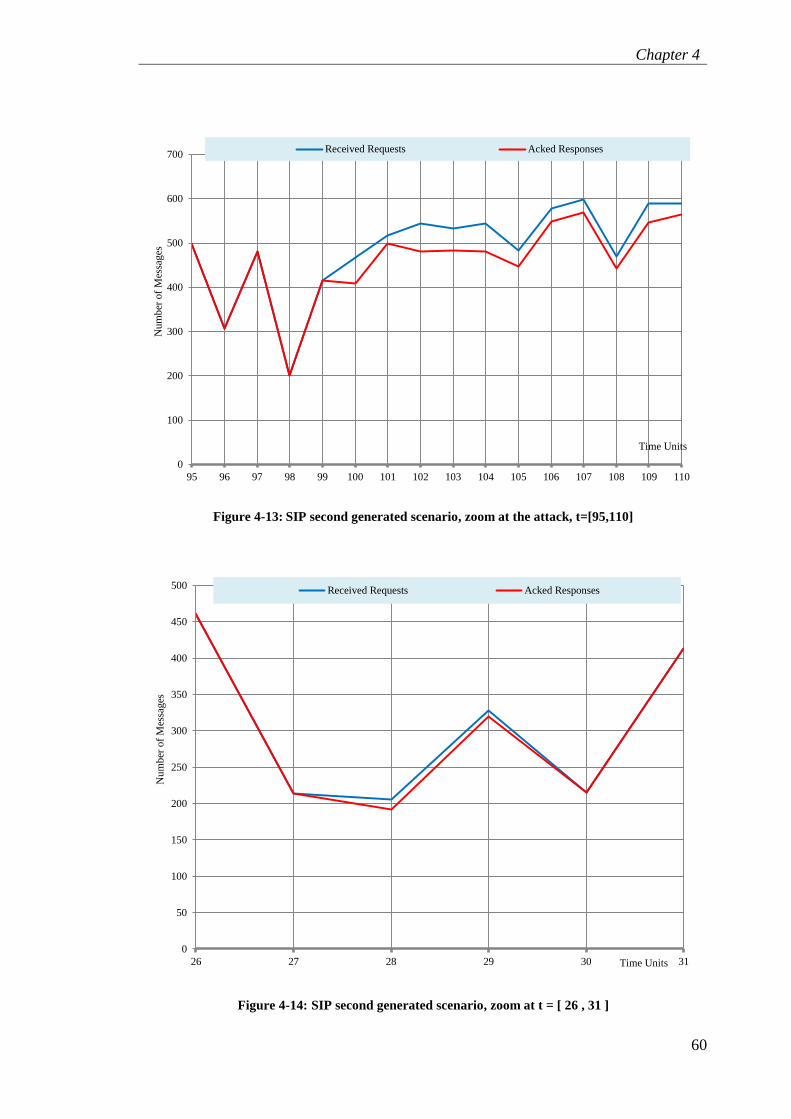
Figure 4-13: SIP second generated scenario, zoom at the attack, t=[95,110] .................... 60
Figure 4-14: SIP second generated scenario, zoom at t = [ 26 , 31 ] ................................. 60
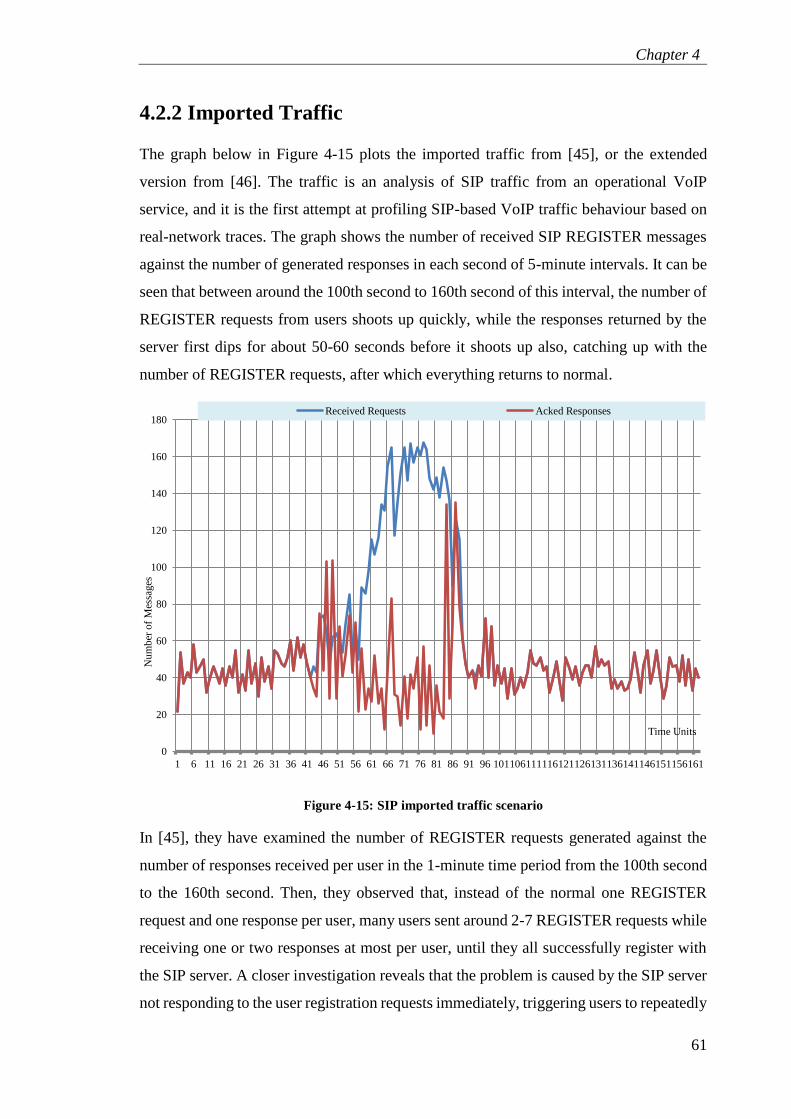
Figure 4-15: SIP imported traffic scenario ........................................................................ 61
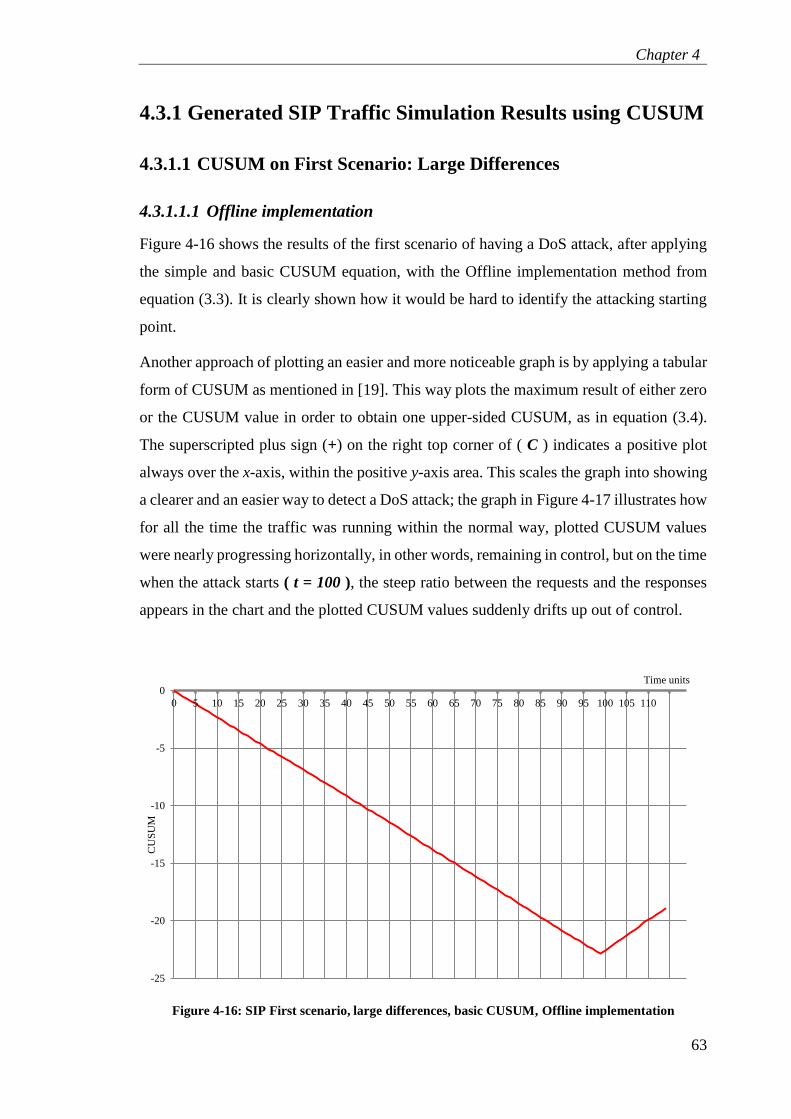
Figure 4-16: SIP First scenario, large differences, basic CUSUM, Offline implementation
.................................................................................................................................... 63
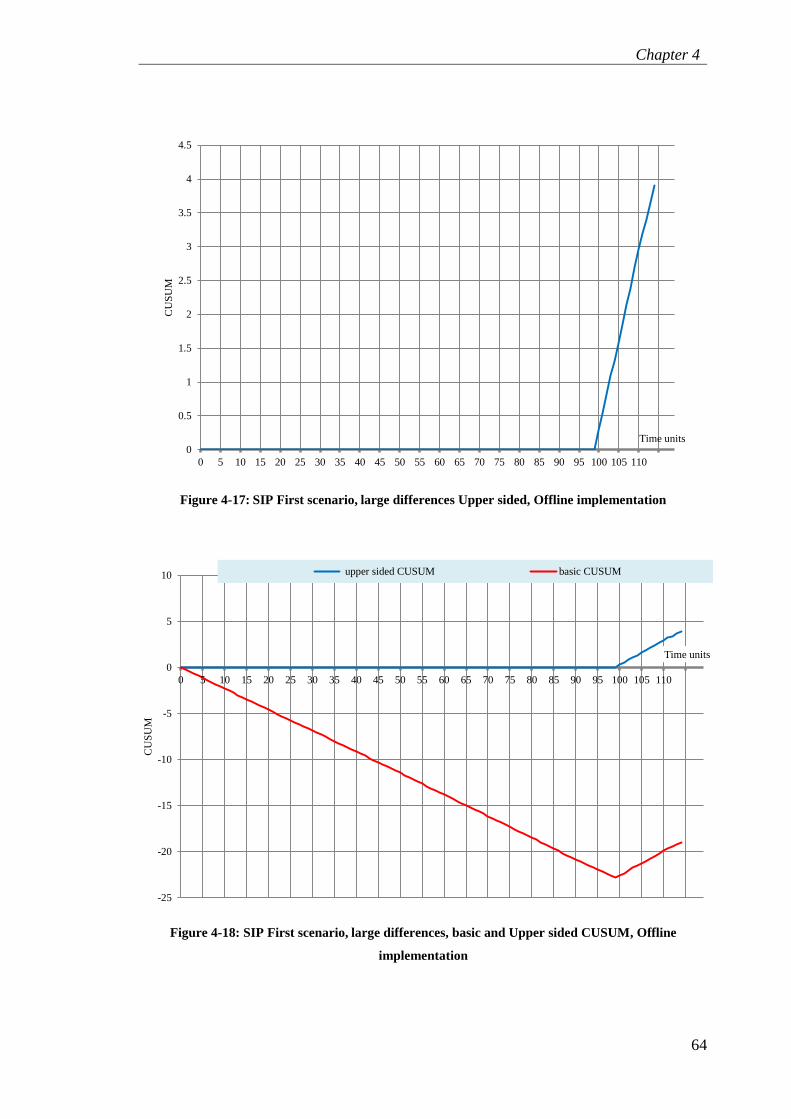
Figure 4-17: SIP First scenario, large differences Upper sided, Offline implementation . 64
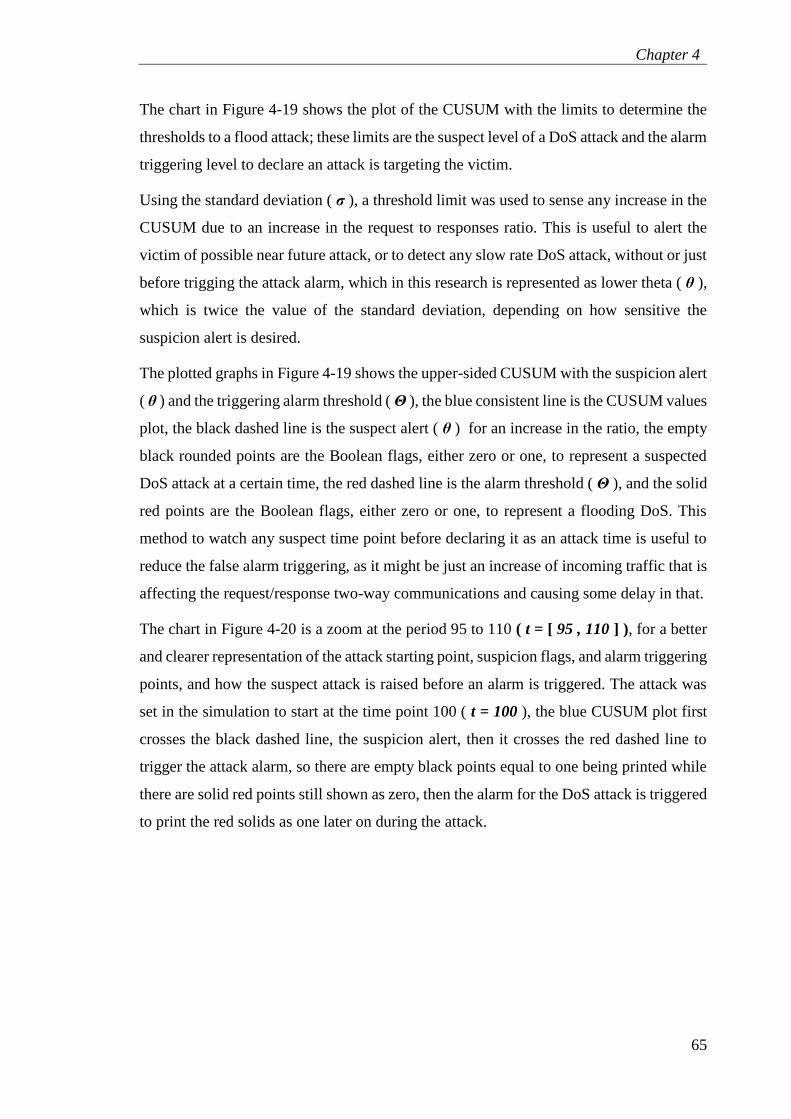
Figure 4-18: SIP First scenario, large differences, basic and Upper sided CUSUM, Offline
implementation ........................................................................................................... 64
Page 8
List of Figures
vii
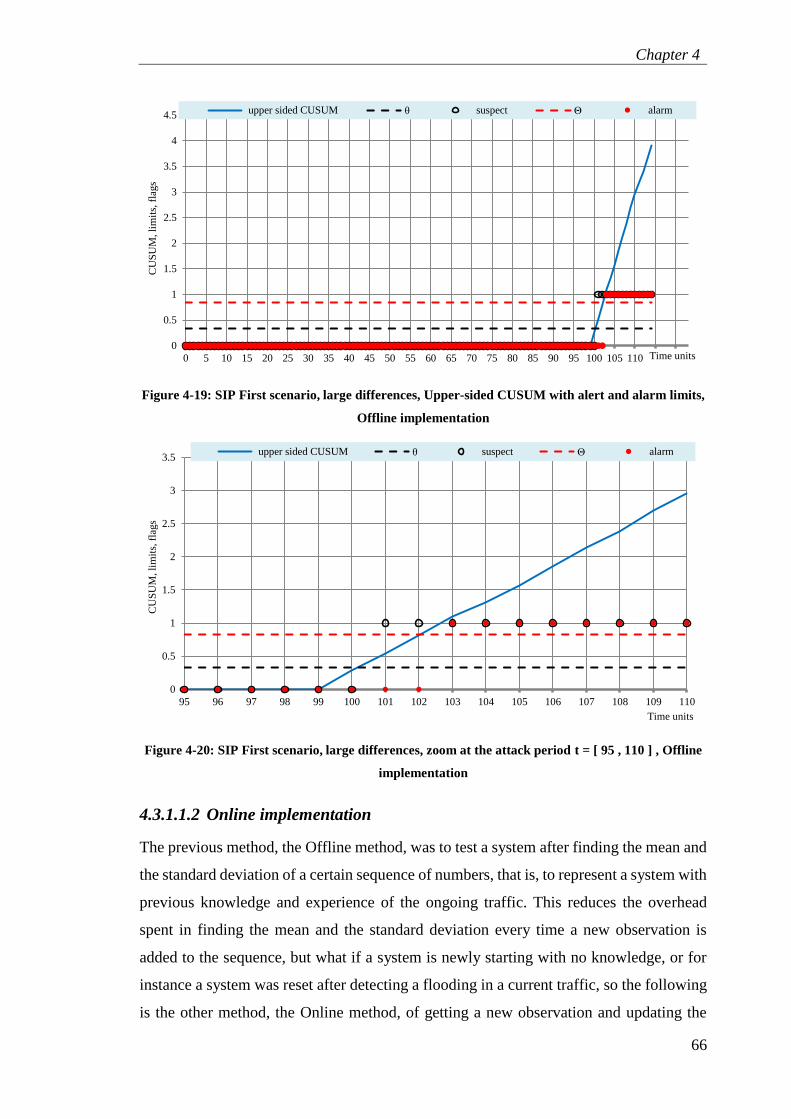
Figure 4-19: SIP First scenario, large differences, Upper-sided CUSUM with alert and
alarm limits, Offline implementation ......................................................................... 66
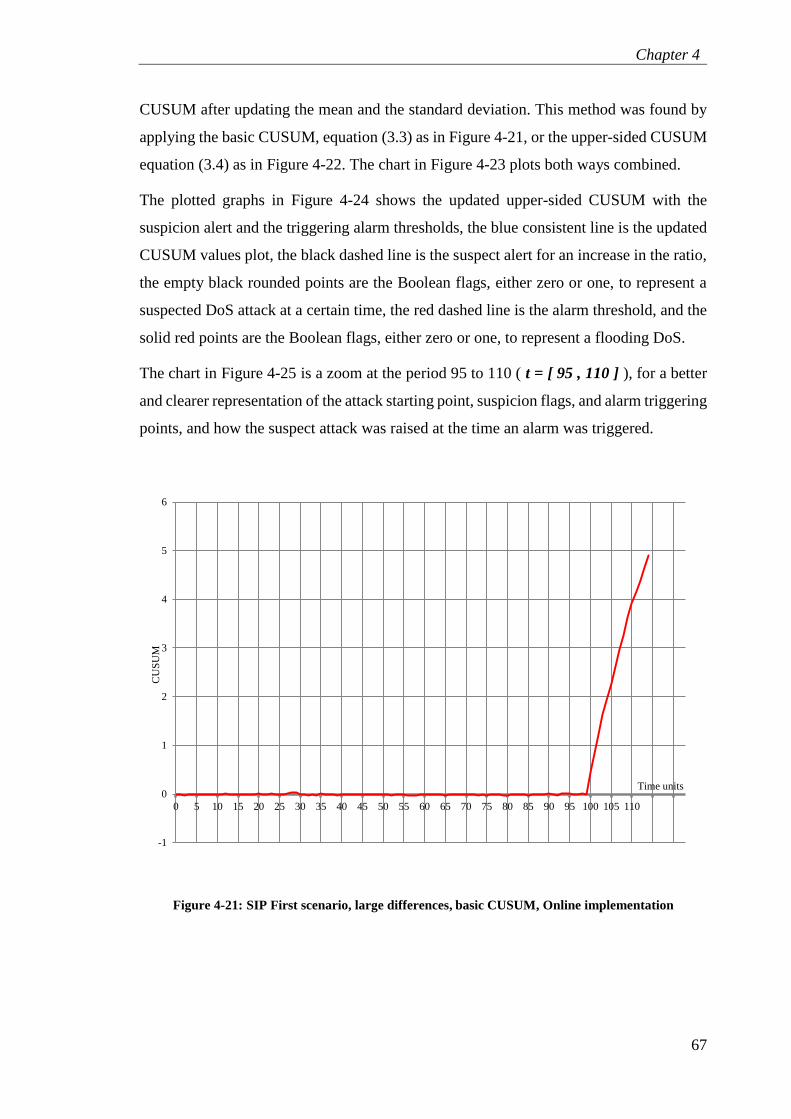
Figure 4-20: SIP First scenario, large differences, zoom at the attack period t = [ 95 , 110 ]
, Offline implementation ............................................................................................. 66
Figure 4-21: SIP First scenario, large differences, basic CUSUM, Online implementation
.................................................................................................................................... 67
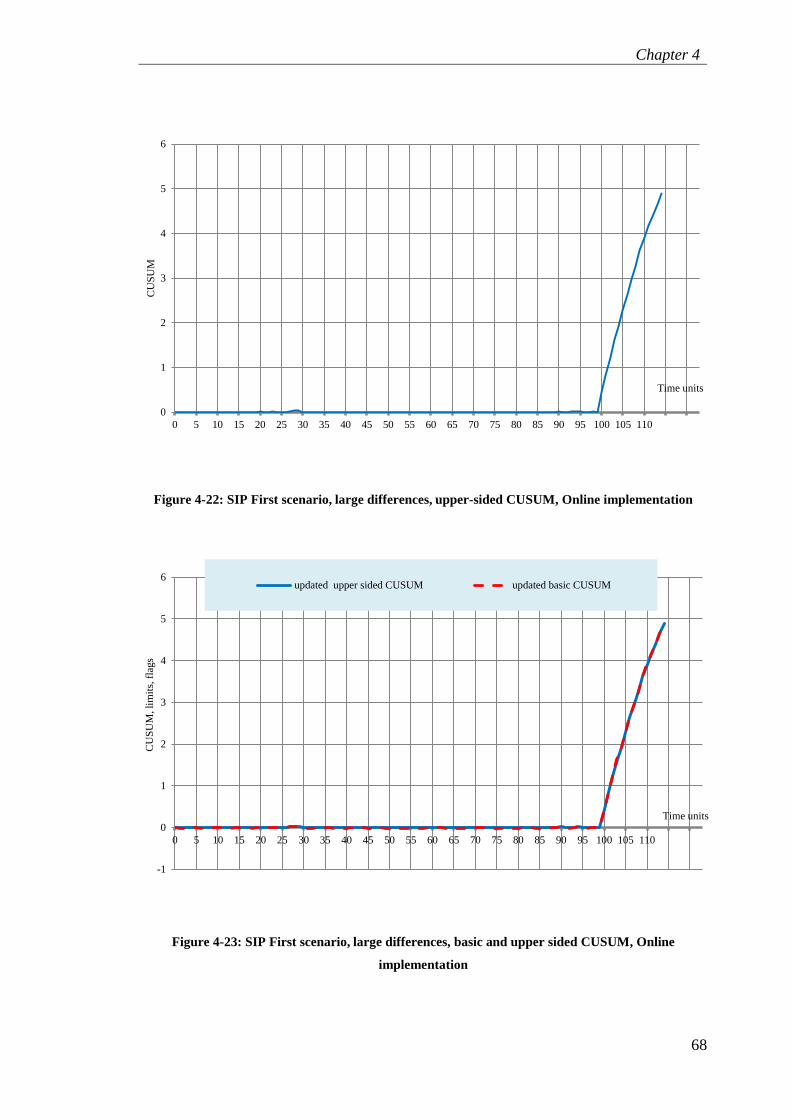
Figure 4-22: SIP First scenario, large differences, upper-sided CUSUM, Online
implementation ........................................................................................................... 68
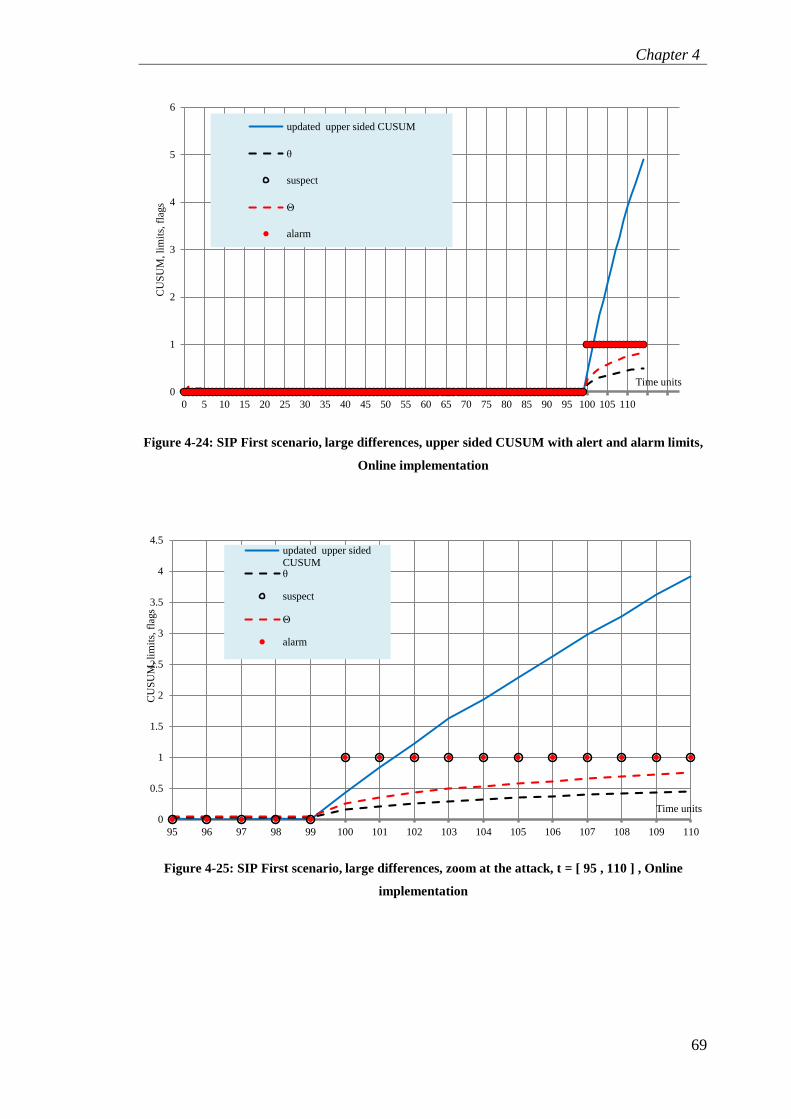
Figure 4-23: SIP First scenario, large differences, basic and upper sided CUSUM, Online
implementation ........................................................................................................... 68
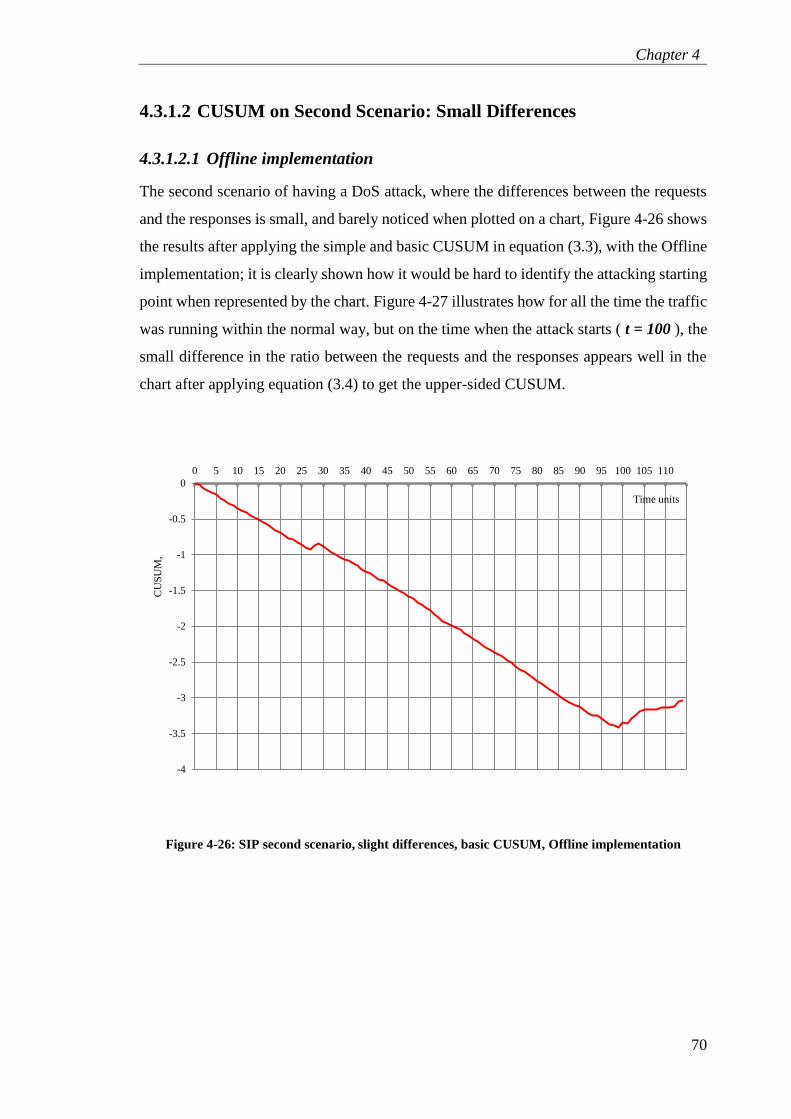
Figure 4-24: SIP First scenario, large differences, upper sided CUSUM with alert and
alarm limits, Online implementation .......................................................................... 69
Figure 4-25: SIP First scenario, large differences, zoom at the attack, t = [ 95 , 110 ] ,
Online implementation ............................................................................................... 69
Figure 4-26: SIP second scenario, slight differences, basic CUSUM, Offline
implementation ........................................................................................................... 70
Figure 4-27: SIP second scenario, slight differences, upper sided CUSUM, Offline
implementation ........................................................................................................... 71
Figure 4-28: SIP second scenario, slight differences, basic and upper sided CUSUM,
Offline implementation ............................................................................................... 71
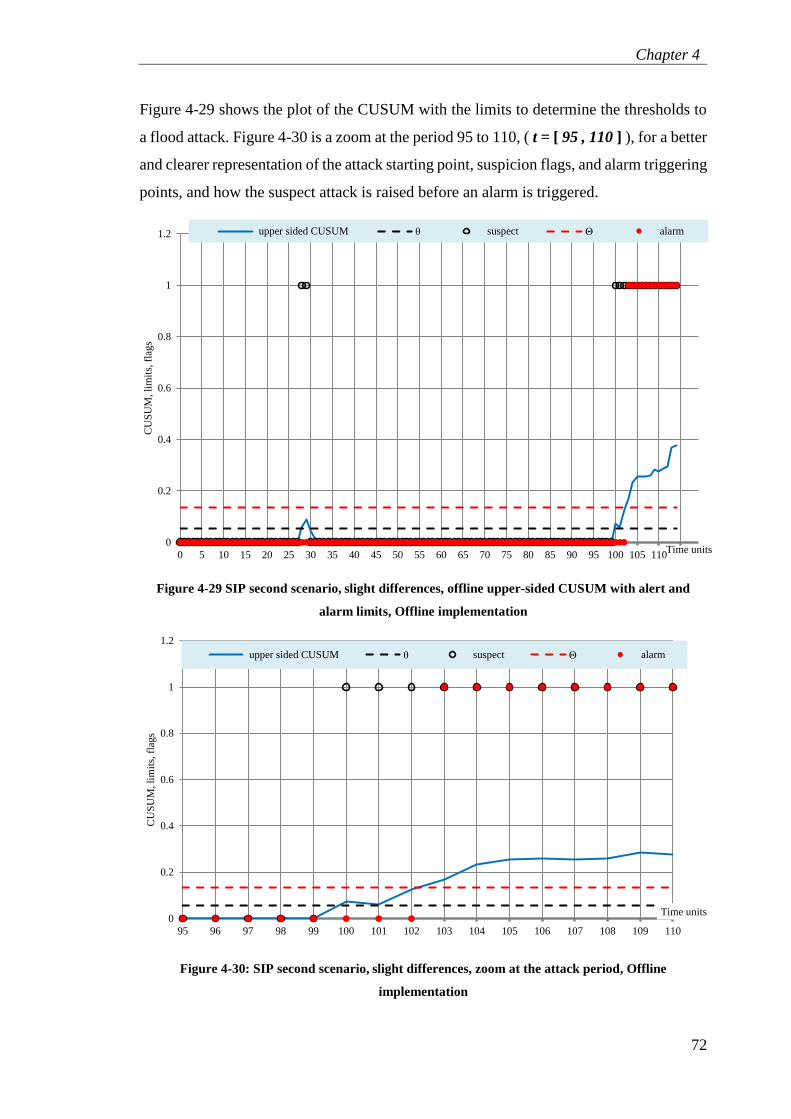
Figure 4-29 SIP second scenario, slight differences, offline upper-sided CUSUM with
alert and alarm limits, Offline implementation .......................................................... 72
Figure 4-30: SIP second scenario, slight differences, zoom at the attack period, Offline
implementation ........................................................................................................... 72
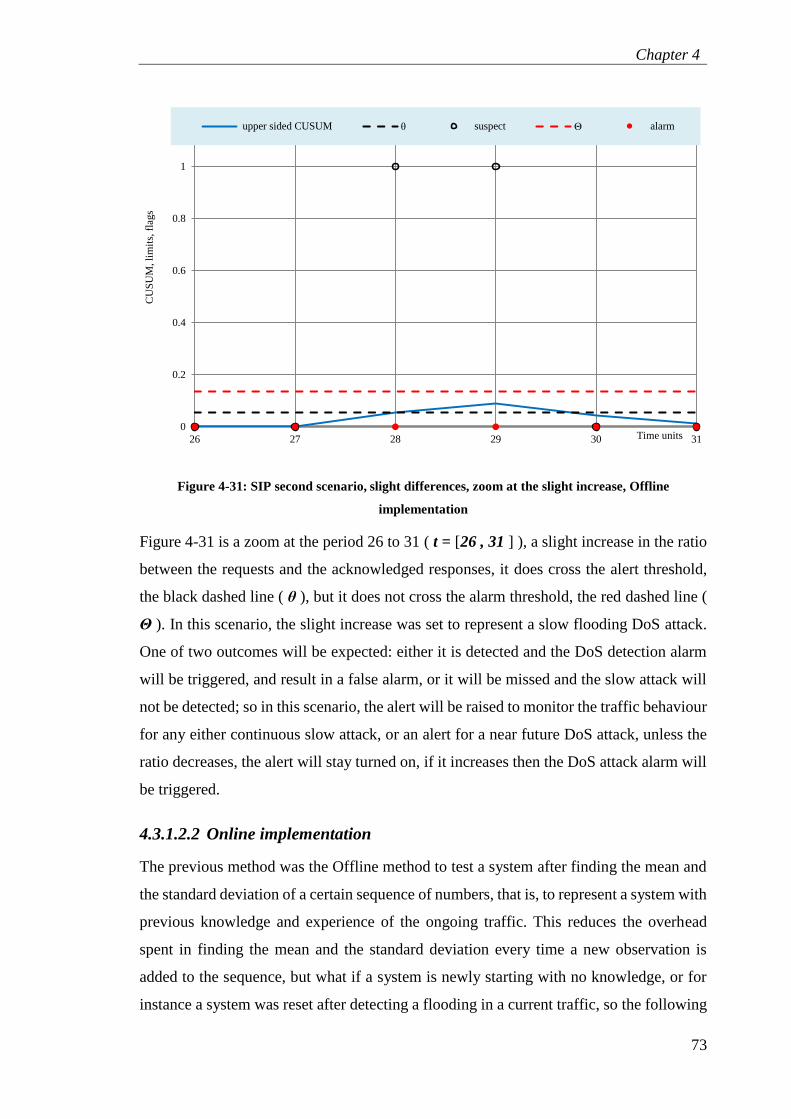
Figure 4-31: SIP second scenario, slight differences, zoom at the slight increase, Offline
implementation ........................................................................................................... 73
Figure 4-32: SIP second scenario, slight differences, basic CUSUM, Online
implementation ........................................................................................................... 74
Figure 4-33: SIP second scenario, slight differences, upper-sided CUSUM, Online
implementation ........................................................................................................... 74
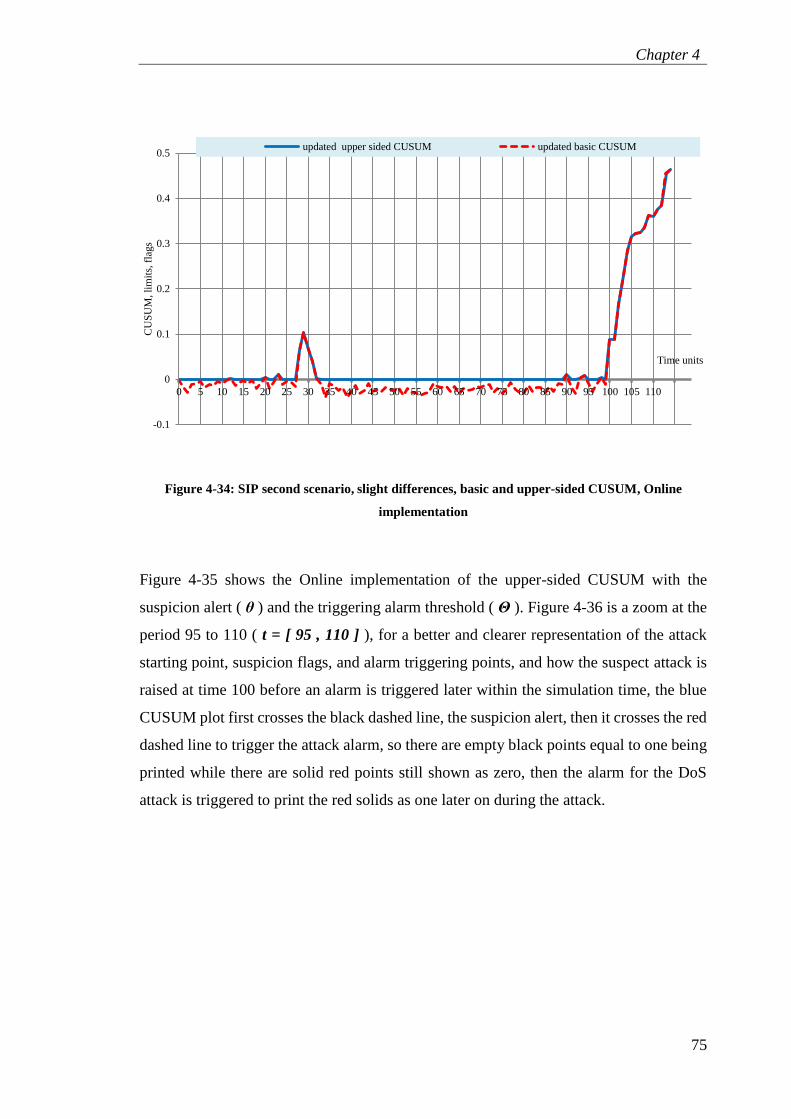
Figure 4-34: SIP second scenario, slight differences, basic and upper-sided CUSUM,
Online implementation ............................................................................................... 75
Page 9
List of Figures
viii
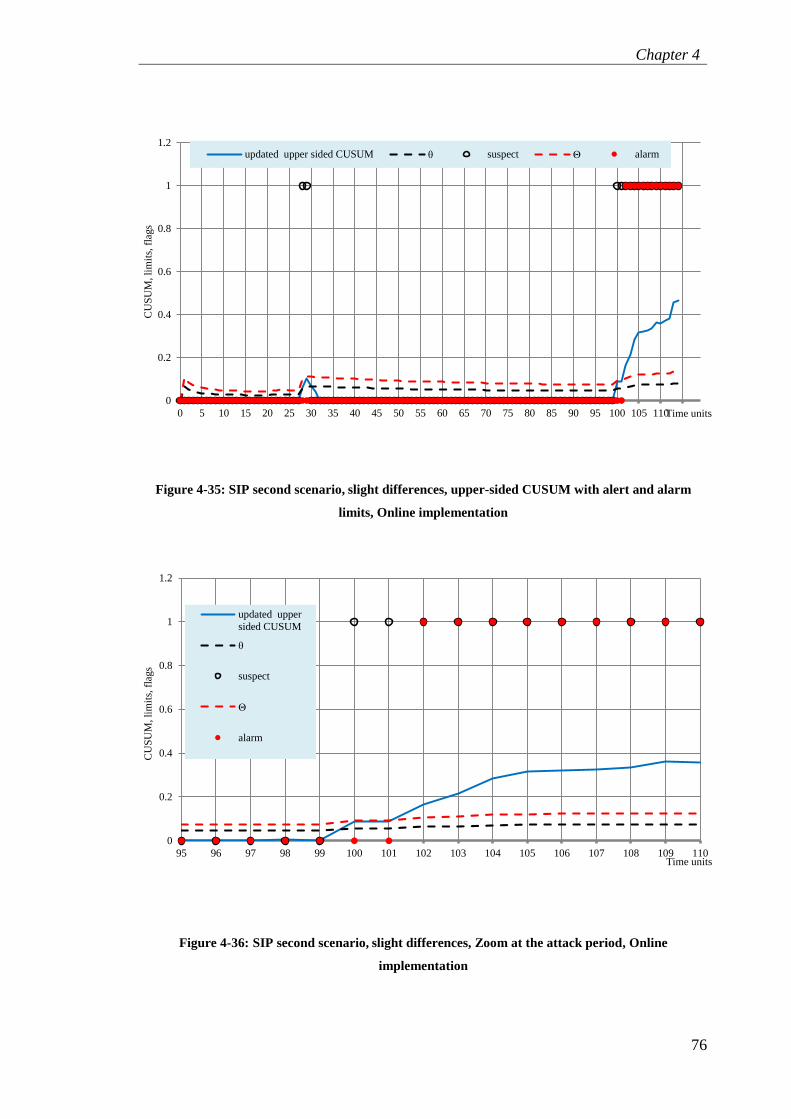
Figure 4-35: SIP second scenario, slight differences, upper-sided CUSUM with alert and
alarm limits, Online implementation .......................................................................... 76
Figure 4-36: SIP second scenario, slight differences, Zoom at the attack period, Online
implementation ........................................................................................................... 76
Figure 4-37: SIP second scenario, slight differences, zoom at the slight increase period,
Online implementation ............................................................................................... 77
Figure 4-38: SIP imported traffic, basic CUSUM, Offline implementation ...................... 77
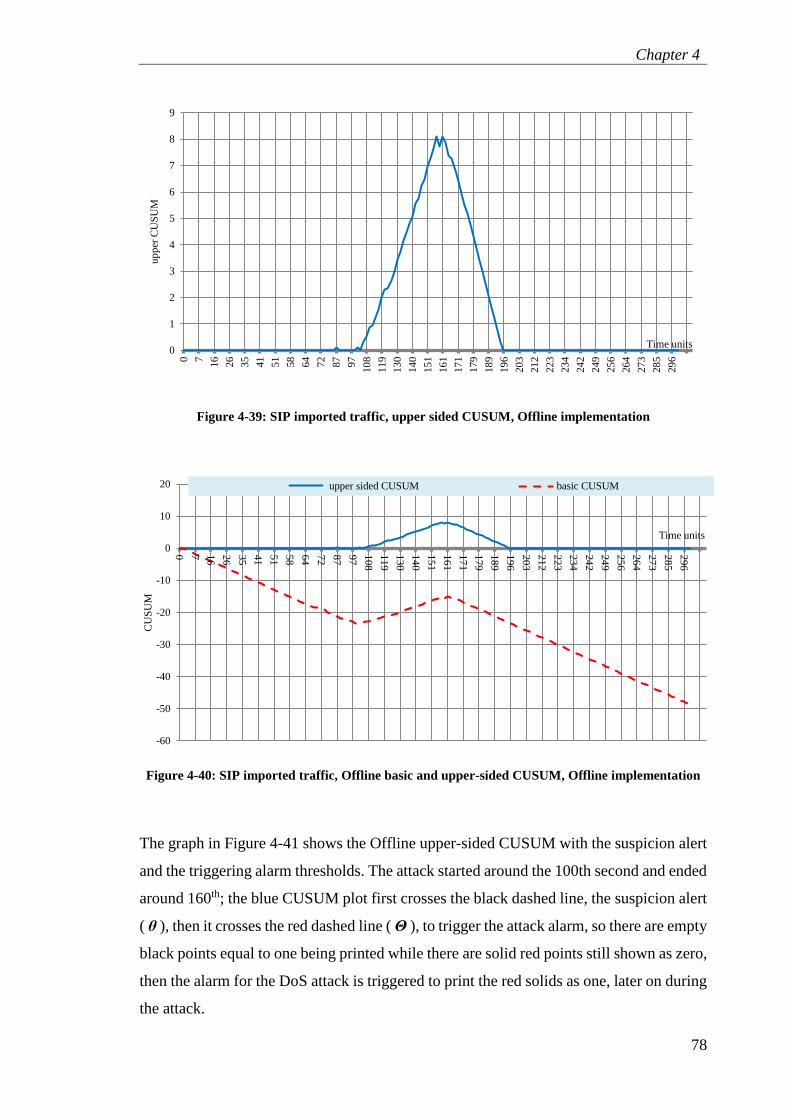
Figure 4-39: SIP imported traffic, upper sided CUSUM, Offline implementation ........... 78
Figure 4-40: SIP imported traffic, Offline basic and upper-sided CUSUM, Offline
implementation ........................................................................................................... 78
Figure 4-41: SIP imported traffic, upper-sided CUSUM with the alert and alarm levels,
Offline implementation ............................................................................................... 79
Figure 4-42: SIP imported traffic, zoom at the reset Offline upper-sided CUSUM and the
levels, Offline implementation ................................................................................... 79
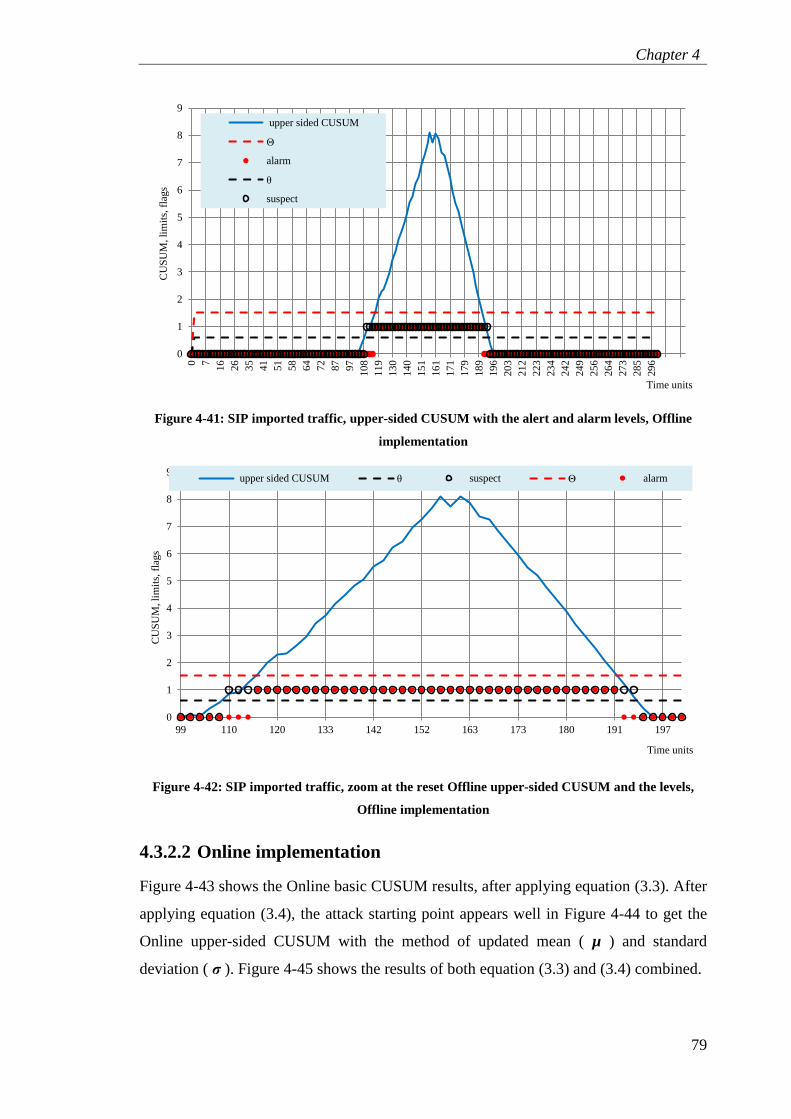
Figure 4-43: SIP imported traffic, updated basic CUSUM, Online implementation ......... 80
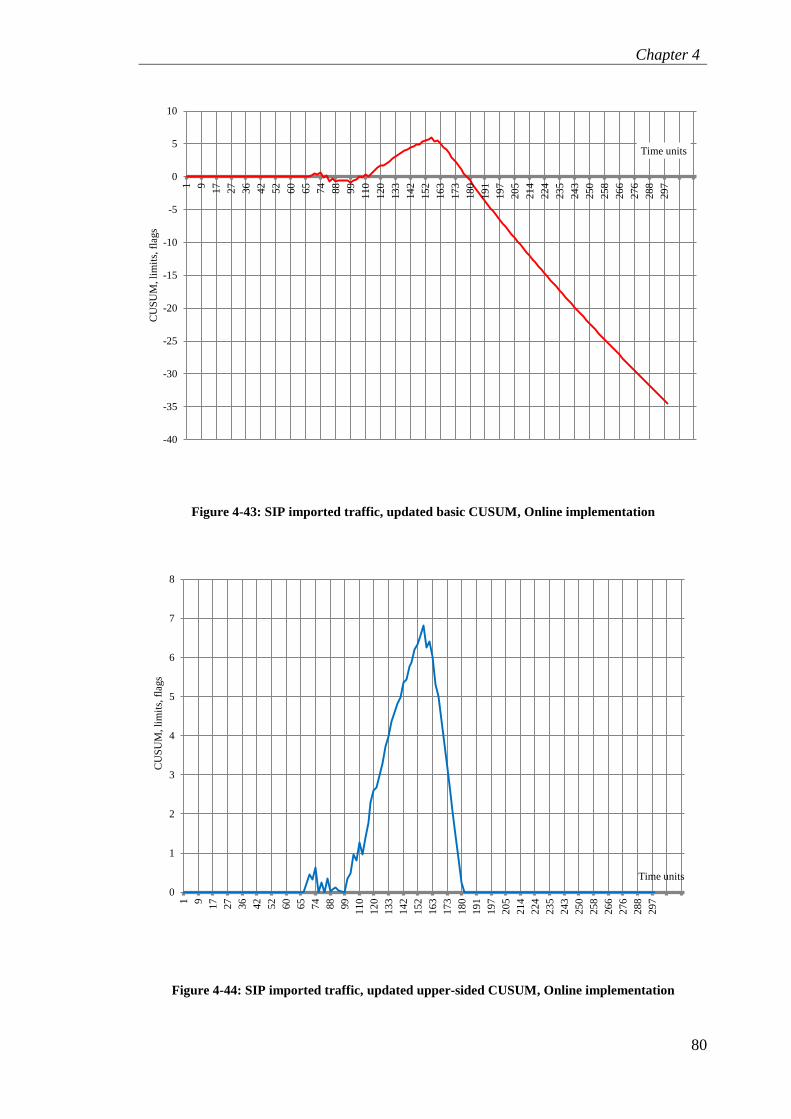
Figure 4-44: SIP imported traffic, updated upper-sided CUSUM, Online implementation
.................................................................................................................................... 80
Figure 4-45: SIP imported traffic, updated basic upper-sided CUSUM, Online
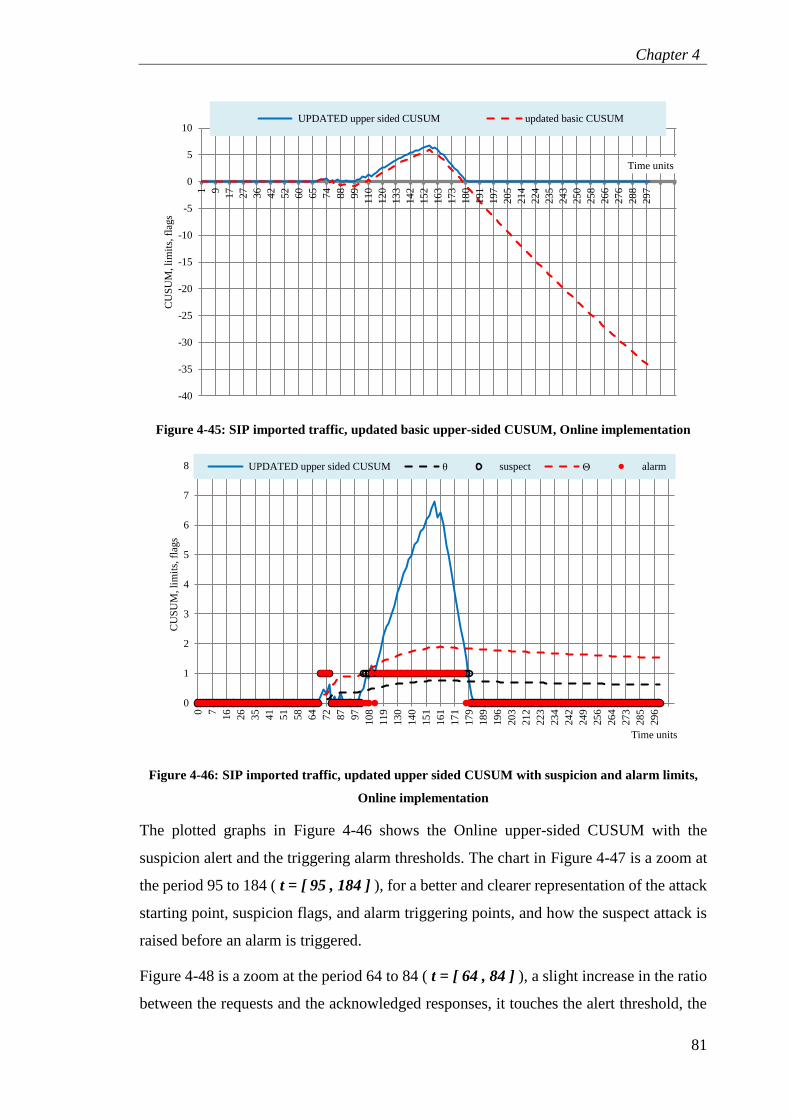
implementation ........................................................................................................... 81
Figure 4-46: SIP imported traffic, updated upper sided CUSUM with suspicion and alarm
limits, Online implementation .................................................................................... 81
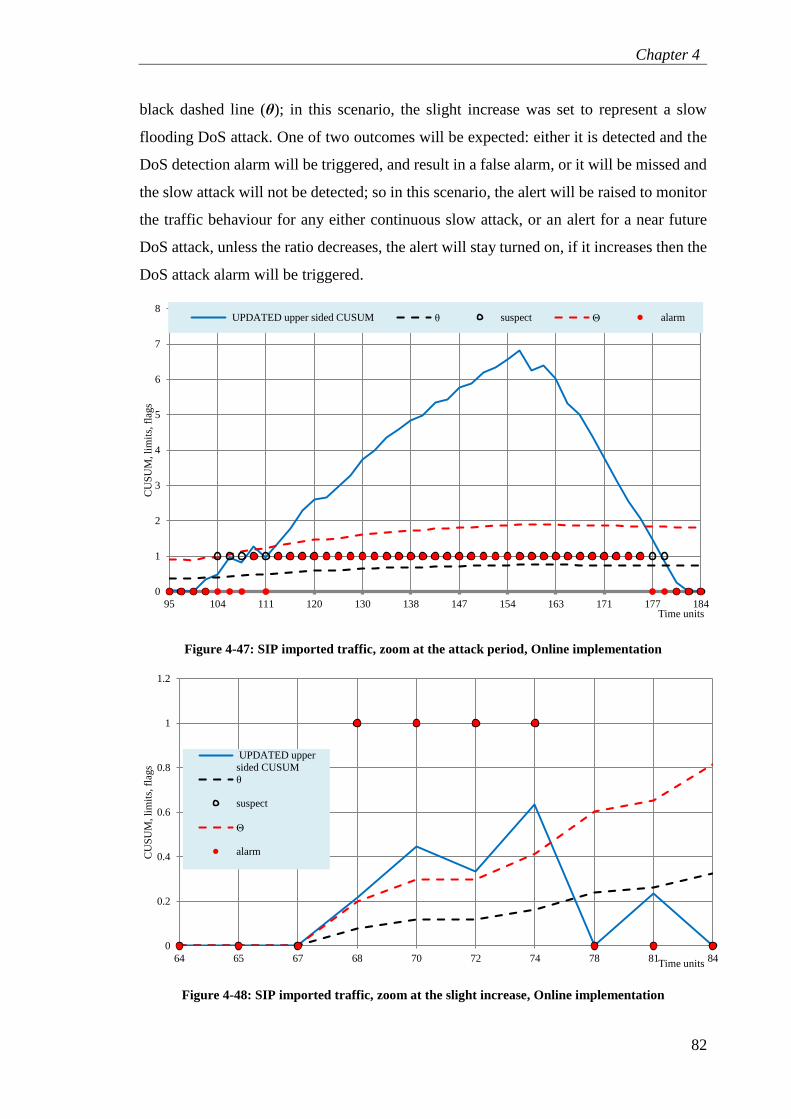
Figure 4-47: SIP imported traffic, zoom at the attack period, Online implementation ..... 82
Figure 4-48: SIP imported traffic, zoom at the slight increase, Online implementation ... 82
Figure 4-49: SIP imported traffic, large differences, basic EWMA, Offline
implementation ........................................................................................................... 83
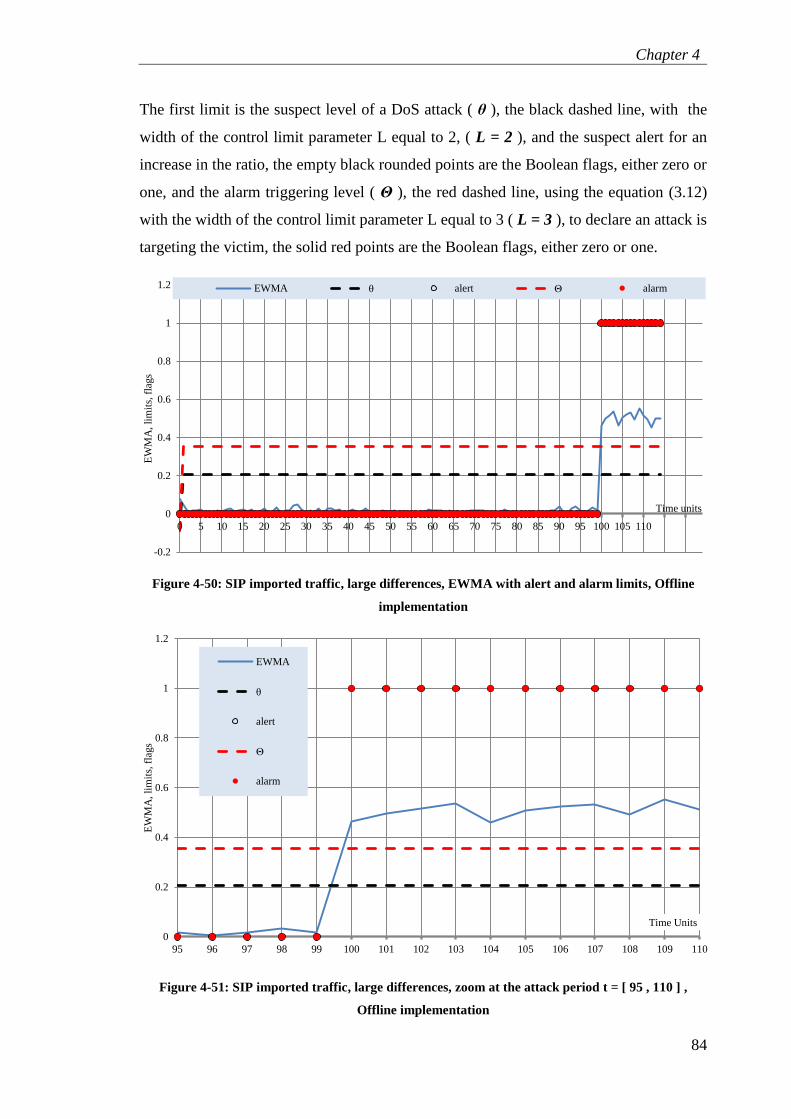
Figure 4-50: SIP imported traffic, large differences, EWMA with alert and alarm limits,
Offline implementation ............................................................................................... 84
Figure 4-51: SIP imported traffic, large differences, zoom at the attack period t = [ 95 ,
110 ] , Offline implementation ................................................................................... 84
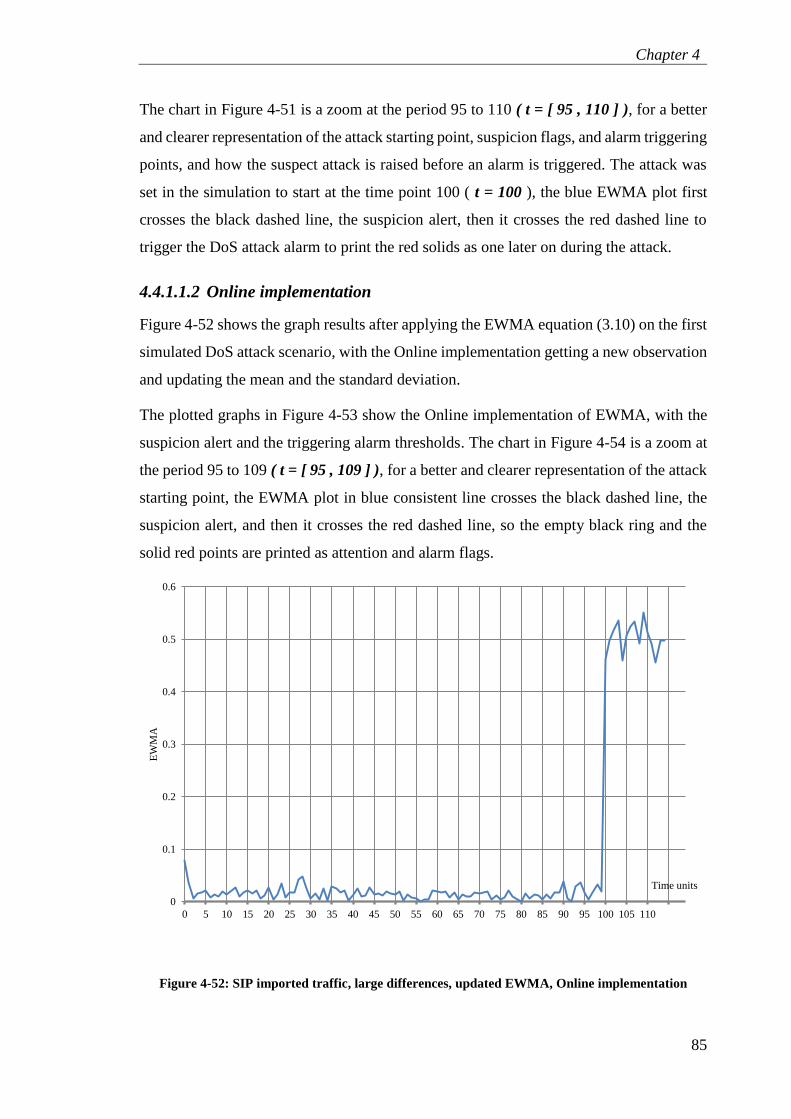
Figure 4-52: SIP imported traffic, large differences, updated EWMA, Online
implementation ........................................................................................................... 85
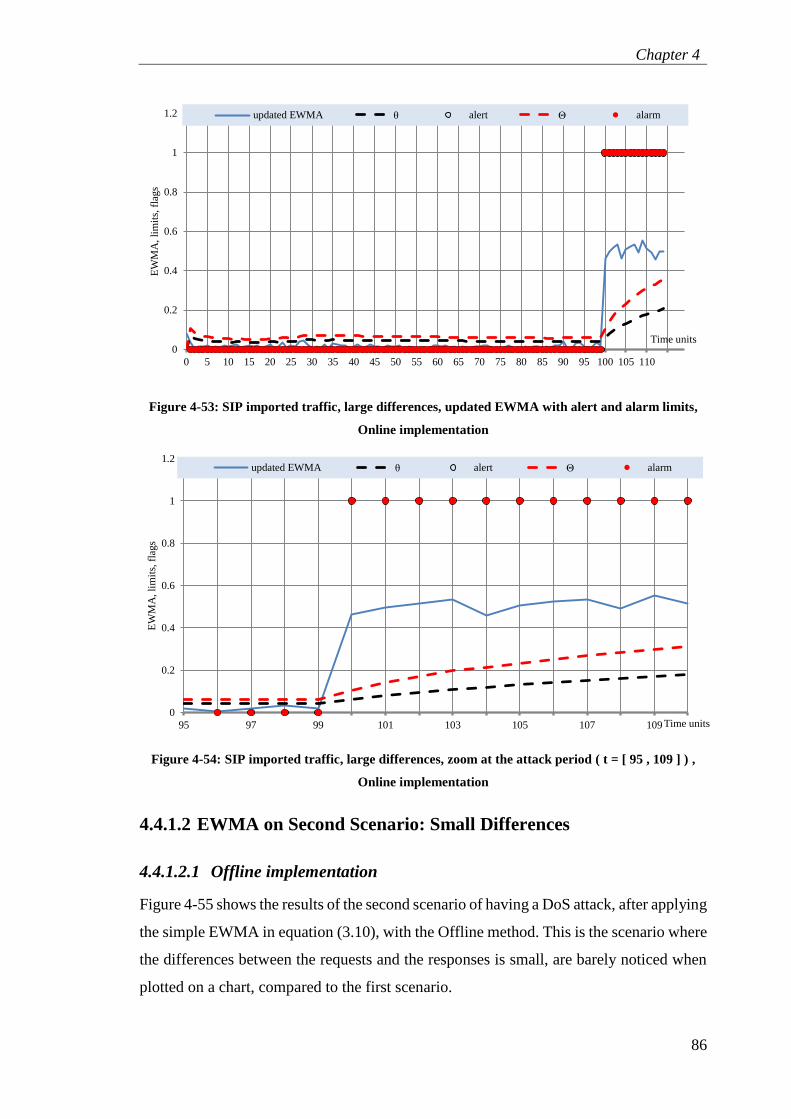
Figure 4-53: SIP imported traffic, large differences, updated EWMA with alert and alarm
limits, Online implementation .................................................................................... 86
Page 10
List of Figures
ix
Figure 4-54: SIP imported traffic, large differences, zoom at the attack period ( t = [ 95 ,
109 ] ) , Online implementation .................................................................................. 86
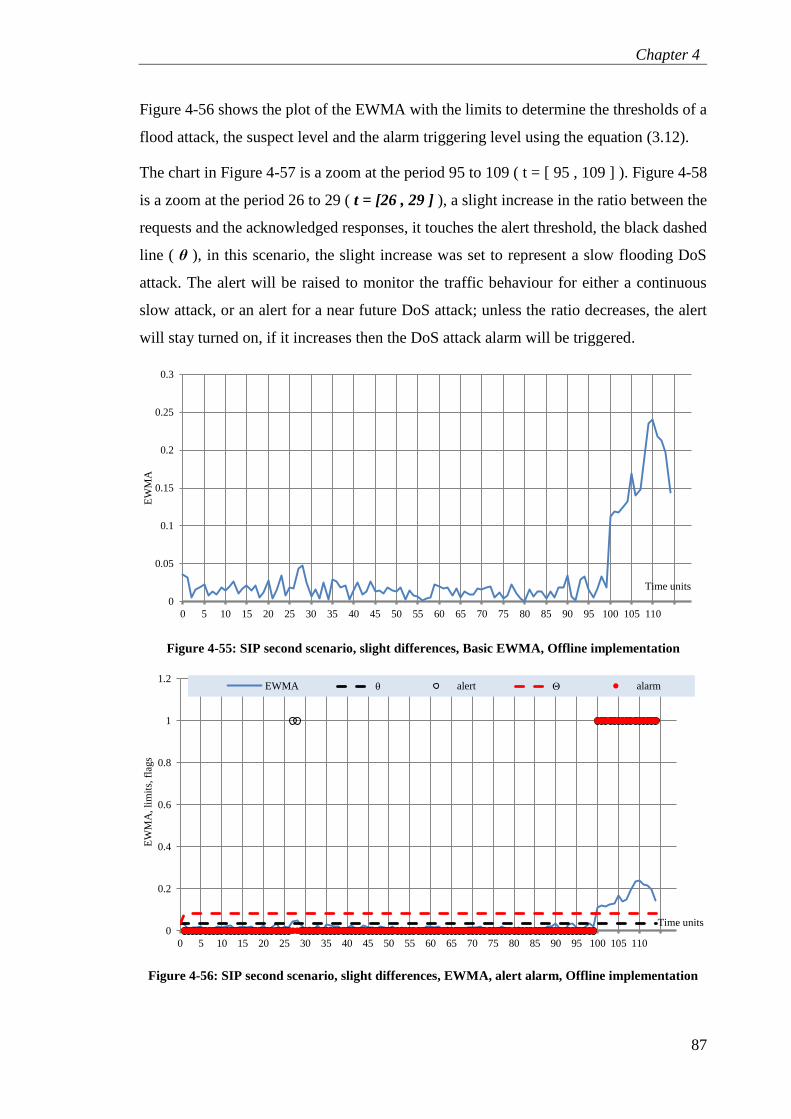
Figure 4-55: SIP second scenario, slight differences, Basic EWMA, Offline
implementation ........................................................................................................... 87
Figure 4-56: SIP second scenario, slight differences, EWMA, alert alarm, Offline
implementation ........................................................................................................... 87
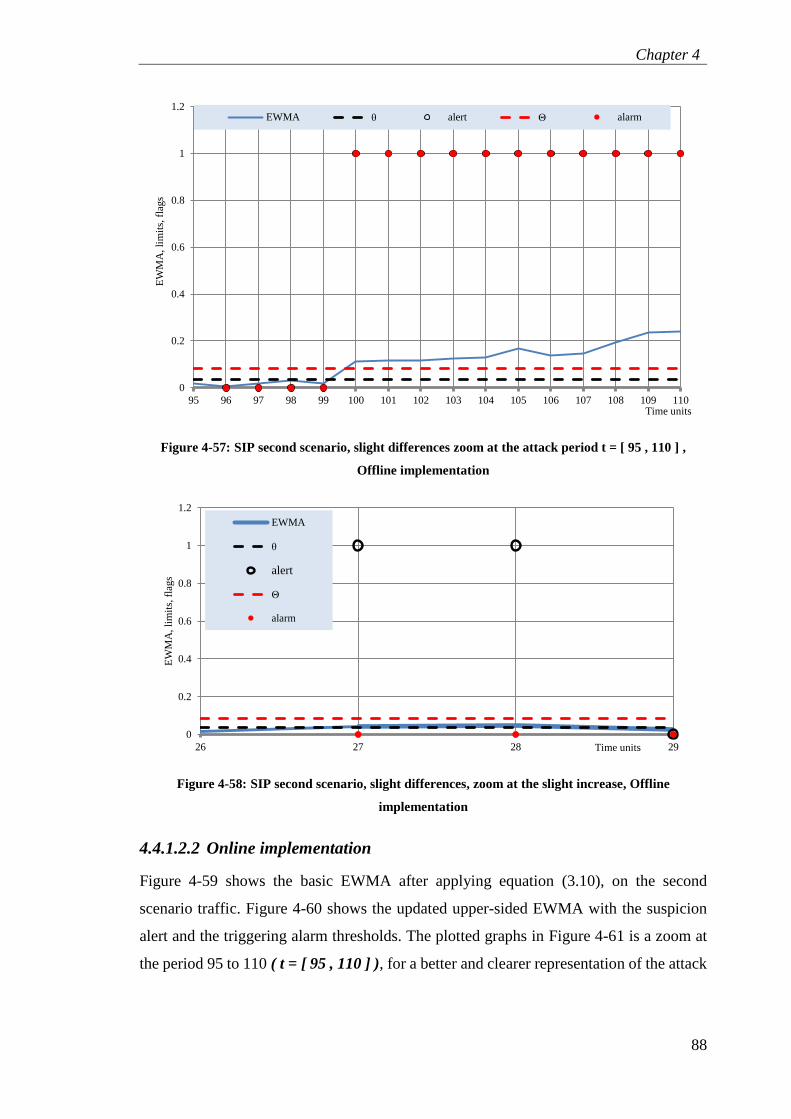
Figure 4-57: SIP second scenario, slight differences zoom at the attack period t = [ 95 ,
110 ] , Offline implementation ................................................................................... 88
Figure 4-58: SIP second scenario, slight differences, zoom at the slight increase, Offline
implementation ........................................................................................................... 88
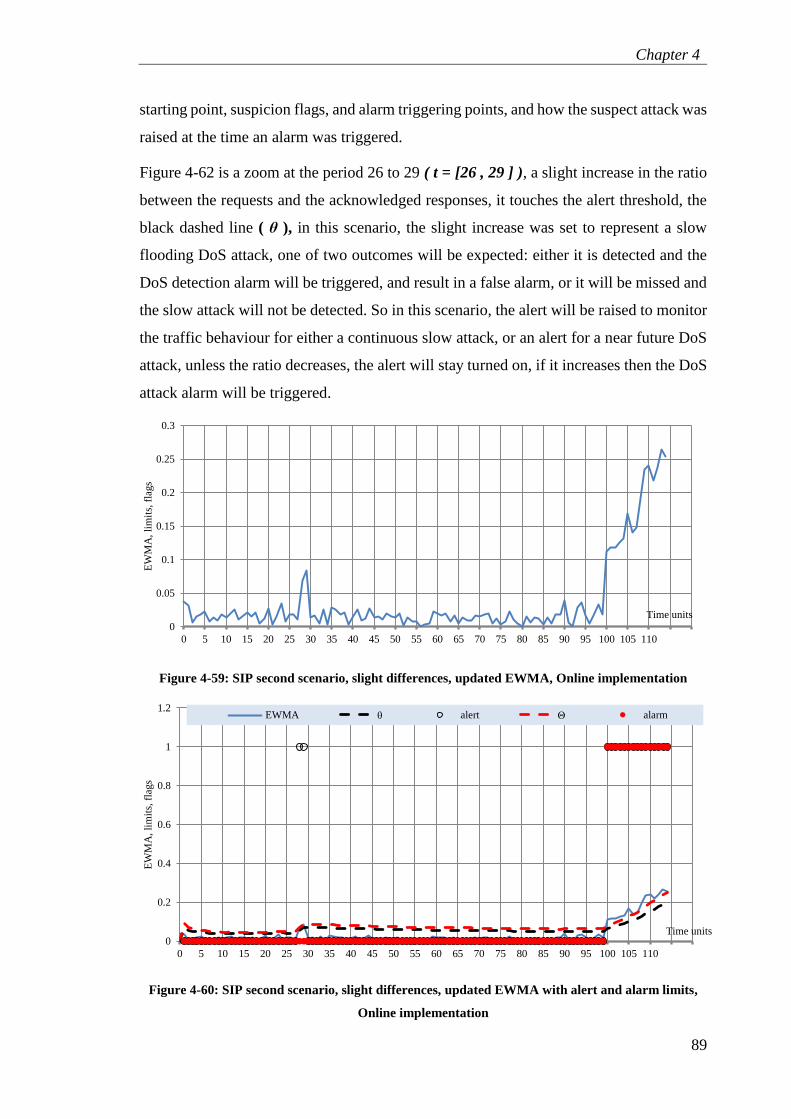
Figure 4-59: SIP second scenario, slight differences, updated EWMA, Online
implementation ........................................................................................................... 89
Figure 4-60: SIP second scenario, slight differences, updated EWMA with alert and alarm
limits, Online implementation .................................................................................... 89
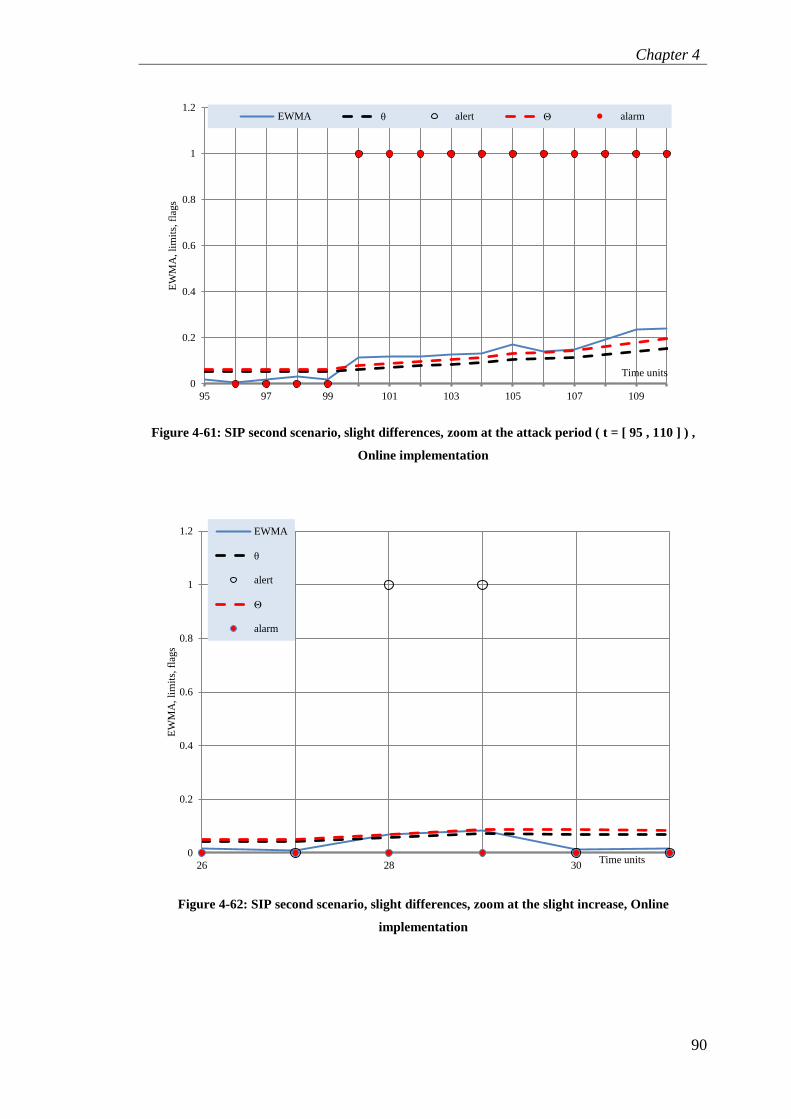
Figure 4-61: SIP second scenario, slight differences, zoom at the attack period ( t = [ 95 ,
110 ] ) , Online implementation .................................................................................. 90
Figure 4-62: SIP second scenario, slight differences, zoom at the slight increase, Online
implementation ........................................................................................................... 90
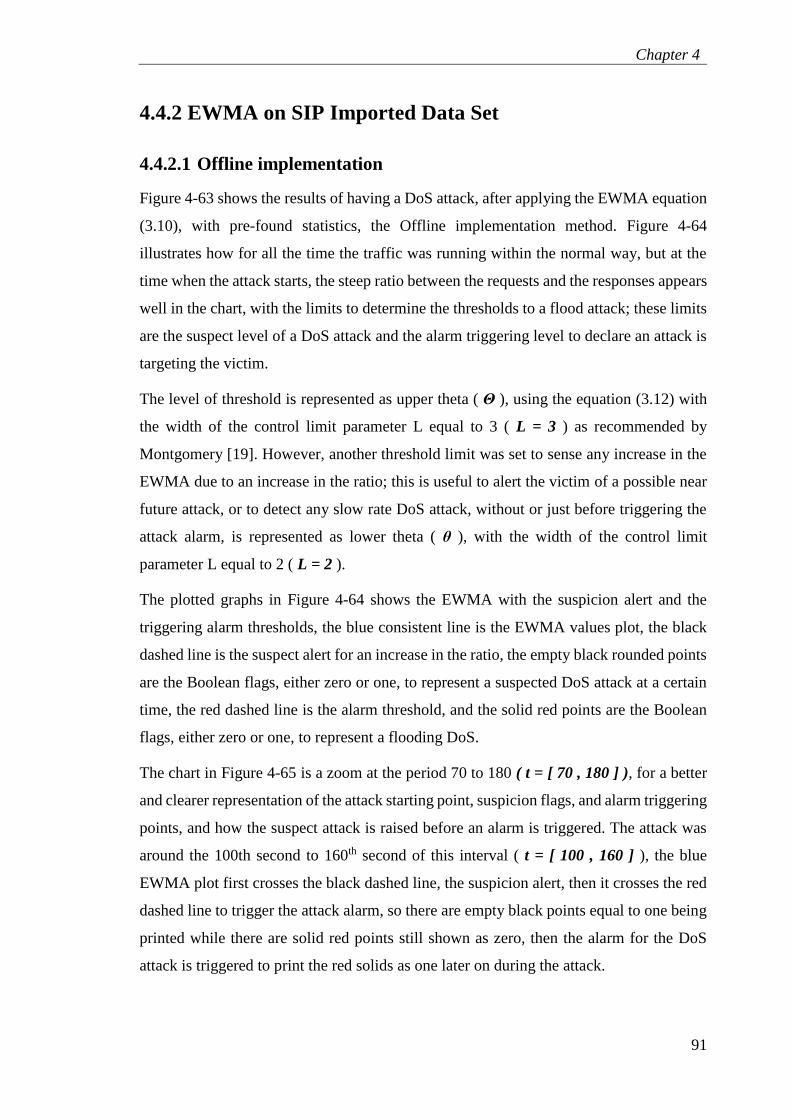
Figure 4-63: SIP Imported traffic, basic EWMA on imported traffic, Offline
implementation ........................................................................................................... 92
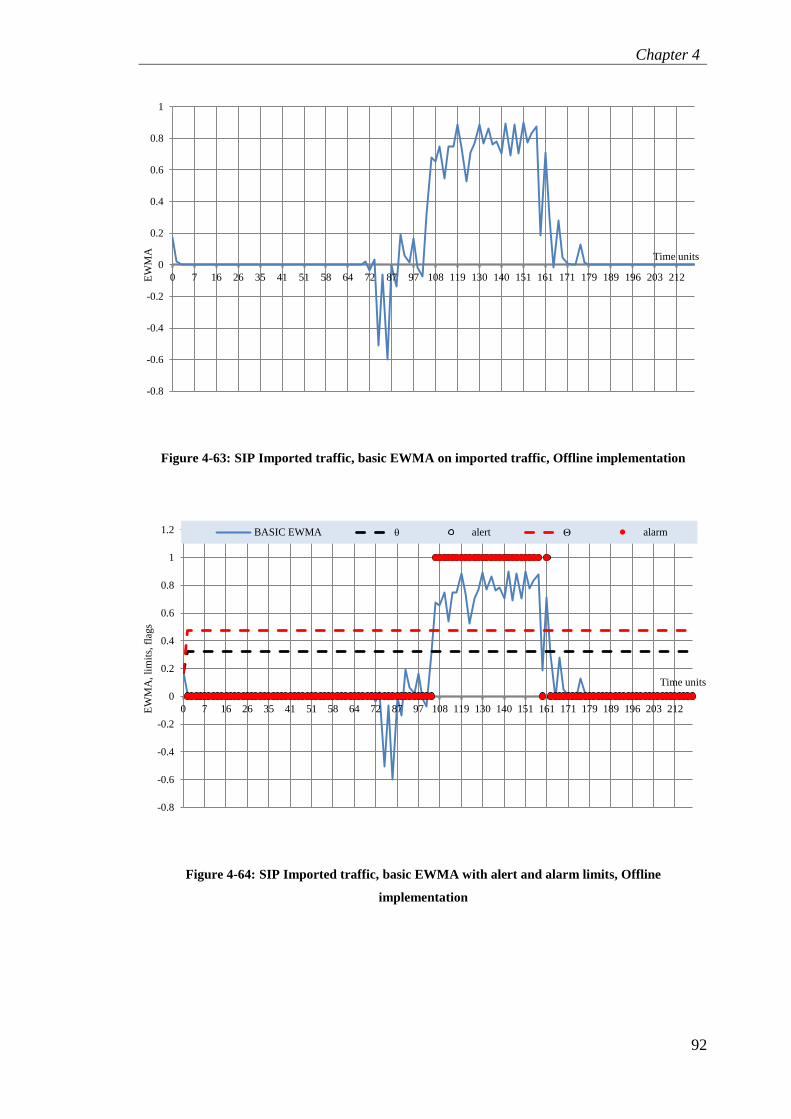
Figure 4-64: SIP Imported traffic, basic EWMA with alert and alarm limits, Offline
implementation ........................................................................................................... 92
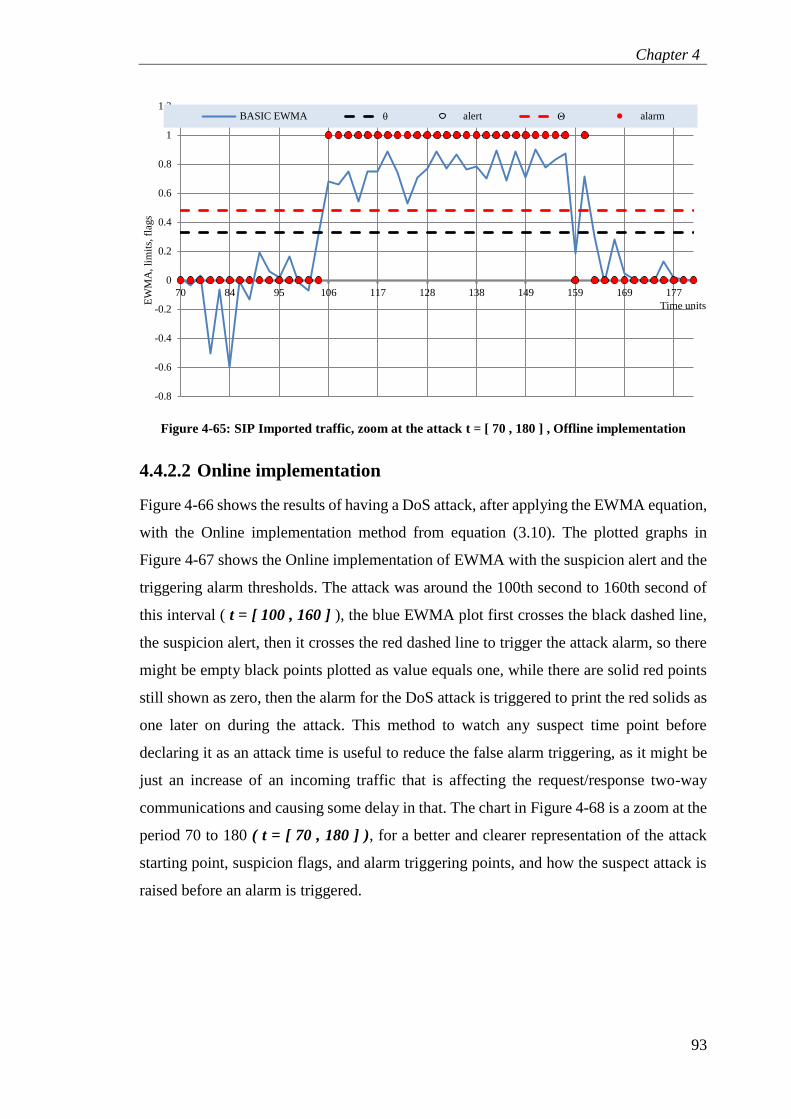
Figure 4-65: SIP Imported traffic, zoom at the attack t = [ 70 , 180 ] , Offline
implementation ........................................................................................................... 93
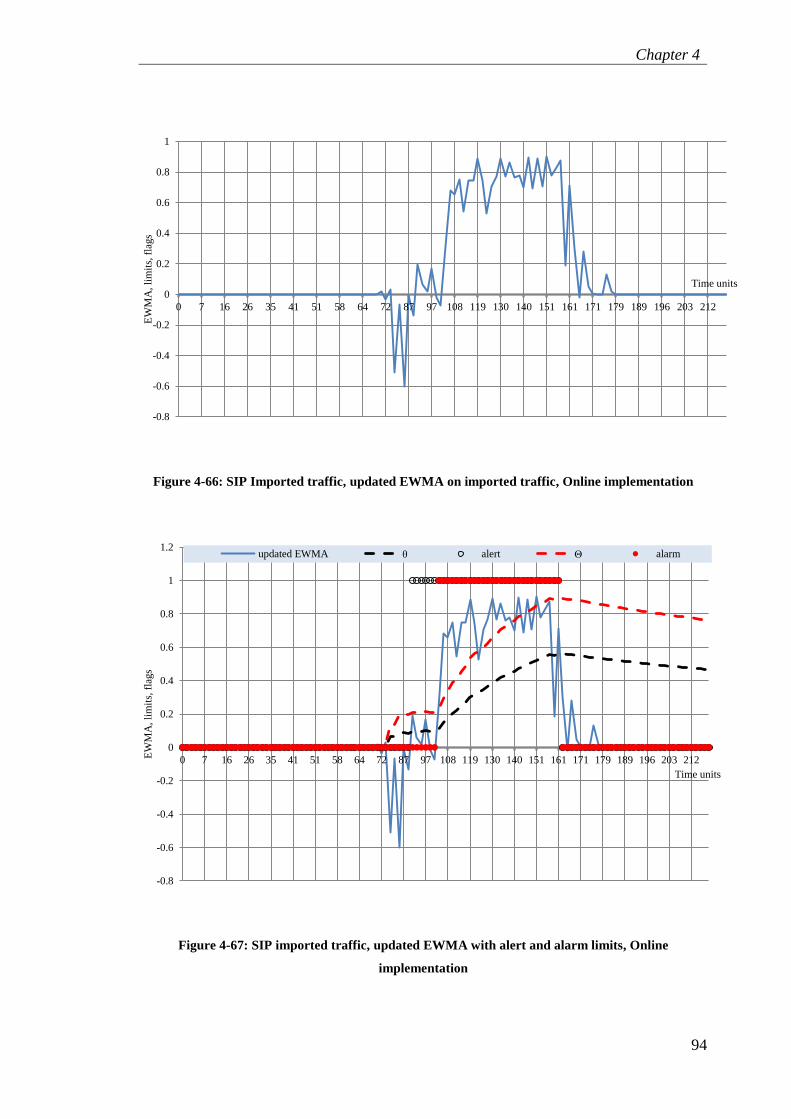
Figure 4-66: SIP Imported traffic, updated EWMA on imported traffic, Online
implementation ........................................................................................................... 94
Figure 4-67: SIP imported traffic, updated EWMA with alert and alarm limits, Online
implementation ........................................................................................................... 94
Figure 4-68: SIP Imported traffic, zoom at the attack t = [ 70 , 180 ] , Online
implementation ........................................................................................................... 95
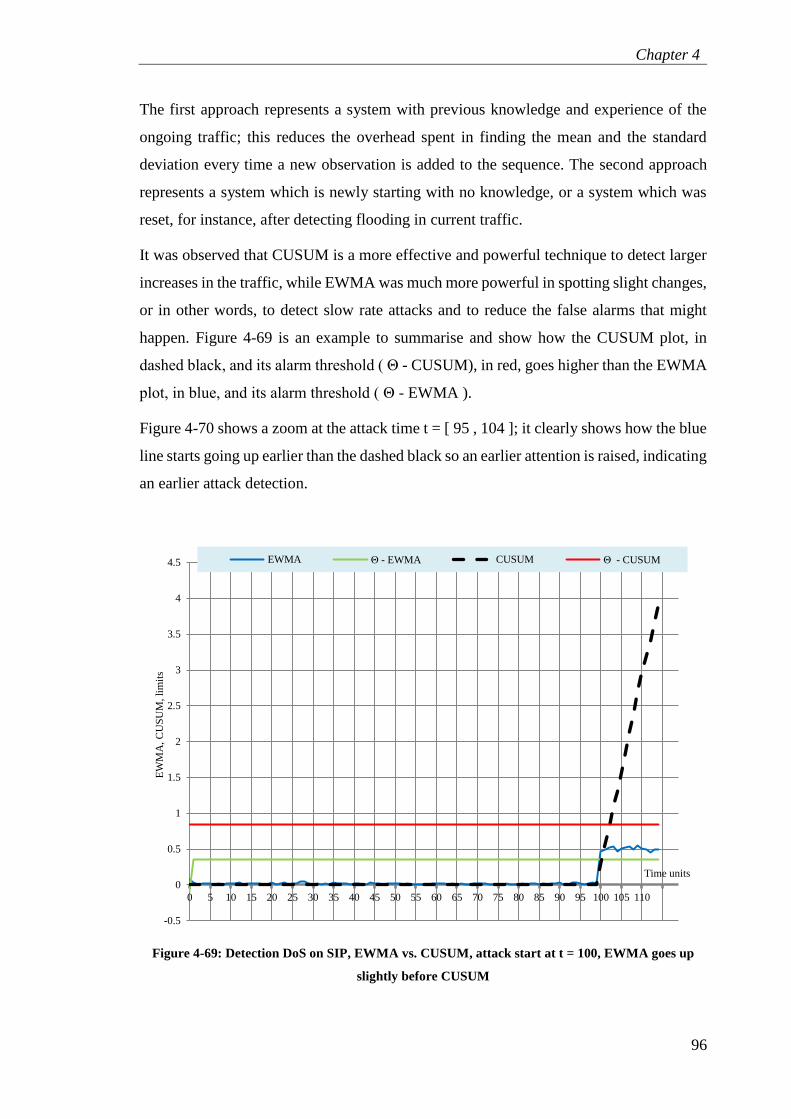
Figure 4-69: Detection DoS on SIP, EWMA vs. CUSUM, attack start at t = 100, EWMA
goes up slightly before CUSUM ................................................................................ 96
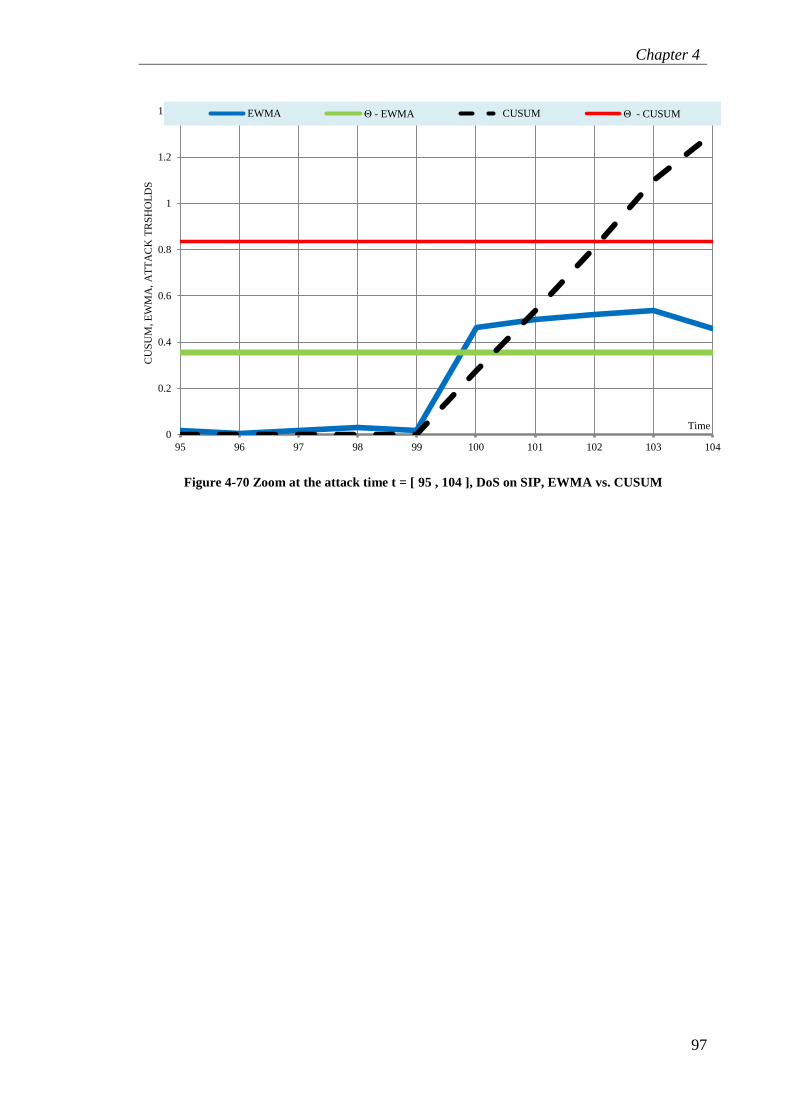
Figure 4-70 Zoom at the attack time t = [ 95 , 104 ], DoS on SIP, EWMA vs. CUSUM . 97
Page 11
List of Figures
x
Figure 5-1: SPDY Scenario network architecture ............................................................. 98
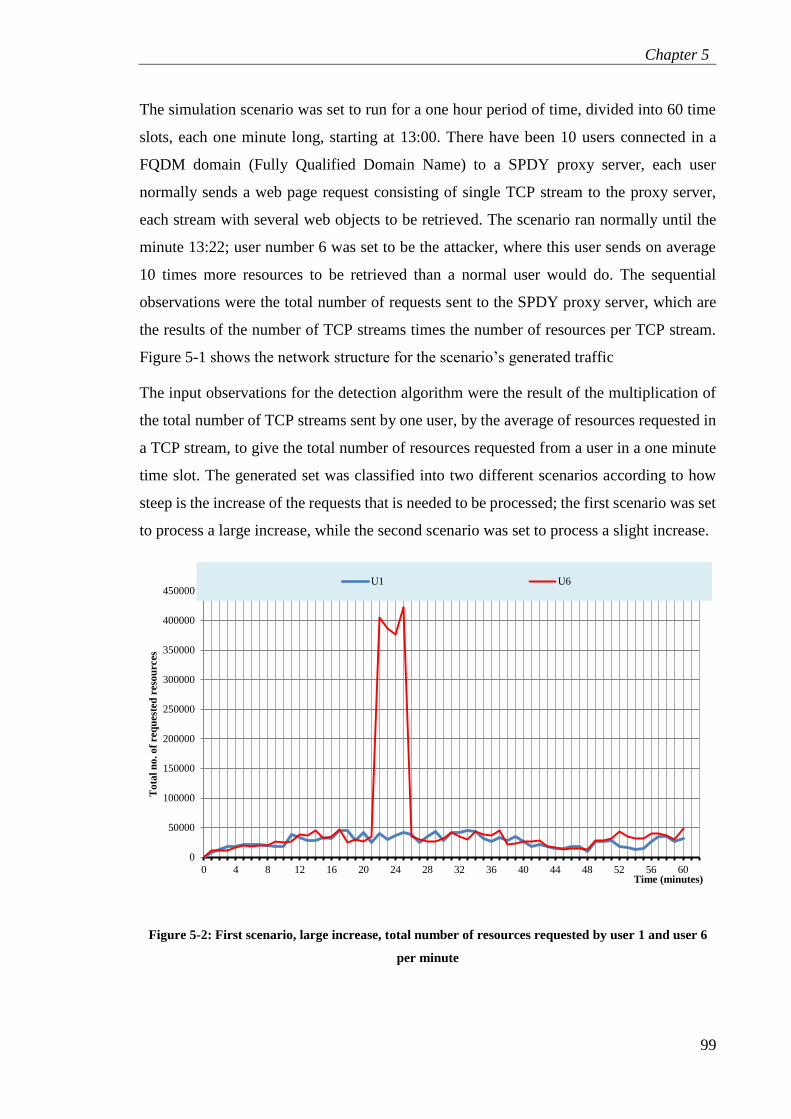
Figure 5-2: First scenario, large increase, total number of resources requested by user 1
and user 6 per minute .................................................................................................. 99
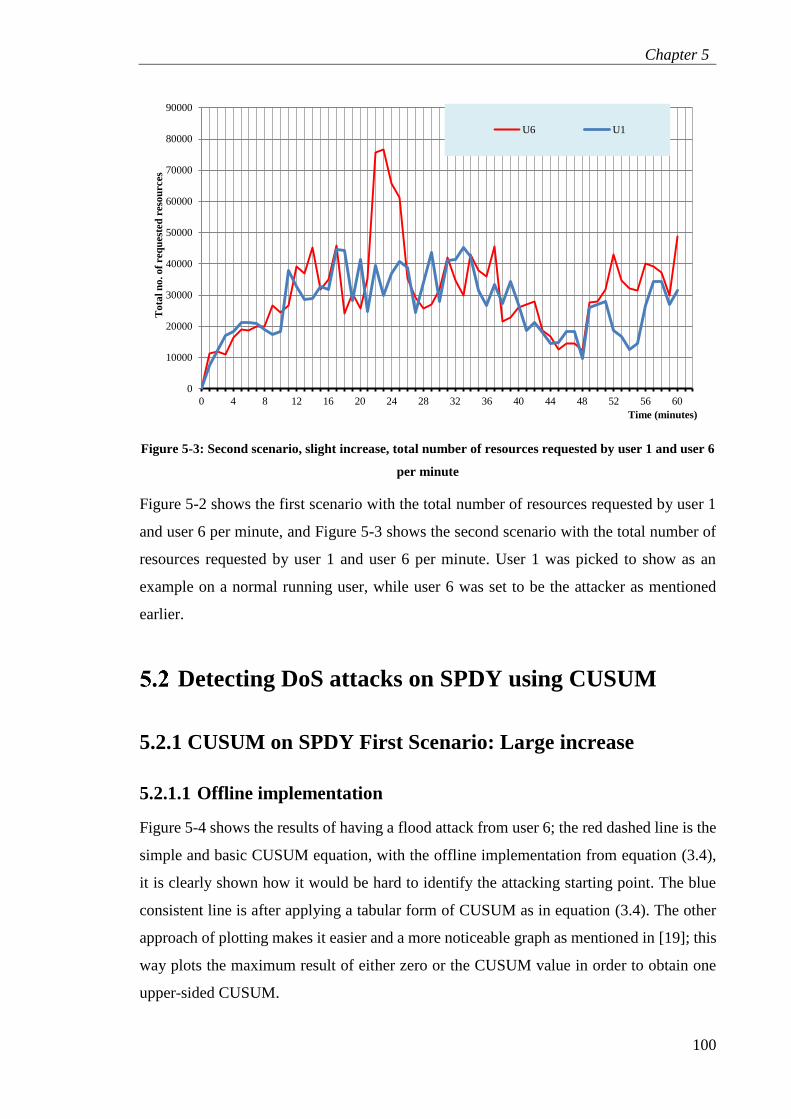
Figure 5-3: Second scenario, slight increase, total number of resources requested by user
1 and user 6 per minute ............................................................................................. 100
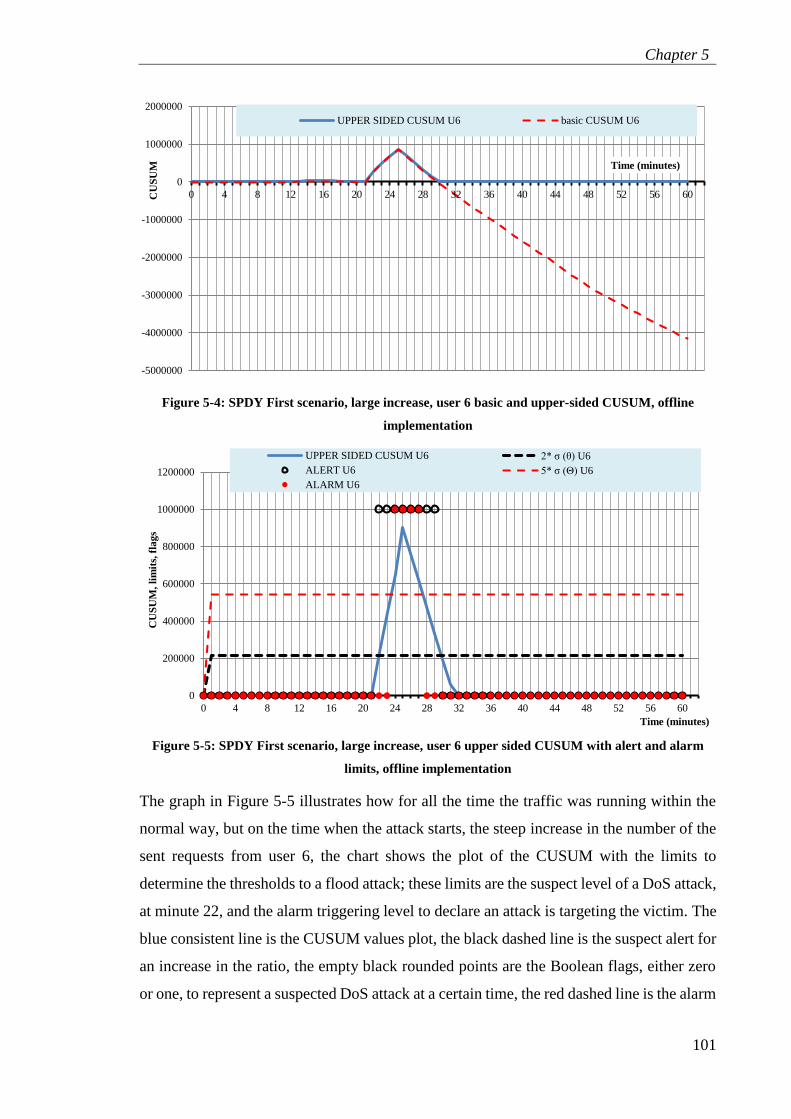
Figure 5-4: SPDY First scenario, large increase, user 6 basic and upper-sided CUSUM,
offline implementation ............................................................................................. 101
Figure 5-5: SPDY First scenario, large increase, user 6 upper sided CUSUM with alert
and alarm limits, offline implementation ................................................................. 101
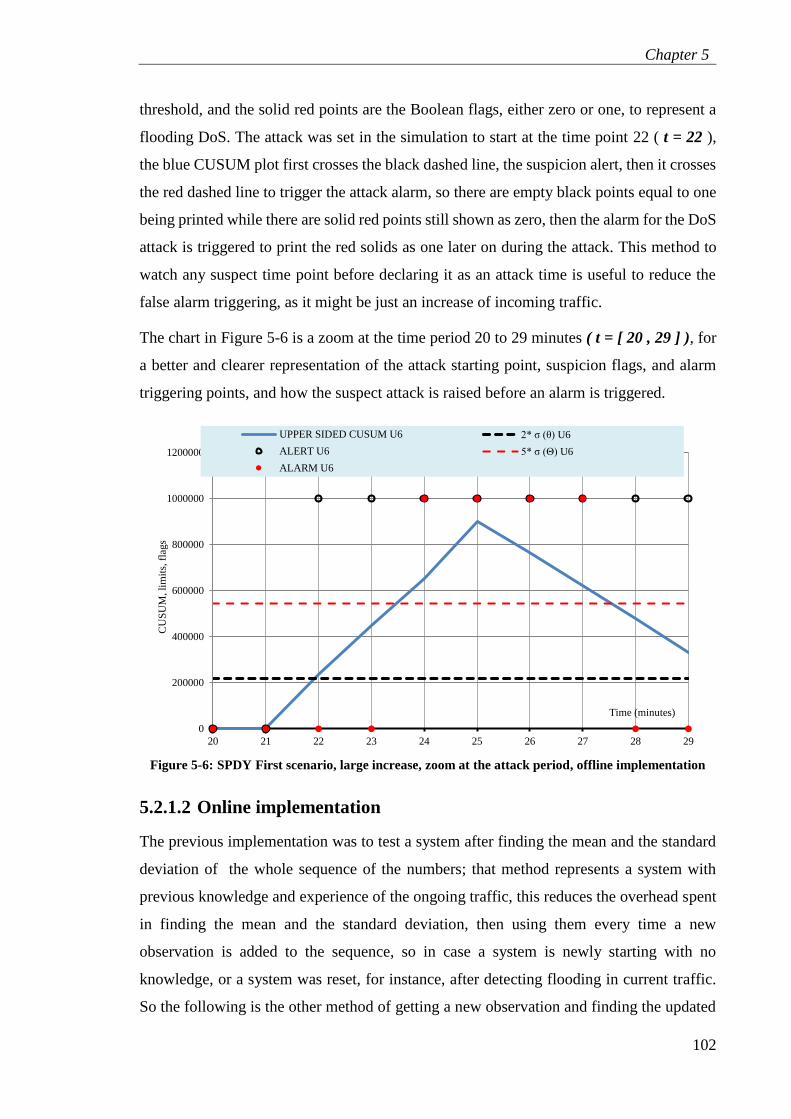
Figure 5-6: SPDY First scenario, large increase, zoom at the attack period, offline
implementation ......................................................................................................... 102
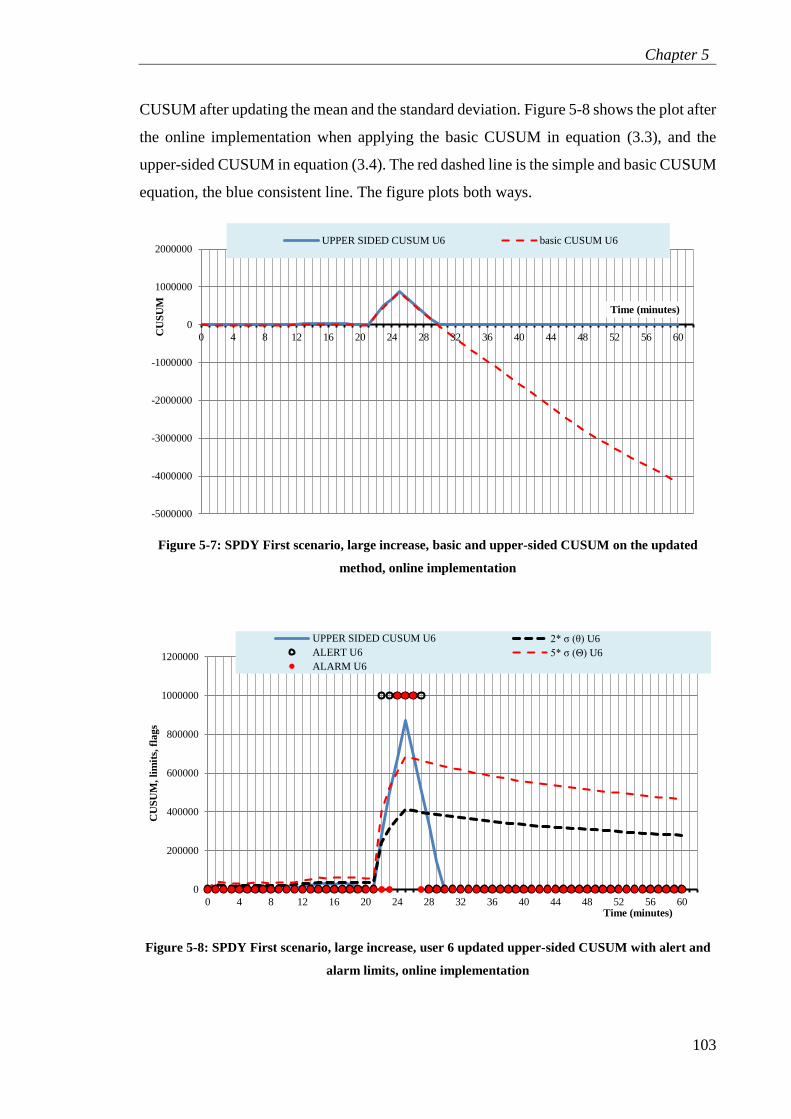
Figure 5-7: SPDY First scenario, large increase, basic and upper-sided CUSUM on the
updated method, online implementation .................................................................. 103
Figure 5-8: SPDY First scenario, large increase, user 6 updated upper-sided CUSUM with
alert and alarm limits, online implementation .......................................................... 103
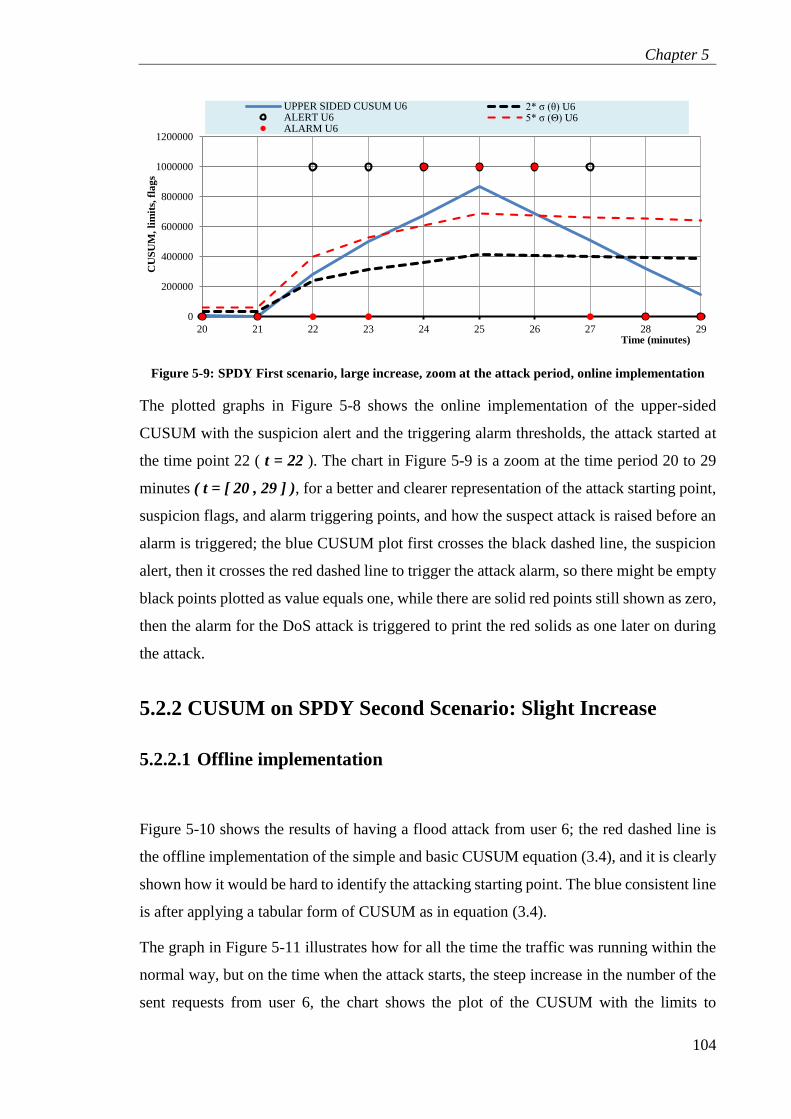
Figure 5-9: SPDY First scenario, large increase, zoom at the attack period, online
implementation ......................................................................................................... 104
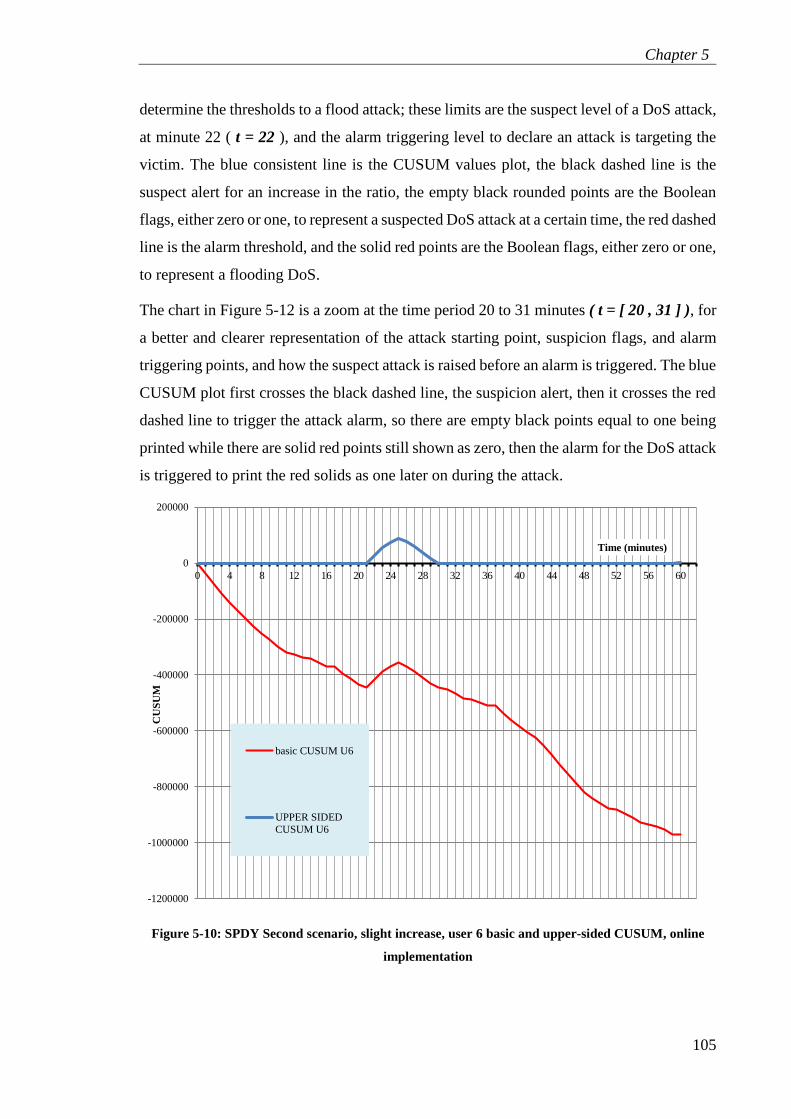
Figure 5-10: SPDY Second scenario, slight increase, user 6 basic and upper-sided
CUSUM, online implementation .............................................................................. 105
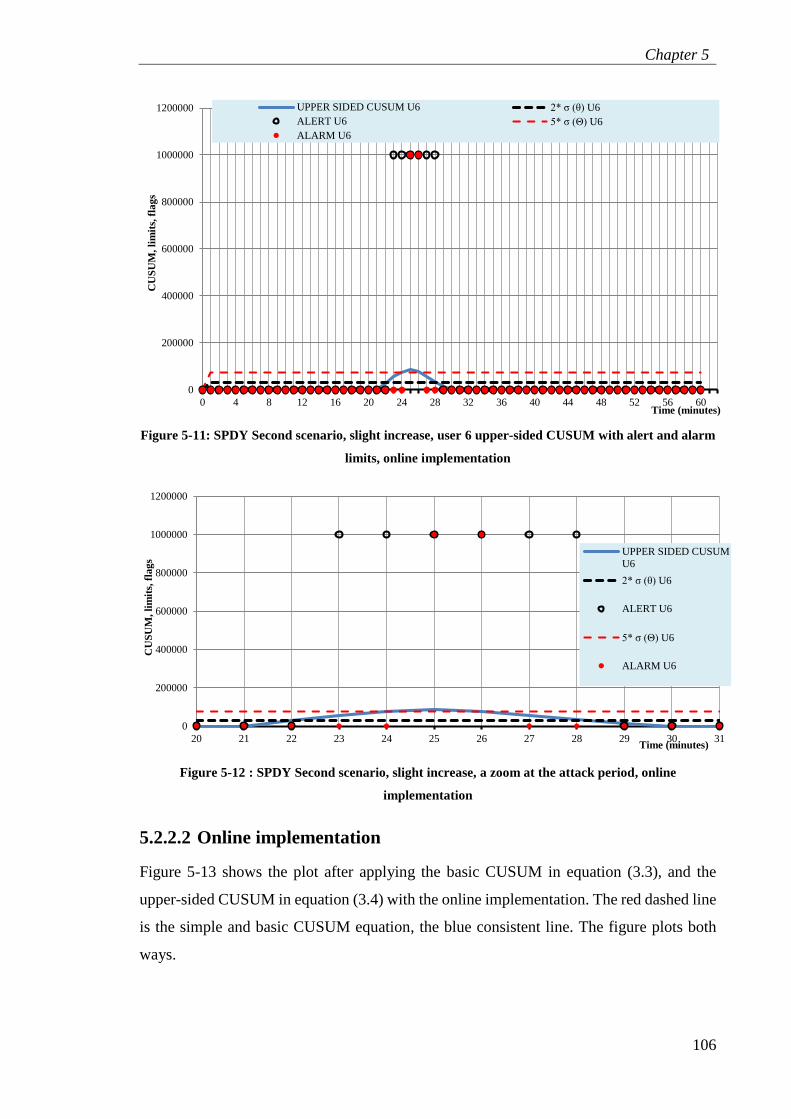
Figure 5-11: SPDY Second scenario, slight increase, user 6 upper-sided CUSUM with
alert and alarm limits, online implementation .......................................................... 106
Figure 5-12 : SPDY Second scenario, slight increase, a zoom at the attack period, online
implementation ......................................................................................................... 106
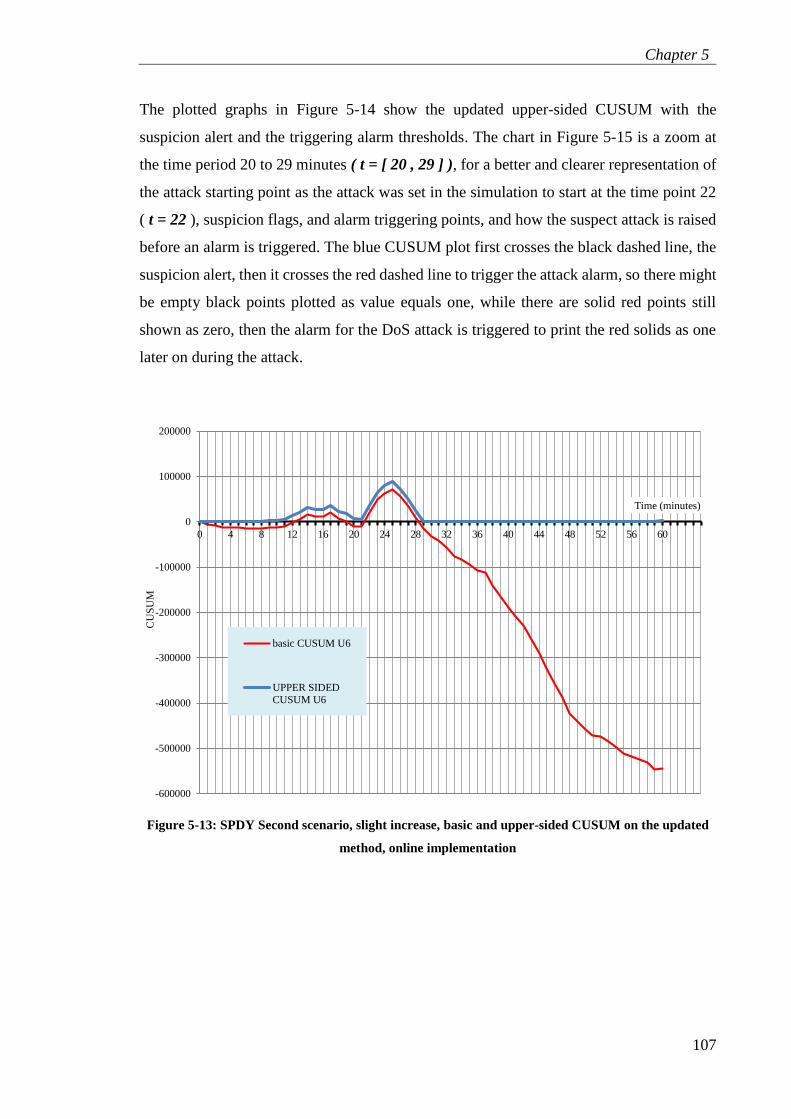
Figure 5-13: SPDY Second scenario, slight increase, basic and upper-sided CUSUM on
the updated method, online implementation ............................................................. 107
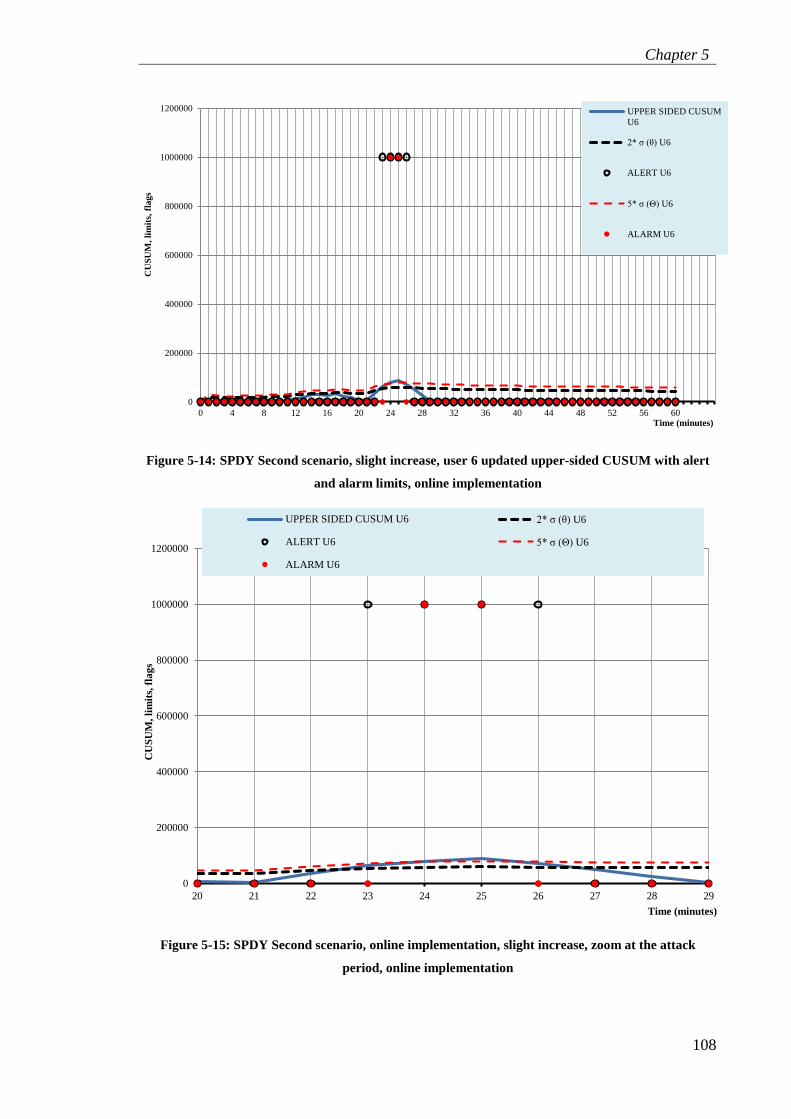
Figure 5-14: SPDY Second scenario, slight increase, user 6 updated upper-sided CUSUM
with alert and alarm limits, online implementation .................................................. 108
Figure 5-15: SPDY Second scenario, online implementation, slight increase, zoom at the
attack period, online implementation ....................................................................... 108
Figure 5-16: SPDY first scenario, large increase, basic EWMA, offline implementation
.................................................................................................................................. 110
Figure 5-17: SPDY first scenario, large increase, EWMA with alert and alarm limits,
offline implementation ............................................................................................. 110
Page 12
List of Figures
xi
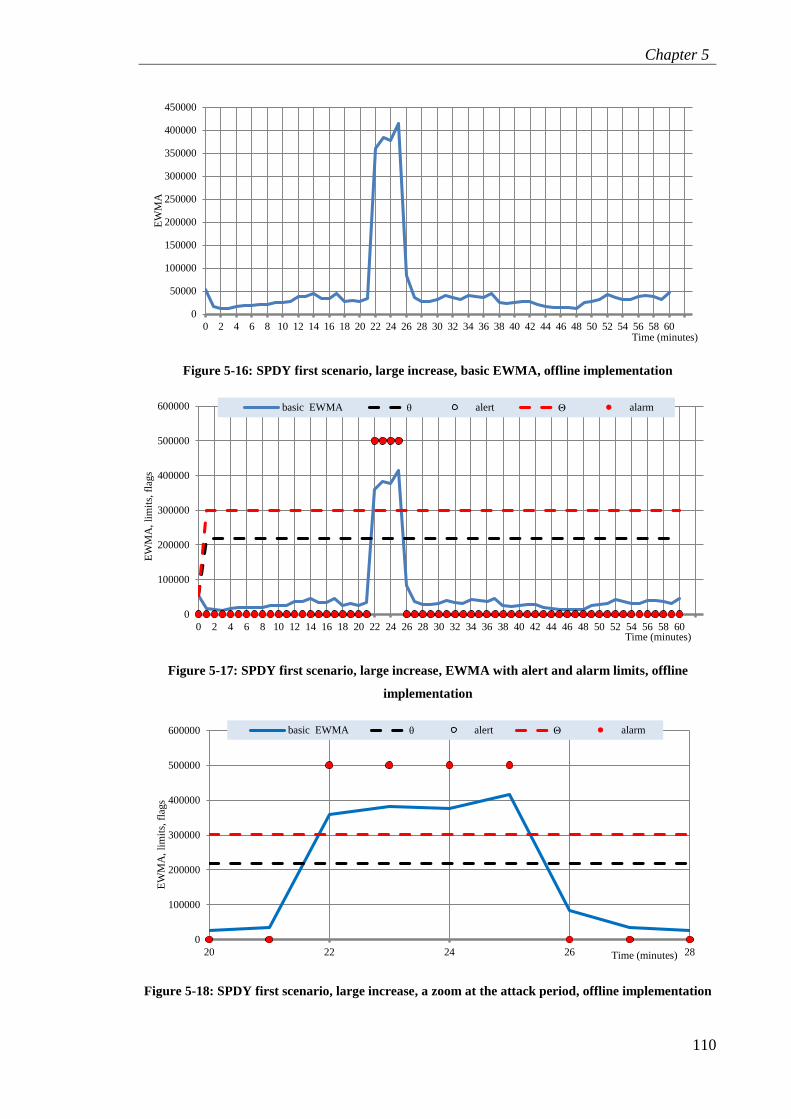
Figure 5-18: SPDY first scenario, large increase, a zoom at the attack period, offline
implementation ......................................................................................................... 110
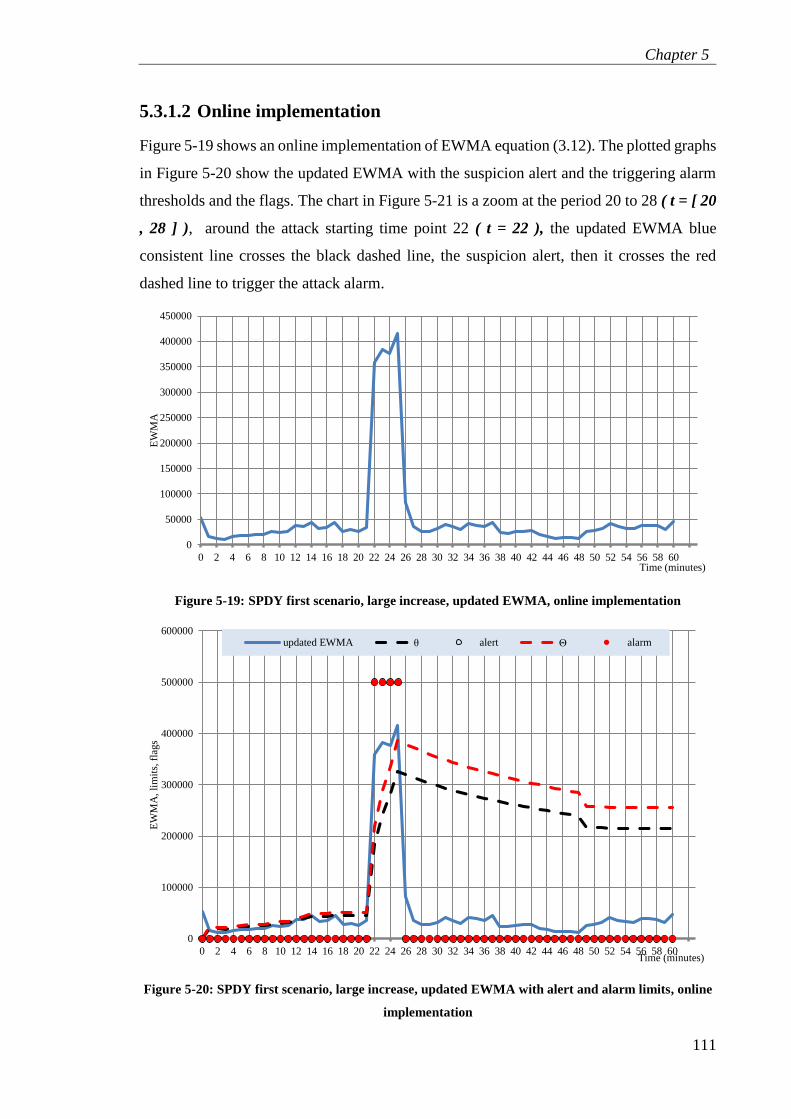
Figure 5-19: SPDY first scenario, large increase, updated EWMA, online implementation
.................................................................................................................................. 111
Figure 5-20: SPDY first scenario, large increase, updated EWMA with alert and alarm
limits, online implementation ................................................................................... 111
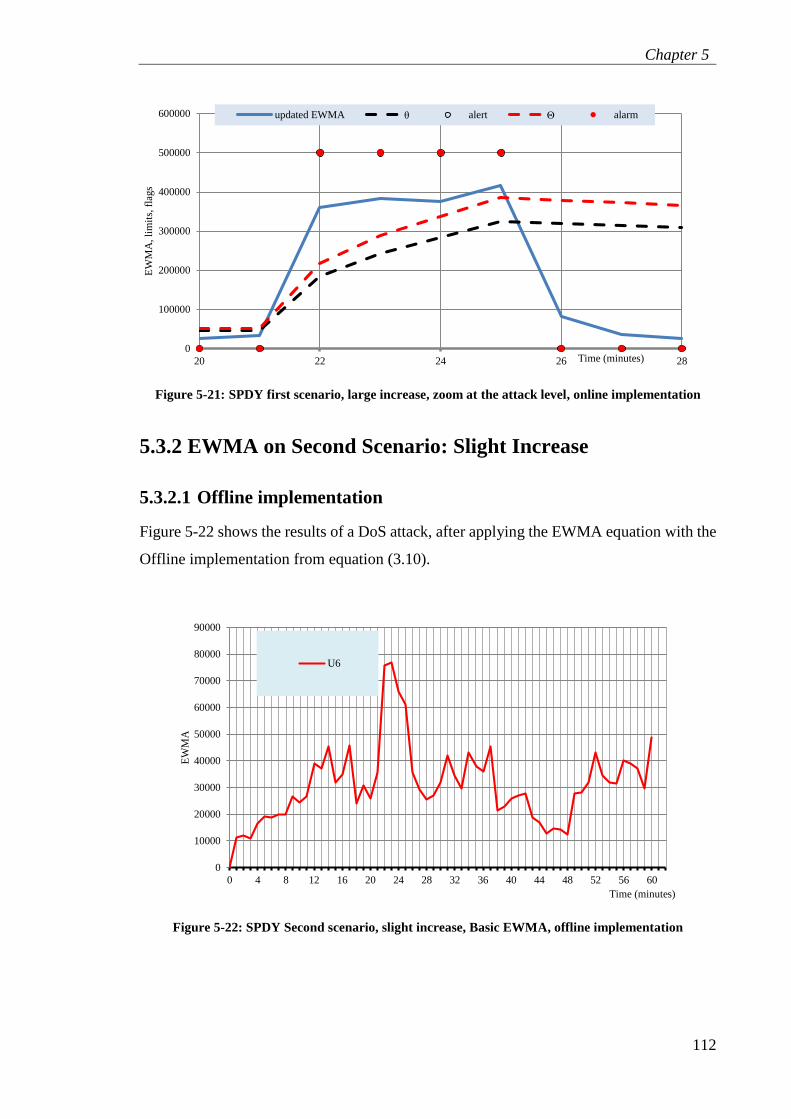
Figure 5-21: SPDY first scenario, large increase, zoom at the attack level, online
implementation ......................................................................................................... 112
Figure 5-22: SPDY Second scenario, slight increase, Basic EWMA, offline
implementation ......................................................................................................... 112
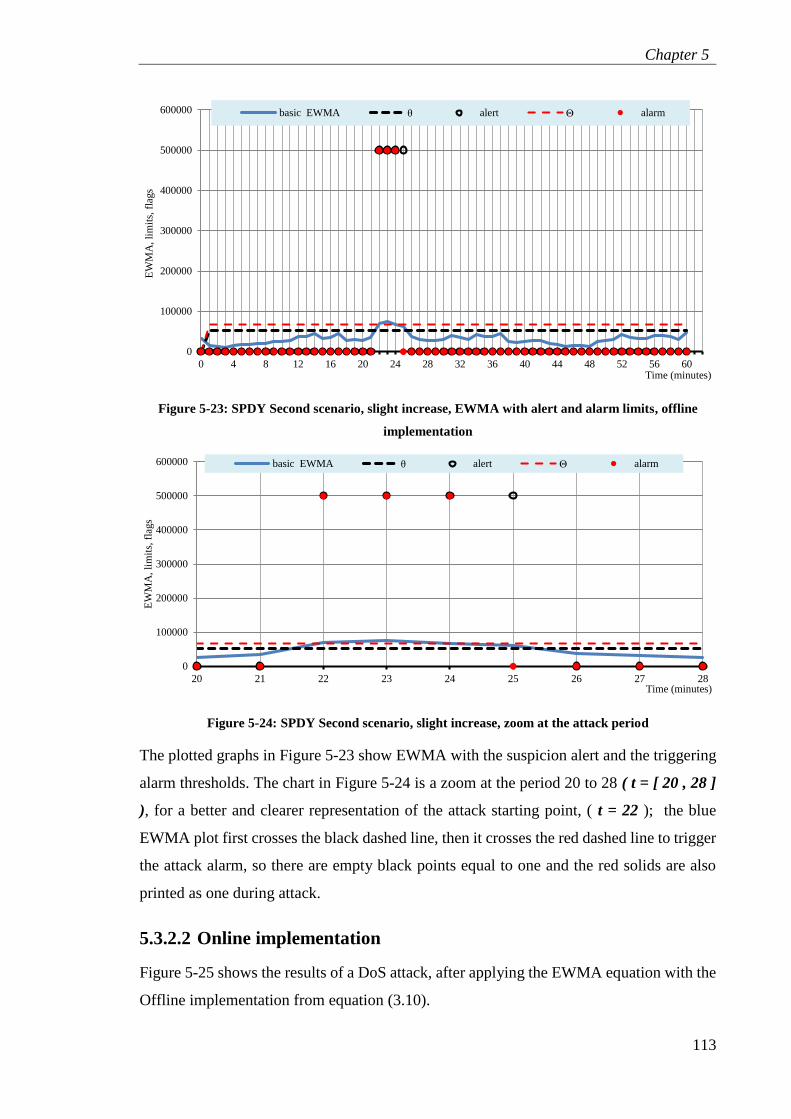
Figure 5-23: SPDY Second scenario, slight increase, EWMA with alert and alarm limits,
offline implementation ............................................................................................. 113
Figure 5-24: SPDY Second scenario, slight increase, zoom at the attack period ............ 113
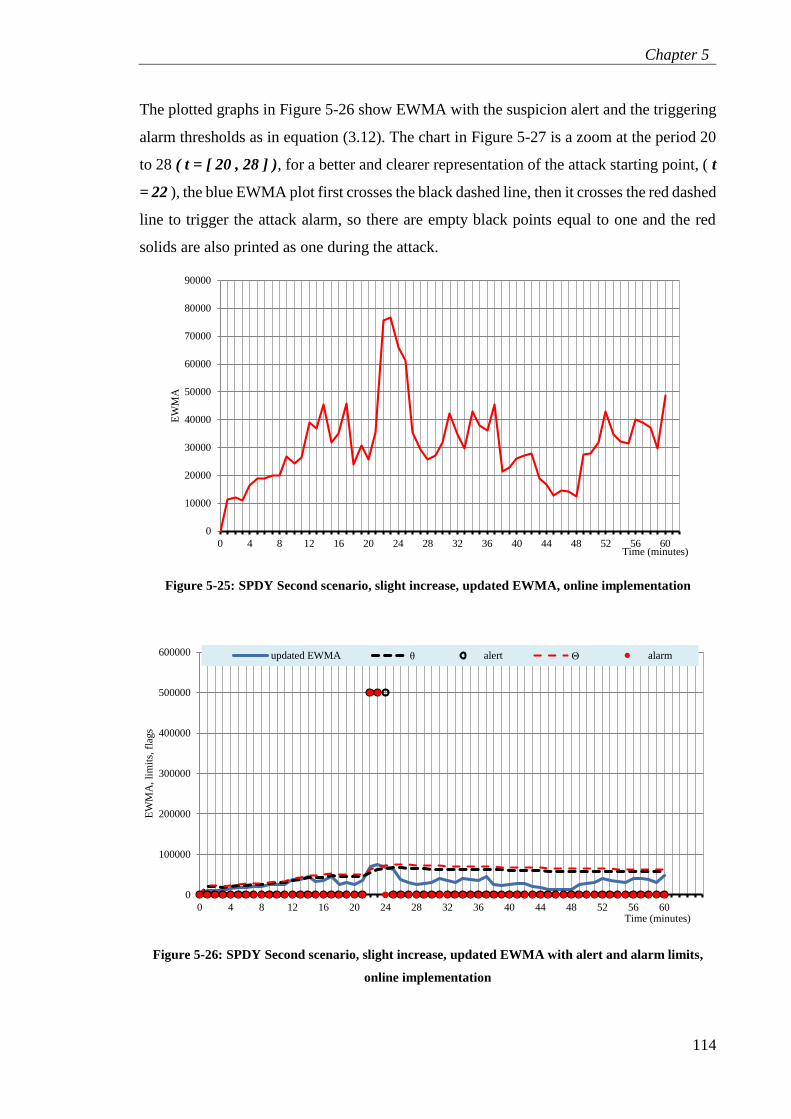
Figure 5-25: SPDY Second scenario, slight increase, updated EWMA, online
implementation ......................................................................................................... 114
Figure 5-26: SPDY Second scenario, slight increase, updated EWMA with alert and
alarm limits, online implementation ......................................................................... 114
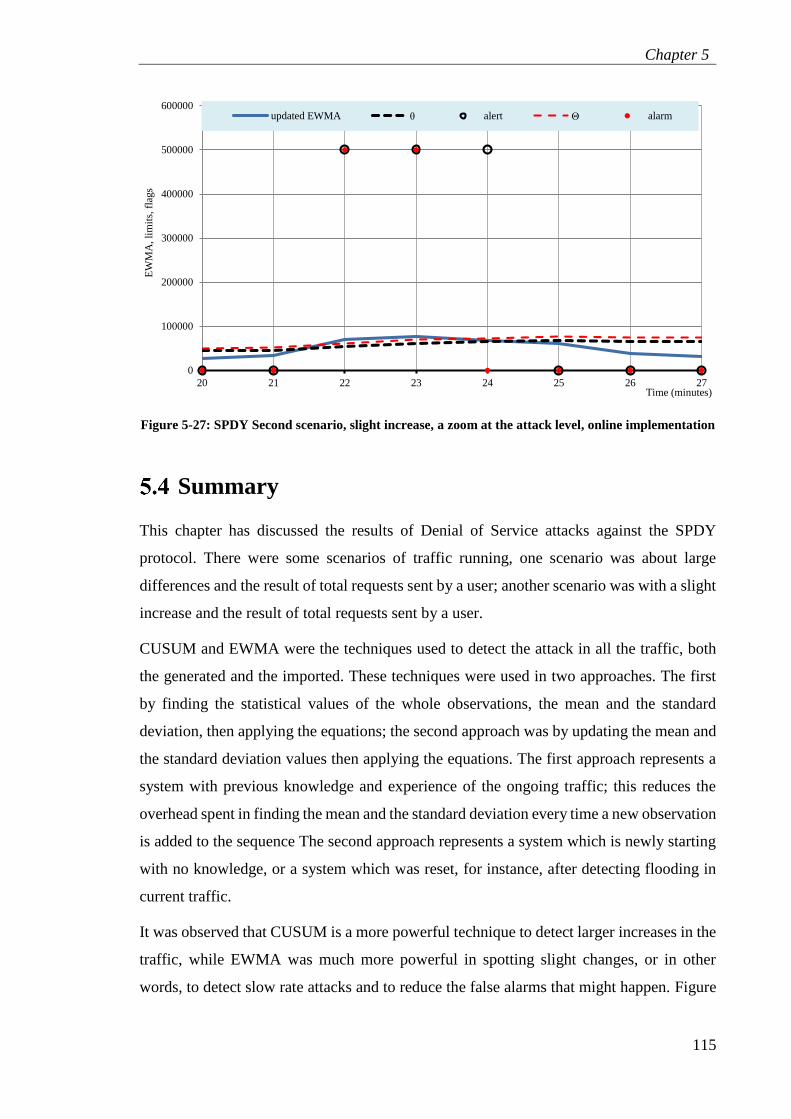
Figure 5-27: SPDY Second scenario, slight increase, a zoom at the attack level, online
implementation ......................................................................................................... 115
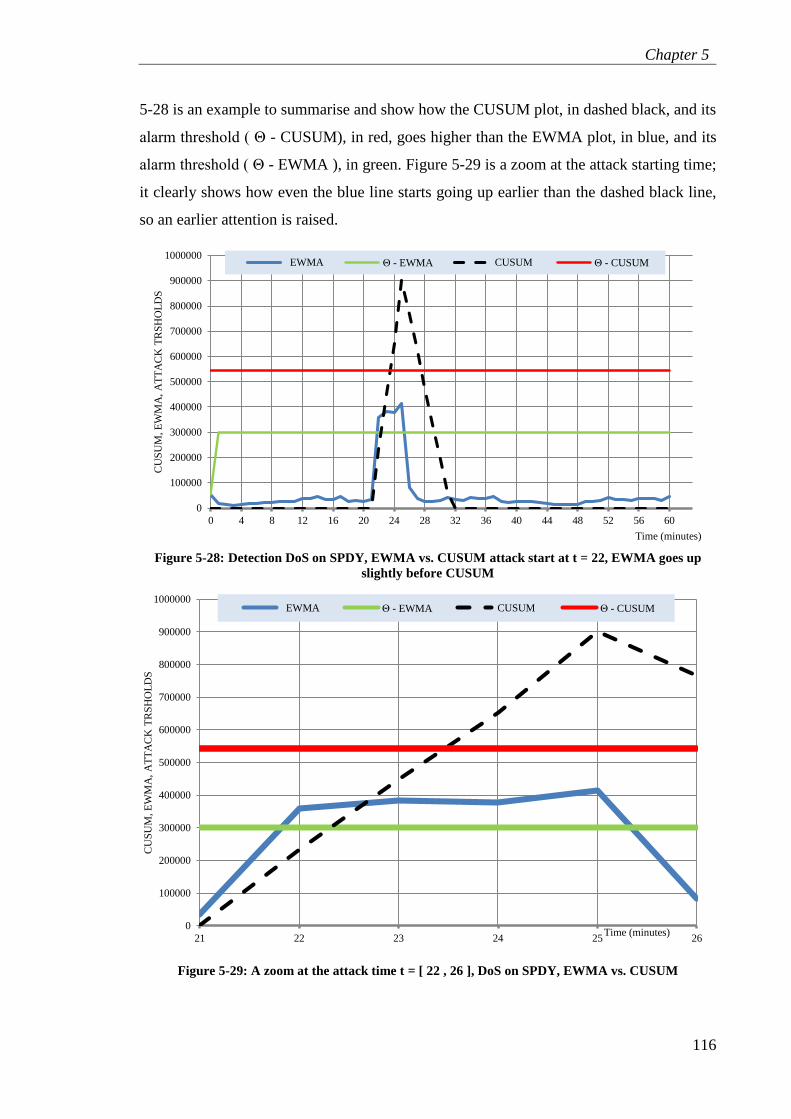
Figure 5-28: Detection DoS on SPDY, EWMA vs. CUSUM attack start at t = 22, EWMA
goes up slightly before CUSUM .............................................................................. 116
Figure 5-29: A zoom at the attack time t = [ 22 , 26 ], DoS on SPDY, EWMA vs.
CUSUM .................................................................................................................... 116
Figure 6-1: General design and component of the proposed framework ......................... 118
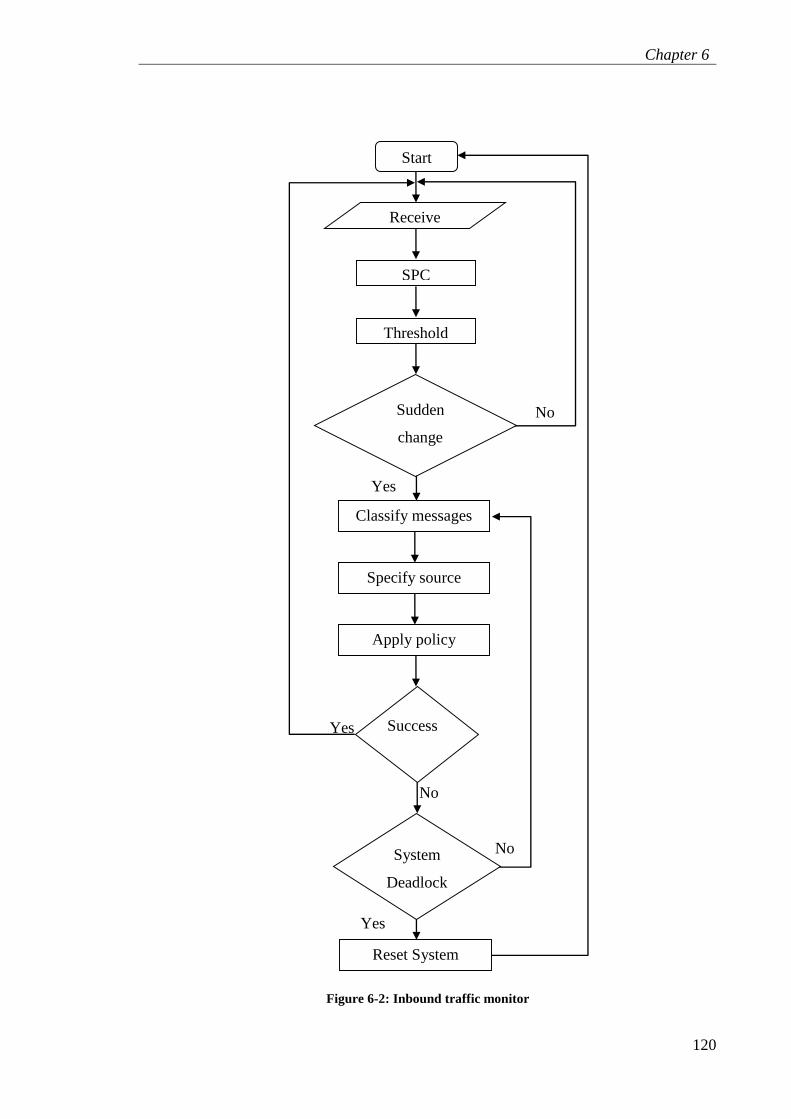
Figure 6-2: Inbound traffic monitor ................................................................................. 120
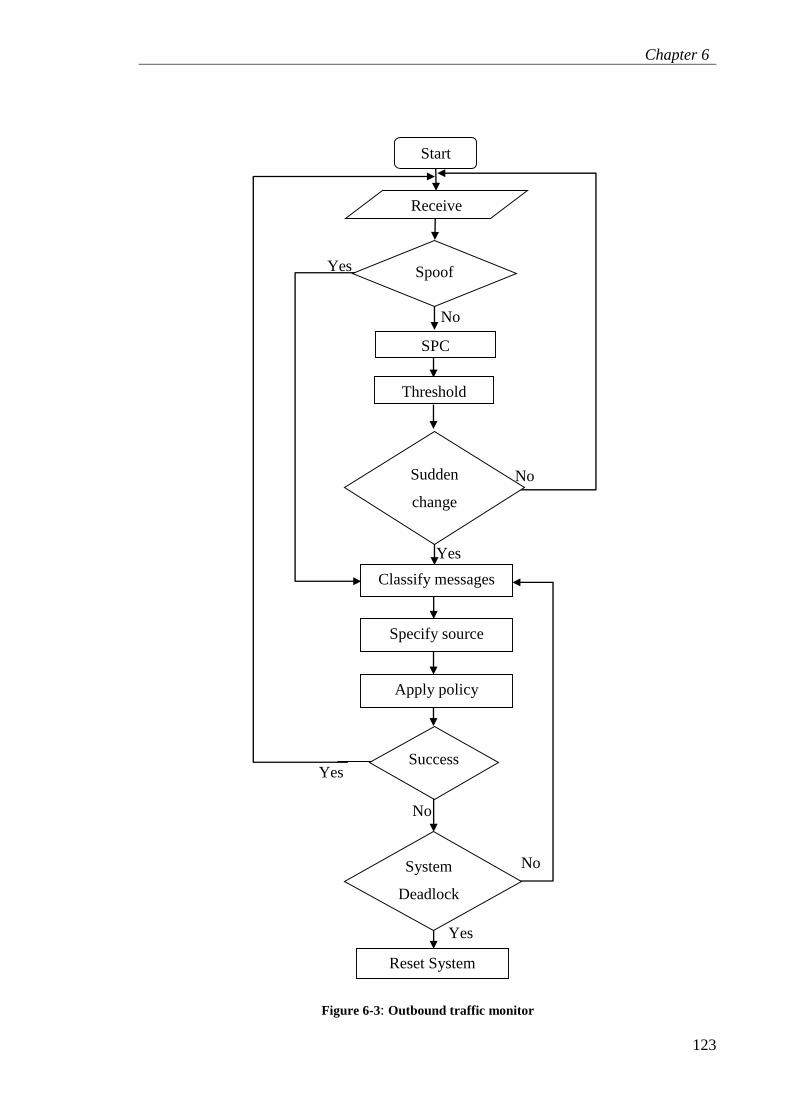
Figure 6-3: Outbound traffic monitor .............................................................................. 123
Page 13
Glossary of Terms
xii
Glossary of Terms
AS Autonomous Systems
ATM Asynchronous Transfer Mode
BGP Border Gateway Protocol
CA Certificate Authority
CASC The CA Security Council
CCSR Centre for Communication Systems Research
CDN Content Distribution/Delivery Network
CIA Confidentiality, Integrity, and Availability
CPM Change Point Monitoring
CPU Central Processing Unit
CUSUM Cumulative Summation
DAD Disclosure, Alteration, and Denial
DADP DNS Attack Detection and Prevention
DAMA Demand Assignment Multiple Access
DASH Dynamic Adaptive Streaming over HTTP
DDoS Distributed Denial of Service
DiffServ Differentiated services
DMZ DeMilitarized Zone
DNS Domain Name System
DoS Denial of service
DRDoS Distributed Reflected Denial of Service
Page 14
Glossary of Terms
xiii
DVB - RCS Digital Video Broadcasting - Return Channel via Satellite or Return
channel over system
D-WARD DDoS Network Attack Recognition and Defense
EWMA Exponential Weighted Moving Average
FQDM Fully Qualified Domain Name
FSM Finite State Machines
GMA Geometric Moving Average
HTML Hyper Text Markup Language
HTTP Hyper Text Transfer Protocol
HTTPS “ HTTP over TLS ” , “ HTTP over SSL ” , or “ HTTP Secure ”
HX-DoS HTTP and XML flood DoS
ICI Interface Control Information
ICMP Internet Control Messaging Protocol
IDS Intrusion Detection System
IETF Internet Engineering Task Force
IM Instant Messaging
IMAP Internet Message Access Protocol
IMS IP Multimedia Subsystem
IP Internet Protocol
IPsec IP Security
ITU International Telecommunication Union
ITU-T ITU Telecommunication Standardization Sector
LAN Local Area Networks
MPEG The Moving Picture Experts Group
OPNET Optimised Network Engineering Tools
PaaS Platform as a Service
Page 15
Glossary of Terms
xiv
PDF Probability Density Function
PEP Performance Enhancing Proxies
PKI Public Key Infrastructure
POP3 Post Office Protocol
PPP Point to Point Protocol
PSTN Public Switched Telephone Network
QoS Quality of service
RDP Remote Desktop Protocol
RFC Requests for Comments
RMI Remote Method Invocation
RMON Remote Monitoring
RSA Ron Rivest, Adi Shamir, and Leonard Adleman cryptosystem.
RTP Real Time Protocol
SaaS Software as a Service
S-HTTP Secure Hyper Text Transfer Protocol
SIMPLE Session Initiation Protocol for Instant Messaging and Presence
Leveraging Extensions
SIP Session Initiation Protocol
SIPS Secure SIP
SMTP Simple Mail Transfer Protocol
SNMP Simple Network Management Protocol
SPC Statistical Process Control
SPDY pronounced speedy, an Internet Draft to standardise HTTP/2
SPIT Spam over Internet Telephony
SQL Structured Query Language
SSL Secure Sockets Layer
Page 16
Glossary of Terms
xv
TCP Transmission Control Protocol
TSL Transport Layer Security
TTCN-3 Testing and Test Control Notation version 3
UAC User Agent Client
UAS User Agent Server
UMS User Mobility Service
UMTS Universal Mobile Telecommunications System
UPC Usage Parameter Control
URI Uniform Resource Identifier
VLAN Virtual Local Area Networks
VoIP Voice Over IP
VPN Virtual private network
W3C World Wide Web Consortium
WSN Wireless Sensor Networks
XML eXtended Markup Language
Page 17
Chapter 1
1
Introduction
A network service can be any kind of application or legitimate activity offered over the
Internet, which is used by a computing system or by an end user, such as web browsing,
video and audio conferencing and broadcasting. Security goals of an information system
are Confidentiality, Integrity, and Availability, the (CIA) Triad. The Availability goal is to
make sure that a service or several services, or a running system offering some services, is
obtainable during all the dedicated running time. Denial of Service (DoS) attacks aim to
prevent the availability; it purposes to temporarily or indefinitely interrupt, suspend, or at
least to reduce the access to the available service on a specific victim. In other words,
technically DoS attacks attempt to exhaust resources on targeted victims, mainly network
bandwidth, memory and data storage, processing unit, or energy.
Objectives
This thesis aims to give an overview of Denial of Service (DoS) attacks targeting
Session Initiation Protocol (SIP) and SPDY, the future HTTP 2.0.
The focus of the DoS security issue in this research is the messages flooding type of
DoS attack, which is the most common type of DoS.
Show the impact of flooding DoS attacks and defence against them using the traffic
flow behaviour of SIP and SPDY.
Utilise SIP and SPDY traffic behaviour to monitor the ongoing flow and sense any
change in the behaviour to detect a flooding DoS.
Utilise the Statistical Process Control (SPC) techniques, the Monitoring Charts,
mainly Cumulative Summation (CUSUM), and Exponentially Weighted Moving
Average (EWMA), to monitor the traffic for flow abnormalities.
Page 18
Chapter 1
2
Run several simulation scenarios based on the behaviour of each SIP and SPDY,
simulate flood behaviour, and simulate CUSUM and EWMA to detect the flood.
Study the slow rate of DoS flooding and the reduction of triggered false alarm issue
using the SPC techniques.
Motivations
The flooding type of DoS attacks are still an open issue; an attacker finds it an easy way to
target a certain system and apply a bulky impact on the victim and stop it from offering its
services for a valuable period of time, so there has not yet been a final optimal solution to
such a problem.
The application level protocols are often the common protocols non-expert users deal with
in the Internet, and such a thing eases the mission for a less expert attacker to be involved
in malicious activity that effectively harms and results in damaging other systems on the
Internet. Therefore an attacker requires less effort to launch a flooding Denial of Service
attack (DoS) against a victim, than the effort needed to perform other types of security
attacks.
SIP is the protocol which is responsible for managing multimedia sessions on the internet;
the networked media are non-tolerant services, denying a service will cause huge damage
on such a service.
SPDY is the current draft for the future HTTP 2.0, which means it will be the main
application protocol for the everyday usage of the web; the flow behaviour of SPDY makes
it an easily vulnerable target by flooding DoS attacks.
Traffic monitoring using Statistical Process Control allows useful techniques to observe
flow behaviour of SPDY and SIP, and to implement the defence techniques against the
flooding DoS attacks.
Thesis Contribution
The thesis has contributed to the field of Computer Science; the areas the research includes
are Computer Networks, their Applications and Security, Internet traffic flow and
Page 19
Chapter 1
3
behaviour, message flooding and DoS attacks, and the field of Statistical Process Control
(SPC) and Monitoring Charts.
Cumulative Summation (CUSUM) and Exponentially Weighted Moving Average
(EWMA) are the two main techniques used from SPC to detect flooding DoS. The detection
was proven to work on large numbers as it was tested in SPDY simulated traffic; in addition
the detection was proven to work on small numbers as the techniques were tested in SIP.
The techniques used were proven to detect the slow rate DoS flood, which also helped to
reduce the False Alarm that might happen. The main contributions are listed here:
DoS attacks are characterised as a high sudden increase in the traffic received by a
certain service. SPC techniques were used to classify such an increase, and to set a
threshold to classify abnormal traffic behaviour as an attack.
Elimination of false flooding DoS alarms was discussed and optimised by setting an
alert limit using SPC equations to raise the suspicion before triggering the attack’s
alarm.
With slow rate DoS flood detection, such an attack is difficult or impossible to detect
in most cases. SPC techniques were used to set a threshold that detects a very slight
and unnoticeable increase in the received flow. A continuous slow increase will
accumulate in the results of the SPC equations that will be sensed by the alert and
alarm limits.
The utilisation of SIP flow behaviour, the two way communication, request/response
ratio, and the utilisation of SPDY proposed flow behaviour, where a client sends a
single TCP stream to the SPDY proxy server, to retrieve all the objects and the web
resources needed.
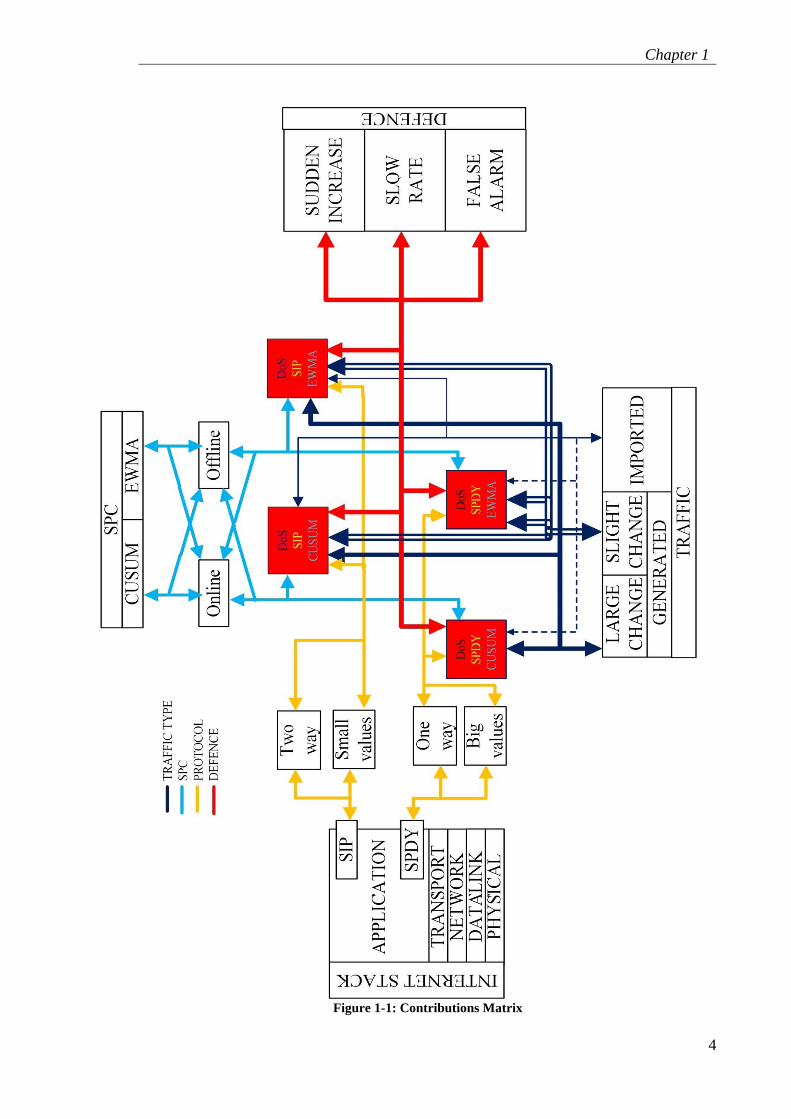
In order to illustrate the areas, the concept, and the different cases that have been examined
within this research and thesis, a matrix model adds up what has been already mentioned
as components with the relationships between them, and how they connect with each other.
Figure 1-1 shows the Matrix Model which consists of the utilised SPC techniques and how
they were applied, with each type of the quantitative observation input, the tested
application protocols and the traffic flow behaviour of each protocol, the different scenarios
of each protocol’s flow behaviour, and the classes of the defence against the DoS flood
attacks.
Page 20
Chapter 1
4
Figure 1-1: Contributions Matrix
Page 21
Chapter 1
5
Thesis Outline
The second chapter introduces the Computers Networks and Security, and the Internet
Applications, definition of SPDY, Denial of Service, and Session Initiation Protocol.
The third chapter is about the Quality Control and Statistical Process Charts (SPC),
Cumulative Summation (CUSUM), and Exponential Weighted Moving Average (EWMA).
Chapter four is about Denial of Service targeting Session Initiation Protocol, and how
CUSUM and EWMA were implemented to detect the attacks.
Chapter five is about Denial of Service targeting SPDY, and how CUSUM and EWMA
were implemented to detect the attacks.
Chapter six describes a framework for a design to apply and employ the powerful technique
of SPC in detecting DoS attacks.
Finally, chapter seven presents the conclusion and the future work related to the research.
Page 22
Chapter 2
6
The Computer Network Applications and
Security
Networks and Internet Applications
The Internet protocol stack was designed to provide structure to the design and
organisation, and define services’ functionality of network protocols [5], [55], and [89].
The Application Layer is the location of the internet protocols and its applications that end
users deal with either at the start or the end of the data communications. Application layer
protocols are implemented in software in the end systems, distributed over multiple end
systems, and the exchanged packet of information at the application layer is expressed as a
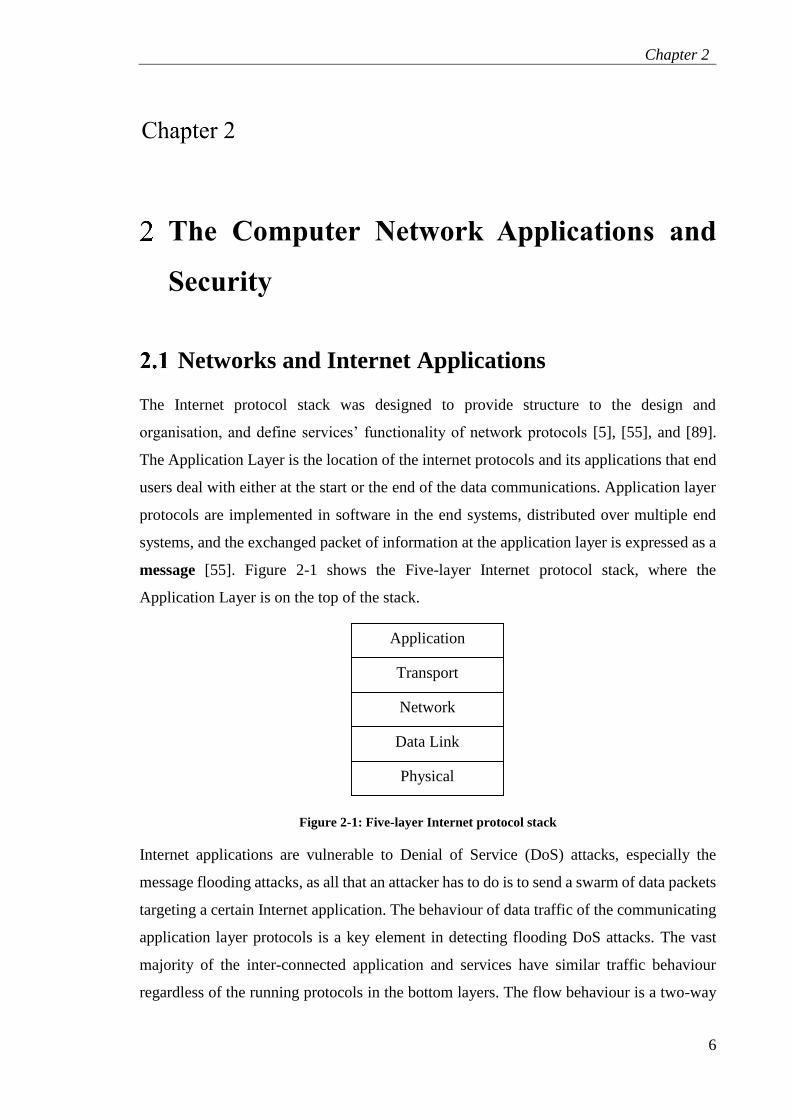
message [55]. Figure 2-1 shows the Five-layer Internet protocol stack, where the
Application Layer is on the top of the stack.
Figure 2-1: Five-layer Internet protocol stack
Internet applications are vulnerable to Denial of Service (DoS) attacks, especially the
message flooding attacks, as all that an attacker has to do is to send a swarm of data packets
targeting a certain Internet application. The behaviour of data traffic of the communicating
application layer protocols is a key element in detecting flooding DoS attacks. The vast
majority of the inter-connected application and services have similar traffic behaviour
regardless of the running protocols in the bottom layers. The flow behaviour is a two-way
Physical
Data Link
Network
Transport
Application
Page 23
Chapter 2
7
communications, request/response or, in other words, a Connection Oriented
communication; this means any sent request must be acknowledged with one or more
responses. This behaviour was used as the principle in this research for detecting DoS,
simply a noticeable difference between the requests and the acknowledged responses
indicates a flooding attack is in progress and targeting the system hosting the running
application.
Two main protocols are used in the daily life of the internet: the Hyper Text Transfer
Protocol (HTTP), and the Session Initiation Protocol (SIP). These were the protocols used
in the study. HTTP is the protocol responsible for web services access; so far, HTTP 1.0
and HTTP 1.1 are the only versions formally used, and SPDY is the draft for the near future
HTTP 2.0. SIP is a protocol that is responsible for managing, creating, and finalising
multimedia sessions over the internet. Its job is not to carry multimedia messages; this is
the job of other protocols, e.g. the Real Time Protocol (RTP).
Session Initiation Protocol
Session Initiation Protocol (SIP) is a protocol that is responsible for creating sessions for
multimedia communication, i.e. Voice, VoIP, real-time video stream, remote conferences
[52] and [53]. SIP is also responsible in managing the session during its run, and to finalise
the session.
SIP design employs elements similar to the HTTP request/response transaction model. Each
transaction consists of a client request that invokes a particular method or function on the
server with at least one response. SIP reuses most of the header fields, encoding rules and
status codes of HTTP, providing a readable text-based format. SIP clients typically run over
either the Transmission Control Protocol (TCP) or the User Datagram Protocol (UDP) on
port numbers 5060 or 5061, or both.
RFC 2543 in [53] defines the main elements of a SIP Logical network over the internet:
1. SIP user agent (UA) is a logical network end point element; it is used to create or
receive SIP messages and thereby participate in managing a SIP session. A SIP UA
can perform the role of a User Agent Client (UAC), which sends SIP requests, and
the User Agent Server (UAS), which receives the requests and returns a SIP response.
These roles of UAC and UAS only last for the duration of a SIP transaction.
Page 24
Chapter 2
8
2. Proxy server is an intermediary entity that acts as both a server and a client for the
purpose of making requests on behalf of other clients. A proxy server primarily plays
the role of routing, which means its job is to ensure that a request is sent to another
entity "closer" to the targeted user. Proxies are also useful for enforcing policy (for
example, making sure a user is allowed to make a call). A proxy interprets and, if
necessary, rewrites specific parts of a request message before forwarding it.
3. Registrar is a server that accepts REGISTER requests and places the information it
receives in those requests into the location service for the domain it handles.
4. Redirect server is a user agent server that generates (3xx) responses to requests it
receives, and further action needs to be taken (typically by sender) to complete the
request, by directing the client to contact an alternate set of URIs. The redirect server
allows SIP Proxy Servers to direct SIP session invitations to external domains.
SIP is a text-based protocol with syntax similar to that of HTTP. So there are two different
main types of SIP messages: requests and responses. The first line of the head of a request
has a method, defining the nature of the request, and a Request-URI, indicating where the
request should be sent. The first line of a response has a response code. The main Request
methods are:
1. REGISTER: Used by a UA to indicate its current IP address and the URIs for which
it would like to receive calls.
2. INVITE: Used to establish a media session between user agents.
3. ACK: Confirms reliable message exchanges.
4. CANCEL: Terminates a pending request.
5. BYE: Terminates a session between two users in a conference.
6. OPTIONS: Requests information about the capabilities of a caller, without setting up
a call.
The SIP response types are three digits decimal, the most significant digit (far left) defines
the type of the response;
1. Provisional (1xx): Request received and being processed.
2. Success (2xx): The action was successfully received, understood, and accepted.
Page 25
Chapter 2
9
3. Redirection (3xx): Further action needs to be taken (typically by sender) to complete
the request.
4. Client Error (4xx): The request contains bad syntax or cannot be fulfilled at the server.
5. Server Error (5xx): The server failed to fulfil an apparently valid request.
6. Global Failure (6xx): The request cannot be fulfilled at any server.
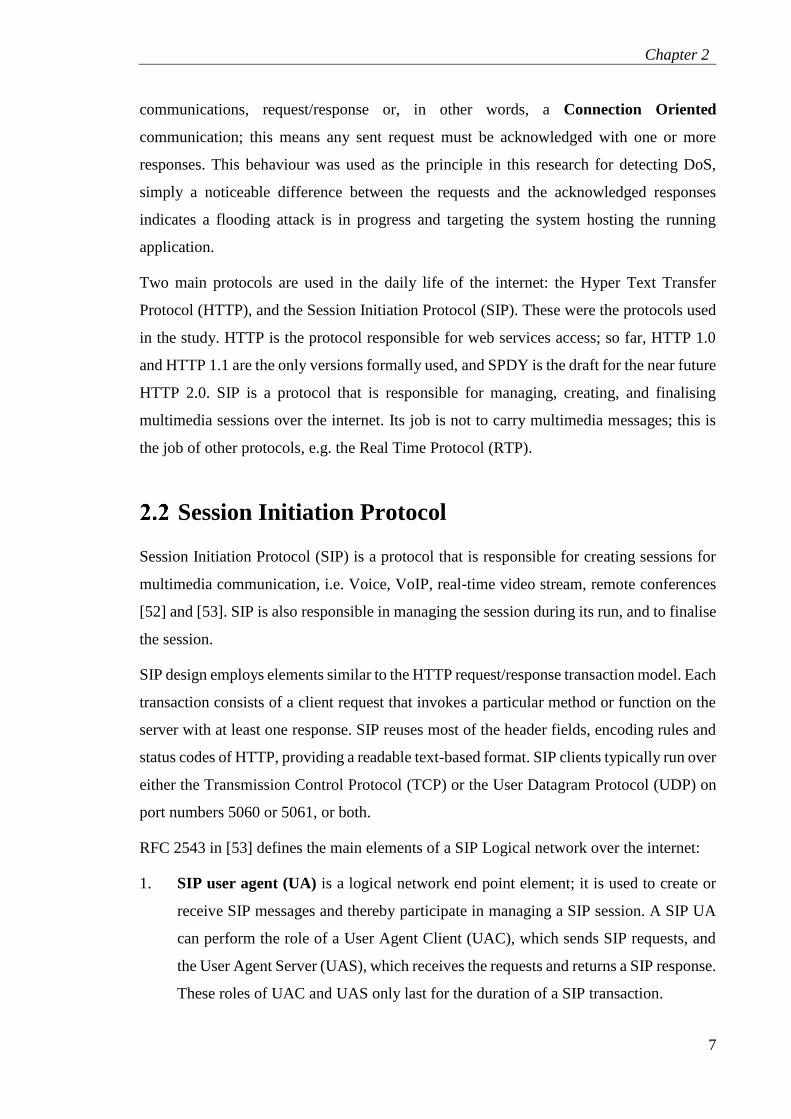
Figure 2-2 below shows the main transactions to start a multimedia call, i.e. a VoIP call.
An INVITE message is sent by a source agent to the proxy server first, and then forwarded
to the destination agent. Then the destination replies with 200 OK response. The
multimedia session starts afterwards, such as VoIP or video. After the multimedia
transmission finishes, SIP again works to finalise the connection by sending a BYE request
by one of the agents, and responding with an OK response to the other agent.
Figure 2-2: SIP main flow of VoIP call transactions
Page 26
Chapter 2
10
Hyper Text Transfer Protocol (HTTP)
The Hyper Text Transfer Protocol (HTTP) is an application protocol for distributed,
collaborative, hypermedia information systems. HTTP is the foundation of data
communication for the World Wide Web. Hypertext is structured text that uses logical links
(hyperlinks) between nodes containing text. HTTP is the protocol to exchange or transfer
hypertext, which provides for Web document request and transfer, [121] and [124].
The standards development of HTTP was coordinated by the Internet Engineering Task
Force (IETF) and the World Wide Web Consortium (W3C), culminating in the publication
of a series of Requests for Comments (RFCs), most notably RFC 2616 (June 1999), which
defines HTTP/1.1, the version of HTTP in common use.
HTTP is implemented in two programs: a client program and a server program. The client
program and server program, executing on different end systems, talk to each other by
exchanging HTTP messages. HTTP defines the structure of these messages and how the
client and server exchange the messages.
A Web document or a Web page consists of a base HTML file and several referenced
objects. An object is simply a file that is addressable by a single URL. An object could be
an HTML file, a JPEG image, a Java applet, or a video clip. A Web page may contain a
variety or a combination of all objects.
HTTP uses TCP as its underlying transport protocol; this may be either a persistent or a
non-persistent HTTP. In non-persistent HTTP a brand new connection must be established
and maintained for each requested object. This can place a significant burden on the Web
server, which may be serving requests from hundreds of different clients simultaneously
for each of these connections. TCP buffers must be allocated and TCP variables must be
kept in both the client and server.
With persistent connections, the server leaves the TCP connection open after sending a
response. Subsequent requests and responses between the same client and server can be
sent over the same connection, an entire web page can be sent over a single persistent TCP
connection when all its objects reside on the same server; multiple web pages residing on
the same server can be sent from the server to the same client over a single persistent TCP
connection. But if there are several objects on several servers, which are now the most
Page 27
Chapter 2
11
common in the current complex web pages, there is a need to open multiple connections of
TCP.
The most common methods of HTTP request messages are GET, POST, HEAD, PUT, and
DELETE. The great majority of HTTP request messages use the GET method. The GET
method is used when the browser requests an object. An HTTP client often uses the POST
method when the user fills out an HTML form. The HEAD method is similar to the GET
method: when a server receives a request with the HEAD method, it responds with an HTTP
message but it leaves out the requested object. For this reason, the HEAD method is often
used for debugging. The PUT method is often used in conjunction with Web publishing
tools. It allows a user to upload an object to a specific path on a specific Web server. The
PUT method is also used by applications that need to upload objects to Web servers. The
DELETE method allows a user or an application to delete an object on a Web server.
Some common status codes and associated phrases include:
200 OK: Request succeeded and the information is returned in the response.
301 Moved Permanently: Requested object has been permanently moved; the new
URL is specified in Location: header of the response message. The client software
will automatically retrieve the new URL.
400 Bad Request: This is a generic error code indicating that the request could not be
understood by the server.
404 Not Found: The requested document does not exist on this server.
505 HTTP Version Not Supported: The requested HTTP protocol version is not
supported by the server.
2.3.1 HTTP 2.0 / SPDY
SPDY protocol is a new application-layer communication protocol that was proposed by
Google in order to overcome the defects of HTTP [100] and [102]. SPDY has been studied
in the IETF standardisation process that would be used as a basis of the technical
specification of the HTTP 2.0 protocol, [32], [73] , [93], and [95]. SPDY is a protocol to
realise high-speed Web access by using the SPDY session that has been established
between the client and the Web server for transmitting and receiving page resources. Since
a modern Web page usually consists of multiple page resources that are stored in multiple
domains (multi-domain configuration), the client has to establish multiple SPDY sessions
Page 28
Chapter 2
12
with multiple Web servers. In this case, SPDY is not able to realise high-speed Web access
since it takes several seconds to establish multiple SPDY sessions in a mobile environment
with high latency [31].
On the basis of the HTTP protocol, SPDY offers four improvements to shorten the page
loading time: multiplexed requests, prioritised requests, server pushed streams and
compressed headers. Most of these techniques are already implemented in Performance
Enhancing Proxies (PEP) [1], [13], [17], [37], [78], and [79]. One of the bottlenecks of
HTTP implementation is that HTTP relies on multiple connections for concurrency. This
causes several problems, including additional round trips for connection setup, slow start
delays, and connection rationing by the client, where it tries to avoid opening too many
connections to any single server. HTTP pipelining helps, but only achieves partial
multiplexing. In addition, pipelining has proven to be non -deployable in existing browsers
due to intermediary interference.
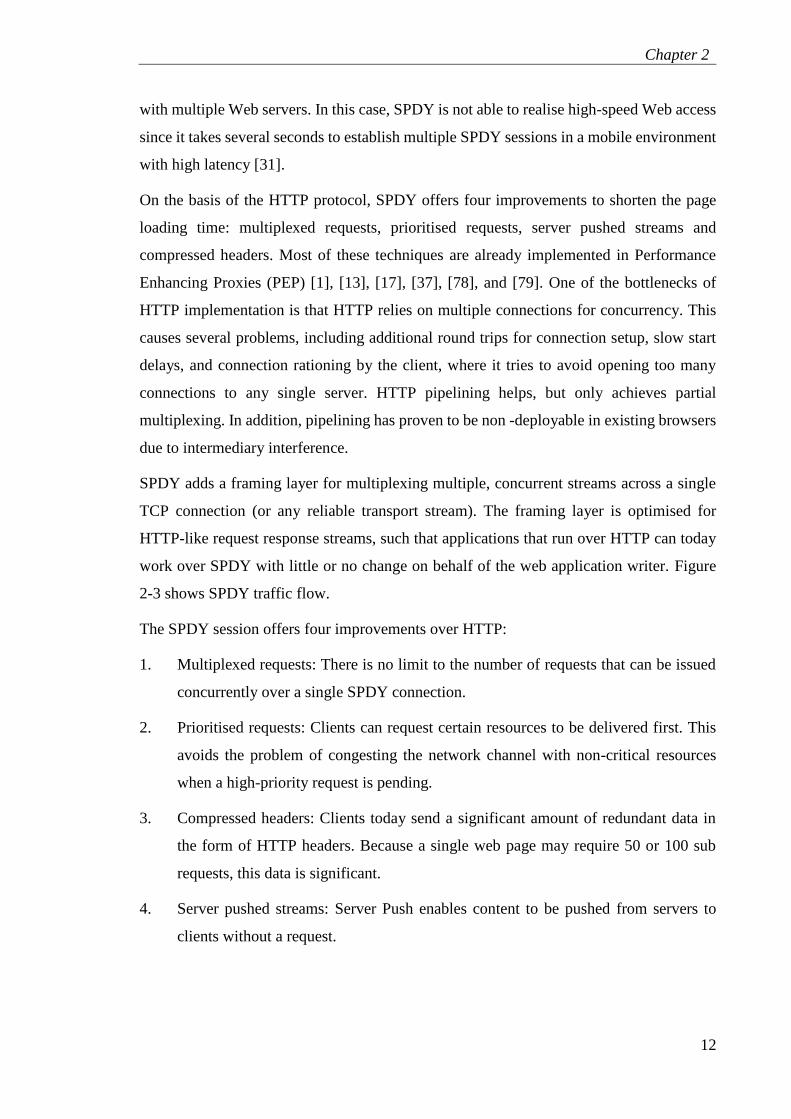
SPDY adds a framing layer for multiplexing multiple, concurrent streams across a single
TCP connection (or any reliable transport stream). The framing layer is optimised for
HTTP-like request response streams, such that applications that run over HTTP can today
work over SPDY with little or no change on behalf of the web application writer. Figure
2-3 shows SPDY traffic flow.
The SPDY session offers four improvements over HTTP:
1. Multiplexed requests: There is no limit to the number of requests that can be issued
concurrently over a single SPDY connection.
2. Prioritised requests: Clients can request certain resources to be delivered first. This
avoids the problem of congesting the network channel with non-critical resources
when a high-priority request is pending.
3. Compressed headers: Clients today send a significant amount of redundant data in
the form of HTTP headers. Because a single web page may require 50 or 100 sub
requests, this data is significant.
4. Server pushed streams: Server Push enables content to be pushed from servers to
clients without a request.
Page 29
Chapter 2
13
Figure 2-3: SPDY communication flow
SPDY attempts to preserve the existing semantics of HTTP. All features such as cookies,
ETags, Vary headers, Content-Encoding negotiations, etc., work as they do with HTTP;
SPDY only replaces the way the data is written to the network.
Form [36], Multiplexed streams – The fundamental enhancement of SPDY is that multiple
resources can be retrieved via a single TCP connection. The expectation (and current
implementation in Google Chrome) is for the client to open a single TCP connection to
each server, and to request all resources of the server over that single connection. The use
of a single TCP connection in this way allows the congestion avoidance algorithm in TCP
to more effectively manage data flow across the network. Also, the client can include
Page 30
Chapter 2
14
multiple requests in a single message, thereby reducing overhead and the number of round-
trip times necessary to begin file transfer for requests beyond the first. Although this is
similar to HTTP pipelining, the difference introduced by SPDY is that the server can
transfer all of the resources in parallel (multiplexed) without the “head of line blocking”
problem that can occur with HTTP pipelining.
The interaction property of SPDY protocol was analysed in [102], according to the SPDY
protocol draft specification, and a novel test was implemented by using Testing and Test
Control Notation version 3 (TTCN - 3) [28]. A SPDY accelerator has been proposed in [31]
that can considerably accelerate Web access speed by combining the SPDY protocol and
cache system even in a multi-domain configuration. They have confirmed that the proposed
system can reduce the page-loading time by one third compared to the existing SPDY.
Using extensive experiments, SPDY's performance was evaluated in [127]. They identified
the impact of network characteristics and website infrastructure on SPDY's potential page
loading benefits; they found that these factors are decisive for an optimal SPDY
deployment strategy, and they found SPDY offers maximum improvement over HTTPS
when operating in challenging environments such as low bandwidth and high delay
situations. A wider debate is taking place regarding the impact of future protocols, through
exploring the previous key aspects that affect SPDY, and accordingly HTTP/2.0.
SPDY is expected to provide benefits for satellite communications resource management
[1], which are adopted in geostationary satellite systems to optimise TCP-based application
performance. They have provided a careful assessment of SPDY performance over satellite
links, compliant to Digital Video Broadcasting - Return Channel via Satellite or Return
channel over system (DVB - RCS) standard, with return link resources assigned on demand
through a Demand Assignment Multiple Access (DAMA) method. Such a reference
scenario constitutes a challenging communication environment due to both the limited
return link bandwidth and the relatively high latency. Performance evaluation has been
carried out through a satellite network emulator, which reproduces physical layer satellite
impairments, while running real implementations both the TCP/IP stack and SPDY.
C. Mueller et al. in [15] and [16] discussed MPEG Dynamic Adaptive Streaming over
HTTP (DASH) as a new streaming standard, , the ISO/IEC MPEG standard, which enables
Page 31
Chapter 2
15
the convenient and smooth transportation of multimedia data to heterogeneous end devices
over networks with variable bandwidth conditions.
A design and prototype was proposed in [133]; the implementation was a cross-platform
mobile activity monitoring system on the mobile cloud computing, as mobile cloud
computing is becoming a hot topic of the industry, especially in healthcare. Using a
combination of mobile computing and cloud computing, they described their system which
incorporates HTTP 2.0 with SPDY to enable a secure and fast server push of medical
information to individual users. Moreover, the system uses MATLAB graphs to show the
vital data and analysis results and provides a user-friendly way to access personalised
healthcare. A hypothesis about smart grids end users was shown in [92], which these links
can be used to exchange data between the meter/controller, at the user, and a service, at the
web, using application protocols SPDY and HTTPS. This hypothesis is verified studying
the connectivity capabilities/constraints that a third party service may experience in
broadband links. A quantitative evaluation was performed in an emulated IPv6 network to
delimit the throughput, latency and reliability available to smart grids services. The results
showed that SPDY and HTTPS can meet typical QoS requirements using a proper
architecture (e.g. centralised or distributed), and can drive the development of new web-
based energy services. Here, practical connectivity aspects to deploy such services are
discussed.
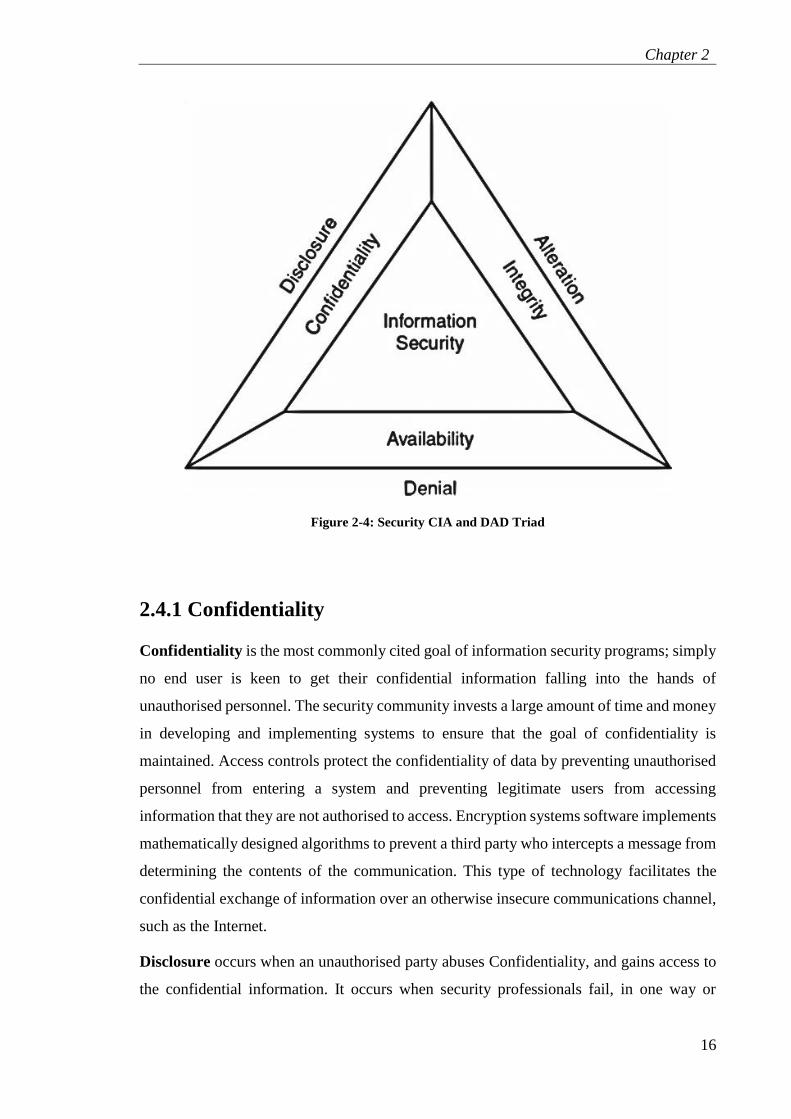
Security Goals: CIA and DAD Triads
Within the Computer and Information Security community, professionals and practitioners
tend to describe security as the sum of its component parts: Confidentiality, Integrity, and
Availability (CIA). These are the three requirements that users demand from information
systems, and they are the corner stones of any well-designed information security program.
Together, these three attributes are known as the CIA triad. Malicious individuals or, in
other words, attackers, have a model of their own—the Disclosure, Alteration, and Denial
(DAD), which outlines the three primary mechanisms used to defeat the security goals of
an organization [67].
Page 32
Chapter 2
16
Figure 2-4: Security CIA and DAD Triad
2.4.1 Confidentiality
Confidentiality is the most commonly cited goal of information security programs; simply
no end user is keen to get their confidential information falling into the hands of
unauthorised personnel. The security community invests a large amount of time and money
in developing and implementing systems to ensure that the goal of confidentiality is
maintained. Access controls protect the confidentiality of data by preventing unauthorised
personnel from entering a system and preventing legitimate users from accessing
information that they are not authorised to access. Encryption systems software implements
mathematically designed algorithms to prevent a third party who intercepts a message from
determining the contents of the communication. This type of technology facilitates the
confidential exchange of information over an otherwise insecure communications channel,
such as the Internet.
Disclosure occurs when an unauthorised party abuses Confidentiality, and gains access to
the confidential information. It occurs when security professionals fail, in one way or
Page 33
Chapter 2
17
another, to achieve the CIA triad’s goal of confidentiality. Examples of actions that
constitute disclosure include:
1. An attacker gains access, without any authorised permissions, to a certain system and
reads confidential information.
2. An insider disseminating confidential information to unauthorised third parties.
3. A programming failure that causes customers accessing a Web site to see the account
information of other customers.
2.4.2 Integrity
Organizations also charge security practitioners with protecting the integrity of
organizational data. The basic definition of integrity is ensuring that data may be modified
only through an authorised mechanism. Integrity involves protecting data from the
following types of unauthorised modification:
1. Unauthorised users altering data, such as an attacker breaking into a database and
altering records.
2. Authorised users making unauthorised changes to data, such as a bank teller adding
money to his personal account, rather than that of the customer.
3. Data being altered through an inappropriate mechanism, such as a power surge
causing database corruption.
It is the responsibility of security professionals to ensure that these eventualities do not
come to fruition, using many of the mechanisms used to protect the confidentiality of data,
which are also used to protect the integrity of data. For example, access control mechanisms
help prevent the first two types of data modification in the preceding list. Encryption
systems use digital signature technology to prevent the modification of data by an
unauthorised (either accidental or malicious) mechanism.
Data Alteration occurs when security mechanisms fail to ensure the integrity of data. As
mentioned in the discussion of integrity, there are a number of ways that this could occur.
The reader should keep in mind that unauthorised alteration can be the result of either
malicious or accidental activity.
Page 34
Chapter 2
18
2.4.3 Availability
The third goal of information security programs is to guarantee the availability of
information systems and services; the ability of authorised users to access data for
legitimate purposes. After all, an organization's data is not useful if it is not available for
its intended use. An attacker who manages to prevent authorised access to a system may
often be considered just as successful as one who manages to steal or manipulate the data
stored within it.
Denial occurs when events take place that prevent authorised users from accessing a system
for legitimate reasons. This includes actions as basic as a computer crashing, leaving users
unable to access it until IT professionals restore it to proper working order or bring a backup
system online. It also includes an entire class of malicious activity known as Denial of
Service or DoS attacks. Over the past few years, DoS attacks have become more prevalent
and dangerous as attackers harness the power of many computers worldwide to flood a
target system with traffic. This kind of attack will be further explored within this thesis,
which is the purpose of the research.
Computer Security and Denial of Service
2.5.1 Definition
Availability is one of the information and systems security goals; that is, to make sure that
some services or running system offering some services are available all the time. Denial
of Service (DoS) attacks aim to prevent availability, or at least reduce the access to the
available service on a specific victim. More precisely, DoS attacks attempt to exhaust
resources on targeted victims; mainly network bandwidth, memory, and processing unit.
There have been several RFCs and IETF internet drafts about DoS attacks as in [22], [48],
[68], [70], [84], [90], and [119].
A service offered by any computing system can be any kind of legitimate activity that can
be used by any other computing system or an end user; for example, web browsing, email
system, video and audio broadcasting.
There are too many ways to attack a specific target or set of targets; any kind of attack that
results in temporal unavailability for some offered service, without even causing any
Page 35
Chapter 2
19
corruption or deletion of any data is considered as a Denial of Service attack. The main and
the most well-known method of DoS attack is to send a massive number of messages and
internet data packets over what can be handled by a certain victim’s system, so the victim
starts receiving data chunks from its network interface, filling up the internal memory by
storing the received massages, and using its CPU to spend a longer time in processing what
is required in these messages.
From [5], all network servers can be subject to DoS attacks that attempt to prevent
responses to clients by tying up the resources of the server. It is not possible to prevent such
attacks entirely, but you can do certain things to mitigate the problems that they create.
Often the most effective anti-DoS tool will be a firewall or other operating-system
configurations. For example, most firewalls can be configured to restrict the number of
simultaneous connections from any individual IP address or network, thus preventing a
range of simple attacks. Of course, this is no help against Distributed Denial of Service
attacks (DDoS).
Any kind of computing related system, whether it is physical or a service, is vulnerable to
DoS attacks: targeted victims were mentioned in RFC 4732 [68], mainly:
End Systems are the most common victims, such as web servers, firewalls and IDS
systems, DNS systems, or any other normal host. To exhaust the resources of a
running application or the Operating System itself, an attack can be made by
exploiting poor software quality, such as buffer overflow, or any other attack that
causes the system to crash and stop.
Routers: DoS attacks that make routers unavailable are very serious. Preventing a
router’s offered service can sometimes put that router in a critical state and the attack
impact can prevent a lot of users and other routers from communicating with each
other, therefore many services will be stopped from being accessible. An
Autonomous System (AS) within routing would be down due to a DoS attack,
especially if the attacked router was a gateway to a subnet, or it could be the router
connecting to other routers in a certain area or other areas. A router can be attacked
as a normal computing end system, or an attack can be performed on a router using
the routing protocols, [18], [120], [60], [20], and [3]. RFC 3882 [22] has presented a
Border Gateway Protocol (BGP) configuration to Block Denial of Service Attacks.
Page 36
Chapter 2
20
Links: sending enough non-congestion controlled traffic such that a link becomes
excessively congested, and legitimate traffic suffers unacceptably high packet loss.
For wireless access, a strong frequency conflict can be a cause for a DoS attack. Any
kind of physical damage could be considered as an attack; for example, cutting a
power cable or destroying an access link will definitely stop a system and the services
running on it.
Ongoing communications: a reset towards that connection or to de-synchronise it, so
there will be no further date communication progress. A malicious user might be
able to significantly reduce the throughput of an on ongoing connection, [87] and [4].
An example of disrupting an ongoing communications: a SIP flow can be interrupted
by some attacker spoofing one of the communicating entities, then sending a request
message with session cancellation or communication reset [104].
Any service that has the ability to send or receive data packets is vulnerable to
flooding DoS attacks, e.g. DoS on wireless sensor networks (WSN) [21].
2.5.2 Previous Literature about DoS
There are different protocols on which to launch a flooding DoS attack; one of the well-
known attacks is the TCP SYN flood attack [14], [119], and [128]. This is when an attacker
floods a victim with TCP SYN packets, and the victim gets busy in responding to each
packet with SYN-ACK packets, but the attacker will not complete the three way hand
shake, by not sending back the ACK packets. A lot of work has been done on this issue;
initial work on this issue was done by [42] and [130].
A detailed analysis of the SYN flooding attack and a discussion of the existing and proposed
countermeasures was made in [14]. They designed a solution called “SynKill”; it is based
on the philosophy that this active anomaly detection tool can detect the conditions of a SYN
flooding attack and react appropriately to defeat, or at least lessen the impact of, an attack.
It does not require any special hardware or operating systems, network stacks, or even
modifications in the protected end systems. In [130], the Usage Parameter Control (UPC)
mechanisms, adopted in Asynchronous Transfer Mode (ATM) networks, are applied to
prevent the network server from a SYN flooding attack. The basic idea of the proposed
scheme is to consider the server being congested during a SYN flooding attack, and the
UPC is used as a traffic control mechanism to regulate a great number of arriving SYN
Page 37
Chapter 2
21
packets so that the server can be prevented from denials of services (DoS). Both the sliding
window and leaky bucket mechanisms are studied to examine the defence’s effectiveness.
Parameters of the sliding window and leaky bucket are determined according to the abort
time, buffer status of the server, and the predicted packet arrival rate. This method provides
an alternative concept on security management of network servers. The experimental
results also show that the proposed method can effectively prevent the server from a SYN
flooding attack. A good survey is in [65]: A Comparison of SYN Flood Detection
Algorithms.
Another well-known attack is an ICMP attack, where an attacker floods the victims with
ICMP requests, i.e. ping messages so the victim gets busy in responding to these requests.
The attacker amplifies the attack by launching a Distributed DoS (DDoS) that involves
many attackers, or an attacker can send IP spoofed (victim’s IP) requests to many systems,
then these systems start to respond to the spoofed address, so the victim is flooded. Such
attack is called a Smurf attack, or a Distributed Reflected Denial of Service (DRDoS)
attack. The work in [12] presents a trace-back approach for the reflective ICMP messaging
DoS attacks.
Work is presented in [123] in detecting flood-based DoS attacks through polling of Remote
Monitoring (RMON) capable devices, such as switches and routers. RMON is a special
purpose Management Information Base designed for the Simple Network Management
Protocol (SNMP), which tracks low-level network usage indicators, such as byte and packet
count, packet size, and packet transmission error events. They developed two models to
distinguish the attack flow from the normal flow: a machine learning model, and a statistical
model. Through simulations, the machine learning model achieved a detection rate of
98.6%, and a false alarm rate of 1.4%, while the statistical model resulted in a detection
rate of 93.1% and a false alarm rate of 6.9%. They validated their simulated machine
learning model by emulating the network traffic using a live network test bed; it achieved
a 96.2% detection rate with a 3.8% false alarm rate.
Jelena Morvic et al. [57] wrote a book about DoS; it is the first of its type to present DoS
in a published book. It included a definition of DoS, techniques to tackle it, in addition to
some research about that area. Jelena Morvic and P. Reiher proposed a new defence
mechanism against DDoS in [50]. The mechanism is called DDoS Network Attack
Recognition and Defence (D-WARD), a source-end DDoS defence system that achieves
Page 38
Chapter 2
22
autonomous attack detection and accurate response. D-WARD is installed at the source
network’s router as a gateway to the rest of the Internet. It consists of observation, rate-
limiting, and traffic policing components. At the Observation, the D-WARD finds the
anomalies in the monitored connections, mainly the (1) Nonresponsive foreign host:
aggressive sending rate coupled with low response rate, and (2) Spoofed IP. In the first
case, D-WARD finds the persistent aggressive sending rate coupled with a low response
rate: this indicates a high flooding attack with no ability to respond, and this technique
applies only in the case of two-way communications that has a request/response flow, or
acknowledged communications, like TCP and ICMP. However, any one-way flow cannot
be observed, such as UDP flood attacks. On the other anomaly, the outgoing packets that
do not carry local addresses are discarded, at all times, and when a foreign destination
receives a large number of packets from a local source it is suspected as an attacker. This
could be beneficial for one-way communications, such as UDP, but is still inaccurate. It is
possible and common to have some UDP multimedia streaming, or having a “flash crowd”
for some destination, a large surge in traffic to a particular Web site causing a dramatic
increase in server load and putting severe strain on the network links leading to the server,
which results in considerable increase in packet loss and congestion [54]. The flash crowd
or the Slashdot effect was investigated by several researchers, as in [39], [74], [126], and
[75]. The second component in [50], which is the rate-limiting, is a response when an attack
has been detected, by limiting all outgoing traffic to the victim, allowing faster recovery
from any false alarms. This response would perform well with connection oriented systems,
i.e. TCP, where mechanisms such as Random Early Detection [99] are employed for
congestion avoidance. However, it is impossible to employ the previously mentioned
second component techniques in connectionless cases, such as UDP flooding. The traffic-
policing component receives information from the rate-limiting component, to build
classification and decisions on each on-going packet.
2.5.3 SIP security and DoS
From [45], the very openness and ubiquity that make IP networks such powerful
infrastructures also make them a liability. Risks include Denial of Service (DoS), Service
Theft, Unauthorised Call Monitoring, Call Routing Manipulation, and Identity Theft and
Impersonation, among others. Not only does VoIP inherit all data security risks, it also
Page 39
Chapter 2
23
introduces new vehicles for threats related to the plethora of new emerging VoIP protocols
that have yet to undergo detailed security analysis and scrutiny.
There is relatively little research on analysis of behaviour characteristics of SIP traffic in
[45], the critical control flow of VoIP services, to help design effective problem diagnosis
tools and attack detection mechanisms.
The goal of a Denial of Service attack is to render the service or system inoperable; hence
an attack can be directed toward different entities in the network, depending on the
attacker’s intent. If the aim is to render the service as a whole inoperable, the main target
will be the core servers in the SIP infrastructure, such as SIP proxies, but also other servers
which are necessary in a SIP infrastructure: like DNS, RTP proxies, gateways to other
networks. Direct attacks on the user agent are also possible; however, they will have a lesser
impact. The survey in [36] classifies three different types of SIP:
1. SIP message payload tampering.
2. SIP message flow tampering.
3. SIP message flooding.
SIP message payload tampering: SIP is a text-based protocol and messages are transported
usually in clear text. This class of attack is based on tampering with the actual SIP message
or, more specifically, the SIP payload. Attackers can try to inject harmful content into a
message, e.g. by entering meaningless or wrong information with the goal of exploiting a
buffer overflow at the target. Also, such messages can be used to probe for vulnerabilities
in the target. Harmful code that will be executed in an unforeseen context can be introduced
into the payload, e.g. SQL injection.
SIP message flow tampering: DoS attacks in real-time communication, in order to disturb
the on-going communication between users. SIP real-time communication networks
involve communicating parties to establish a constant connection with each other whereby
content is transmitted continuously between these parties. An attacker can now target this
connection by introducing fake signalling messages into the communication channel.
Several different SIP signalling messages can be misused for this task. A BYE message
with the right credentials can prematurely terminate a session. An injected CANCEL
request can prohibit even the establishment of the request. Using an INVITE message, an
attacker can renegotiate session parameters and redirect on-going sessions. An attacker
Page 40
Chapter 2
24
needs to know the session parameters for these attacks to succeed. He can sniff them from
the network. These attacks are targeted at SIP UAs only.
2.5.3.1 SIP message flooding
Session Initiation Protocol (SIP) operation depends on many entities and agents in order to
establish a connection, so there would be many possible victims for a DoS flooding attack,
mainly SIP Servers and User Agents. A flooding attack can consume a victim’s Network
Bandwidth by simply flooding a SIP network, or a single SIP system such a SIP proxy or
a SIP Agent at a much higher rate above what can be handled by their network interfaces;
this is simply a DoS attack that is similar to other possible DoS attacks on different kinds
of victims and networks.
It is conventional that any SIP message needs to be processed by any SIP receiver’s system
in order to complete any SIP procedure, especially as SIP is a text-based protocol, so the
header needs some interpretation and text parsing before looking into the contained
parameters. An attacker can launch an attack by flooding a large number of SIP messages
appended with overhead operations; for example, a comparatively complex SIP
authentication. This simply would cause the Central Processing Unit (CPU) of a victim to
get busy for a while, especially when an operation requires an input value to continue, while
the attacker will not send anything causing the victim utilising the CPU for the whole time.
To illustrate an example about flooding a SIP victim, Figure 2-5 shows how a malicious
user can send a flood towards either a SIP proxy server or a SIP phone (user B) or even
both; this leads to some user like (user A) trying to send a request to the server, the server
will not process it, this means (user A) will not receive a response from the server, in other
words, the service the proxy offers is denied.
A mutual authentication mechanism was proposed in [109], to help in reducing DoS (Denial
of Service) attacks, detecting server identity spoofing and ensuring basic mutual
authentication with comparison to HTTP digest, but it is implemented by default within all
SIP environments. The mechanism consists of providing meaning and semantics to some
of the parameters' values generated by the participating end-points during SIP session
establishment, especially to the “nonce” values, which is an arbitrary number or the current
time on a certain machine or a combination of the two, which is used only once in a
cryptographic communication [110].
Page 41
Chapter 2
25
Figure 2-5: SIP flooding DoS example
A. Keromytis [9] presents a comprehensive survey of VoIP security: analysis of VoIP/IMS
disclosed vulnerabilities, classification, and recommendations for securing VoIP Systems.
In an analysis of security implications in Session Initiation Protocol in [7], they have
explored the plausibility of an attacker exploiting one of the most popular and commonly
used VoIP - SIP. They identified and described security issues significant to the SIP
protocol that may lead to DoS, flooding attacks, attacks exploiting vulnerabilities at the
application layer, and Spam over Internet Telephony (SPIT). They explored the various
security issues pertinent to the SIP protocol in diverse ways in which a VoIP system
leveraging SIP can be attacked.
Page 42
Chapter 2
26
An IPsec secured SIP-based VoIP network model implemented on an OPNET Modeller
simulation was examined in [76]. This paper describes that the research has been carried
out into examining the options for securing VoIP networks and, more specifically, the
impact which implementing such security architectures and protocols will have on the
performance of such secure networks, which has been fulfilled into the development of a
realistic model for running simulations of the performance of secure session initiation
protocol-based VoIP networks. The performance analysis of a secure SIP–VoIP network,
aided by this tool, has been presented along with results obtained for various IPsec
configurations. The most predominant and alarming effect on VoIP network performance
was seen in the case where dynamic public key exchange mechanisms, such as IKE, was
used for establishing shared and authenticated secret keys. The other performance
bottleneck observed was the shared encryption engine at edge routers and VoIP–PSTN
gateways, which could very well be averted by using multiple encryption engines. As a
security option for VoIP, the IPsec framework offers a myriad of choices and options for
providing security services. Performance analysis of the different configurations of IPSec
for VoIP networks, using simulation models is a prudent method on which to base
decisions, when implementing real IPsec secured VoIP networks.
A two-layer architecture was proposed in [105] to prevent Denial of Service attacks on
VoIP systems based on the Session Initiation Protocol (SIP). The architecture is designed
to handle different types of attack including message flooding, malformed message usage,
and crafted DNS requests. The effectiveness of the prevention mechanisms has been tested
both in the laboratory and on a real live VoIP provider network. For the flooding problem
they have installed an Intrusion Detection System based on the Snort IDS [69] which they
have extended for VoIP awareness. The Snort IDS system was configured with a set of
newly developed rules for detection of flooding attacks on SIP infrastructures, where
detection is based mainly on packet payload inspection. The text-based nature of SIP
messages offers the opportunity for message tampering attacks; to detect any malicious
messages, they proposed a signature-based detection method on the SIP grammar as
defined in its RFC3261 [53]. To block a DNS system, an unresolvable request can be sent,
no answer can be provided until a timeout occurs at the DNS system. The proxy might be
blocked until the answer from the DNS arrives, the SIP server can be blocked for up to 5
seconds through one simple message. They suggest a DNS cache that answers to DNS
Page 43
Chapter 2
27
resolve requests from the SIP proxy. It saves the results of the latest DNS queries, but the
cache still need updates and replacement of the old or expired entries.
An Intrusion Detection System was designed in [107] for detecting Denial of Service
Flooding Attacks on Session Initiation Protocol (SIP). The attack detection is through the
gathering of statistical data; measurements are applied on three different levels or scopes:
Transaction Level, operation within each single transaction; Sender Level, evaluate all the
transactions that are from the same IP address; and the Global Level, to summarise all
recent ongoing transactions, to give feedback on the current system state. Attack mitigation,
detected due to measurements at the transaction or sender level, is done upon the level so
the offending source can be identified with the transaction ID, i.e. IP address. So an action
is taken against the source, like applying a firewall rule to prevent any incoming packets
from that IP. At the Global level, the detection will be useful in case a Distributed DoS
(DDoS) is happening, so it is not possible to directly distinguish between malicious and
regular users at the global level; the possible mitigation strategy would then be to rate-limit
all incoming traffic.
A SIP state-machine specification was proposed in [27] to detect multiple-source message
flooding attacks, by modifying the original Finite State Machine for SIP transactions. This
detection mechanism can be placed on an external IDS at the network ingress point. The
author models the four defined transaction state machines specified in the SIP RFC
(INVITE and non-INVITE transaction state machine, both for the client and server part).
The transaction anomalies can be detected in a state-full manner for each transaction; the
according state machine is updated whenever a new SIP message is encountered. For
flooding detection the author added an error state to each state machine and defines how
this error state can be reached. An attack is indicated if the number of error states in one
sampling interval surpasses a threshold. The threshold for attack detection is network
dependent.
A SIP aware DoS attack detection that monitors and analyses SIP signalling flow traffic
was proposed in [24]. It calculates the normal incoming packets ratio, and then it performs
a pattern analysis to the suspicious SIP flow to determine and detect the abnormal flow
pattern.
The work in [34] evaluated different possibilities to mitigate effective Denial of Service
attacks on SIP servers by flooding the server with requests addressed with irresolvable
Page 44
Chapter 2
28
domain names. They show that over-provisioning is not sufficient to handle such attacks.
As a more effective approach, they presented a solution called the DNS Attack Detection
and Prevention (DADP) scheme based on the usage of a non-blocking DNS cache. Based
on various measurements conducted over the Internet they investigate the efficiency of the
DADP scheme and compare its performance with different caching strategies applied.
A specification-based detection framework was presented in [103], to recognise that
deviation flood Denial-of-Service attacks are a real threat for a SIP-based infrastructure
from its expected behaviour. They have presented an implementation and have shown with
measurements that this method is capable of attack detection and mitigation for different
kinds of attacks directed towards a SIP infrastructure, including Denial of Service message
flooding.
A scheme to increase IDS firewall performance was proposed in [106]: performance
enhancement is done by merging several similar rules into more general ones and ignoring
lesser relevant rules to limit the number of firewall rules, this scheme fits more in detection
of flooding attacks. Instead of trying to prevent and deny every uncommon message, a
small number is accepted, and so ensuring the on-going operation of the service.
Performance of the calculation can also be increased by iteratively calculating the new
optimised rule set, instead of a complete recalculation each time new rules are inserted.
2.5.4 HTTP and SPDY Security and DoS
A Client-Transparent Approach to Defend against Denial of Service Attacks proposes a
light-weight client transparent technique to defend against DoS attacks using JavaScript
support [71]; their experiments have shown that the approach incurs a low performance
overhead and is resilient to DoS attacks.
A semi-Markov model was proposed as a monitoring application for DoS [115], with the
use of a group testing approach anomaly detector helping to describe the dynamics of an
access matrix and to detect the attacks. The focus of this work lies in the detection
algorithms proposed and the corresponding theoretical complexity analysis. In addition,
they provided preliminary simulation results regarding the efficiency and practicability of
this new scheme. Further discussions over implementation issues and performance
enhancements are also appended to show its potential.
Page 45
Chapter 2
29
HTTP-GET flood detection techniques were proposed in [111], based on analysis of page
access behaviour. They proposed two detection algorithms: one focuses on a browsing
order of pages and the other focuses on a correlation with browsing time to page
information size. The implemented detection system evaluated a false positive and a false
negative by using the access log of the Internet web server. As a result, the first algorithm
can suppress the miss-detection of normal clients, but it has low attack detection accuracy,
therefore, the first algorithm is effective when prioritising service for normal clients.
However, the second algorithm has higher attack detection accuracy, but it might reject
some normal clients. Therefore, the second algorithm is more suitable when giving top
priority to detection of the HTTP-GET flood attack.
A selective DoS (S-DoS) prevention approach by [85], by extending the well-known mirror
sites idea by redirecting different access requests from the same user to different mirror
sites. They developed an HTTP parser that fragments the HTTP requests for
communication between the client and server. The random assignment of the requests to
different mirror sites ensures that the attacker cannot succeed by capturing requests for a
single Web server and the high degree of unpredictability in mirror selection makes it
computationally and resource intensive for an attacker to predict the next chosen mirror
site.
A novel flow-based statistical aggregation scheme (FSAS) for network anomaly detection
was presented in [101]. An IP flow is a unidirectional series of IP packets of a given
protocol, travelling between a source and destination, within a certain period of time. Their
technique dramatically reduces the amount of monitoring data and handles high amounts
of statistics and packet data. The FSAS sets up flow-based statistical feature vectors and
reports to a Neural Network Classifier. The Neural Classifier uses Back-Propagation
networks to classify the score metric of each flow. FSAS can detect both bandwidth-type
DoS and protocol-type DoS.
A system was proposed in [44] which leverages their technique to differentiate web-access
requests generated by Denial of Service (DoS) attacks from legitimate ones. A port
randomised VPN architecture was proposed in [132] such that any application can use the
VPN. The VPN has strength against DoS or DDoS attack. The proposed VPN uses the same
Java applet as existing SSL VPNs use. A mobile code is called and dynamically changed
by Java remote method invocation (RMI). The VPN client applet can cooperate with a VPN
Page 46
Chapter 2
30
server and a firewall in the server side. Such a system seems to have its implementation
distributed over several locations on the internet cloud.
An improved method for detection and elimination of the security problems is setting up
the IDS system for timely notification of malicious actions on the network [47]. The
concept of a firewall and IDS system was used in this paper as a joint mechanism for
improved VPN network security. The proposed security system consists of firewall, syslog
server and email server and is implemented in a real environment and tested against some
frequent DoS attacks. The easiest attacks were realised through the frequent (FTP, HTTP,
RDP) open ports to the VPN network and successfully detected. Malicious activity system
alert is a mechanism for starting an active response to IDS attack and for blocking the
attacker, as well as establishing the full functionality of the network. An access log
generator to generate access logs was proposed in [17] with characteristics of browsing
behaviours for the particular Web site under investigation. They also included malicious
behaviours into the generated access log, which is combined with actual access log of the
Web site for further tests and analyses.
A survey by Suga in [124] about SSL/TLS Status in Japan: as the SSL/TLS are used
together with application layer communication protocols such as HTTP, SMTP, and POP,
it seems that this vulnerability affects a large number of applications and systems. This
vulnerability can be attributed to a problem in the SSL and TLS protocol specifications
themselves. They noted that 40.7% of local governments are vulnerable against the DOS
attack using the SSL/TLS renegotiation vulnerability and 36.9% sites use 1024 bit or less
RSA keys.
There is not much test work of the SPDY, especially security, and no research has ever
been done yet about Denial of Service attacks on SPDY, focusing on its interaction
property, as for any Internet service. A very recent RFC has been posted about the Transport
Layer Security (TLS) and the Application Layer Protocol Negotiation Extension [95]. The
protocol negotiation within the TLS handshake, for instances in which multiple application
protocols are supported on the same TCP or UDP port, such an extension allows the
application layer to negotiate which protocol will be used within the TLS connection.
Research on web protocols in [6] is about the implementation of e-commerce web site
security, as web transfer protocol is developed from the first plain HTTP to HTTPS, and
the developing SPDY, so it is widely used in e-commerce web site transfer protocol. They
Page 47
Chapter 2
31
analysed these network protocols, the author tried Apache Server [113] with SSL/TSL
support, and they presented prospects of the future development of web security protocol.
As DoS can target the web and HTTP, such a protocol is vulnerable for a flooding attack.
Researchers in [25] and in [2] wrote about an HX-DoS attack which is a combination of
HTTP and XML messages that are intentionally sent to flood and destroy the
communication channel of the cloud service provider; Cyber-Physical Systems, Software
as a Service (SaaS), Platform as a Service (PaaS).
From [10] Service optimization proxy: In this case, all web traffic (or much of it) is
redirected through an intermediate proxy that implements techniques to accelerate web
page delivery. The appeal of this approach is that improvements to web page delivery time
may be realised before the end-to-end protocol has been deployed on all web servers.
However, forcing all traffic through proprietary proxy implementations can have
unintended consequences when the proxy sends all traffic inside a single opaque tunnel.
This is equally true if the proxy is based on SPDY, HTTP/2.0, or a completely different
protocol. Split browsers: SPDY proxies deployed by Google/Amazon as an extension of
the browser are also proxies.
It has been found in this PhD thesis that SPDY traffic behaviour makes a SPDY proxy
vulnerable to a flood DoS, a malicious user who may perform as an attacker has the ability
to send a single TCP stream to the SPDY proxy that requires a massive number of resources
or objects to be retrieved from different locations in the Internet. In order to amplify the
DoS attack, and without involving many attackers to perform a DDoS, an attacker can send
many TCP streams, each stream containing large number of object requests, and easily
make a proxy get flooded with web objects that need to be processed over a long period of
time, so the offered proxy services become unviable unless a certain action is taken to
detect, react, and recover from the flooding DoS attack.
OPNET Simulation Package
This project consists of many problems that need to be solved and tested experimentally,
as any offered solution to any research issue should not be kept in its theoretical
architecture, it has to be validated in testing scenarios to get the appropriate results to make
that solution proven. For example, Session Initiation Protocol (SIP) runs over all the
Internet, and the Internet clouds have a countless number of interconnected computing
Page 48
Chapter 2
32
systems. Validating any kind of SIP issue in reality would be impossible, so the best way
is to implement a solution in an experimental lab, over a real network, by constructing a
real network system. Such a methodology still has some issues; difficulty in
implementation due to the needed resources, such resources are the required routers,
switches, capable servers, many computers, network cables, these resources need a high
financial budget. Further, this method does not involve only implementing and installing
the system, but also this methodology may involve installing other dependant hardware
devices and configuring their software. All of these could simply add extra time spent in
the configuration, in addition to the added cost of the hardware, software packages and their
licence fees, and working hours of specialist technicians who do the work of configuration
a researcher cannot do.
In addition, many solutions need a large number of computing devices to be installed over
large distances, which makes any real implementation impossible to validate any system.
To override such problems, special computer software packages are designed to do the
previously mentioned tasks; these packages are called Network Simulators, such as NS3
[81], OmNet++ [82], and ONE simulator [114]. Simulators usually allow any researcher or
network engineer to design and verify a networking system, and allow assessing the desired
performance.
OPNET is one of the most famous and most reliable simulators [83]. All because it is a
licence-based package, despite it is an open source code, unlike other open source
simulation packages, OPNET has to check on all the main contributions submitted to it,
this confirms its reliability to get correct results of the simulation. OPNET supports most
of the internet and networking protocols, including SIP networks. There are many tool
boxes in OPNET which can be used for designing different types of network and different
physical infrastructures.
In the Project Editor, a user can create nodes and the process models, build packet formats,
and create filters and parameters, via more specialised editors described later in this section.
Generally, each network consists of objects and nodes; the Node Editor is used to define
the behaviour of each network object, the behaviour is defined by different modules, which
define the node internal behaviour, such as CPU, storage...etc., and those modules are
connected via packet streams or statistic wires. An object consists of multiple modules and
they define the object’s behaviour. The Process Model Editor controls the functionality of
Page 49
Chapter 2
33
the node; it mainly presents the process in Finite State Machines (FSM), the FSMs consist
of States and Transitions. The Link Model Editor creates new types of link objects, each
having different attributes. The Path Editor is used to create new path objects and to define
a traffic route. The Demand Editor is used to define demand models; each demand object
determines its attribute interfaces, presentation, and behaviour. After all, the network model
has to be created; now one of the main stages is to define the statistics needed to be collected
during the simulation, this could be done in the project editor, but if additional
characteristics were desired, the Probe Editor allows that. Lastly, once getting the
simulation stage, it can be run from the Project Editor, but if more constraints are required
within the simulation, the Simulation Sequence Editor allows more configurations.
Simulation sequences are represented by simulation icons, which contain a set of attributes.
For the wireless functionality, the Antenna Pattern Editor models are the direction
dependent gain properties of antennas. The Filter Editor enables data filter building; there
are even built-in filters in OPNET. The Interface Control Information Editor (ICI) is used
to define the internal structure of ICIs that are used to formalise interrupt-based inter-
process communication.
In addition, a Modulation Curve Editor can be used to modulate the vulnerability of
information coding and modulation scheme to noise. The Packet Format Editor defines the
internal structure of a packet as a set of fields. To analyse the spread of probability over a
range of possible outcomes, the Probability Density Function (PDF) Editor enables that.
The main two tool boxes used were the Internet toolbox and the SIP tool box. They were
mainly used to build the networks; the primary tools used were the SIP Proxy Servers, IP
Telephones as end users, routers, switches, hubs, and links such as 10baseT, 100BaseT,
Point to Point Protocol (PPP links). The Application Configuration Object was used to
configure the VoIP applications, and the Profile Configuration Object was used to
configure the behaviour of every IP phone end user, both the caller, as a normal caller or
an attacker, and the callee, as normal receiver or a victim.
For the current issue of Flooding Denial of Service against SIP, the implementation of any
problem and its solution on OPNET will involve many steps: design the network, define
the parameters, choose the suitable statistics, run the simulation for a specific time, show
the result, and finally discuss and analyse the observed results.
Page 50
Chapter 2
34
The network was defined by defining its model, size, and elements. SIP Elements were set
by how many end VoIP phone clients, or more precisely the User Agent Clients (UAC)
were needed, what kind of servers were required (Proxy, Redirect, or Registrar server), and
the number of servers were set, or in other words the User Agent Server (UAS). Further
network elements were the needed interconnecting devices, routers and switches, and how
many ports each device has. In addition, to define what the transmission media and cables
were used: different kinds of twisted pairs between the switches and the clients, like
10BaseT, 100BaseT and 1000BaseT cables, while the Point to Point Protocol (PPP) was
defined to link between the routers, and to specify the data rate and the length for some of
these links.
Figure 2-6: OPNET simulation package main screen
Page 51
Chapter 2
35
The defined applications were real-time multimedia network-based applications, where the
multimedia streaming session must be initialled by the SIP protocol, these applications are
located on the servers. Here in the current experiments, the defined applications were VoIP
applications. Once a client wishes to start a VoIP call, requests are sent to the local SIP
Proxy Servers.
For some clients that were defined to behave as attackers, the defined applications for them
were set to operate in an abnormal mode, such as sending too many requests during the
simulation time, which can even prevent other normal clients starting at least one SIP-VoIP
call during the simulation running time. Every callee should define at least one application
as a supported service.
A profile is used to describe how to use the predefined VoIP applications and how they
behave within the simulation running time, like the start time, the number of repetitions
within the simulation… etc., so each profile should be attached with at least one application.
Every VoIP client (UAC) wishing to initiate a call should have at least one profile.
OPNET offers statistical data gathering in order to choose the type of statistics to be
collected during the simulation run, depending on the need of the research of the network.
For the current project, the statistics needed are mainly those related to the multimedia
transmission, like SIP UAC, SIP UAS, Voice Applications or others. In every main statistic,
there are sub-statistics, like the number of calls requested, or the number of calls connected
or rejected, which show the effect of any DoS attack. Other statistics could be needed for
some analysis related to the problem, like CPU usage and utilization, memory usage,
network bandwidth represented by Ethernet load, link utilization.
Finally, run the simulation: many parameters should be checked and modified before
running, in order to run the simulator to get the ultimate desired results. Like the time the
simulation runs, the number of results to be collected, in addition to other data that are not
related to the experiment itself, but they are related to the OPNET package itself, like
forcing recompilation during the run.
Page 52
Chapter 2
36
Summary
This chapter has presented an introduction about the computer science areas this research
is related to, the Internet generally and its applications, the Computer Networks with the
related Security principles, and a focus on the Denial of service flooding attack. This
chapter also presented the application layer protocols and their security: Hyper Text
Transport Protocol (HTTP) with SPDY technology, and Session Initiation Protocol (SIP).
The security issue Flooding Denial of Service (DoS) attacks with a focus on the issue of
DoS attacks targeting SIP and SPDY was explored, and how it can be done on both
protocols and their entities; an attacker can anticipate these protocols flow behaviour to
launch a flood towards any victim. The related previous literature was reviewed and
summarised to illustrate how others dealt with the problem.
Finally, the OPNET simulation package was introduced as it played an important role to
simulate the effect of DoS attacks on SIP.
Page 53
Chapter 3
37
Quality Control: Statistical Process Charts
(SPC)
D. C. Montgomery in his book [19] defined Statistical Process Control (SPC): to monitor
and control a Quality within some process. Since characteristics within a certain system are
not always identical from unit to unit, this generates a norm average among all the units for
a reasonable quality. The Control Chart is one of the primary techniques used in SPC.
Control charts are a very useful process monitoring technique; when unusual sources of
variability are present, especially from uncontrollable sources of variability, or from
difficult to control inputs, sample averages will plot outside the control limits, providing a
signal that some investigation of the process should be made and corrective action to
remove these unusual sources of variability should be applied to the input and output
variable(s) in a system. Generally they plot the averages, or other statistical equations and
techniques that utilise the averages of measurements of quality characteristics, of the
samples which were taken from the process, versus time period units or the ordered sample
numbers.
For each experiment and whenever an SPC equation is applied, for both SIP and SPDY,
the input observation values of the charts vary for each tested protocol. The input
observation value per time unit ( i ) is notated as ( X i ). An input observation value for the
SIP experimental simulation was the ratio of the number of the responses which were not
sent (non-acknowledged requests), to the total number of the received requests per time
period (time unit). Assuming:
α i : is the total number of SIP requests per time unit ( i )
β i : is the total number of SIP responses per time unit ( i )
Δ i : is the difference between α
i and β
i , Δ
i = α
i – β
i
Page 54
Chapter 3
38
Then the ratio or the input observation value for SIP ( SIP_X i ) is computed by:
SIP_X
i = Δ
i / α
i
(3.1)
An input observation value for SPDY experimental simulation was the result of
multiplication of the number of TCP streams sent by a user to a SPDY proxy server, by the
average number of the resources requested per each TCP stream per time unit ( i ) .
Assuming that:
α i : is the total number of TCP streams sent by a user per time unit ( i )
β i : is the average of the number of the resources requested per each TCP stream per
time unit ( i )
Then the input observation value for SPDY ( SPDY_X i ) is computed by:
SPDY_X
i = α
i . β
i
(3.2)
The difference in the observation input is to show that the techniques that are used in the
research are flexible in different cases. Because the scenario of SIP traffic flow is a two-
way communication, and an input value for the SIP experimental simulation is a ratio,
which is a mathematical division operation as shown in equation (3.1), then (SIP_X i ) will
result in tiny input values. While the scenario of SPDY traffic flow is a one-way
communication, and an input value for the SPDY experimental simulation is a
multiplication operation as shown in equation (3.2), then (SPDY_X i ) will result in very
large input values.
Cumulative Summation (CUSUM)
Cumulative Summation (CUSUM) [19], [26], [41], and [56], is a sequential statistical
analysis technique, which is used to monitor and to detect changes within any sequence of
quantitative observations in some experiment, i.e. monitoring for any sudden increase or
decrease in the number of incoming messages. CUSUM is a recursive equation, which
means a new CUSUM value is dependent on the previous CUSUM values. After a new
Page 55
Chapter 3
39
input value to the sequence of the observations is obtained, it will be used to find a new
CUSUM value. CUSUM is computed according to the following equation:
C i = X
i - ( µ
0 + K + σ ) + C
i – 1
(3.3)
The tabular form of CUSUM is another form of CUSUM where it is a one-sided upper
CUSUM. In this approach, CUSUM is only assigned positive values. At any point where
the CUSUM equation gets a negative value, CUSUM is assigned to zero, as mentioned in
[19]. This allows an easier plot as the graph will be always plotted on the positive area of
the y-axis, or visually over the x-axis. The results in Chapter 4 and Chapter 5 will show
more analysis and details. The equation below is the one-sided upper CUSUM.
Ci
+
= MAX [ 0 , ( X i - ( µ
0 + K + σ ) + C
i – 1 ]
(3.4)
The superscripted plus sign ( + ) on the right top corner of (C + ) indicates the positive plot
always over the x-axis, within the positive y-axis area. This scales the CUSUM graph in
order to show a clearer and easier way to detect a DoS attack by the threshold limits, as will
be shown later in this thesis. Where:
C i : most recent CUSUM value to be computed
Ci
+
: most recent upper sided CUSUM value to be computed
C i – 1
: previous CUSUM value
Ci
+
- 1 : previous upper sided CUSUM value
X i : most recent observation value
µ 0 : the Overall observations’ mean value
The variable ( K ) is called the reference value or the allowance, and it is often chosen about
halfway between the target ( µ i – 1
) and the out of control value of the mean ( µ i). K is
calculated by:
K = δ . σ
2
(3.5)
Page 56
Chapter 3
40
If the shift was expressed by the standard deviation units, then K is one-half the magnitude
of the shift and it is given by:
As CUSUM computes the differences between the values and the average, it is able to
detect and plot small changes in a sequence of quantitative observations, so it can be
employed in very critical and sensitive DoS protection systems, because it will make it
easier to detect any sudden change, even it is a small change, in the incoming traffic.
3.1.1 CUSUM Control Limits
There have been several attempts to work out the optimal level of each threshold, but the
simplest, lowest complexity, and the best performing, is to use a function of the standard
deviation ( σ ) of the whole sequence, as the authors suggest in [19]. In the current research,
an alarm threshold equal to five times the standard deviation is represented as big theta (Θ).
Θ = 5 . σ (3.8)
Using the standard deviation, a threshold limit was used to sense any increase in the
CUSUM due to an increase in the ratio. This is useful to alert the victim of a possible
upcoming attack, or to detect any slow rate DoS attack, without or just before trigging the
attack alarm. In this research, the attack alarm is represented as small theta ( θ ), which is
double the value of the standard deviation.
Exponentially Weighted Moving Average (EWMA)
The Exponentially Weighted Moving Average (EWMA) control chart is a good control
chart when you are interested in detecting small shifts within a sequential quantitative
observation, Montgomery [19], in addition to other considerable publications [49], [97],
[96], and [98]. EWMA is taken as a low-pass filter that discards noise in the samples. It
δ =
| µ i − µ
i – 1 |
σ
(3.6)
K =
| µ i − µ
i – 1 |
2
(3.7)
θ = 2 . σ (3.9)
Page 57
Chapter 3
41
depends on a smoothing weight factor that determines how quickly the older values are
forgotten [5]. Since the EWMA can be viewed as a weighted average of all past and current
observations, EWMA is a dynamic algorithm that constantly adapts its value based on
continuous measurements and it is very insensitive to the normality assumption, therefore
it is an ideal control chart to use with individual observations and is used extensively in
time series modelling and in forecasting [19], [30], and [77]. The basic EWMA equation is
defined by equation (3.10):
EWMA i = λ . Xi + (1 - λ ) . EWMA i -1 (3.10)
Another trend was adapted in this research, similar to the CUSUM algorithm, of finding an
EWMA value by applying the concept of the upper-sided EWMA algorithm, but the
decision value is the mean ( μ0), where the plot starts, not zero as it was in CUSUM.
EWMA i+ = MAX [ ( λ . X i+ (1 - λ ) . EWMA i-1
+ ), μ
0 ] (3.11)
EWMA i : The most recent EWMA to be computed.
EWMA i+ : The most recent upper-sided EWMA to be computed.
EWMA i-1: The previous EWMA value.
EWMA i-1+
: The previous upper sided-EWMA value.
EWMA 0 = μ0
μ0 : The Overall observations’ mean
: A weighting factor, where 0 < ≤ 1
3.2.1 EWMA Control Limits
To detect a change in a sequence, lines were set for the quantitative observations of that
process; a Centre Line (CL) represents where this process characteristic should fall, the
Upper Control Limits (UCL) and Lower Control Limits (LCL) are determined from
some simple statistical considerations. Equations (3.12), (3.13), and (3.14) show the limits’
equations.
Page 58
Chapter 3
42
UCL = μ0 + L . σ . √
λ
( 2 - λ ) . [ 𝟏 − ( 𝟏 − 𝝀 ) 𝟐 .𝒊 ]
(3.12)
CL = μ0 (3.13)
LCL = μ0 - L . σ . √
λ
( 2 - λ ) . [ 𝟏 − ( 𝟏 − 𝝀 ) 𝟐 .𝒊 ]
(3.14)
μ0 : The Overall observations’ mean
: A weighting factor, where 0 < ≤ 1
𝝈 : The Standard deviation.
L : The width of the control limits.
Montgomery in [19] strongly recommended the use of the exact control limits in equations
(3.12) and (3.14) for small values of i. This will greatly improve the performance of the
control chart in detecting an off-target process immediately after the EWMA starts up [19].
EWMA is sometimes called a Geometric Moving Average (GMA), because the weights
decline geometrically when connected by a smooth curve.
The weight ( ) is a smoothing factor that controls the how quickly the old values are
forgotten, so it is measure of the variability in order to capture important patterns and
discard noise in the sample data. The width of the control limits ( L ) are utilised to set the
threshold to detect an out of control process or most recent observation.
EWMA has been used in other disciplines of science and research where the variables ( )
and ( L ) have been used in different ways and with different values. Since the EWMA
chart implementation is sensitive to small shifts in the process, so choosing the previously
mentioned factors can be a dilemma by itself. Some other researchers have investigated the
issue of setting these factors with some recommendation, like in [19], [80], [117], and
[116]. The recommendation is to assign the smoothing factor to 7/8 ( λ = 7/8 ≈ 0.9 ), and
the width of the control limits to 3 ( L = 3 ) when used as an attack threshold alarm in
Page 59
Chapter 3
43
equation (3.12), which is notated as upper theta ( Θ ), therefore an alert attention, which is
notated as lower theta ( θ ), is set to 2 ( L = 2 ).
Statistical Process Control and Denial of Service
A Real-Time Attack Detection and Prevention System for DDoS was designed in [131].
The designed research was based on per-IP Traffic Behavioural Analysis. A new
nonparametric CUSUM algorithm is applied to detect SYN flooding attacks. The system is
deployed at the entrance to the victim subnet, such as access network. The system
architecture can be divided into three layers: application layer, network layer, and driver
layer.
A mechanism for detecting SYN flooding attacks at leaf routers, which connect end hosts
to the Internet, was proposed in [42]. The simplicity of the detection mechanism lies in its
statelessness and low computation overhead, which make the detection mechanism itself
immune to flooding attacks. The detection mechanism is based on the protocol behaviour
of TCP SYN-FIN (RST) pairs, and is an instance of the Sequential Change Point Detection.
To make the detection mechanism insensitive to site and access pattern, a non-parametric
CUSUM method was applied, making the detection mechanism much more generally
applicable and its deployment much easier. The efficacy was validated by simulations. The
results show that the detection mechanism has short detection latency and high detection
accuracy. Also it was shown how it reveals the location of the flooding sources without
resorting to expensive IP trace back.
A simple and robust mechanism in [43] to detect Denial of Service (DoS) attacks, called
Change Point Monitoring (CPM), was presented. The core is based on the inherent network
protocol behaviours and is an instance of the Sequential Change Point Detection. The
CUSUM method was applied. CPM only introduces a few variables to record the protocol
behaviours. The statelessness and low computation overhead of CPM made it immune to
any flooding attacks. The efficacy of CPM is evaluated by detecting a SYN flooding attack
which is the most common DoS attack. The evaluation results show that CPM has short
detection latency and high detection accuracy.
The CUSUM statistical method [29] was used in [62] to treat flooding DoS on SIP attacks.
CUSUM statistical detection founded on the adaptive sliding window based acquisition is
adopted for achieving high accuracy and low latency. The experimental result shows that
Page 60
Chapter 3
44
this method achieves a high rate, low latency and low false alarm rate of SIP flooding
detection.
Although EWMA is a powerful SPC technique to monitor and control quality, it has been
used less to detect DoS attacks. Low rate Denial of Service was discussed in [58], where
they used the EWMA algorithm to observe the departure of TCP traffic distribution. When
the TCP traffic becomes unusual, its distribution and decreased degree are significantly
different than those without any low rate DoS attack. Experiments in their work had shown
that EWMA was effective to detect multiple modes of low rate DoS attack.
An approach to detecting denial of QoS attacks on DiffServ networks was given in [125].
They focused on online quick detection, scalability to large networks, and a low false alarm
generation rate. Sensors sample QoS metric at strategic points and anomalies are detected
in sampled network flow statistics using a EWMA Control Chart. In addition, rule-based
intrusion detection is used with these techniques. They tested this intrusion detection
approach using emulation on a test bed, and using simulation. Their approach resulted in
100% detection, but it required from under a minute to approximately 15 minutes to detect.
The false alarm rate at the sensitivity level used to achieve these detection results was less
than 1%.
SPC Ways of Application
3.4.1 Offline
This method is applied by finding the mean ( μ n ) and the standard deviation ( σ
n ) of the
whole sequence of quantitative observations prior to computing an SPC value. This method
represents a system with previous knowledge and experience of the ongoing traffic. This
way of implementation has an advantage of overhead reduction in the time spent in finding
the mean and the standard deviation every time a new observation is added to the sequence.
Figure 3-1 shows the flowchart of the offline way of application in DoS detection. The
entire observation set is read ( X = { X0 , X1, X2 ,…,X n } ), then the mean ( μ n ) and the
standard deviation ( 𝝈 n ) of the whole set are found. After that the alert attention limit (θ
n)
is found, and if the result of ( SPC n ) is equal or greater than this limit, then it is compared
Page 61
Chapter 3
45
to ( Θ n), which is the alarm threshold. If the result of ( SPC
n ) is equal to or greater than
this threshold then a DoS attack alarm is triggered.
Start
X = {X0 , X1, X2 ,…,Xn}
μ n ,σ n
θ n Θ n
SPC n ≥ θ n
no
YES
TAKE
ACTION
YES
no
SPC n ≥ Θ n
alert ALARM
Figure 3-1: Flowchart for the Offline detection application
3.4.2 Online
This method is applied by updating the mean ( μ i ) and the standard deviation ( σ
i ) on
getting a new observation and adding it to the sequence of the quantitative observations
every single time unit. Then the ( SPC i ) equation is immediately applied for the current
whole sequence. This way of application has an advantage for implementation on a system
with no prior experience or knowledge of the ongoing traffic, such as if a system is newly
started, or if a system has been reset, for instance, after detecting flooding in the current
traffic, and it can adapt the SPC to detect any DoS attack. Figure 3-2 shows the flowchart
of the online way of application in DoS detection. Once a new observation is read ( X i )
and added to the observation set, then the mean ( μ i ) and the standard deviation ( 𝝈
i ) of
the whole set are updated. After that the alert attention limit ( θ i ) is updated. If the result
of ( SPC i ) is equal to or greater than this limit, then it is compared to ( Θ
i ), which is the
alarm threshold. If the result of ( SPC i ) is equal to or greater than this threshold then a
DoS attack alarm is triggered.
Page 62
Chapter 3
46
Start
New, current
observation X i
μ i ,σ i
θ i Θ i
SPC i ≥ θ i
no
YES
TAKE
ACTION
YES
no
SPC i ≥ Θ i
alert ALARM
Figure 3-2: Flowchart for the Online detection application
Summary
This chapter has explained in detail the Quality Control and the Statistical Process Charts
(SPC), Cumulative Summation (CUSUM), and Exponentially Weighted Moving Average
(EWMA). These techniques were the methodology the current research had used to detect
DoS attacks. For each technique, their related equations were explored, equations for
monitoring the process and sensing the change in the observations, and other equations for
setting the thresholds to optimally detect flooding DoS attacks were seen. Finally, two
different ways of applying the SPC techniques, offline and online, were discussed with flow
charts illustrating their work and the difference between the two.
Page 63
Chapter 4
47
DoS Targeting SIP: Results and Analysis
DoS impact on SIP: OPNET Simulation
Some experimental work has been done in order to present the impact of the problem of
Denial of Service (DoS) attacks towards Session Initiation Protocol (SIP). OPNET
Simulator [83] was utilised to do the job.
Several scenarios were designed, many of them failed to show the problem, due to
different reasons, mainly the difficulty of OPNET itself. This simulator is such a huge
software package which needs a long time to learn its basics in order to set a proper
scenario that is able to simulate a certain network flow. However, the scenarios were
finalised to fully illustrate the issue; the first scenario shows the basic idea of the DoS
attacks towards a SIP server and a SIP callee (receiver). The second scenario shows the
Distributed Denial of Service (DDoS) against a SIP server and a SIP callee, involving too
many callers which were set to be attackers to simulate multiple sources of a flood.
4.1.1 Small network simulation
This scenario simply consists of a SIP caller, SIP callee, attacker, and SIP Server. The
caller attempts to start a SIP-based VoIP call to the callee. The caller is the User Agent
Client (UAC), while the callee is the User Agent Server (UAS), as in Figure 4-1. The SIP
server has the responsibility of connecting the calls between any caller (UAC) and callee
(UAS). This server was set to a limited simultaneous calls set to 5 calls at a time; this
plays an important role in presenting how a DoS attack works, as every system has its
own limitation.
Page 64
Chapter 4
48
Figure 4-1: SIP OPNET small network design
Two applications were set in this scenario. The first one was called “app_1”, it represents
the normal operation of a caller attempting to initiate a VoIP session with the callee. It is
simply an IP telephony application, with SIP signalling, while SIP is running over TCP
in this scenario. The second application was the malicious one; an IP telephony, with SIP
signalling, and running over TCP.
There were no differences between the applications, but the differences were in the
profiles that defined the attitude of each agent, and how they used the defined applications.
The first profile supported the normal application, it initiated the call after 120 seconds of
the simulation start, and the call duration was 360 seconds, and it had no repetitions. There
were other 10 attacking profiles, each profile started after 60 seconds of the simulation
starting time, each profile had a call duration of only 5 seconds, but every profile was
repeatable for unlimited occurrences, with inter-repetition time of 2 seconds between
every two occurrences.
Page 65
Chapter 4
49
The caller was supported with the normal profile, while the attacker is supported with the
other 10 attacking profiles, which represents the attacker’s high rate of requests being sent
to the SIP server, which led the server to get busy in processing these requests.
Figure 4-2 shows how the server was busy in dealing with the calls’ requests, since the
starting time of the attacking profile is at the second 60; the line in blue is the active calls,
the inter-repetition time of each call is 2 second, call durations in red is around 4 seconds,
which is around the 5 seconds which was set to each attacking profile. So that is why the
blue line goes up for 4 seconds and down for around 2 seconds.
Figure 4-3 is about the callee, the same as the server’s results, the callee was busy with
the active calls, and it is here equal to 1 call for the whole simulation.
Finally, Figure 4-4 is the attacker’s active calls among the simulation, and the call
durations. Here it looks the same as in the server’s results, because it is the only active
caller during the simulation.
Figure 4-2: Small network’s SIP server; Active calls, and Calls durations in seconds
Page 66
Chapter 4
50
Figure 4-3: Small network’s Callee active Calls
Figure 4-4: Small network’s Attacker; active calls, and call durations
Page 67
Chapter 4
51
4.1.2 Large network simulation
This scenario consists of 5 callers, 5 receivers, 100 attackers, and a SIP Server. It shows
the effect of a Distributed Denial of Service (DDoS). The caller, the User Agent Client
(UAC), attempts to start a SIP-based VoIP call to the callee, which is the User Agent
Server (UAS).
Figure 4-5 shows the scenario’s network architecture, the normal callers and receivers
were framed with yellow; Callers 1, 2, 3, 4, 5, and Receivers 1, 2, 3, 4, 5. The SIP_Server
and Receiver_5 were the victims and are framed with red in
Figure 4-5, while Receiver_5 was a normal operating receiver, it was set as a targeted
victim in the scenario. The 100 attackers were all involved simultaneously during the
attack, this is to simulate many sources of a flood to form a DDoS attack.
The SIP server had the responsibility of connecting the calls between any caller (UAC)
and callee (UAS). This server had a limited ability of the number of simultaneous calls
that is set to 20 calls at a time; this limitation plays an important role in presenting how
DoS and DDoS attacks work.
Five applications were set in this scenario to act as normal running applications; they
represented the normal behaviour of a caller attempting to initiate a VoIP session with
some callees. The applications were simply IP telephony applications, with SIP signalling
running over TCP. Another application was defined as an attacking application, an IP
telephony, with SIP signalling running over TCP.
There were no differences between the applications, but the differences are in the profiles
that defined the attitude of each agent, and how they use the defined applications. The
first profile initiated the call after 120 seconds of the simulation start, and the call duration
was 150 seconds, and it had no repetitions.
The second profile initiated the call after 600 seconds of the simulation starting time, and
the call duration was 210 seconds, and it had no repetitions. The third profile initiated the
call after 960 seconds of beginning the simulation, and the call duration was 120 seconds,
and it had no repetitions. The fourth profile initiated the call after 980 seconds of the
simulation start, and the call duration was 60 seconds, and it had no repetitions. The fifth
profile initiated the call after 1200 seconds of the simulation start, and the call duration
was 150 seconds, and it had no repetitions.
Page 68
Chapter 4
52
The attacker’s profile initiated the call after 500 seconds of the simulation starting time,
and the VoIP call duration was 2 seconds, the very short call duration was set to simulate
an attacker attempting to make a call and hang up immediately to start another short call,
and it had unlimited repetitions. Each normal caller and callee were supported with one
of the normal profiles, while every attacker of the 100 attackers was supported with the
attacking profile. After running the simulation for 30 minutes, there had been some results
gathered.
Figure 4-5: SIP OPNET large network design
Figure 4-6 is the active calls among the simulation, it shows how successful the first call
was, before starting the attack; the bulky blue area indicates the continuous active calls.
As it seems, there was only one successful call during the attack period, while three other
Page 69
Chapter 4
53
calls failed to initiate a session. This gives an indication of how such a DoS attack
prevented 75% of the users of using the SIP service during the simulation’s attack.
Figure 4-7 shows the active calls among the simulation which is about the successful
callers; the first caller that succeeded to start, continue without disruption, and finish a
VoIP call, before the start of the DoS attack. The fourth caller, which is another successful
caller, also succeeded to start, continue without disruption and finish a VoIP call, but
during the time of the DoS attack.
Figure 4-8 shows how some normal agents were unable to initiate calls; it shows the
number of rejected calls for callers 2, 3, and 5. They were unable to initiate the call
because of the attack. Finally, Figure 4-9 is about callee number five, where actually all
attackers try to call; it shows below how it was busy with the calls for the whole attacking
period in the simulation.
Figure 4-6: Large Network’s server active calls
Page 70
Chapter 4
54
Figure 4-7: Large Network’s first and fourth caller active calls
Figure 4-8: Large Network’s callers 2,3, and 5; rejected calls
Page 71
Chapter 4
55
Figure 4-9: Large Network’s callee 5; active calls
4.1.3 Experimental Limitations
During carrying out the experimental work many limitations were faced that slowed down
the process and caused latency in getting the final results of the work. OPNET is a huge
package, and it comes along with too many tools and options, with several parameters that
must be adjusted depending on the experiment. So it needed a long time in order to go
through and test many cases and different scenarios in order to handle the required features
in the OPNET simulator and experience them. There would be a better chance to learn
more about the OPNET features if more time was spent on it, and by that more
experiments and scenarios will be done, and better results will be obtained with better
perfect analysis.
In addition, many scenarios were not completed successfully, because when these
scenarios were carried out, they needed to collect too many values and statistics, and they
seemed to do many processes that were limited by the computer’s processing capability,
the system’s memory, and the space availability on the hard disk. Furthermore, the
simulation crashed many times during the run time; the simulator had to be restarted, in
order to modify the scenarios, and look for the reasons behind the crash. On some
occasions, the computer had to be reset which led to data loss.
Page 72
Chapter 4
56
Traffic Generation
The Session Initiation Protocol (SIP) is a two-way communication method, and it is a
connection oriented data communication, which means any sent request must be
acknowledged with a response. However, as the internet is a packet switching
communication network, it is always possible and expected to miss a few responses for
their correspondent sent requests; so within any time period, there will be always a ratio
between the total number of NON-acknowledged responses and their sent requests.
The previous concept is very useful to aid in detecting any sudden Denial of Service (DoS)
flood towards any SIP targeted victim, when the victim gets busy in processing the
received traffic, which means less acknowledged responses for every received request,
and by result, this will increase the ratio of the NON-acknowledged sent responses and
the received requests.
Two different sets of traffic were tested in the current research; the first set was generated
by the simulation methods which were used in the research, the second set of traffic was
obtained from another research that adopted the same idea of SIP two-way
communications [45]. The first generated set was tested into two different scenarios
according to how steep is the increase of the incoming requests, and the differences
between the incoming requests and the acknowledged responses. The first scenario shows
the case of a sudden high steep increase in the incoming traffic with much less
acknowledgments which means a subjectively large difference, and the second scenario
shows the case of a low sudden steep increase in the incoming traffic with less differences
in the acknowledgments. The second scenario represents a low and slow flooding DoS
attack which targets a SIP victim. In each scenario, two cases were tested. The first case
was by previously finding the mean ( µ ) and the standard deviation ( σ ) of the whole
sequence of the observed ratios, then finding the CUSUM or EWMA values, and this case
represents a system which monitors the traffic and having previous knowledge about the
traffic. The second case in CUSUM or EWMA calculations is by updating the mean and
the standard deviation right after getting a new observation ratio, and then finding the new
CUSUM or EWMA values. Both ways of calculations have shown significant results; the
first case has an advantage of reducing the overhead spent in the computations, while the
advantage of the second case was to present how a system with no previous experience or
Page 73
Chapter 4
57
knowledge of the ongoing traffic can adapt the CUSUM and EWMA to detect any sudden
change in that traffic.
4.2.1 Simulation Generated Data set
The network architecture in Figure 4-10 for the scenario of generating traffic of SIP
consists mainly of a SIP agent connected to a Traffic Monitor; in a real-life network this
would be a firewall, a DeMilitarized Zone (DMZ) [61], or any other malware protection
software. The SIP Traffic Monitor is connected to the internet cloud, it receives SIP
requests and forwards them to the SIP agents, and returns the responses to the external
requesting agents. The SIP Traffic Monitor is in charge of counting the requests and their
correspondent responses, in order to screen the flow behaviour of SIP for abnormalities,
and detects any potential flooding DoS attacks that attempt to utilise the behaviour of SIP
flow.
Figure 4-10: SIP scenario network architecture
SIP
Agents
SIP
Traffic
Monitor The
Internet
Cloud
Page 74
Chapter 4
58
Figure 4-11: SIP First generated scenario simulated traffic, large differences
The generated traffic was set to run normally starting from the time point zero until right
before the 100th time unit ( t = [ 0 , 100 ) ), the number of the acknowledged responses is
equal or so to the number of the received requests, as both the red and the blue lines are
almost overlapping on each other except for a very few small and unnoticeable differences
throughout this time period. It is highly expected to have missed messages or out of order
packets in the normal Internet packet switching world, until at the time unit of 100 ( t =
100 ) as the DoS attack starts, this is how the simulation parameters were set, so the red
line looks as shifting down starting from this point until the end of the simulation and the
end of the DoS attack.
The plotted graph in Figure 4-11 shows the simulation’s generated traffic of the first
scenario. The x-axis represents the simulation’s time line ( t ), the y-axis is the number of
requests (blue), and how many of these requests were acknowledged by a response (red),
among the x-axis, the time of the simulation run.
In the second scenario of the first set of the simulated traffic, the increase of the received
requests slightly increases, it is harder to be noticed if plotted in a chart, meanwhile the
sent responses also slightly decrease, without dropping too much, in order to simulate a
slow rate DoS flood.
0
200
400
600
800
1000
1200
1400
1600
0 5 10 15 20 25 30 35 40 45 50 55 60 65 70 75 80 85 90 95 100 105 110
Nu
mb
er o
f M
essa
ges
Time units
Received Requests
Acked Responses
Page 75
Chapter 4
59
Figure 4-12 illustrates the received requests and their correspondent responses. Around
time slot 28 and slot 29, ( t = 28 ) and ( t = 29 ), a very slight and unnoticeable difference
was set in the requests and the responses, the slight increase was set to represent a
possibility of slow flooding DoS attack.
The graph which is plotted in Figure 4-13 is a zoom at the time period from 95 until 110,
( t = [ 95 , 110 ] ). Again the attack was set to start at ( t = 100 ), prior to this point, where
the normal traffic is flowing on, then it is much clearer how after the 100th time unit and
during the attack, the fewer responses the victim was able to acknowledge for every
request received, as the victim’s resources are presented to be sensitive, which means the
victim was less able to respond to each request on their received time.
This scenario is an excellent example representing the slow rate flooding DoS attacks,
which cannot be easily detected, but slowly able to consume certain resources on the
victim’s side. The graph which is plotted in Figure 4-14 is a zoom at the time period from
26 until 31, ( t = [ 26 , 31 ] ); this slight increase would happen due to the nature of the
internet, it is very expected to have delays and differences. However, the methodology
proved its reliability by spotting these differences after applying the SPC equations, both
CUSUM and EWMA.
Figure 4-12: SIP second generated scenario simulated traffic, slight increase
0
100
200
300
400
500
600
700
0 5 10 15 20 25 30 35 40 45 50 55 60 65 70 75 80 85 90 95 100 105 110
Nu
mb
er o
f M
essa
ges
Time Units
Received Requests Acked Responses
Page 76
Chapter 4
60
Figure 4-13: SIP second generated scenario, zoom at the attack, t=[95,110]
Figure 4-14: SIP second generated scenario, zoom at t = [ 26 , 31 ]
0
100
200
300
400
500
600
700
95 96 97 98 99 100 101 102 103 104 105 106 107 108 109 110
Nu
mb
er o
f M
essa
ges
Time Units
Received Requests Acked Responses
0
50
100
150
200
250
300
350
400
450
500
26 27 28 29 30 31
Nu
mb
er o
f M
essa
ges
Time Units
Received Requests Acked Responses
Page 77
Chapter 4
61
4.2.2 Imported Traffic
The graph below in Figure 4-15 plots the imported traffic from [45], or the extended
version from [46]. The traffic is an analysis of SIP traffic from an operational VoIP
service, and it is the first attempt at profiling SIP-based VoIP traffic behaviour based on
real-network traces. The graph shows the number of received SIP REGISTER messages
against the number of generated responses in each second of 5-minute intervals. It can be
seen that between around the 100th second to 160th second of this interval, the number of
REGISTER requests from users shoots up quickly, while the responses returned by the
server first dips for about 50-60 seconds before it shoots up also, catching up with the
number of REGISTER requests, after which everything returns to normal.
Figure 4-15: SIP imported traffic scenario
In [45], they have examined the number of REGISTER requests generated against the
number of responses received per user in the 1-minute time period from the 100th second
to the 160th second. Then, they observed that, instead of the normal one REGISTER
request and one response per user, many users sent around 2-7 REGISTER requests while
receiving one or two responses at most per user, until they all successfully register with
the SIP server. A closer investigation reveals that the problem is caused by the SIP server
not responding to the user registration requests immediately, triggering users to repeatedly
0
20
40
60
80
100
120
140
160
180
1 6 11 16 21 26 31 36 41 46 51 56 61 66 71 76 81 86 91 96 101106111116121126131136141146151156161
Nu
mb
er o
f M
essa
ges
Time Units
Received Requests Acked Responses
Page 78
Chapter 4
62
re-transmit their requests within a few seconds until they either give up or receive a
response with response code 404 Not Found, 408 Request Timeout, or 200 OK.
The researchers in [45], originally suspected that the surge of the REGISTER requests
was caused by a DoS attack with spoofed or frivolous REGISTER messages. However,
they stated that they found the SIP server failed to respond to the user registration requests
in a timely fashion way, which may be caused by a delay or a slow response from some
remote (user/call) database with which the SIP server was interacting. What was
previously mentioned about the imported traffic, although it is not a formal DoS attack
towards a SIP server, but it represents two main useful attributes: first, a general massive
drop in the number of responses compared to the requests, so assuming this is can be a
case of any type of SIP requests that have much fewer responses and this is pretty much
the DoS scenario; second, they stated the SIP server failed to respond to the user
registration requests in a timely fashion way, caused by some delay, and any delay or any
slow response from any computing system or service would be considered a property of
being under DoS attack, so this also supports a case scenario for the current research to
test the methodology.
Detecting DoS attacks on SIP using CUSUM
Two different methods of applying CUSUM charts, the Offline and the Online, are used
on the traffic to detect a DoS attack. The first method, the Offline, is when there is a set
of sequence numbers, which in this case represents the sequence of the requests/responses
traffic per time unit, with an already pre-known mean of the observations, and then the
CUSUM technique is applied on the generated traffic with their two scenarios, and applied
to the imported traffic.
The second method, the Online, shows a live running system adding a new observation to
the previously observed sequence set, then the mean is found and updated, then the
CUSUM technique is applied on both generated traffic with their two scenarios and the
imported traffic.
Page 79
Chapter 4
63
4.3.1 Generated SIP Traffic Simulation Results using CUSUM
4.3.1.1 CUSUM on First Scenario: Large Differences
4.3.1.1.1 Offline implementation
Figure 4-16 shows the results of the first scenario of having a DoS attack, after applying
the simple and basic CUSUM equation, with the Offline implementation method from
equation (3.3). It is clearly shown how it would be hard to identify the attacking starting
point.
Another approach of plotting an easier and more noticeable graph is by applying a tabular
form of CUSUM as mentioned in [19]. This way plots the maximum result of either zero
or the CUSUM value in order to obtain one upper-sided CUSUM, as in equation (3.4).
The superscripted plus sign (+) on the right top corner of ( C ) indicates a positive plot
always over the x-axis, within the positive y-axis area. This scales the graph into showing
a clearer and an easier way to detect a DoS attack; the graph in Figure 4-17 illustrates how
for all the time the traffic was running within the normal way, plotted CUSUM values
were nearly progressing horizontally, in other words, remaining in control, but on the time
when the attack starts ( t = 100 ), the steep ratio between the requests and the responses
appears in the chart and the plotted CUSUM values suddenly drifts up out of control.
Figure 4-16: SIP First scenario, large differences, basic CUSUM, Offline implementation
-25
-20
-15
-10
-5
0
0 5 10 15 20 25 30 35 40 45 50 55 60 65 70 75 80 85 90 95 100 105 110
CU
SU
M
Time units
Page 80
Chapter 4
64
Figure 4-17: SIP First scenario, large differences Upper sided, Offline implementation
Figure 4-18: SIP First scenario, large differences, basic and Upper sided CUSUM, Offline
implementation
0
0.5
1
1.5
2
2.5
3
3.5
4
4.5
0 5 10 15 20 25 30 35 40 45 50 55 60 65 70 75 80 85 90 95 100 105 110
CU
SU
M
Time units
-25
-20
-15
-10
-5
0
5
10
0 5 10 15 20 25 30 35 40 45 50 55 60 65 70 75 80 85 90 95 100 105 110
CU
SU
M
Time units
upper sided CUSUM basic CUSUM
Page 81
Chapter 4
65
The chart in Figure 4-19 shows the plot of the CUSUM with the limits to determine the
thresholds to a flood attack; these limits are the suspect level of a DoS attack and the alarm
triggering level to declare an attack is targeting the victim.
Using the standard deviation ( σ ), a threshold limit was used to sense any increase in the
CUSUM due to an increase in the request to responses ratio. This is useful to alert the
victim of possible near future attack, or to detect any slow rate DoS attack, without or just
before trigging the attack alarm, which in this research is represented as lower theta ( θ ),
which is twice the value of the standard deviation, depending on how sensitive the
suspicion alert is desired.
The plotted graphs in Figure 4-19 shows the upper-sided CUSUM with the suspicion alert
( θ ) and the triggering alarm threshold ( Θ ), the blue consistent line is the CUSUM values
plot, the black dashed line is the suspect alert ( θ ) for an increase in the ratio, the empty
black rounded points are the Boolean flags, either zero or one, to represent a suspected
DoS attack at a certain time, the red dashed line is the alarm threshold ( Θ ), and the solid
red points are the Boolean flags, either zero or one, to represent a flooding DoS. This
method to watch any suspect time point before declaring it as an attack time is useful to
reduce the false alarm triggering, as it might be just an increase of incoming traffic that is
affecting the request/response two-way communications and causing some delay in that.
The chart in Figure 4-20 is a zoom at the period 95 to 110 ( t = [ 95 , 110 ] ), for a better
and clearer representation of the attack starting point, suspicion flags, and alarm triggering
points, and how the suspect attack is raised before an alarm is triggered. The attack was
set in the simulation to start at the time point 100 ( t = 100 ), the blue CUSUM plot first
crosses the black dashed line, the suspicion alert, then it crosses the red dashed line to
trigger the attack alarm, so there are empty black points equal to one being printed while
there are solid red points still shown as zero, then the alarm for the DoS attack is triggered
to print the red solids as one later on during the attack.
Page 82
Chapter 4
66
Figure 4-19: SIP First scenario, large differences, Upper-sided CUSUM with alert and alarm limits,
Offline implementation
Figure 4-20: SIP First scenario, large differences, zoom at the attack period t = [ 95 , 110 ] , Offline
implementation
4.3.1.1.2 Online implementation
The previous method, the Offline method, was to test a system after finding the mean and
the standard deviation of a certain sequence of numbers, that is, to represent a system with
previous knowledge and experience of the ongoing traffic. This reduces the overhead
spent in finding the mean and the standard deviation every time a new observation is
added to the sequence, but what if a system is newly starting with no knowledge, or for
instance a system was reset after detecting a flooding in a current traffic, so the following
is the other method, the Online method, of getting a new observation and updating the
0
0.5
1
1.5
2
2.5
3
3.5
4
4.5
0 5 10 15 20 25 30 35 40 45 50 55 60 65 70 75 80 85 90 95 100 105 110
CU
SU
M, li
mit
s, f
lags
Time units
upper sided CUSUM θ suspect Θ alarm
0
0.5
1
1.5
2
2.5
3
3.5
95 96 97 98 99 100 101 102 103 104 105 106 107 108 109 110
CU
SU
M, li
mit
s, f
lags
Time units
upper sided CUSUM θ suspect Θ alarm
Page 83
Chapter 4
67
CUSUM after updating the mean and the standard deviation. This method was found by
applying the basic CUSUM, equation (3.3) as in Figure 4-21, or the upper-sided CUSUM
equation (3.4) as in Figure 4-22. The chart in Figure 4-23 plots both ways combined.
The plotted graphs in Figure 4-24 shows the updated upper-sided CUSUM with the
suspicion alert and the triggering alarm thresholds, the blue consistent line is the updated
CUSUM values plot, the black dashed line is the suspect alert for an increase in the ratio,
the empty black rounded points are the Boolean flags, either zero or one, to represent a
suspected DoS attack at a certain time, the red dashed line is the alarm threshold, and the
solid red points are the Boolean flags, either zero or one, to represent a flooding DoS.
The chart in Figure 4-25 is a zoom at the period 95 to 110 ( t = [ 95 , 110 ] ), for a better
and clearer representation of the attack starting point, suspicion flags, and alarm triggering
points, and how the suspect attack was raised at the time an alarm was triggered.
Figure 4-21: SIP First scenario, large differences, basic CUSUM, Online implementation
-1
0
1
2
3
4
5
6
0 5 10 15 20 25 30 35 40 45 50 55 60 65 70 75 80 85 90 95 100 105 110
CU
SU
M
Time units
Page 84
Chapter 4
68
Figure 4-22: SIP First scenario, large differences, upper-sided CUSUM, Online implementation
Figure 4-23: SIP First scenario, large differences, basic and upper sided CUSUM, Online
implementation
0
1
2
3
4
5
6
0 5 10 15 20 25 30 35 40 45 50 55 60 65 70 75 80 85 90 95 100 105 110
CU
SU
M
Time units
-1
0
1
2
3
4
5
6
0 5 10 15 20 25 30 35 40 45 50 55 60 65 70 75 80 85 90 95 100 105 110
CU
SU
M, li
mit
s, f
lags
Time units
updated upper sided CUSUM updated basic CUSUM
Page 85
Chapter 4
69
Figure 4-24: SIP First scenario, large differences, upper sided CUSUM with alert and alarm limits,
Online implementation
Figure 4-25: SIP First scenario, large differences, zoom at the attack, t = [ 95 , 110 ] , Online
implementation
0
1
2
3
4
5
6
0 5 10 15 20 25 30 35 40 45 50 55 60 65 70 75 80 85 90 95 100 105 110
CU
SU
M, li
mit
s, f
lags
Time units
updated upper sided CUSUM
θ
suspect
Θ
alarm
0
0.5
1
1.5
2
2.5
3
3.5
4
4.5
95 96 97 98 99 100 101 102 103 104 105 106 107 108 109 110
CU
SU
M, li
mit
s, f
lags
Time units
updated upper sided
CUSUMθ
suspect
Θ
alarm
Page 86
Chapter 4
70
4.3.1.2 CUSUM on Second Scenario: Small Differences
4.3.1.2.1 Offline implementation
The second scenario of having a DoS attack, where the differences between the requests
and the responses is small, and barely noticed when plotted on a chart, Figure 4-26 shows
the results after applying the simple and basic CUSUM in equation (3.3), with the Offline
implementation; it is clearly shown how it would be hard to identify the attacking starting
point when represented by the chart. Figure 4-27 illustrates how for all the time the traffic
was running within the normal way, but on the time when the attack starts ( t = 100 ), the
small difference in the ratio between the requests and the responses appears well in the
chart after applying equation (3.4) to get the upper-sided CUSUM.
Figure 4-26: SIP second scenario, slight differences, basic CUSUM, Offline implementation
-4
-3.5
-3
-2.5
-2
-1.5
-1
-0.5
0
0 5 10 15 20 25 30 35 40 45 50 55 60 65 70 75 80 85 90 95 100 105 110
CU
SU
M,
Time units
Page 87
Chapter 4
71
Figure 4-27: SIP second scenario, slight differences, upper sided CUSUM, Offline implementation
Figure 4-28: SIP second scenario, slight differences, basic and upper sided CUSUM, Offline
implementation
0
0.05
0.1
0.15
0.2
0.25
0.3
0.35
0.4
0 5 10 15 20 25 30 35 40 45 50 55 60 65 70 75 80 85 90 95 100 105 110
CU
SU
M,
Time units
-4
-3.5
-3
-2.5
-2
-1.5
-1
-0.5
0
0.5
1
0 5 10 15 20 25 30 35 40 45 50 55 60 65 70 75 80 85 90 95 100 105 110
CU
SU
M,
Time units
upper sided CUSUM basic CUSUM
Page 88
Chapter 4
72
Figure 4-29 shows the plot of the CUSUM with the limits to determine the thresholds to
a flood attack. Figure 4-30 is a zoom at the period 95 to 110, ( t = [ 95 , 110 ] ), for a better
and clearer representation of the attack starting point, suspicion flags, and alarm triggering
points, and how the suspect attack is raised before an alarm is triggered.
Figure 4-29 SIP second scenario, slight differences, offline upper-sided CUSUM with alert and
alarm limits, Offline implementation
Figure 4-30: SIP second scenario, slight differences, zoom at the attack period, Offline
implementation
0
0.2
0.4
0.6
0.8
1
1.2
0 5 10 15 20 25 30 35 40 45 50 55 60 65 70 75 80 85 90 95 100 105 110
CU
SU
M, li
mit
s, f
lags
Time units
upper sided CUSUM θ suspect Θ alarm
0
0.2
0.4
0.6
0.8
1
1.2
95 96 97 98 99 100 101 102 103 104 105 106 107 108 109 110
CU
SU
M, li
mit
s, f
lags
Time units
upper sided CUSUM θ suspect Θ alarm
Page 89
Chapter 4
73
Figure 4-31: SIP second scenario, slight differences, zoom at the slight increase, Offline
implementation
Figure 4-31 is a zoom at the period 26 to 31 ( t = [26 , 31 ] ), a slight increase in the ratio
between the requests and the acknowledged responses, it does cross the alert threshold,
the black dashed line ( θ ), but it does not cross the alarm threshold, the red dashed line (
Θ ). In this scenario, the slight increase was set to represent a slow flooding DoS attack.
One of two outcomes will be expected: either it is detected and the DoS detection alarm
will be triggered, and result in a false alarm, or it will be missed and the slow attack will
not be detected; so in this scenario, the alert will be raised to monitor the traffic behaviour
for any either continuous slow attack, or an alert for a near future DoS attack, unless the
ratio decreases, the alert will stay turned on, if it increases then the DoS attack alarm will
be triggered.
4.3.1.2.2 Online implementation
The previous method was the Offline method to test a system after finding the mean and
the standard deviation of a certain sequence of numbers, that is, to represent a system with
previous knowledge and experience of the ongoing traffic. This reduces the overhead
spent in finding the mean and the standard deviation every time a new observation is
added to the sequence, but what if a system is newly starting with no knowledge, or for
instance a system was reset after detecting a flooding in a current traffic, so the following
0
0.2
0.4
0.6
0.8
1
1.2
26 27 28 29 30 31
CU
SU
M, li
mit
s, f
lags
Time units
upper sided CUSUM θ suspect Θ alarm
Page 90
Chapter 4
74
is the other method, the Online method, of getting a new observation and updating the
CUSUM after updating the mean and the standard deviation. Figure 4-32 shows the plot
of the basic CUSUM from equation (3.3), or the upper-sided CUSUM equation (3.4) as
in Figure 4-33. The chart in Figure 4-34 plots both ways combined.
Figure 4-32: SIP second scenario, slight differences, basic CUSUM, Online implementation
Figure 4-33: SIP second scenario, slight differences, upper-sided CUSUM, Online implementation
-0.1
0
0.1
0.2
0.3
0.4
0.5
0 5 10 15 20 25 30 35 40 45 50 55 60 65 70 75 80 85 90 95 100 105 110
CU
SU
M, li
mit
s, f
lags
Time units
0
0.05
0.1
0.15
0.2
0.25
0.3
0.35
0.4
0.45
0.5
0 5 10 15 20 25 30 35 40 45 50 55 60 65 70 75 80 85 90 95 100 105 110
CU
SU
M, li
mit
s, f
lags
Time units
Page 91
Chapter 4
75
Figure 4-34: SIP second scenario, slight differences, basic and upper-sided CUSUM, Online
implementation
Figure 4-35 shows the Online implementation of the upper-sided CUSUM with the
suspicion alert ( θ ) and the triggering alarm threshold ( Θ ). Figure 4-36 is a zoom at the
period 95 to 110 ( t = [ 95 , 110 ] ), for a better and clearer representation of the attack
starting point, suspicion flags, and alarm triggering points, and how the suspect attack is
raised at time 100 before an alarm is triggered later within the simulation time, the blue
CUSUM plot first crosses the black dashed line, the suspicion alert, then it crosses the red
dashed line to trigger the attack alarm, so there are empty black points equal to one being
printed while there are solid red points still shown as zero, then the alarm for the DoS
attack is triggered to print the red solids as one later on during the attack.
-0.1
0
0.1
0.2
0.3
0.4
0.5
0 5 10 15 20 25 30 35 40 45 50 55 60 65 70 75 80 85 90 95 100 105 110
CU
SU
M, li
mit
s, f
lags
Time units
updated upper sided CUSUM updated basic CUSUM
Page 92
Chapter 4
76
Figure 4-35: SIP second scenario, slight differences, upper-sided CUSUM with alert and alarm
limits, Online implementation
Figure 4-36: SIP second scenario, slight differences, Zoom at the attack period, Online
implementation
0
0.2
0.4
0.6
0.8
1
1.2
0 5 10 15 20 25 30 35 40 45 50 55 60 65 70 75 80 85 90 95 100 105 110
CU
SU
M, li
mit
s, f
lags
Time units
updated upper sided CUSUM θ suspect Θ alarm
0
0.2
0.4
0.6
0.8
1
1.2
95 96 97 98 99 100 101 102 103 104 105 106 107 108 109 110
CU
SU
M, li
mit
s, f
lags
Time units
updated upper
sided CUSUM
θ
suspect
Θ
alarm
Page 93
Chapter 4
77
Figure 4-37: SIP second scenario, slight differences, zoom at the slight increase period, Online
implementation
4.3.2 CUSUM on Imported Traffic’s Data Set
4.3.2.1 Offline implementation
The traffic imported from [45], or from the extended version [46], was shown in Figure
4-15 in section (4.2). Figure 4-38 shows the basic CUSUM results, after applying equation
(3.3), with the Offline method of pre-found mean ( µ ) and standard deviation ( σ ), it is
clearly shown how it would be hard to identify the attack starting point when represented
by the chart. After applying equation (3.4), the attack starting point appears well in Figure
4-39 to get the Offline upper sided CUSUM. Figure 4-40 shows the results of both
equation (3.3) and (3.4).
Figure 4-38: SIP imported traffic, basic CUSUM, Offline implementation
0
0.2
0.4
0.6
0.8
1
1.2
26 27 28 29 30
CU
SU
M, li
mit
s, f
lags
Time units
updated upper sided
CUSUM
θ
suspect
Θ
alarm
-60
-50
-40
-30
-20
-10
0
0 7 16
26
35
41
51
58
64
72
87
97
10
8
11
9
13
0
14
0
15
1
16
1
17
1
17
9
18
9
19
6
20
3
21
2
22
3
23
4
24
2
24
9
25
6
26
4
27
3
28
5
29
6
Axis
Tit
le
Time units
Page 94
Chapter 4
78
Figure 4-39: SIP imported traffic, upper sided CUSUM, Offline implementation
Figure 4-40: SIP imported traffic, Offline basic and upper-sided CUSUM, Offline implementation
The graph in Figure 4-41 shows the Offline upper-sided CUSUM with the suspicion alert
and the triggering alarm thresholds. The attack started around the 100th second and ended
around 160th; the blue CUSUM plot first crosses the black dashed line, the suspicion alert
( θ ), then it crosses the red dashed line ( Θ ), to trigger the attack alarm, so there are empty
black points equal to one being printed while there are solid red points still shown as zero,
then the alarm for the DoS attack is triggered to print the red solids as one, later on during
the attack.
0
1
2
3
4
5
6
7
8
9
0 7
16
26
35
41
51
58
64
72
87
97
10
8
11
9
13
0
14
0
15
1
16
1
17
1
17
9
18
9
19
6
20
3
21
2
22
3
23
4
24
2
24
9
25
6
26
4
27
3
28
5
29
6
up
per
CU
SU
M
Time units
-60
-50
-40
-30
-20
-10
0
10
20
0 7 16
26
35
41
51
58
64
72
87
97
10
8
11
9
13
0
14
0
15
1
16
1
17
1
17
9
18
9
19
6
20
3
21
2
22
3
23
4
24
2
24
9
25
6
26
4
27
3
28
5
29
6
CU
SU
M
Time units
upper sided CUSUM basic CUSUM
Page 95
Chapter 4
79
Figure 4-41: SIP imported traffic, upper-sided CUSUM with the alert and alarm levels, Offline
implementation
Figure 4-42: SIP imported traffic, zoom at the reset Offline upper-sided CUSUM and the levels,
Offline implementation
4.3.2.2 Online implementation
Figure 4-43 shows the Online basic CUSUM results, after applying equation (3.3). After
applying equation (3.4), the attack starting point appears well in Figure 4-44 to get the
Online upper-sided CUSUM with the method of updated mean ( µ ) and standard
deviation ( σ ). Figure 4-45 shows the results of both equation (3.3) and (3.4) combined.
0
1
2
3
4
5
6
7
8
9
0 7
16
26
35
41
51
58
64
72
87
97
10
8
11
9
13
0
14
0
15
1
16
1
17
1
17
9
18
9
19
6
20
3
21
2
22
3
23
4
24
2
24
9
25
6
26
4
27
3
28
5
29
6
CU
SU
M, li
mit
s, f
lags
Time units
upper sided CUSUM
Θ
alarm
θ
suspect
0
1
2
3
4
5
6
7
8
9
99 110 120 133 142 152 163 173 180 191 197
CU
SU
M, li
mit
s, f
lags
Time units
upper sided CUSUM θ suspect Θ alarm
Page 96
Chapter 4
80
Figure 4-43: SIP imported traffic, updated basic CUSUM, Online implementation
Figure 4-44: SIP imported traffic, updated upper-sided CUSUM, Online implementation
-40
-35
-30
-25
-20
-15
-10
-5
0
5
10
1 9
17
27
36
42
52
60
65
74
88
99
11
0
12
0
13
3
14
2
15
2
16
3
17
3
18
0
19
1
19
7
20
5
21
4
22
4
23
5
24
3
25
0
25
8
26
6
27
6
28
8
29
7
CU
SU
M, li
mit
s, f
lags
Time units
0
1
2
3
4
5
6
7
8
1 9
17
27
36
42
52
60
65
74
88
99
11
0
12
0
13
3
14
2
15
2
16
3
17
3
18
0
19
1
19
7
20
5
21
4
22
4
23
5
24
3
25
0
25
8
26
6
27
6
28
8
29
7
CU
SU
M, li
mit
s, f
lags
Time units
Page 97
Chapter 4
81
Figure 4-45: SIP imported traffic, updated basic upper-sided CUSUM, Online implementation
Figure 4-46: SIP imported traffic, updated upper sided CUSUM with suspicion and alarm limits,
Online implementation
The plotted graphs in Figure 4-46 shows the Online upper-sided CUSUM with the
suspicion alert and the triggering alarm thresholds. The chart in Figure 4-47 is a zoom at
the period 95 to 184 ( t = [ 95 , 184 ] ), for a better and clearer representation of the attack
starting point, suspicion flags, and alarm triggering points, and how the suspect attack is
raised before an alarm is triggered.
Figure 4-48 is a zoom at the period 64 to 84 ( t = [ 64 , 84 ] ), a slight increase in the ratio
between the requests and the acknowledged responses, it touches the alert threshold, the
-40
-35
-30
-25
-20
-15
-10
-5
0
5
10
1 9
17
27
36
42
52
60
65
74
88
99
11
0
12
0
13
3
14
2
15
2
16
3
17
3
18
0
19
1
19
7
20
5
21
4
22
4
23
5
24
3
25
0
25
8
26
6
27
6
28
8
29
7
CU
SU
M, li
mit
s, f
lags
Time units
UPDATED upper sided CUSUM updated basic CUSUM
0
1
2
3
4
5
6
7
8
0 7
16
26
35
41
51
58
64
72
87
97
10
8
11
9
13
0
14
0
15
1
16
1
17
1
17
9
18
9
19
6
20
3
21
2
22
3
23
4
24
2
24
9
25
6
26
4
27
3
28
5
29
6
CU
SU
M, li
mit
s, f
lags
Time units
UPDATED upper sided CUSUM θ suspect Θ alarm
Page 98
Chapter 4
82
black dashed line (θ); in this scenario, the slight increase was set to represent a slow
flooding DoS attack. One of two outcomes will be expected: either it is detected and the
DoS detection alarm will be triggered, and result in a false alarm, or it will be missed and
the slow attack will not be detected; so in this scenario, the alert will be raised to monitor
the traffic behaviour for any either continuous slow attack, or an alert for a near future
DoS attack, unless the ratio decreases, the alert will stay turned on, if it increases then the
DoS attack alarm will be triggered.
Figure 4-47: SIP imported traffic, zoom at the attack period, Online implementation
Figure 4-48: SIP imported traffic, zoom at the slight increase, Online implementation
0
1
2
3
4
5
6
7
8
95 104 111 120 130 138 147 154 163 171 177 184
CU
SU
M, li
mit
s, f
lags
Time units
UPDATED upper sided CUSUM θ suspect Θ alarm
0
0.2
0.4
0.6
0.8
1
1.2
64 65 67 68 70 72 74 78 81 84
CU
SU
M, li
mit
s, f
lags
Time units
UPDATED upper
sided CUSUM
θ
suspect
Θ
alarm
Page 99
Chapter 4
83
Detecting DoS attacks on SIP using EWMA
There are two different methods of applying EWMA charts on the traffic to detect a DoS
attack. The first method, the Offline implementation, is applied when there is a set of
sequence numbers, which in this case represents the sequence of the requests/responses
traffic per time unit, with an already pre-known mean of the observations, and then the
EWMA technique is applied on both generated traffic with both two generated scenarios,
and the imported traffic. The second method, the Online implementation, shows a live
running system adding a new observation to the previously observed sequence set, then
the mean is found and updated, then the EWMA technique is applied.
4.4.1 EWMA on Simulation Generated Data Set
4.4.1.1 EWMA on First Scenario: Large Differences
4.4.1.1.1 Offline implementation
Figure 4-49 shows the graph results after applying the EWMA equation (3.10) on the first
simulated DoS attack scenario, with the Offline implementation. Figure 4-50 illustrates
how for all the time the traffic was running within the normal way, but on the time the
attack starts, the steep ratio between the requests and the responses appears well in the
chart in the EWMA plot, the blue consistent, with the limits to determine the thresholds
to detect flood attacks.
Figure 4-49: SIP imported traffic, large differences, basic EWMA, Offline implementation
0
0.1
0.2
0.3
0.4
0.5
0.6
0 5 10 15 20 25 30 35 40 45 50 55 60 65 70 75 80 85 90 95 100 105 110
EW
MA
Time units
Page 100
Chapter 4
84
The first limit is the suspect level of a DoS attack ( θ ), the black dashed line, with the
width of the control limit parameter L equal to 2, ( L = 2 ), and the suspect alert for an
increase in the ratio, the empty black rounded points are the Boolean flags, either zero or
one, and the alarm triggering level ( Θ ), the red dashed line, using the equation (3.12)
with the width of the control limit parameter L equal to 3 ( L = 3 ), to declare an attack is
targeting the victim, the solid red points are the Boolean flags, either zero or one.
Figure 4-50: SIP imported traffic, large differences, EWMA with alert and alarm limits, Offline
implementation
Figure 4-51: SIP imported traffic, large differences, zoom at the attack period t = [ 95 , 110 ] ,
Offline implementation
-0.2
0
0.2
0.4
0.6
0.8
1
1.2
0 5 10 15 20 25 30 35 40 45 50 55 60 65 70 75 80 85 90 95 100 105 110
EW
MA
, li
mit
s, f
lags
Time units
EWMA θ alert Θ alarm
0
0.2
0.4
0.6
0.8
1
1.2
95 96 97 98 99 100 101 102 103 104 105 106 107 108 109 110
EW
MA
, li
mit
s, f
lags
Time Units
EWMA
θ
alert
Θ
alarm
Page 101
Chapter 4
85
The chart in Figure 4-51 is a zoom at the period 95 to 110 ( t = [ 95 , 110 ] ), for a better
and clearer representation of the attack starting point, suspicion flags, and alarm triggering
points, and how the suspect attack is raised before an alarm is triggered. The attack was
set in the simulation to start at the time point 100 ( t = 100 ), the blue EWMA plot first
crosses the black dashed line, the suspicion alert, then it crosses the red dashed line to
trigger the DoS attack alarm to print the red solids as one later on during the attack.
4.4.1.1.2 Online implementation
Figure 4-52 shows the graph results after applying the EWMA equation (3.10) on the first
simulated DoS attack scenario, with the Online implementation getting a new observation
and updating the mean and the standard deviation.
The plotted graphs in Figure 4-53 show the Online implementation of EWMA, with the
suspicion alert and the triggering alarm thresholds. The chart in Figure 4-54 is a zoom at
the period 95 to 109 ( t = [ 95 , 109 ] ), for a better and clearer representation of the attack
starting point, the EWMA plot in blue consistent line crosses the black dashed line, the
suspicion alert, and then it crosses the red dashed line, so the empty black ring and the
solid red points are printed as attention and alarm flags.
Figure 4-52: SIP imported traffic, large differences, updated EWMA, Online implementation
0
0.1
0.2
0.3
0.4
0.5
0.6
0 5 10 15 20 25 30 35 40 45 50 55 60 65 70 75 80 85 90 95 100 105 110
EW
MA
Time units
Page 102
Chapter 4
86
Figure 4-53: SIP imported traffic, large differences, updated EWMA with alert and alarm limits,
Online implementation
Figure 4-54: SIP imported traffic, large differences, zoom at the attack period ( t = [ 95 , 109 ] ) ,
Online implementation
4.4.1.2 EWMA on Second Scenario: Small Differences
4.4.1.2.1 Offline implementation
Figure 4-55 shows the results of the second scenario of having a DoS attack, after applying
the simple EWMA in equation (3.10), with the Offline method. This is the scenario where
the differences between the requests and the responses is small, are barely noticed when
plotted on a chart, compared to the first scenario.
0
0.2
0.4
0.6
0.8
1
1.2
0 5 10 15 20 25 30 35 40 45 50 55 60 65 70 75 80 85 90 95 100 105 110
EW
MA
, li
mit
s, f
lags
Time units
updated EWMA θ alert Θ alarm
0
0.2
0.4
0.6
0.8
1
1.2
95 97 99 101 103 105 107 109
EW
MA
, li
mit
s, f
lags
Time units
updated EWMA θ alert Θ alarm
Page 103
Chapter 4
87
Figure 4-56 shows the plot of the EWMA with the limits to determine the thresholds of a
flood attack, the suspect level and the alarm triggering level using the equation (3.12).
The chart in Figure 4-57 is a zoom at the period 95 to 109 ( t = [ 95 , 109 ] ). Figure 4-58
is a zoom at the period 26 to 29 ( t = [26 , 29 ] ), a slight increase in the ratio between the
requests and the acknowledged responses, it touches the alert threshold, the black dashed
line ( θ ), in this scenario, the slight increase was set to represent a slow flooding DoS
attack. The alert will be raised to monitor the traffic behaviour for either a continuous
slow attack, or an alert for a near future DoS attack; unless the ratio decreases, the alert
will stay turned on, if it increases then the DoS attack alarm will be triggered.
Figure 4-55: SIP second scenario, slight differences, Basic EWMA, Offline implementation
Figure 4-56: SIP second scenario, slight differences, EWMA, alert alarm, Offline implementation
0
0.05
0.1
0.15
0.2
0.25
0.3
0 5 10 15 20 25 30 35 40 45 50 55 60 65 70 75 80 85 90 95 100 105 110
EW
MA
Time units
0
0.2
0.4
0.6
0.8
1
1.2
0 5 10 15 20 25 30 35 40 45 50 55 60 65 70 75 80 85 90 95 100 105 110
EW
MA
, li
mit
s, f
lags
Time units
EWMA θ alert Θ alarm
Page 104
Chapter 4
88
Figure 4-57: SIP second scenario, slight differences zoom at the attack period t = [ 95 , 110 ] ,
Offline implementation
Figure 4-58: SIP second scenario, slight differences, zoom at the slight increase, Offline
implementation
4.4.1.2.2 Online implementation
Figure 4-59 shows the basic EWMA after applying equation (3.10), on the second
scenario traffic. Figure 4-60 shows the updated upper-sided EWMA with the suspicion
alert and the triggering alarm thresholds. The plotted graphs in Figure 4-61 is a zoom at
the period 95 to 110 ( t = [ 95 , 110 ] ), for a better and clearer representation of the attack
0
0.2
0.4
0.6
0.8
1
1.2
95 96 97 98 99 100 101 102 103 104 105 106 107 108 109 110
EW
MA
, li
mit
s, f
lags
Time units
EWMA θ alert Θ alarm
0
0.2
0.4
0.6
0.8
1
1.2
26 27 28 29
EW
MA
, li
mit
s, f
lags
Time units
EWMA
θ
alert
Θ
alarm
Page 105
Chapter 4
89
starting point, suspicion flags, and alarm triggering points, and how the suspect attack was
raised at the time an alarm was triggered.
Figure 4-62 is a zoom at the period 26 to 29 ( t = [26 , 29 ] ), a slight increase in the ratio
between the requests and the acknowledged responses, it touches the alert threshold, the
black dashed line ( θ ), in this scenario, the slight increase was set to represent a slow
flooding DoS attack, one of two outcomes will be expected: either it is detected and the
DoS detection alarm will be triggered, and result in a false alarm, or it will be missed and
the slow attack will not be detected. So in this scenario, the alert will be raised to monitor
the traffic behaviour for either a continuous slow attack, or an alert for a near future DoS
attack, unless the ratio decreases, the alert will stay turned on, if it increases then the DoS
attack alarm will be triggered.
Figure 4-59: SIP second scenario, slight differences, updated EWMA, Online implementation
Figure 4-60: SIP second scenario, slight differences, updated EWMA with alert and alarm limits,
Online implementation
0
0.05
0.1
0.15
0.2
0.25
0.3
0 5 10 15 20 25 30 35 40 45 50 55 60 65 70 75 80 85 90 95 100 105 110
EW
MA
, li
mit
s, f
lags
Time units
0
0.2
0.4
0.6
0.8
1
1.2
0 5 10 15 20 25 30 35 40 45 50 55 60 65 70 75 80 85 90 95 100 105 110
EW
MA
, li
mit
s, f
lags
Time units
EWMA θ alert Θ alarm
Page 106
Chapter 4
90
Figure 4-61: SIP second scenario, slight differences, zoom at the attack period ( t = [ 95 , 110 ] ) ,
Online implementation
Figure 4-62: SIP second scenario, slight differences, zoom at the slight increase, Online
implementation
0
0.2
0.4
0.6
0.8
1
1.2
95 97 99 101 103 105 107 109
EW
MA
, li
mit
s, f
lags
Time units
EWMA θ alert Θ alarm
0
0.2
0.4
0.6
0.8
1
1.2
26 28 30
EW
MA
, li
mit
s, f
lags
Time units
EWMA
θ
alert
Θ
alarm
Page 107
Chapter 4
91
4.4.2 EWMA on SIP Imported Data Set
4.4.2.1 Offline implementation
Figure 4-63 shows the results of having a DoS attack, after applying the EWMA equation
(3.10), with pre-found statistics, the Offline implementation method. Figure 4-64
illustrates how for all the time the traffic was running within the normal way, but at the
time when the attack starts, the steep ratio between the requests and the responses appears
well in the chart, with the limits to determine the thresholds to a flood attack; these limits
are the suspect level of a DoS attack and the alarm triggering level to declare an attack is
targeting the victim.
The level of threshold is represented as upper theta ( Θ ), using the equation (3.12) with
the width of the control limit parameter L equal to 3 ( L = 3 ) as recommended by
Montgomery [19]. However, another threshold limit was set to sense any increase in the
EWMA due to an increase in the ratio; this is useful to alert the victim of a possible near
future attack, or to detect any slow rate DoS attack, without or just before triggering the
attack alarm, is represented as lower theta ( θ ), with the width of the control limit
parameter L equal to 2 ( L = 2 ).
The plotted graphs in Figure 4-64 shows the EWMA with the suspicion alert and the
triggering alarm thresholds, the blue consistent line is the EWMA values plot, the black
dashed line is the suspect alert for an increase in the ratio, the empty black rounded points
are the Boolean flags, either zero or one, to represent a suspected DoS attack at a certain
time, the red dashed line is the alarm threshold, and the solid red points are the Boolean
flags, either zero or one, to represent a flooding DoS.
The chart in Figure 4-65 is a zoom at the period 70 to 180 ( t = [ 70 , 180 ] ), for a better
and clearer representation of the attack starting point, suspicion flags, and alarm triggering
points, and how the suspect attack is raised before an alarm is triggered. The attack was
around the 100th second to 160th second of this interval ( t = [ 100 , 160 ] ), the blue
EWMA plot first crosses the black dashed line, the suspicion alert, then it crosses the red
dashed line to trigger the attack alarm, so there are empty black points equal to one being
printed while there are solid red points still shown as zero, then the alarm for the DoS
attack is triggered to print the red solids as one later on during the attack.
Page 108
Chapter 4
92
Figure 4-63: SIP Imported traffic, basic EWMA on imported traffic, Offline implementation
Figure 4-64: SIP Imported traffic, basic EWMA with alert and alarm limits, Offline
implementation
-0.8
-0.6
-0.4
-0.2
0
0.2
0.4
0.6
0.8
1
0 7 16 26 35 41 51 58 64 72 87 97 108 119 130 140 151 161 171 179 189 196 203 212EW
MA
Time units
-0.8
-0.6
-0.4
-0.2
0
0.2
0.4
0.6
0.8
1
1.2
0 7 16 26 35 41 51 58 64 72 87 97 108 119 130 140 151 161 171 179 189 196 203 212EW
MA
, li
mit
s, f
lags
Time units
BASIC EWMA θ alert Θ alarm
Page 109
Chapter 4
93
Figure 4-65: SIP Imported traffic, zoom at the attack t = [ 70 , 180 ] , Offline implementation
4.4.2.2 Online implementation
Figure 4-66 shows the results of having a DoS attack, after applying the EWMA equation,
with the Online implementation method from equation (3.10). The plotted graphs in
Figure 4-67 shows the Online implementation of EWMA with the suspicion alert and the
triggering alarm thresholds. The attack was around the 100th second to 160th second of
this interval ( t = [ 100 , 160 ] ), the blue EWMA plot first crosses the black dashed line,
the suspicion alert, then it crosses the red dashed line to trigger the attack alarm, so there
might be empty black points plotted as value equals one, while there are solid red points
still shown as zero, then the alarm for the DoS attack is triggered to print the red solids as
one later on during the attack. This method to watch any suspect time point before
declaring it as an attack time is useful to reduce the false alarm triggering, as it might be
just an increase of an incoming traffic that is affecting the request/response two-way
communications and causing some delay in that. The chart in Figure 4-68 is a zoom at the
period 70 to 180 ( t = [ 70 , 180 ] ), for a better and clearer representation of the attack
starting point, suspicion flags, and alarm triggering points, and how the suspect attack is
raised before an alarm is triggered.
-0.8
-0.6
-0.4
-0.2
0
0.2
0.4
0.6
0.8
1
1.2
70 84 95 106 117 128 138 149 159 169 177
EW
MA
, li
mit
s, f
lags
Time units
BASIC EWMA θ alert Θ alarm
Page 110
Chapter 4
94
Figure 4-66: SIP Imported traffic, updated EWMA on imported traffic, Online implementation
Figure 4-67: SIP imported traffic, updated EWMA with alert and alarm limits, Online
implementation
-0.8
-0.6
-0.4
-0.2
0
0.2
0.4
0.6
0.8
1
0 7 16 26 35 41 51 58 64 72 87 97 108 119 130 140 151 161 171 179 189 196 203 212
EW
MA
, li
mit
s, f
lags
Time units
-0.8
-0.6
-0.4
-0.2
0
0.2
0.4
0.6
0.8
1
1.2
0 7 16 26 35 41 51 58 64 72 87 97 108 119 130 140 151 161 171 179 189 196 203 212EW
MA
, li
mit
s, f
lags
Time units
updated EWMA θ alert Θ alarm
Page 111
Chapter 4
95
Figure 4-68: SIP Imported traffic, zoom at the attack t = [ 70 , 180 ] , Online implementation
Summary
This chapter has discussed the results of Denial of Service attacks against SIP. First an
OPNET simulation run had shown the powerful impact of flood attacks and how it can
affect and stop the service that is offered by the SIP entity which is a SIP server.
There were other scenarios of traffic running, some scenarios were about large differences
and ratios of the acknowledged and the non-acknowledged requests; another scenario
where there was a slight difference in the increase in the ratio. There was another scenario
where the traffic was real and imported from another piece of research.
Cumulative Summation (CUSUM) and Exponentially Weighted Moving Average
(EWMA) were the techniques used to detect the attack in all the traffic, both the generated
and the imported.
These techniques were used in two approaches: the Offline implementation works by
finding the statistical values of the whole observations, the mean and the standard
deviation, then applying the equations; the second approach, the Online implementation,
was by updating the mean and the standard deviation values then applying the equations.
-0.8
-0.6
-0.4
-0.2
0
0.2
0.4
0.6
0.8
1
1.2
70 84 95 106 117 128 138 149 159 169 177
EW
MA
, li
mit
s, f
lags
Time units
updated EWMA θ alert Θ alarm
Page 112
Chapter 4
96
The first approach represents a system with previous knowledge and experience of the
ongoing traffic; this reduces the overhead spent in finding the mean and the standard
deviation every time a new observation is added to the sequence. The second approach
represents a system which is newly starting with no knowledge, or a system which was
reset, for instance, after detecting flooding in current traffic.
It was observed that CUSUM is a more effective and powerful technique to detect larger
increases in the traffic, while EWMA was much more powerful in spotting slight changes,
or in other words, to detect slow rate attacks and to reduce the false alarms that might
happen. Figure 4-69 is an example to summarise and show how the CUSUM plot, in
dashed black, and its alarm threshold ( Θ - CUSUM), in red, goes higher than the EWMA
plot, in blue, and its alarm threshold ( Θ - EWMA ).
Figure 4-70 shows a zoom at the attack time t = [ 95 , 104 ]; it clearly shows how the blue
line starts going up earlier than the dashed black so an earlier attention is raised, indicating
an earlier attack detection.
Figure 4-69: Detection DoS on SIP, EWMA vs. CUSUM, attack start at t = 100, EWMA goes up
slightly before CUSUM
-0.5
0
0.5
1
1.5
2
2.5
3
3.5
4
4.5
0 5 10 15 20 25 30 35 40 45 50 55 60 65 70 75 80 85 90 95 100 105 110
EW
MA
, C
US
UM
, li
mit
s
Time units
EWMA Θ - EWMA CUSUM Θ - CUSUM
Page 113
Chapter 4
97
Figure 4-70 Zoom at the attack time t = [ 95 , 104 ], DoS on SIP, EWMA vs. CUSUM
0
0.2
0.4
0.6
0.8
1
1.2
1.4
95 96 97 98 99 100 101 102 103 104
CU
SU
M, E
WM
A,
AT
TA
CK
TR
SH
OL
DS
Time
EWMA Θ - EWMA CUSUM Θ - CUSUM
Page 114
Chapter 5
98
DoS Targeting SPDY / HTTP 2.0: Results
and Analysis
Traffic Generation
SPDY traffic flow was designed to reduce the load time of web pages, especially those
pages that have many resources or objects to be retrieved. SPDY works in a way a user
sends a single TCP stream per page, and a SPDY proxy server deals with the needed
resources by establishing the number of TCP connections according to the number of
objects the user needs. A very possible and easy flooding attack may happen when a user
sends several single TCP streams, each containing a massive number of resources to be
loaded and retrieved. If the number of the open TCP connections that are used in retrieving
the web objects is bigger than the limit a SPDY proxy server can handle, then the SPDY
proxy server will get busy in processing the connections, and dealing with the queued
waiting connections to be established and achieved.
Figure 5-1: SPDY Scenario network architecture
6
SPDY
Proxy
Page 115
Chapter 5
99
The simulation scenario was set to run for a one hour period of time, divided into 60 time
slots, each one minute long, starting at 13:00. There have been 10 users connected in a
FQDM domain (Fully Qualified Domain Name) to a SPDY proxy server, each user
normally sends a web page request consisting of single TCP stream to the proxy server,
each stream with several web objects to be retrieved. The scenario ran normally until the
minute 13:22; user number 6 was set to be the attacker, where this user sends on average
10 times more resources to be retrieved than a normal user would do. The sequential
observations were the total number of requests sent to the SPDY proxy server, which are
the results of the number of TCP streams times the number of resources per TCP stream.
Figure 5-1 shows the network structure for the scenario’s generated traffic
The input observations for the detection algorithm were the result of the multiplication of
the total number of TCP streams sent by one user, by the average of resources requested in
a TCP stream, to give the total number of resources requested from a user in a one minute
time slot. The generated set was classified into two different scenarios according to how
steep is the increase of the requests that is needed to be processed; the first scenario was set
to process a large increase, while the second scenario was set to process a slight increase.
Figure 5-2: First scenario, large increase, total number of resources requested by user 1 and user 6
per minute
0
50000
100000
150000
200000
250000
300000
350000
400000
450000
0 4 8 12 16 20 24 28 32 36 40 44 48 52 56 60
To
tal
no
. o
f req
uest
ed
reso
urces
Time (minutes)
U1 U6
Page 116
Chapter 5
100
Figure 5-3: Second scenario, slight increase, total number of resources requested by user 1 and user 6
per minute
Figure 5-2 shows the first scenario with the total number of resources requested by user 1
and user 6 per minute, and Figure 5-3 shows the second scenario with the total number of
resources requested by user 1 and user 6 per minute. User 1 was picked to show as an
example on a normal running user, while user 6 was set to be the attacker as mentioned
earlier.
Detecting DoS attacks on SPDY using CUSUM
5.2.1 CUSUM on SPDY First Scenario: Large increase
5.2.1.1 Offline implementation
Figure 5-4 shows the results of having a flood attack from user 6; the red dashed line is the
simple and basic CUSUM equation, with the offline implementation from equation (3.4),
it is clearly shown how it would be hard to identify the attacking starting point. The blue
consistent line is after applying a tabular form of CUSUM as in equation (3.4). The other
approach of plotting makes it easier and a more noticeable graph as mentioned in [19]; this
way plots the maximum result of either zero or the CUSUM value in order to obtain one
upper-sided CUSUM.
0
10000
20000
30000
40000
50000
60000
70000
80000
90000
0 4 8 12 16 20 24 28 32 36 40 44 48 52 56 60
To
tal
no
. o
f req
uest
ed
reso
urces
Time (minutes)
U6 U1
Page 117
Chapter 5
101
Figure 5-4: SPDY First scenario, large increase, user 6 basic and upper-sided CUSUM, offline
implementation
Figure 5-5: SPDY First scenario, large increase, user 6 upper sided CUSUM with alert and alarm
limits, offline implementation
The graph in Figure 5-5 illustrates how for all the time the traffic was running within the
normal way, but on the time when the attack starts, the steep increase in the number of the
sent requests from user 6, the chart shows the plot of the CUSUM with the limits to
determine the thresholds to a flood attack; these limits are the suspect level of a DoS attack,
at minute 22, and the alarm triggering level to declare an attack is targeting the victim. The
blue consistent line is the CUSUM values plot, the black dashed line is the suspect alert for
an increase in the ratio, the empty black rounded points are the Boolean flags, either zero
or one, to represent a suspected DoS attack at a certain time, the red dashed line is the alarm
-5000000
-4000000
-3000000
-2000000
-1000000
0
1000000
2000000
0 4 8 12 16 20 24 28 32 36 40 44 48 52 56 60CU
SU
M Time (minutes)
UPPER SIDED CUSUM U6 basic CUSUM U6
0
200000
400000
600000
800000
1000000
1200000
0 4 8 12 16 20 24 28 32 36 40 44 48 52 56 60
CU
SU
M,
lim
its,
fla
gs
Time (minutes)
UPPER SIDED CUSUM U6 2* σ (θ) U6
ALERT U6 5* σ (Θ) U6
ALARM U6
Page 118
Chapter 5
102
threshold, and the solid red points are the Boolean flags, either zero or one, to represent a
flooding DoS. The attack was set in the simulation to start at the time point 22 ( t = 22 ),
the blue CUSUM plot first crosses the black dashed line, the suspicion alert, then it crosses
the red dashed line to trigger the attack alarm, so there are empty black points equal to one
being printed while there are solid red points still shown as zero, then the alarm for the DoS
attack is triggered to print the red solids as one later on during the attack. This method to
watch any suspect time point before declaring it as an attack time is useful to reduce the
false alarm triggering, as it might be just an increase of incoming traffic.
The chart in Figure 5-6 is a zoom at the time period 20 to 29 minutes ( t = [ 20 , 29 ] ), for
a better and clearer representation of the attack starting point, suspicion flags, and alarm
triggering points, and how the suspect attack is raised before an alarm is triggered.
Figure 5-6: SPDY First scenario, large increase, zoom at the attack period, offline implementation
5.2.1.2 Online implementation
The previous implementation was to test a system after finding the mean and the standard
deviation of the whole sequence of the numbers; that method represents a system with
previous knowledge and experience of the ongoing traffic, this reduces the overhead spent
in finding the mean and the standard deviation, then using them every time a new
observation is added to the sequence, so in case a system is newly starting with no
knowledge, or a system was reset, for instance, after detecting flooding in current traffic.
So the following is the other method of getting a new observation and finding the updated
0
200000
400000
600000
800000
1000000
1200000
20 21 22 23 24 25 26 27 28 29
CU
SU
M, li
mit
s, f
lags
Time (minutes)
UPPER SIDED CUSUM U6 2* σ (θ) U6
ALERT U6 5* σ (Θ) U6
ALARM U6
Page 119
Chapter 5
103
CUSUM after updating the mean and the standard deviation. Figure 5-8 shows the plot after
the online implementation when applying the basic CUSUM in equation (3.3), and the
upper-sided CUSUM in equation (3.4). The red dashed line is the simple and basic CUSUM
equation, the blue consistent line. The figure plots both ways.
Figure 5-7: SPDY First scenario, large increase, basic and upper-sided CUSUM on the updated
method, online implementation
Figure 5-8: SPDY First scenario, large increase, user 6 updated upper-sided CUSUM with alert and
alarm limits, online implementation
-5000000
-4000000
-3000000
-2000000
-1000000
0
1000000
2000000
0 4 8 12 16 20 24 28 32 36 40 44 48 52 56 60CU
SU
M
Time (minutes)
UPPER SIDED CUSUM U6 basic CUSUM U6
0
200000
400000
600000
800000
1000000
1200000
0 4 8 12 16 20 24 28 32 36 40 44 48 52 56 60
CU
SU
M,
lim
its,
fla
gs
Time (minutes)
UPPER SIDED CUSUM U6 2* σ (θ) U6
ALERT U6 5* σ (Θ) U6
ALARM U6
Page 120
Chapter 5
104
Figure 5-9: SPDY First scenario, large increase, zoom at the attack period, online implementation
The plotted graphs in Figure 5-8 shows the online implementation of the upper-sided
CUSUM with the suspicion alert and the triggering alarm thresholds, the attack started at
the time point 22 ( t = 22 ). The chart in Figure 5-9 is a zoom at the time period 20 to 29
minutes ( t = [ 20 , 29 ] ), for a better and clearer representation of the attack starting point,
suspicion flags, and alarm triggering points, and how the suspect attack is raised before an
alarm is triggered; the blue CUSUM plot first crosses the black dashed line, the suspicion
alert, then it crosses the red dashed line to trigger the attack alarm, so there might be empty
black points plotted as value equals one, while there are solid red points still shown as zero,
then the alarm for the DoS attack is triggered to print the red solids as one later on during
the attack.
5.2.2 CUSUM on SPDY Second Scenario: Slight Increase
5.2.2.1 Offline implementation
Figure 5-10 shows the results of having a flood attack from user 6; the red dashed line is
the offline implementation of the simple and basic CUSUM equation (3.4), and it is clearly
shown how it would be hard to identify the attacking starting point. The blue consistent line
is after applying a tabular form of CUSUM as in equation (3.4).
The graph in Figure 5-11 illustrates how for all the time the traffic was running within the
normal way, but on the time when the attack starts, the steep increase in the number of the
sent requests from user 6, the chart shows the plot of the CUSUM with the limits to
0
200000
400000
600000
800000
1000000
1200000
20 21 22 23 24 25 26 27 28 29
CU
SU
M,
lim
its,
fla
gs
Time (minutes)
UPPER SIDED CUSUM U6 2* σ (θ) U6ALERT U6 5* σ (Θ) U6ALARM U6
Page 121
Chapter 5
105
determine the thresholds to a flood attack; these limits are the suspect level of a DoS attack,
at minute 22 ( t = 22 ), and the alarm triggering level to declare an attack is targeting the
victim. The blue consistent line is the CUSUM values plot, the black dashed line is the
suspect alert for an increase in the ratio, the empty black rounded points are the Boolean
flags, either zero or one, to represent a suspected DoS attack at a certain time, the red dashed
line is the alarm threshold, and the solid red points are the Boolean flags, either zero or one,
to represent a flooding DoS.
The chart in Figure 5-12 is a zoom at the time period 20 to 31 minutes ( t = [ 20 , 31 ] ), for
a better and clearer representation of the attack starting point, suspicion flags, and alarm
triggering points, and how the suspect attack is raised before an alarm is triggered. The blue
CUSUM plot first crosses the black dashed line, the suspicion alert, then it crosses the red
dashed line to trigger the attack alarm, so there are empty black points equal to one being
printed while there are solid red points still shown as zero, then the alarm for the DoS attack
is triggered to print the red solids as one later on during the attack.
Figure 5-10: SPDY Second scenario, slight increase, user 6 basic and upper-sided CUSUM, online
implementation
-1200000
-1000000
-800000
-600000
-400000
-200000
0
200000
0 4 8 12 16 20 24 28 32 36 40 44 48 52 56 60
CU
SU
M
Time (minutes)
basic CUSUM U6
UPPER SIDED
CUSUM U6
Page 122
Chapter 5
106
Figure 5-11: SPDY Second scenario, slight increase, user 6 upper-sided CUSUM with alert and alarm
limits, online implementation
Figure 5-12 : SPDY Second scenario, slight increase, a zoom at the attack period, online
implementation
5.2.2.2 Online implementation
Figure 5-13 shows the plot after applying the basic CUSUM in equation (3.3), and the
upper-sided CUSUM in equation (3.4) with the online implementation. The red dashed line
is the simple and basic CUSUM equation, the blue consistent line. The figure plots both
ways.
0
200000
400000
600000
800000
1000000
1200000
0 4 8 12 16 20 24 28 32 36 40 44 48 52 56 60
CU
SU
M,
lim
its,
fla
gs
Time (minutes)
UPPER SIDED CUSUM U6 2* σ (θ) U6
ALERT U6 5* σ (Θ) U6
ALARM U6
0
200000
400000
600000
800000
1000000
1200000
20 21 22 23 24 25 26 27 28 29 30 31
CU
SU
M,
lim
its,
fla
gs
Time (minutes)
UPPER SIDED CUSUM
U6
2* σ (θ) U6
ALERT U6
5* σ (Θ) U6
ALARM U6
Page 123
Chapter 5
107
The plotted graphs in Figure 5-14 show the updated upper-sided CUSUM with the
suspicion alert and the triggering alarm thresholds. The chart in Figure 5-15 is a zoom at
the time period 20 to 29 minutes ( t = [ 20 , 29 ] ), for a better and clearer representation of
the attack starting point as the attack was set in the simulation to start at the time point 22
( t = 22 ), suspicion flags, and alarm triggering points, and how the suspect attack is raised
before an alarm is triggered. The blue CUSUM plot first crosses the black dashed line, the
suspicion alert, then it crosses the red dashed line to trigger the attack alarm, so there might
be empty black points plotted as value equals one, while there are solid red points still
shown as zero, then the alarm for the DoS attack is triggered to print the red solids as one
later on during the attack.
Figure 5-13: SPDY Second scenario, slight increase, basic and upper-sided CUSUM on the updated
method, online implementation
-600000
-500000
-400000
-300000
-200000
-100000
0
100000
200000
0 4 8 12 16 20 24 28 32 36 40 44 48 52 56 60
CU
SU
M
Time (minutes)
basic CUSUM U6
UPPER SIDED
CUSUM U6
Page 124
Chapter 5
108
Figure 5-14: SPDY Second scenario, slight increase, user 6 updated upper-sided CUSUM with alert
and alarm limits, online implementation
Figure 5-15: SPDY Second scenario, online implementation, slight increase, zoom at the attack
period, online implementation
0
200000
400000
600000
800000
1000000
1200000
0 4 8 12 16 20 24 28 32 36 40 44 48 52 56 60
CU
SU
M, li
mit
s, f
lags
Time (minutes)
UPPER SIDED CUSUM
U6
2* σ (θ) U6
ALERT U6
5* σ (Θ) U6
ALARM U6
0
200000
400000
600000
800000
1000000
1200000
20 21 22 23 24 25 26 27 28 29
CU
SU
M,
lim
its,
fla
gs
Time (minutes)
UPPER SIDED CUSUM U6 2* σ (θ) U6
ALERT U6 5* σ (Θ) U6
ALARM U6
Page 125
Chapter 5
109
Detecting DoS attacks on SPDY using EWMA
5.3.1 EWMA on First Scenario: Large increase
5.3.1.1 Offline implementation
When EWMA charts are applied here on the previous data sets, the following results are
illustrated in the plotted graphs and discussed later on in this section.
Figure 5-16 shows the results of a DoS attack, after applying the EWMA equation, with a
pre-found mean method from equation (3.10). Figure 5-17 shows for all the time the traffic
was running normally, but at the time when the attack starts, the steep increase in the
number of the total requests and the responses appears well in the chart, with the limits to
determine the thresholds to a flood attack; these limits are the suspect level of a DoS attack
and the alarm triggering level to declare an attack is targeting the victim.
The level of threshold in this research is represented as upper theta ( Θ ), using the equation
(3.12) with the width of the control limit parameter L equal to 3 ( L = 3 ) as recommended
by Montgomery [19]. However, another threshold limit was set to sense any increase in the
EWMA due to an increase in the ratio; this is useful to alert the victim of possible near
future attack, or to detect any slow rate DoS attack, without or just before trigging the attack
alarm, which in this research is represented as lower theta ( θ ), with the width of the control
limit parameter L equal to 2, ( L = 2 ).
The chart in Figure 5-18 is a zoom at the period 20 to 28 ( t = [ 20 , 28 ] ), for a better and
clearer representation of the attack starting point, suspicion flags, and alarm triggering
points, and how the suspect attack is raised before an alarm is triggered. The attack was set
in the simulation to start at the time point 22 ( t = 22 ); the blue EWMA plot first crosses
the black dashed line, the suspicion alert, then it crosses the red dashed line to trigger the
attack alarm, so there are empty black points equal to one being printed while there are
solid red points still shown as zero, then the alarm for the DoS attack is triggered to print
the red solids as one later on during the attack.
Page 126
Chapter 5
110
Figure 5-16: SPDY first scenario, large increase, basic EWMA, offline implementation
Figure 5-17: SPDY first scenario, large increase, EWMA with alert and alarm limits, offline
implementation
Figure 5-18: SPDY first scenario, large increase, a zoom at the attack period, offline implementation
0
50000
100000
150000
200000
250000
300000
350000
400000
450000
0 2 4 6 8 10 12 14 16 18 20 22 24 26 28 30 32 34 36 38 40 42 44 46 48 50 52 54 56 58 60
EW
MA
Time (minutes)
0
100000
200000
300000
400000
500000
600000
0 2 4 6 8 10 12 14 16 18 20 22 24 26 28 30 32 34 36 38 40 42 44 46 48 50 52 54 56 58 60
EW
MA
, li
mit
s, f
lags
Time (minutes)
basic EWMA θ alert Θ alarm
0
100000
200000
300000
400000
500000
600000
20 22 24 26 28
EW
MA
, li
mit
s, f
lags
Time (minutes)
basic EWMA θ alert Θ alarm
Page 127
Chapter 5
111
5.3.1.2 Online implementation
Figure 5-19 shows an online implementation of EWMA equation (3.12). The plotted graphs
in Figure 5-20 show the updated EWMA with the suspicion alert and the triggering alarm
thresholds and the flags. The chart in Figure 5-21 is a zoom at the period 20 to 28 ( t = [ 20
, 28 ] ), around the attack starting time point 22 ( t = 22 ), the updated EWMA blue
consistent line crosses the black dashed line, the suspicion alert, then it crosses the red
dashed line to trigger the attack alarm.
Figure 5-19: SPDY first scenario, large increase, updated EWMA, online implementation
Figure 5-20: SPDY first scenario, large increase, updated EWMA with alert and alarm limits, online
implementation
0
50000
100000
150000
200000
250000
300000
350000
400000
450000
0 2 4 6 8 10 12 14 16 18 20 22 24 26 28 30 32 34 36 38 40 42 44 46 48 50 52 54 56 58 60
EW
MA
Time (minutes)
0
100000
200000
300000
400000
500000
600000
0 2 4 6 8 10 12 14 16 18 20 22 24 26 28 30 32 34 36 38 40 42 44 46 48 50 52 54 56 58 60
EW
MA
, li
mit
s, f
lags
Time (minutes)
updated EWMA θ alert Θ alarm
Page 128
Chapter 5
112
Figure 5-21: SPDY first scenario, large increase, zoom at the attack level, online implementation
5.3.2 EWMA on Second Scenario: Slight Increase
5.3.2.1 Offline implementation
Figure 5-22 shows the results of a DoS attack, after applying the EWMA equation with the
Offline implementation from equation (3.10).
Figure 5-22: SPDY Second scenario, slight increase, Basic EWMA, offline implementation
0
100000
200000
300000
400000
500000
600000
20 22 24 26 28
EW
MA
, li
mit
s, f
lags
Time (minutes)
updated EWMA θ alert Θ alarm
0
10000
20000
30000
40000
50000
60000
70000
80000
90000
0 4 8 12 16 20 24 28 32 36 40 44 48 52 56 60
EW
MA
Time (minutes)
U6
Page 129
Chapter 5
113
Figure 5-23: SPDY Second scenario, slight increase, EWMA with alert and alarm limits, offline
implementation
Figure 5-24: SPDY Second scenario, slight increase, zoom at the attack period
The plotted graphs in Figure 5-23 show EWMA with the suspicion alert and the triggering
alarm thresholds. The chart in Figure 5-24 is a zoom at the period 20 to 28 ( t = [ 20 , 28 ]
), for a better and clearer representation of the attack starting point, ( t = 22 ); the blue
EWMA plot first crosses the black dashed line, then it crosses the red dashed line to trigger
the attack alarm, so there are empty black points equal to one and the red solids are also
printed as one during attack.
5.3.2.2 Online implementation
Figure 5-25 shows the results of a DoS attack, after applying the EWMA equation with the
Offline implementation from equation (3.10).
0
100000
200000
300000
400000
500000
600000
0 4 8 12 16 20 24 28 32 36 40 44 48 52 56 60
EW
MA
, li
mit
s, f
lags
Time (minutes)
basic EWMA θ alert Θ alarm
0
100000
200000
300000
400000
500000
600000
20 21 22 23 24 25 26 27 28
EW
MA
, li
mit
s, f
lags
Time (minutes)
basic EWMA θ alert Θ alarm
Page 130
Chapter 5
114
The plotted graphs in Figure 5-26 show EWMA with the suspicion alert and the triggering
alarm thresholds as in equation (3.12). The chart in Figure 5-27 is a zoom at the period 20
to 28 ( t = [ 20 , 28 ] ), for a better and clearer representation of the attack starting point, ( t
= 22 ), the blue EWMA plot first crosses the black dashed line, then it crosses the red dashed
line to trigger the attack alarm, so there are empty black points equal to one and the red
solids are also printed as one during the attack.
Figure 5-25: SPDY Second scenario, slight increase, updated EWMA, online implementation
Figure 5-26: SPDY Second scenario, slight increase, updated EWMA with alert and alarm limits,
online implementation
0
10000
20000
30000
40000
50000
60000
70000
80000
90000
0 4 8 12 16 20 24 28 32 36 40 44 48 52 56 60
EW
MA
Time (minutes)
0
100000
200000
300000
400000
500000
600000
0 4 8 12 16 20 24 28 32 36 40 44 48 52 56 60
EW
MA
, li
mit
s, f
lags
Time (minutes)
updated EWMA θ alert Θ alarm
Page 131
Chapter 5
115
Figure 5-27: SPDY Second scenario, slight increase, a zoom at the attack level, online implementation
Summary
This chapter has discussed the results of Denial of Service attacks against the SPDY
protocol. There were some scenarios of traffic running, one scenario was about large
differences and the result of total requests sent by a user; another scenario was with a slight
increase and the result of total requests sent by a user.
CUSUM and EWMA were the techniques used to detect the attack in all the traffic, both
the generated and the imported. These techniques were used in two approaches. The first
by finding the statistical values of the whole observations, the mean and the standard
deviation, then applying the equations; the second approach was by updating the mean and
the standard deviation values then applying the equations. The first approach represents a
system with previous knowledge and experience of the ongoing traffic; this reduces the
overhead spent in finding the mean and the standard deviation every time a new observation
is added to the sequence The second approach represents a system which is newly starting
with no knowledge, or a system which was reset, for instance, after detecting flooding in
current traffic.
It was observed that CUSUM is a more powerful technique to detect larger increases in the
traffic, while EWMA was much more powerful in spotting slight changes, or in other
words, to detect slow rate attacks and to reduce the false alarms that might happen. Figure
0
100000
200000
300000
400000
500000
600000
20 21 22 23 24 25 26 27
EW
MA
, li
mit
s, f
lags
Time (minutes)
updated EWMA θ alert Θ alarm
Page 132
Chapter 5
116
5-28 is an example to summarise and show how the CUSUM plot, in dashed black, and its
alarm threshold ( Θ - CUSUM), in red, goes higher than the EWMA plot, in blue, and its
alarm threshold ( Θ - EWMA ), in green. Figure 5-29 is a zoom at the attack starting time;
it clearly shows how even the blue line starts going up earlier than the dashed black line,
so an earlier attention is raised.
Figure 5-28: Detection DoS on SPDY, EWMA vs. CUSUM attack start at t = 22, EWMA goes up
slightly before CUSUM
Figure 5-29: A zoom at the attack time t = [ 22 , 26 ], DoS on SPDY, EWMA vs. CUSUM
0
100000
200000
300000
400000
500000
600000
700000
800000
900000
1000000
0 4 8 12 16 20 24 28 32 36 40 44 48 52 56 60
CU
SU
M, E
WM
A,
AT
TA
CK
TR
SH
OL
DS
Time (minutes)
EWMA Θ - EWMA CUSUM Θ - CUSUM
0
100000
200000
300000
400000
500000
600000
700000
800000
900000
1000000
21 22 23 24 25 26
CU
SU
M, E
WM
A,
AT
TA
CK
TR
SH
OL
DS
Time (minutes)
EWMA Θ - EWMA CUSUM Θ - CUSUM
Page 133
Chapter 6
117
A DoS resilience Framework
This chapter provides architecture for techniques described in the previous chapters, and
how these techniques can be implemented in a useful system that can be used in real life.
Architecture of the DoS resilient frame work
This research has shown the serious impact of Flooding Denial of Service (DoS) attacks
against the application layer protocols: Session Initiation Protocol (SIP) and SPDY, the
new proposed draft for Hyper Text Transfer Protocol version 2.0 (HTTP 2.0). There are
many solutions and systems offered so far to this problem, but the majority of these systems
offer it partially, no complete or integrated system that attempts to cover all possible
flooding DoS attacks against these protocols.
The proposed system in Chapters 4 and 5 can be fulfilled within a security solution for the
current flooding DoS attacks. The specifications will be designed to protect against DoS
and Distributed DoS (DDoS), an integrated system which employs Statistical Processing
Control (SPC) techniques to tackle different possible flooding attacks.
Figure 6-1 illustrates a general design of the framework. The architecture consists mainly
of two protection parts:
1. Inbound traffic monitor: to detect an incoming flow of DoS attacks to protect any
prospective victim existing on an internal domain.
2. Outbound traffic monitor: to detect an incoming flow for Outgoing DoS attacks,
and to protect any prospective victim existing on external domains.
Page 134
Chapter 6
118
Server
Attacker
Source
Gateway
Victim
Outgoing
Protection
Incoming
Protectionmessages
messages
Figure 6-1: General design and component of the proposed framework
Framework’s First Part: Inbound Traffic Monitor
This part of the system will be deployed relatively closer to the computing system side,
either on the end system itself, or at the gateway of the victim’s subnet, or at the proxy of
a certain domain. It could be implemented as part of an Intrusion Detection System (IDS)
on a firewall. This part works by detecting and triggering an alarm of DoS attack, filtering
the incoming traffic and classifying it to normal and attacking, then responding to the attack
by dropping the attacking packets and blocking the attacking source(s). The specifications
are:
Page 135
Chapter 6
119
The detection of DoS attack will be based on SPC methodology to set a threshold for
a sudden increase in a certain time unit, or a slow rate in the incoming traffic, which
will trigger an alarm of flooding DoS attack.
SIP messages involve two-way communication method based on request and
response messages; that is, an acknowledged response should be there for each sent
request.
SPDY behaves the same as SIP, in addition to the concept of opening a single TCP
to retrieve all objects required.
Packets classification will be mainly based on the source address as a signature, in
the case of DDoS, the addresses that appear to be participating in the sudden increase
of the incoming packets. Other techniques, such as authentication protocol, cookies,
and Digital Signatures, can be utilised to prevent malicious systems from achieving
their goal in the attack.
As a final default response to the attack, and in case of failure of the classification.
Sacrificing by a complete block of the incoming attack, and resetting the system, as
this is the least harmful situation than having the victim under attack for long periods
of time.
Other issues are raised, like receiving spoofed attacking packets. Any policy against
spoofed addresses, like blocking, would lead to undesired outcomes.
Figure 6-2 shows the flowchart of this part; it shows how the flow is tested by the SPC
techniques, CUSUM and EWMA, if there is an attack then policies are applied and the
protection continues.
Page 136
Chapter 6
120
Figure 6-2: Inbound traffic monitor
Start
SPC
Threshold
Receive
Yes
Classify messages
No
Specify source
Apply policy
Success Yes
No
No
Yes
Reset System
Sudden
change
System
Deadlock
Page 137
Chapter 6
121
Framework’s Second Part: Outbound Traffic
Monitor
This part can be implemented at different locations, i.e. gateways, or routers that support
SIP and SPDY messages. The system monitors the outgoing traffic; if it detects any
indication of any attack sourcing one of the agents in the gateway’s network, or a router’s
sub-network, then it applies a set of policies in order to prevent the attack launched from
its network towards victims in other networks. An example of such prevention is called D-
WARD in [50]. The solution offered there is applied on the conventional network and the
internet, and it showed good results in some concepts of DoS attacks, but still has some
issues, and the defence can be overcome, as some attacks cannot be handled, for example,
the one-way traffic like it is in UDP communications. The specifications of this part will
be:
This part detects an attack by monitoring the outgoing traffic; if some abnormal
sending happens, especially from specific sources to specific destinations, this raises
a suspicion of a DoS attack. If a sudden increase of traffic was not acknowledged, or
if low partially acknowledged, this is an indication of a flooding DoS attack.
If that traffic was fully or highly partially acknowledged, the suspicion will still be
raised. Meanwhile the gateway of the attacking source sends a notification, i.e. a
cookie, to the suspected victim’s address containing an indication of an attack
targeting the victim, and the victim has to respond to the gateway’s notification
informing that everything is fine and with no indication of a flooding attack.
Suspicion will not be raised for long; it is either quickly removed, or leads to trigger
an alarm of attack as a default action.
In addition, this part monitors for any outgoing spoofed addresses packets as well, as
the spoofing issue in general concludes that there is an important security issue
happening in the domain or the subnet. In the cases of DoS and DDoS, spoofing helps
in creating zombies that involve the launching of effective flooding DoS [91] and
[134].
Page 138
Chapter 6
122
After an attack is detected, and triggers the alarm, a set of policies is applied in order
to prevent the attack from taking an effective role against other inter-networked
systems.
Main policies will include warning the sender, and then block it for a while, until it
ceases the attack.
Collaboration among the network through the routers among the network, or routers
could be designed just to recognise upper layer protocols’ packet headers. This
sounds not too practical, as SIP is a higher-layer protocol, but this implies the same
idea in the 3rd layer switches, these kind of switches help in Virtual Local Area
Networks (VLAN).
Collaboration is helpful in many cases, such as if the gateway of an attacker was unable to
detect the flooding attack, for some reasons like simply missing an attack, or even
incompatibility of the gateway to implement this part of the system.
Figure 6-3 shows the flow of this part, showing how the flow is examined if there is any
spoofing of an identity, it is then tested by the SPC techniques CUSUM and EWMA; if
there is an attack then policies are applied and the protection continues.
Page 139
Chapter 6
123
Figure 6-3: Outbound traffic monitor
SPC
Threshold
Yes
Classify messages
No
Specify source
Apply policy
Success Yes
No
No
Yes
Reset System
Start
Receive
No
Spoof Yes
Sudden
change
System
Deadlock
Page 140
Chapter 6
124
Framework’s Components Collaboration
An important feature of this system, for both parts, is the collaboration among the network
through the connecting devices in the Internet, i.e. routers and gateways. Collaboration
between the Inbound and the Outbound parts is helpful in many aspects; a simple scenario
where an Outbound part on a gateway that is closer to an attacking source was unable to
detect a flooding attack, this might be for several unexpected reasons such as simply
missing an attack, or even incompatibility of the gateway to implement this part of the
system. In the case of an attack being detected on an agent at the edge of a predefined area,
e.g. an edge router, both Inbound and Outbound methods are implemented, and can be
applied to protect the region from foreign attacks. But in this case the actual source can be
difficult to be spotted and stopped, just drop the attacking packets in case the source was
unknown.
In Figure 6-1, the Integrated DoS Protection is shown. It illustrates how and where both
parts are implemented. The location of the protection of each part system plays the main
role of getting the ultimate results. The Inbound protection system can be implemented
closer to the victim side. It can be as a firewall for the whole network or as an Intrusion
Detection System (IDS); this can be implemented as a security system on the SIP Proxy
Server and SPDY Proxy Server, or the agents and the clients themselves. The Outbound is
implemented in different strategic locations to the attacking source side, as an outbound
firewall, or on the gateway or the router, it monitors and detects any abnormal sending. The
collaboration happens between both parts by sending small size messages and notifications.
Collaboration is a private communication between the protecting parts on different
locations; such communications are achieved by the Internet protocols, allowing a higher
priority among the Internet. Due to the sensitivity of the exchanged information between
the protection parts, keeping the identities of the communicating agents is an important
thing, therefore confidentiality techniques are utilised; Public Key Infrastructure (PKI),
using its ITU-T standard format, the X.509 [135] and [88], is exploited by means of
Certificate Authority (CA) [59] in order to secure the respective identities of the
communicating parties.
Page 141
Chapter 6
125
The proposed draft, SPDY, for the new Hyper Text Transfer Protocol (HTTP 2.0) has been
investigated in this PhD research. The HTTP Secure (HTTPS) which is used to protect web
traffic from several security vulnerabilities, such as the man in the middle attacks, HTTPS
runs over the Transport Layer Security (TLS) and Secure Sockets Layer (SSL). HTTPS can
be utilised in the cooperation between the frameworks parts and notifications transactions,
especially if an attack was on the web application level.
A private and safe connection for the Session Initiation Protocol (SIP) is offered and it is
called Secure SIP (SIPs); it uses TLS for secure signalling. Instant Messaging (IM) [38] is
a service that is offered by the Session Initiation Protocol (SIP). IM offers a real-time text
transmission over the internet; an extension for SIP to support IM is called the Session
Initiation Protocol for Instant Messaging and Presence Leveraging Extensions (SIMPLE)
[51]. IM using SIP is a great service; this framework can be involved in the communication
between the collaborating parts, especially for its real-time and fast delivery messaging
feature, any of the protection parts can send an IM to another part in order to exchange
information for any DoS attack, even it was meanwhile at the suspicion level.
Summary
This chapter has discussed integrated design to protect SIP and from DoS and DDoS
flooding attacks. The Inbound and Outbound Protection parts work and collaborate together
in order to detect and protect from any possible way an attacker uses, as well as noting
spoofing is a serious problem in DDoS, but this system and its collaboration speciality can
work to prevent spoofing. Each part of the system used the sequential statistical Cumulative
Summation (CUSUM) and Exponentially Weighted Moving Average (EWMA) to monitor
the change of any traffic going through.
Page 142
Chapter 6
126
Conclusions and Future Work
Conclusions
This thesis has explored the research about detecting Denial of Service (DoS) attacks on
the Internet’s Application Layer protocols: Session Initiation Protocol (SIP), and SPDY,
the new proposed HTTP 2.0. The research deployed techniques of Statistical Process
Control (SPC) and Monitoring charts, Cumulative Summation (CUSUM) and Exponential
Weighted Moving Average (EWMA), to monitor the traffic behaviour. The techniques
work by sensing for a sudden increase in traffic, alerting for existence of a flood, then
detecting and triggering an alarm of DoS attacks.
There were other scenarios of SIP traffic running; some scenarios were about large
differences in the ratio of the acknowledged and the non-acknowledged requests, other
scenarios where there was a slight difference in the increase in the ratio, in addition there
was another scenario where the traffic is imported.
In the SPDY scenarios of traffic running, one scenario was about large increases and the
result of total requests sent by a user; another scenario was with slight increases in the result
of total requests sent by a user.
Both CUSUM and EWMA have shown the ability to detect sudden large increases, and
slow rate DoS attacks; this contributes also to avoid false alarms, as in Figure 4-60: SIP
second scenario, slight differences, updated EWMA with alert and alarm limits, Figure
4-61: SIP second scenario, slight differences, zoom at the attack period ( t = [ 95 , 110 ] ),
Figure 4-62: SIP second scenario, slight differences, zoom at the slight increase, Figure
5-23: SPDY Second scenario, slight increase, EWMA with alert and alarm limits, Figure
5-24: SPDY Second scenario, slight increase, zoom at the attack period, and Figure 5-27:
SPDY Second scenario, slight increase, a zoom at the attack level.
Page 143
Chapter 6
127
However it was observed that CUSUM is a more effective and powerful technique to detect
larger increases in the traffic, while EWMA was much more powerful in spotting slight
changes, or in other words, to detect slow rate attacks and to reduce the false alarms that
might happen, as shown in the summary, in Figure 4-69 and Figure 5-28.
SPC techniques were used in two approaches. The first approach by finding the statistical
values of the whole observations then applying the technique; the second approach was by
updating statistical values then applying the technique. Both techniques have proved their
efficiency by showing significant results as in: Figure 4-18, Figure 4-24, Figure 5-26.
The power of CUSUM and EWMA have encouraged this author to propose a DoS
resilience framework that offers a strong and complete architecture to protect commuting
and networking systems from flooding DoS attacks and their related security issues, such
as identity spoofing.
Future Work
This research allows for open opportunities to develop and research further into the related
fields. Some future work is listed below:
Build and design a consistent framework to a complete protection solution for the
DoS attacks issue and its related issues.
HTTP 2.0 is still under development and investigation, and has not been achieved
yet; the proposed draft is under review in an attempt to cover all possible security
vulnerabilities.
AJAX is a modern technology that is used extensively in the web’s daily life. In
accordance with the release of the new HTTP 2.0, new vulnerabilities will be
discovered that malicious users can easily use for their damaging behaviour,
especially DoS floods, as it is a very easy attacking strategy to cause the most damage
and vandalisation to the web and the internet’s resources.
Continue in the implementation of the proposed framework from a proposed
architecture to a real useful tool for connected systems protection.
Page 144
Bibliography
128
Bibliography
[1] A. A. Salam, M. Luglio, C. Roseti, F. Zampognaro, “ Resource optimization over
DVB-RCS satellite links through the use of SPDY. ” Modeling and Optimization in
Mobile, Ad Hoc, and Wireless Networks (WiOpt), 2014 12th International
Symposium on , pp. 63, 69, 12 - 16 May 2014.
[2] A. Chonka, and J. Abawajy, “ Detecting and Mitigating HX-DoS Attacks against
Cloud Web Services. ”, Network-Based Information Systems (NBiS), 2012 15th
International Conference on , pp. 429, 434, 26 - 28 Sept. 2012.
[3] A. Fadlallah, “ Adaptive probabilistic packet marking scheme for IP traceback” ,
Computer Applications and Information Systems (WCCAIS), 2014 World Congress
on , pp. 1, 5, 17 - 19 Jan. 2014.
[4] A. Ramaiah , R. Stewart, and M. Dalal, “ Request for Comments: 5961 Improving
TCP's Robustness to Blind In-Window Attacks ”, IETF Standards Track, August
2010.
[5] A. S. Tanenbaum, “Computer networks”, 5th ed, PRENTICE HALL, 2011.
[6] Aiqun Zhu, “ Research on web protocol in the implementation of e-commerce web
site security ”, Computer Science and Service System (CSSS), 2011 International
Conference on , pp. 1673, 1675, 27 - 29 June 2011.
[7] Akhil Behl, Kanika Behl, “ An Analysis of Security Implications in Session Initiation
Protocol (SIP) ”, 7th Asia Modelling Symposium, 2013.
[8] Alan B. Johnson, “ SIP: Understanding the Session Initiation Protocol ”. 2nd Edition,
Artech House, 2004.
[9] Angelos D. Keromytis, “ Voice over IP Security : A Comprehensive Survey of
Vulnerabilities and Academic Research ”,
[10] ATIS Open Web Alliance, “An Analysis of the SPDY Protocol and the SPDY
Proxy”, April 2014.
Page 145
Bibliography
129
[11] B. AsSadhan, Hyong Kim, J. M. F. Moura, Xiaohui Wang, “ Network traffic behavior
analysis by decomposition into control and data planes ” Parallel and Distributed
Processing, 2008. IPDPS 2008. IEEE International Symposium on , pp. 1, 8, 14 - 18
April 2008.
[12] Bao-Tung Wang; Schulzrinne, Henning, “An IP traceback mechanism for reflective
DoS attacks”, Electrical and Computer Engineering, 2004. Canadian Conference
on , vol. 2, no., pp. 901, 904, 2 - 5 May 2004.
[13] C. Caini, R. Firrincieli H. Cruickshank, and M. Marchese, “ Satellite
Communications: from PEPs to DTN ”, Advanced satellite multimedia systems
conference (ASMS). September 2010.
[14] C. L. Schuba, I. V. Krsul, M. G. Kuhn, E. H. Spafford, A. Sundaram, D. Zamboni,
“Analysis of a denial of service attack on TCP”, Security and Privacy, 1997.
Proceedings., 1997 IEEE Symposium on pp. 208, 223, 4 - 7 May 1997.
[15] C. Mueller, S. Lederer, C. Timmerer, H. Hellwagner, “ Dynamic Adaptive Streaming
over HTTP/2.0. ”, Multimedia and Expo (ICME), 2013 IEEE International
Conference on , pp. 1 , 6, 15 - 19 July 2013.
[16] C. Mueller, S. Lederer, J. Poecher, C. Timmerer, “ Demo paper: Libdash - An open
source software library for the MPEG-DASH standard. ”, Multimedia and Expo
Workshops (ICMEW), 2013 IEEE International Conference on , pp. 1, 2, 15 - 19 July
2013
[17] Chu-Hsing Lin; Jung-Chun Liu; and Ching-Ru Chen, “ Access Log Generator for
Analysing Malicious Website Browsing Behaviors. ”, Information Assurance and
Security, 2009. IAS '09. Fifth International Conference on , vol. 2, no., pp. 126, 129,
18 - 20 Aug. 2009.
[18] Cisco Systems, “ Cisco 10000 Series Router Software Configuration Guide. ”, Cisco
Systems, June, 2010.
[19] D. C. Montgomery, Arizona State University, “Introduction to Statistical Quality
Control”, 6th Edition, John Wiley & Sons, Inc. 2009.
[20] D. M. Shila, Yu Cheng, and Tricha Anjali, “ Mitigating selective forwarding attacks
with a channel-aware approach in WMNS” , Wireless Communications, IEEE
Transactions on , vol. 9, no. 5, pp. 1661, 1675, May 2010
Page 146
Bibliography
130
[21] D. Martynov, J. Roman, S. Vaidya, and Huirong Fu, “ Design and implementation of
an intrusion detection system for wireless sensor networks. ”, Electro/Information
Technology, 2007 IEEE International Conference on, pp. 507, 512, 17 - 20 May
2007.
[22] D. Turk, “ Request for Comments 3882: Configuring BGP to Block Denial-of-
Service Attacks. ”, IETF Informational, September 2004.
[23] Dafydd Stuttard, Marcus Pinto, “ The Web Application Hacker's Handbook: Finding
and Exploiting Security Flaws. ”, John Wiley & Sons; 2nd Edition, 5 Oct 2011.
[24] Do-Yoon Ha, Hwan-Kuk Kim, Kyoung-Hee Ko, Chang-Yong Lee, Jeong-Wook
Kim, Hyun-Cheol Jeong. “ Design and Implementation of SIP-aware DDoS Attack
Detection System. ”, the 2nd International Conference on Interaction Sciences:
Information Technology, Proceedings of, Pages 1167 - 1171, 2009.
[25] E. Anitha, S. Malliga, “ A packet marking approach to protect cloud environment
against DDoS attacks ”, Information Communication and Embedded Systems
(ICICES), 2013 International Conference on , pp. 367, 370, 21 - 22 Feb. 2013
[26] E. Walpole Ronald, H. Myers Raymond, and L. Myers Sharon. “Probability and
Statistics for Engineers and Scientists.” Prentice Hall College Div; 6 Sub edition
(December 31, 1997). ISBN-10: 0138402086.
[27] Eric Y. Chen. “ Detecting DoS Attacks on SIP Systems. ”, 1st IEEE Workshop on
VoIP Management and Security, 2006.
[28] ETSI's official TTCN-3 homepage; web: http://www.ttcn-3.org/
[29] G. A. Barnard. “ Control charts and stochastic processes. ”, Journal of the Royal
Statistical Society. Series B (Methodological), vol. 21, p 239 - 271, 1959.
[30] G. E. P., Box, G. M. Jenkins, and G. C. Reinsel, “Time Series Analysis, Forecasting,
and Control”, (1994). 3rd ed. Prentice-Hall, Englewood Cliffs, NJ.
[31] G. Mineki, S. Uemura, T. Hasegawa, “ SPDY accelerator for improving Web access
speed.”, Advanced Communication Technology (ICACT), 2013 15th International
Conference on , pp. 540, 544, 27 - 30 Jan. 2013.
[32] G. White, D. Rice, “ Analysis of SPDY and TCP Initcwnd ”, IETF internet draft,
July 6, 2012 .
Page 147
Bibliography
131
[33] Garry A. Einicke, “Smoothing, Filtering and Prediction - Estimating The Past,
Present and Future”, Publisher: InTech ( web: http://www.intechopen.com/ ),
February, 2012
[34] Ge Zhang, Sven Ehlert, Thomas Magedanz, Dorgham Sisalem. “ Denial of service
attack and prevention on SIP VoIP infrastructures using DNS flooding. ”, IPTComm:
Principles, Systems and Applications of IP Telecommunications, 2007.
[35] Georgios Kambourakis, Constantinos Kolias, Stefanos Gritzalis, and Jong Hyuk
Park, “ DoS attacks exploiting signaling in UMTS and IMS ”, Computer
Communications, Volume 34, Issue 3, Pages 226 - 235, March 2011.
[36] Greg White, Jean-François Mulé, and Dan Rice, “ ANALYSIS OF GOOGLE SPDY
AND TCP INITCWND ”, CableLabs. 2012
[37] H. Cruickshank, G. Giambene M. Berioli and R. Mort, “ BSM Integrated PEP with
Cross-Layer Improvements ”, IWSSC , September 2009.
[38] H. G. Perros, “ What's Behind Your Smartphone Icons? ”, Potentials, IEEE , vol. 33,
no. 3, pp. 38, 41, May - June 2014.
[39] H. R. Zeidanloo, A. Bt Manaf, P. Vahdani, F. Tabatabaei, and M. Zamani, “ Botnet
detection based on traffic monitoring” , Networking and Information Technology
(ICNIT), 2010 International Conference on , p. 97 - 101, 11 - 12 June 2010.
[40] H. Schulzrinne, S. Casner, R. Frederick, V. Jacobson, “ RFC 3550; RTP: A Transport
Protocol for Real-Time Applications. ”, IETF, July 2003.
[41] Hafiz Zafar Nazir, Muhammad Riaz, Ronald J. M. M. Does, and Nasir Abbas,
“Robust CUSUM Control Charting”, Taylor & Francis publishers, Quality
Engineering, Vol. 25, Iss. 3, 2013, p 211 - 224.
[42] Haining Wang, Danlu Zhang, and Kang G. Shin. “ Detecting SYN Flooding
Attacks. ” INFOCOM 2002, Twenty-First Annual Joint Conference of the IEEE
Computer and Communications Societies. June 2002.
[43] Haining Wang, Danlu Zhang, and Kang G. Shin. “ Change point monitoring for the
detection of DoS attacks. ”, IEEE Transactions on Dependable and Secure
Computing, Oct. - Dec. 2004.
Page 148
Bibliography
132
[44] Ho Yan Suen; Wing Cheong Lau; and OnChing Yue, “ Detecting Anomalous Web
Browsing via Diffusion Wavelets, ”, Communications (ICC), 2010 IEEE
International Conference on , pp. 1, 6, 23 - 27 May 2010
[45] Hun Jeong Kang, Zhi-Li Zhang, Supranamaya Ranjan, and Antonio Nucci, “SIP-
based VoIP Traffic Behavior Profiling and Its Applications ”, In Proceedings of the
3rd annual ACM workshop on Mining network data (MineNet '07). ACM, New York,
NY, USA, p 39 - 44. 12 - 16. June, 2007
[46] Hun Jeong Kang, Zhi-Li Zhang, Supranamaya Ranjan, and Antonio Nucci, “ SIP-
based VoIP Traffic Behavior Profiling and its Applications. ” , (An extended version
to [45] with an application to anomaly detection), Network Data Mining
(MineNet'07) In Proceeding of the 3rd Workshop on, in conjuction with ACM
SIGMETRICS'07, San Diego, CA, June 2007.
[47] I. Fosic, and D. Zagar, “ VPN network protection by IDS system implementation. ”,
MIPRO, 2011 Proceedings of the 34th International Convention , pp. 1480, 1484,
23 - 27 May 2011.
[48] I. Gashinsky, W. Kumari, and J. Jaeggli, “ Request for Comments: 6583 Operational
Neighbor Discovery Problems. ”, IETF Informational, March 2012.
[49] J. M. Lucas and M. S. Saccucci. “ Exponentially Weighted Moving Average Control
Schemes: Properties and Enhancements” Technometrics by: American Statistical
Association and American Society for Quality, Vol. 32, No. 1 (Feb., 1990), pp. 27-
29, Feb 1990.
[50] J. Mirkovic, P. Reiher, “D-WARD: a source-end defense against flooding denial-of-
service attacks” , Dependable and Secure Computing, IEEE Transactions on , vol. 2,
no. 3, pp. 216, 232, July - Sept. 2005.
[51] J. Rosenberg, “ Request for Comments 6914: SIMPLE Made Simple: An Overview
of the IETF Specifications for Instant Messaging and Presence Using the Session
Initiation Protocol (SIP) ”, IETF Informational, April 2013.
[52] J. Rosenberg, “RFC 5411P: A Hitchhiker’s Guide to the Session Initiation Protocol
(SIP)”, Cisco , January 2009.
Page 149
Bibliography
133
[53] J. Rosenberg, H. Schulzrinne, G. Camarillo, A. Johnston, J. Peterson, R. Spark,
M.Handley, and E. Schooler, “ RFC 3261: Session Initiation Protocol ”, IETF
Standards Track, Network Working Group, 2002.
[54] Jaeyeon Jung, Balachander Krishnamurthy, and Michael Rabinovich, “ Flash crowds
and Denial Of Service attacks: characterization and implications for CDNs and web
sites. In Proceedings of the 11th international conference on World Wide Web
(WWW '02). ACM, New York, NY, USA, 293 - 304. 2002.
[55] James F. Kurose, and Keith W. Ross, “ COMPUTER NETWORKING: A Top-Down
Approach.”, 6th ed. Pearson Education, 2013.
[56] James M. Lucas, and Michael S. Saccucci, “ CUSUM Charts with Variable Sampling
Intervals”: Discussion Technometrics by: American Statistical Association and
American Society for Quality, Vol. 32, No. 4 (Nov., 1990), pp. 387 - 388.
[57] Jelena Mirkovic, Sven Dietrich, David Dittrich, Peter Reiher, “ Internet Denial of
Service: Attack and Defense Mechanisms ”, 1 edition, Prentice Hall; Radia Perlman
Series in Computer Networking and Security, 2005.
[58] Kai Chen; Huiyu Liu; Xiaosu Chen, EBDT: A method for detecting LDoS attack ”
Information and Automation (ICIA), 2012 International Conference on, pp. 911, 916,
6 - 8 June 2012.
[59] Kirk Hall, “ Standards and Industry Regulations Applicable to Certification
Authorities ”, The CA Security Council (CASC), April 2013.
[60] L. Ning, Su Sen, Jing Maohua, and Han Jian, “ A router based packet filtering scheme
for defending against DoS attacks ”, Communications, China, vol. 11, no. 10, pp.
136, 146, Oct. 2014.
[61] L. Parrondo, “ Industrial cyber security solutions for the connected enterprise ”,
Cyber Security for Industrial Control Systems, IET Seminar on , pp. 1, 27, 5 - 6 Feb.
2014.
[62] Li Wenhai; Guo Wei; Luo Xiaolei, and Li Xiang; . “ On Sliding Window Based
Change Point Detection for Hybrid SIP DoS Attack. ”, IEEE Asia-Pacific Services
Computing Conference (APSCC), 2010.
Page 150
Bibliography
134
[63] M. Allman, V. Paxson, and E. Blanton, “ Request for Comments 5681:
TCP Congestion Control ”, IETF Standards Track, September 2009.
[64] M. Allman, V. Paxson, and W. Stevens, “ Request for Comments 2581: TCP
Congestion Control ” , IETF Standards Track, April 1999.
[65] M. Beaumont - Gay, “A Comparison of SYN Flood Detection Algorithms”, Internet
Monitoring and Protection, 2007. ICIMP 2007. Second International Conference on,
pp. 9, 9, 1 - 5 July 2007.
[66] M. E. Camargo, W. P. Filho, A. I. dos Santos Dullius, J. Maciel, and M. Pinto, “
Statistical quality control: A case study research. ”, Management of Innovation and
Technology, 2008. ICMIT 2008. 4th IEEE International Conference on, pp. 746, 750,
21 - 24, Sept. 2008.
[67] M. G. Solomon and M. Chapple, “Information Security Illuminated”, JONES AND
BARTLETT PUBLISHERS, 2005.
[68] M. Handley and E. Rescorla, “RFC4732: Internet Denial-of-Service Considerations”,
Internet Architecture Board (IAB). November 2006.
[69] M. Roesch, “ Snort – lightweight intrusion detection for networks. ”, 13th USENIX
LISA Conference, 1999.
[70] M. Smith, “ Further Mitigating Router ND Cache Exhaustion DoS Attacks Using
Solicited-Node Group Membership. ”, IETF Informational Internet-Draft , April
2014.
[71] M. Srivatsa, A. Iyengar, Jian Yin, and Ling Liu, “ A Client-Transparent Approach to
Defend Against Denial of Service Attacks. ”, Reliable Distributed Systems, 2006.
SRDS '06. 25th IEEE Symposium on , pp. 61, 70, 2 - 4 Oct. 2006.
[72] Mike Belshe, “ SPDY and What to Consider for HTTP / 2.0 ”, IETF proceedings
slides, 2013.
[73] Mike Belshe, “SPDY, TCP, and the Single Connection Throttle ”, IETF proceedings
slides, April 2011.
[74] Mohammed A. Saleh, and Azizah Abdul Manaf, “ Optimal specifications for a
protective framework against HTTP-based DoS and DDoS attacks ”, Biometrics and
Page 151
Bibliography
135
Security Technologies (ISBAST), 2014 International Symposium on, pp. 263, 267, 26
- 27 August 2014.
[75] Mohammed A. Saleh, and Azizah Abdul Manaf, “ Protective Frameworks and
Schemes to Detect and Prevent High Rate DoS/DDoS and Flash Crowd Attacks: A
Comprehensive Review ”, Advanced Machine Learning Technologies and
Applications Second International Conference, AMLTA 2014 Proceedings,
November 28 - 30, 2014.
[76] Mohan Krishna Ranganathan, Liam Kilmartin, “ Performance analysis of secure
session initiation protocol based VoIP networks ”, Computer Communications 26 p
552 – 565, 2003.
[77] Montgomery, D. C., L. A. Johnson, and J. S. Gardiner, “Forecasting and Time Series
Analysis” (1990). 2nd ed., McGraw-Hill, New York.
[78] N. Bhutta and H. Cruickshank, “ Redesigning Multilayer IPSec Protocol for
interworking with middle entities. ”, PSATS 2012, Bradford, UK, March 2012.
[79] N. Bhutta, H. Cruickshank, J. Ashworth, and M. Moseley, “ Redesigning of IPSec
for interworking with Satellite Performance Enhancing Proxies”. SatCom workshop,
ChinaCom Conference, Harbin China. August 2011.
[80] National Institute of Standards and Technology, “ NIST/SEMATECH e-Handbook
of Statistical Methods ”, web: http://www.nist.gov/ ,
http://www.itl.nist.gov/div898/handbook/index.htm .
[81] NS-3 Network Simulator, NS-3 Project, web: http://www.nsnam.org
[82] OMNeT++ Network Simulator, OMNeT++ Community, web:
http://www.omnetpp.org/
[83] OPNET Simulator, web: http://www.riverbed.com/, formerly:
http://www.OPNET.com.
[84] P. Ferguson, and D. Senie, “ Request for Comments 2827: Network Ingress Filtering:
Defeating Denial of Service Attacks which employ IP Source Address Spoofing. ”,
IETF Best Current Practice, May 2000.
[85] P. Sharma, P. Shah, and S. Bhattacharya, “ Mirror hopping approach for selective
denial of service prevention. ”, Object-Oriented Real-Time Dependable Systems,
Page 152
Bibliography
136
2003. (WORDS 2003). Proceedings of the Eighth International Workshop on , pp.
200, 208, 15 - 17 Jan. 2003.
[86] P. T. Conrad, G. J. Heinz, A. L. Caro Jr. , P. D. Amer, J. Fiore, “SCTP in battlefield
networks”, Military Communications Conference, 2001. MILCOM 2001.
Communications for Network-Centric Operations: Creating the Information Force.
IEEE, pp. 289 , 295 vol. 1 , 2001
[87] P. Watson, “ Slipping in the Window: TCP Reset attacks ”, a presentation at
CanSecWest 2004.
[88] P. Yee, “ Request for Comments 6818: Updates to the Internet X.509 Public Key
Infrastructure Certificate and Certificate Revocation List (CRL) Profile ”, IETF
Standards Track, January 2013.
[89] R. Bush, and D. Meyer “RFC 3439: Some Internet Architectural Guidelines and
Philosophy”. December 2002.
[90] R. Gieben, and W. Mekking, “ Request for Comments 7129: Authenticated Denial of
Existence in the DNS. ”, IETF Informational, February 2014.
[91] R. Maheshwari, C. R. Krishna, M. S. Brahma, “ Defending network system against
IP spoofing based distributed DoS attacks using DPHCF - RTT packet filtering
technique ”, Issues and Challenges in Intelligent Computing Techniques (ICICT),
2014 International Conference on , pp. 206, 209, 7 - 8 Feb. 2014.
[92] R. R. Ferreira Lopes, R. Stoud Platou, S. Hendseth, N. M. Torrisi, K. Nyborg
Gregertsen, and G. Mathisen, “ Deploying third party services at smart grids end users
using broadband links. ”, Innovative Smart Grid Technologies Europe (ISGT
EUROPE), 2013 4th IEEE/PES, pp. 1, 5, 6 - 9 Oct. 2013.
[93] Rajeev Bector, “ Challenges with SPDY deployment ”, IETF proceedings slides,
2012.
[94] Ronald E. Walpole, Raymond H. Myers, and Sharon L. Myers. “ Probability and
Statistics for Engineers and Scientists. ” Prentice Hall College Div; 6 Sub edition
December, 1997. ISBN - 10: 0138402086.
[95] S. Friedl, A. Langle,y A. Popov, and E. Stephan, “ Request for Comments 7301:
Transport Layer Security (TLS) Application-Layer Protocol Negotiation Extension.
”, IETF Standards Track, July 2014.
Page 153
Bibliography
137
[96] S. V. Crowder, “A Simple Method for Studying Run-Length Distributions of
Exponentially Weighted Moving Average Charts,” Techno metrics, 1987, Vol. 29
(4), pp. 401 – 407.
[97] S. V. Crowder, “Computation of ARL for Combined Individual Measurement and
Moving Range Charts,” Journal of Quality Technology, 1987, Vol. 19 (1), pp. 98 –
102.
[98] S. W. Roberts, “Control Chart Tests Based on Geometric Moving Averages,” Techno
metrics 1959, Vol. 42 (1), pp. 97 – 102.
[99] Sally Floyd, V. Jacobson, “Random early detection gateways for congestion
avoidance”, Networking, IEEE/ACM Transactions on , vol. 1, no. 4, pp. 397, 413,
Aug 1993
[100] SPDY, The Chromium Projects: web http://www.chromium.org/spdy , accessed on
October 2014.
[101] Sui Song, Li Ling, and C. N. Manikopoulo, “ Flow-based Statistical Aggregation
Schemes for Network Anomaly Detection ”, Networking, Sensing and Control, 2006.
ICNSC '06. Proceedings of the 2006 IEEE International Conference on , pp. 786 -
791, 2006.
[102] Sumei Zhang; Hua Li; Yu Xue; Xianrong Wang, “ Using TTCN - 3 to Test SPDY
Protocol Interaction. ”, PropertyComputer Software and Applications Conference
Workshops (COMPSACW), 2014 IEEE 38th International , pp. 541, 546, 21 - 25
July 2014.
[103] Sven Ehlert, Chengjian Wang, Thomas Magedanz, and Dorgham Sisalem. “
Specification-based Denial-of-Service Detection for SIP Voice-over-IP Networks. ”,
Third International Conference on Internet Monitoring and Protection, 2008.
[104] Sven Ehlert, Dimitris Geneiatakis, and Thomas Magedanz, “ Survey of network
security systems to counter SIP-based denial-of-service attacks ”, Computers &
Security, Elsevier Journal on, Volume 29, Issue 2, Pages 225, 243. March 2010.
[105] Sven Ehlert, Ge Zhang a, Dimitris Geneiatakis, Georgios Kambourakis, Tasos
Dagiuklas, Jirˇi Markl, Dorgham Sisalem, “ Two layer Denial of Service prevention
on SIP VoIP infrastructures. ”, Computer Communications 31, 2008.
Page 154
Bibliography
138
[106] Sven Ehlert, Ge Zhang, T. Magedanz. “ Increasing SIP firewall performance by rule
set size limitation. ”, PIMRC 2008, IEEE 19th International Symposium on Personal,
Indoor and Mobile Radio Communications, 2008.
[107] Sven Ehlert, Yacine Rebahi, and Thomas Magedanz, “ Intrusion Detection System
for Denial-of-Service flooding attacks in SIP communication networks ”,
International Journal of Security and Networks, 2009.
[108] Syed A. Ahson, and Mohammad Ilyas, “ SIP Handbook: Services, Technologies, and
Security of Session Initiation Protocol ”, CRC Press, Oct. 2012.
[109] T. Guillet, A. Serhrouchni and, M. Badra, “ Mutual Authentication for SIP: A
Semantic Meaning for the SIP Opaque Values. ”, New Technologies, Mobility and
Security, 2008. NTMS '08. , pp. 1, 6, 5 - 7 Nov. 2008
[110] T. Krovetz, “ Request for Comments 4418: UMAC: Message Authentication Code
using Universal Hashing ”, IETF Informational document, March 2006.
[111] T. Yatagai, T. Isohara, and Iwao Sasase, “ Detection of HTTP-GET flood Attack
Based on Analysis of Page Access Behavior ”, Communications, Computers and
Signal Processing, 2007. PacRim 2007. IEEE Pacific Rim Conference on , pp. 232,
235, 22 - 24 Aug. 2007
[112] TERENA, “ SIP Handbook A practical guide to setting up a safe VoIP and
videoconferencing server: the NREN-Enhanced Communications Server or N-ECS”
TERENA Task Force on Enhanced Communication Services – TF-ECS, September
2008.
[113] The Apache Software Foundation, www.apache.org .
[114] The Opportunistic Network Environment (ONE) simulator, web:
http://www.netlab.tkk.fi/tutkimus/dtn/theone/
[115] V. K. Gurani, P. G. Shynu, and C. L. Chowdhary, “ Monitoring application for DoS
attacks using group testing. ”, Electronics and Communication Systems (ICECS),
2014 International Conference on , pp. 1, 4, 13 - 14 Feb. 2014
[116] V. Paxson, and M. Allman, “Request for Comments 2988: Computing TCP's
Retransmission Timer ”, IETF Standards Track, November 2000.
Page 155
Bibliography
139
[117] V. Paxson, M. Allman, J. Chu, M. Sargent, “ Request for Comments: 6298
Computing TCP's Retransmission Timer ”, IETF Standards Track, June 2011.
[118] V.Jacobson, ‘‘Congestion Avoidance and Control,’’ SIGCOMM ’88 Conf., ACM,
pp. 314 – 329, 1988.
[119] W. Eddy. “ RFC4987:TCP SYN Flooding Attacks and Common Mitigations.“, IETF
standards Track , August 2007.
[120] W. So, Ashok Narayanan, and David Oran, “ Named data networking on a router:
Fast and DoS-resistant forwarding with hash tables ”, Architectures for Networking
and Communications Systems (ANCS), 2013 ACM / IEEE Symposium on , pp. 215,
225, 21 - 22 Oct. 2013
[121] W3Schools Online Web Tutorials. Web: www.w3schools.com
[122] Web: http://www.itu.int/ITU-T/studygroups/com12/emodelv1/tut.htm last accessed
on October 2014
[123] William W. Streilein, David J. Fried, Robert K. Cunningham, “Detecting Flood-
based Denial-of-Service Attacks with SNMP / RMON ”, Computing Science and
Statistics Volume 35 Security and Infrastructure Protection Proceedings of the 35th
Symposium on the Interface Salt Lake City, Utah, 12 - 15 March, 2003.
[124] World Wide Web Consortium (W3C). Web: www.w3.org
[125] Xiaoyong Wu; V. A. Mahadik, D. S. Reeves, “ A summary of detection of denial-of-
QoS attacks on DiffServ networks. ”, DARPA Information Survivability Conference
and Exposition, 2003. Proceedings on , vol. 2, pp. 277, 282 vol. 2, 22 - 24. April 2003
[126] Xuan Chen, and John Heidemann, “Flash crowd mitigation via adaptive admission
control based on application-level observations ”, Internet Technology (TOIT), ACM
Transactions on, Volume 5 Issue 3, Pages 532 - 569, August 2005.
[127] Y. Elkhatib, G. Tyson, M. Welzl, “ Can SPDY really make the web faster ? ”,
Networking Conference, 2014 IFIP , pp. 1, 9, 2 - 4 June 2014
[128] Y. Ohsita, S. Ata, M. Murata, “Detecting distributed denial-of-service attacks by
analysing TCP SYN packets statistically. ”, Global Telecommunications Conference,
2004. GLOBECOM '04. IEEE , vol. 4, pp. 2043, 2049 Vol. 4, 29 Nov. -3 Dec. 2004.
Page 156
Bibliography
140
[129] Y. Suga, “ SSL / TLS Status Survey in Japan - Transitioning against the
Renegotiation Vulnerability and Short RSA Key Length Problem, ” , Information
Security (Asia JCIS), 2012 Seventh Asia Joint Conference on , pp. 17, 24, 9 - 10 Aug.
2012
[130] Y. W. Chen, Tao-Yuan Hsieng, “ Study on the prevention of SYN flooding by using
traffic policing, ” , Network Operations and Management Symposium, IEEE / IFIP ,
pp. 593, 604, 2000.
[131] Yi Zhang, QiangLiu, GuofengZ hao. “ A Real-Time DDoS Attack Detection and
Prevention System Based on per-IP Traffic Behavioural Analysis. ”, 3rd IEEE
International Conference on Computer Science and Information Technology
(ICCSIT), 2010.
[132] Yoshiaki Shiraishi, Youji Fukuta, and Masakatu Morii, “ Port randomised VPN by
mobile codes ”, Consumer Communications and Networking Conference, 2004.
CCNC 2004. First IEEE , pp. 671, 673, 5 - 8 Jan. 2004.
[133] Young Choh, Kai Song; Yan Bai, and K. Levy, “ Design and Implementation of a
Cloud-Based Cross-Platform Mobile Health System with HTTP 2.0. ”, Distributed
Computing Systems Workshops (ICDCSW), 2013 IEEE 33rd International
Conference on , pp. 392, 397, 8 - 11 July 2013.
[134] Z. Duan, Xin Yuan, J. Chandrashekar, “ Controlling IP Spoofing through Inter
domain Packet Filters ”, Dependable and Secure Computing, IEEE Transactions on,
vol. 5, no. 1, pp. 22, 36, Jan. - March 2008.
[135] Z. El Uahhabi, H. El Bakkali, “ A comparative study of PKI trust models ”, Next
Generation Networks and Services (NGNS), 2014 Fifth International Conference on,
pp. 255, 261, 28 - 30 May 2014.
[136] Zakir Durumeric, James Kasten, Michael Bailey, and J. Alex Halderman, “ Analysis
of the HTTPS certificate ecosystem ”, Internet measurement conference (IMC '13),
in Proceedings of ACM, The 2013 conference on, New York, NY, USA. 2013.