Detection of Internal Erosion and Seepage Evaluation Using Resistivity Monitoring Sjödahl, Pontus; Dahlin, Torleif; Johansson, Sam Published in: WasserWirtschaft 2007 Document Version: Publisher's PDF, also known as Version of record Link to publication Citation for published version (APA): Sjödahl, P., Dahlin, T., & Johansson, S. (2007). Detection of Internal Erosion and Seepage Evaluation Using Resistivity Monitoring. WasserWirtschaft, 97(10), 54-56. Total number of authors: 3 General rights Unless other specific re-use rights are stated the following general rights apply: Copyright and moral rights for the publications made accessible in the public portal are retained by the authors and/or other copyright owners and it is a condition of accessing publications that users recognise and abide by the legal requirements associated with these rights. • Users may download and print one copy of any publication from the public portal for the purpose of private study or research. • You may not further distribute the material or use it for any profit-making activity or commercial gain • You may freely distribute the URL identifying the publication in the public portal Read more about Creative commons licenses: https://creativecommons.org/licenses/ Take down policy If you believe that this document breaches copyright please contact us providing details, and we will remove access to the work immediately and investigate your claim. Download date: 03. Apr. 2022
Transcript
LUND UNIVERSITY
PO Box 117221 00 Lund+46 46-222 00 00
Detection of Internal Erosion and Seepage Evaluation Using Resistivity Monitoring
Sjödahl, Pontus; Dahlin, Torleif; Johansson, Sam
Published in:WasserWirtschaft
2007
Document Version:Publisher's PDF, also known as Version of record
Link to publication
Citation for published version (APA):Sjödahl, P., Dahlin, T., & Johansson, S. (2007). Detection of Internal Erosion and Seepage Evaluation UsingResistivity Monitoring. WasserWirtschaft, 97(10), 54-56.
Total number of authors:3
General rightsUnless other specific re-use rights are stated the following general rights apply:Copyright and moral rights for the publications made accessible in the public portal are retained by the authorsand/or other copyright owners and it is a condition of accessing publications that users recognise and abide by thelegal requirements associated with these rights. • Users may download and print one copy of any publication from the public portal for the purpose of private studyor research. • You may not further distribute the material or use it for any profit-making activity or commercial gain • You may freely distribute the URL identifying the publication in the public portal
Read more about Creative commons licenses: https://creativecommons.org/licenses/Take down policyIf you believe that this document breaches copyright please contact us providing details, and we will removeaccess to the work immediately and investigate your claim.
Resistivity surveying is a geophysical method widely used for a variety of engineering and environmental applications. In characterizing the subsurface the method makes use of the fact that earth materials have different ability to conduct electrical
current. Being nondestructive the method may be attractive for installations on existing dams and it has been found useful for status control in dam safety investigations. Another more ambitious and more powerful approach is using the method for longterm monitoring of dams. In that case additional information is received
from an analysis of the seasonal resistivity variations in the dam.
2 Fundamentalprinciples
The resistivity in an embankment dam varies seasonally, and depends mainly on the temperature and the ion content of the seepage water. Both these parameters vary seasonally, and their variation in the dam depends on the seepage flow. Areas in the dam with larger seepage may stand out as areas with larger seasonal variation.
2.1 Seepageinducedvariations
Seasonal temperature variations in an embankment dam has since long successfully been used for seepage detection. Seepage flow rates can be evaluated from temperature measurements without knowledge of hydraulic conductivity in the dam [1]. This is a great achievement, as the true infield hydraulic conductivity is a difficult parameter to estimate. In a similar way resistivity can be used to evaluate seepage. Seepage causes resistivity variations in the dam that may be recorded by repeated measurements. Johansson and Dahlin [2] did some initial test on repeated resistivity measurements from the Lövön dam. The basis for this principle is the relation between temperature and resistivity (Eq. 1), where the resistivities, ρT, at different temperatures, T, relates to the resistivity, ρ18, at a temperature of 18° C. The temperature coefficient of resistivity, α, is empirically
Figure 1: Importance of fines content on resistivity of soils. Results from an experiment simulating erosion in a glacial till used for sealing waste deposits, but similar to a dam core (Ste 2 and Sto 2 are named samples from two different sites) [1]
Wasserbau
5510 / 2007
found to be approximately 0.025° C1, and valid for temperatures above the freezing point [3]:
ρT = ρ18 ____________ (1 + α (T – 18))
2.2 Effectsfrominternalerosion
Internal erosion is the reason why weak zones can take the form of highresistive anomalies. When internal erosion occurs, the fine particles of the soil are washed out from the core. This process affects the resistivity in two aspects, each working against the other. Firstly, the porosity of the core increases which leads to a decrease of the resistivity due to higher water content. Secondly the reduction of the fines content in itself increases the resistivity. In many finegrained soils, the second aspect dominates. Laboratory test performed by Bergström [4] on some Swedish glacial tills used for sealing layers on waste deposits indicate a significant increase in resistivity when the fine content is removed (Figure 1).
In the experiment conducted by Bergström, resistivity was measured on the same soil with different levels of fines removed, thereby simulating washout of fines as a result of internal erosion. The glacial till sample is similar to what is used in the cores of many Swedish dams. The resistivity rises approximately ten times after removal of fines smaller than 0.25 mm.
3 Materialsandmethods
3.1 Systemdesign
Installing electrodes along the crest has been the most practical design on existing dams. For zoned embankments with central cores it is most favourable to install the electrodes in the dam core. This secures good electrode contact and as the dam core is less resistive than the fill material, the current will have a channelling effect in the dam core, thereby focusing on the most interesting part of the dam [5]. Apart from these factors, dam geometry, material properties, water resistivity, error sources such as steel sheet piles or earthing cables, reservoir fluctuations, are examples of other factors influencing the choice of design.
3.2 Dataaquisition
There is a variety of resistivity measuring instruments or packages of instruments on
the market for field use. Such equipment typically consists of a resistivity instrument, a relay switch (electrode selector), multielectrode cables, stainless steel electrodes and various connectors. Most modern instruments have a builtin computer that can handle the entire data acquisition process and memory capacity to store days of measured data. Systems used for permanent installations for dam monitoring have some specific requirements. An important addition is lightning protection that should be designed with individual protection for each electrode input connected to the system, as well as for power supply and possibly a modem telephone connection. It is fundamental to provide sufficiently good and stable electrode contact, as too high contact resistance between electrode and ground is a common source of data quality problems. If Self Potential is to be measured special nonpolarisable electrodes should be used.
Processing of resistivity data includes data quality assessment, inverse numerical modelling and presentation and analysis of the results. Checking data quality is usually performed by plotting the pseudosection. Checking of data also includes removal of apparently erroneous data points, and in some cases weighting of data in relation to reliability can also be performed. Subsequently, inverse numerical modelling is carried out on the data set, and the final model or alternative models are presented and analysed. For standard resistivity investigations this is usually made by hand in steps. However, for longterm monitoring it easily becomes too timeconsuming and instead automatic routines are necessary. Such automatic routines need to be robust and simple but still have the ca
von Pontus Sjödahl, Torleif Dahlin und Sam Johansson
Die Methode zur Messung des elektrischen Widerstandes ist zerstörungsfrei und aufgrund der ein-fachen Installation für die Dammüberwachung, auch über längere Zeiträume gut geeignet. Deren Messungen erfassen Änderungen von Materialeigenschaften sowie unregelmäßige Veränderungen, welche zu innerer Erosion und erhöhtem Sickerwasseraufkommen führen können. Allerdings kann die Anwendung dieser Methode sehr anspruchsvoll sein. Diese Abhandlung beschreibt den praktischen Gebrauch der Elektrischen Widerstandsmessmethode und stellt zwei Beispiele aus Schweden vor.
Erfassung innerer Erosion und Ermittlung von Sickerwassermengen mittels Anwendung der Elektrischen Widerstandsmessung
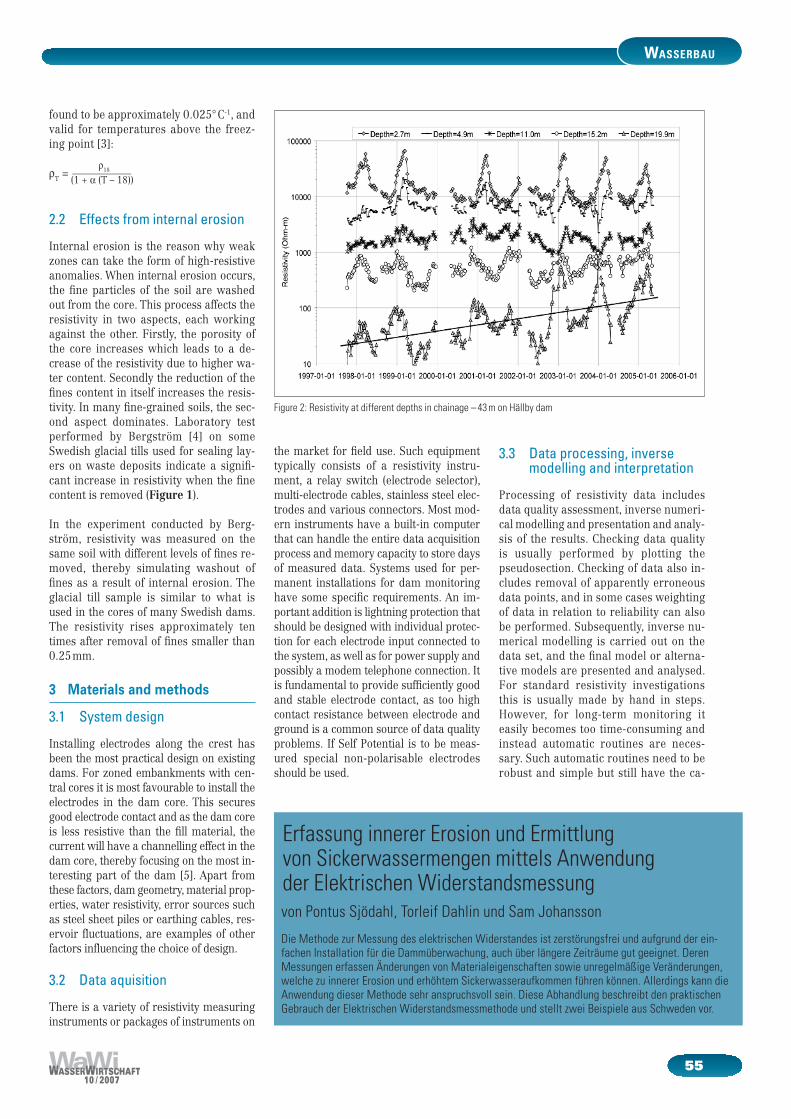
Figure 2: Resistivity at different depths in chainage – 43 m on Hällby dam
Wasserbau
5610 / 2007
pacity to perform the individual steps of the data processing scheme.
4 Casestudies
4.1 Hällby
The embankment dams at Hällby have a total length of around 320 m. The maximum height is 30 m. The dams are constructed as zoned rockfill embankment dams with vertical central glacial till cores. Hällby was the first Swedish embankment to get a permanently installed monitoring system intended for resistivity measurements. Daily measurements started to take place in 1996, which make these longterm monitoring data unique. In 2004 – 2005 the monitoring temporary halted as the dams were upgraded and the electrodes reinstalled.
Resistivity in the dam varies seasonally (Figure 2). In general on the Hällby dam, the variation is high close to the crest, which is explained by extremely high winter resistivities due to ground freezing. The amplitude of the variation becomes lower at larger depths. This is consistent with theory as the impact from seasonal temperature variation in the reservoir or in the air decreases with distance from the reservoir. The data showed in Figure 2 is from an area adjacent to previously reported sinkholes. Here, contrary to the expectations, there are significant variations at large depths, which have not been seen elsewhere. Moreover, there are also signs of increas
ing variations and increasing absolute resistivities on large depth.
4.2 Sädva
The Sädva dam is located in the Skellefteälven River just south of the Arctic Circle. The total length of the dam is 620 m, and the maximum height is 32 m. The dam is a rock fill embankment dam with a slightly inclined central glacial till core. The monitoring installation comprises full instrumentation for resistivity measurements. Permanent electrodes are installed inside the top of the dam core along the full length of the dam, and daily measurements have been carried out since 2001.
The seasonal variation is obvious also in the Sädva dam (Figure 3). Comparing with Hällby, the variations are generally smaller and also consistent along the length of the dam, which may be a sign of a healthier dam with lower seepage flow rates. The homogeneous conditions in the dam are evident. Moreover, freezing effects and electrode contact problems were avoided by improved installations.
5 Conclusions
The resistivity method is a nondestructive method suitable for longterm monitoring. The rapid development in the areas of data acquisition and data processing has supported the possibilities of constructively using the method for dam applications. Longterm monitoring with spatially
denser data points can now be achieved. This approach has been tried in two Swedish dams and similar installations are planned for another two dams.
Fundamental is the physical coupling between the resistivity parameter and seepage or seepage paths. The monitoring approach is based on two principal ideas, which both may be identified by studying timeseries. Firstly, washout of fines due to internal erosion will affect the resistivity in the dam. Secondly, seasonal resistivity variations in the reservoir, originating from variations in temperature and ion content, will affect the resistivity in the dam as the seepage water propagates through the dam.
Literature
[1] Johansson, S.: Seepage monitoring in embankment dams. Doctoral Thesis, TRITAAMI PHD 1014, Royal Institute of Technology, Stockholm, 1997.
[2] Johansson, S.; Dahlin, T.: Seepage monitoring in an earth embankment dam by repeated resistivity measurements. In: European Journal of Engineering and Environmental Geophysics 1 (1996), Nr. 3, S. 229 – 247.
[3] Ward, S. H.: Resistivity and induced polarization methods, In: Geotechnical and environmental geophysics 1 (1990), S. 147 – 189.
[4] Bergström, J.: Geophysical methods for investigating and monitoring the integrity of sealing layers on mining waste deposits. Licentiate Thesis, ISRN LTULIC – 98 / 24 – SE, Luleå University of Technology, 1998.
[5] Sjödahl, P.; Zhou, B.; Dahlin, T.: 2.5D Resistivity Modeling of Embankment Dams to Assess Influence from Geometry and Material Properties. In: Geophysics 71 (2006), S. 107 – 114.
Authors Name and Affiliation:Pontus Sjödahl, Ph.D.Sam Johansson, Ph.D.HydroResearch ABBox 1608S18316 [email protected]@hydroresearch.seTorleif Dahlin, Ph.D.Engineering Geology, Lund UniversityBox 118S22100 [email protected]
Figure 3: Resistivity at different depths in chainage 100 m on Sädva dam