+ All Categories
Home > Documents > Detection of pesticide residues on apples using surface ...

Detection of pesticide residues on apples using surface ...

Date post: 11-Dec-2021
Category:
Upload: others
View: 2 times
Download: 0 times
Share this document with a friend
108
Detection of pesticide residues on apples using surface-enhanced Raman spectroscopy A Thesis SUBMITTED TO THE FACULTY OF THE GRADUATE SCHOOL OF THE UNIVERSITY OF MINNESOTA BY Tuo Chen IN PARTIAL FULFILLMENT OF THE REQUIREMENTS FOR THE DEGREE OF MASTER OF SCIENCE in FOOD SCIENCE Adviser: Dr. Theodore P. Labuza June, 2014
Transcript

Detection of pesticide residues on apples using surface-enhanced Raman spectroscopy

A Thesis SUBMITTED TO THE FACULTY OF THE GRADUATE SCHOOL OF THE

UNIVERSITY OF MINNESOTA BY

Tuo Chen

IN PARTIAL FULFILLMENT OF THE REQUIREMENTS FOR THE DEGREE OF MASTER OF SCIENCE

in FOOD SCIENCE

Adviser: Dr. Theodore P. Labuza

June, 2014

© Tuo Chen 2014

i

Acknowledgements

I am deeply indebted to the people who have assisted me in completing my thesis

successfully.

I would like to give my deepest sense of gratitude to Dr. Ted Labuza, for his incredible

support throughout my master’s studies. This thesis would not have been written without

him. I want to thank Dr. Baraem Ismail, Dr. Christy Haynes and Dr. Lili He for being my

graduate committee and giving valuable advice on improving this thesis.

I gratefully acknowledge the constant encouragement, support and guidance of Dr. Lili

He throughout this project, who used to be the post-doctoral in our lab and is now an

assistant professor at U Mass. I could not accomplish my work without her support. Lili

has been a wonderful example to learn from, in all facts of life. I would also like to thank

Dr. Qinchun Rao for his assistance in my research. I learned a lot from the work we did

together, from technical skills to scientific thinking.

Special thanks goes to Dr. Josy John, Thomas Rodda, Browyn Deen, Alyssa Pagel and

the other lab members. It is a great pleasure to work with all of you.

Last but not least, I would like to thank U.S. Department of Agriculture to grant this

project, which provided me great chance to get involved in this challenging project.

ii

Dedication

This thesis is dedicated to my father Bingdi Chen and my mother Chili Yang.

iii

Abstract

Pesticides are an integral part of agriculture, while increasing use leads to residues in/on

agricultural products. Federal monitoring and enforcement action is dependent on the

technical capability to detect pesticides. However, current methods are elaborate, time-

consuming and not cost-effective.

In the first part of this work, a rapid and simple surface-enhanced Raman spectroscopy

(SERS) method coupled with a surface swab method for recovery and quantitative

detection of thiabendazole (TBZ) on apple surfaces was developed, optimized and

validated. The whole apple surface was swabbed and the swab was vortexed to release

the pesticides. After that, silver dendrites (AgD) were used to bind the pesticide for

Raman measurement. The limit of detection of TBZ in methanol was 0.01µg/mL,

(10ppb), while the Environmental Protection Agency (EPA) limit is 5µg/gram apple-

weight (5 ppm). The concentration of the recovered TBZ was predicted using a partial

least square model. The recovery from the surface swab method was calculated to be 59.7%

to 76.6% for intentional contamination at 0.1, 0.3, 3 and 5 ppm (µg/g apple-weight) level,

respectively. The final accuracy of the swab-SERS method was calculated to be between

90.0% and 115.4%, after corrected by the releasing factor (66.6%).

iv

In the second part, a new approach was proposed to detect acetamiprid using an aptamer-

based SERS method. The acetamiprid aptamer was chosen from the literature, thoilated

and conjugated onto AgD. To block the unbounded surface on the substrate surface after

aptamer immobilization, bovine serum albumin (BSA), 2-mercaptoethanol (ME) 6-

mercaptohexanol (MCH) and were investigated as blocking agents. MCH and ME cannot

fully block the surface when encountered with interference. The typical peaks from

acetamiprid did not show on the aptamer-blocking agent-acetampired spectra when using

BSA as blocking agents. The aptamer and blocking agent immobility on AgD should be

further investigated and the method should be further modified.

Last, the swab method was further developed and validated using UV-visible

spectroscopy as a reference method. A standard curve was established based on the

absorbance at 245 nm at different concentrations from 0 ppm to 1000 ppm. The assay

standard curve well fit the five-parameter logistic model (r2 =0.995). The concentration of

acetamiprid in the extracts was determined using this standard curve. The recovery rate of

refined surface swab method is 90.6 % ± 1.4 % (n=5). This assay has a low intra- and

inter-assay coefficient of variation (CV < 5 %).

v

Table  of  Contents  

List  of  Tables  ............................................................................................................................  ix  

List  of  Figures  ............................................................................................................................  x  

Chapter  1  Introduction  .........................................................................................................  1  

Chapter  2  Review  of  Literature  ..........................................................................................  5  

Introduction  the  Key  Apple  Pesticides  ......................................................................................  5  

TBZ  .........................................................................................................................................................................  5  

Acetamiprid  ........................................................................................................................................................  7  

Federal  Agencies  Duty  for  Pesticide  Monitoring  ....................................................................  8  

The  U.S.  Department  of  Agriculture  (USDA)  ........................................................................................  8  

Food  and  Drug  Administration  (FDA)  ....................................................................................................  9  

U.  S.  Environmental  Protection  Agency  (EPA)  .................................................................................  10  

Pesticide  Detection  Techniques  ................................................................................................  10  

Current  Detection  Approaches  for  Pesticides  ..................................................................................  10  

New  Pesticide  Detection  Approach  ......................................................................................................  11  

Surface-­‐Enhanced  Raman  Spectroscopy  ................................................................................  15  

History  ...............................................................................................................................................................  15  

Mechanisms  ....................................................................................................................................................  16  

SERS  enhancers/  silver  dendrites  (AgDs)  .........................................................................................  16  

Applications  of  SERS  in  food  science  ...................................................................................................  18  

Challenges  in  the  SERS  detection  method  .........................................................................................  20  

vi

Aptamers  ...........................................................................................................................................  20  

Aptamer  in  vitro  selection  .........................................................................................................................  21  

Advantages  and  limitations  of  aptamers  ............................................................................................  22  

Immobilization  of  aptamer  onto  nano  surface  substrates  .........................................................  23  

Aptamer-­‐based  assays  for  food  analysis  ............................................................................................  24  

Chapter  3  Surface  Swab  Capture  Method  Coupled  by  SERS  ....................................  26  

Materials  and  Methods  .................................................................................................................  26  

Materials  ...........................................................................................................................................................  26  

Establishment  of  a  calibration  model  of  TBZ  in  methanol  .........................................................  28  

Determination  of  the  limit  of  detection  of  the  SERS  method  for  TBZ  in  methanol  ..........  30  

Development  of  the  surface-­‐swab  SERS  method  ............................................................................  31  

Validation  of  the  swab-­‐SERS  method  on  the  apple  surface  ........................................................  34  

Results  and  Discussion  .................................................................................................................  36  

LOD  of  SERS  for  TBZ  in  methanol  ..........................................................................................................  36  

Establishment  of  calibration  model  and  validation  model  .........................................................  43  

Validation  of  the  swab-­‐SERS  method  on  the  apple  surface  ........................................................  45  

Chapter  4  Aptamer  Based  SERS  Detection  Method  ....................................................  47  

Materials  and  Methods  .................................................................................................................  47  

Materials  ...........................................................................................................................................................  47  

Aptamer  and  AgD  preparation  ...............................................................................................................  47  

Blocking  the  non-­‐specific  binding  on  the  AgD  surface  .................................................................  49  

vii

Detecting  acetamiprid  using  aptamer-­‐AgD  complex  ....................................................................  49  

Improvement  of  the  surface  swab  method  .......................................................................................  50  

Raman  instrumentation  and  Data  analysis  .......................................................................................  53  

Results  and  Discussion  .................................................................................................................  54  

Blocking  non-­‐specific  binding  on  AgD  surface  ................................................................................  54  

Determine  acetamiprid  using  aptamer-­‐AgD  complex  ..................................................................  59  

Improvement  of  the  surface  swab  method  .......................................................................................  62  

Chapter  5  Conclusion  ...........................................................................................................  68  

Summary  of  Methods  ....................................................................................................................  68  

The  Swab-­‐SERS  method  .............................................................................................................................  68  

The  Aptamer  based  SERS  method  .........................................................................................................  69  

Future  Studies  .................................................................................................................................  70  

Feasibility  of  the  portable  Raman  instrument  .................................................................................  70  

Multi-­‐residual  detection  development  ................................................................................................  70  

Selection  of  the  blocking  agent  and  immobilized  the  aptamer  on  AgD  ................................  71  

Chapter  6  References  Cited  ................................................................................................  72  

Appendix-­‐A  Average  spectra  of  negative  control  .......................................................  81  

Appendix-­‐B  Selected  data  of  swab  optimization  ........................................................  82  

Appendix-­‐C  PCA  plot  of  different  concentrations  TBZ  solution  ............................  86  

Appendix-­‐D  Selected  data  of  releasing  factor  .............................................................  89  

viii

Appendix-­‐E  The  swab-­‐SERS  method  validation  data  ................................................  90  

Appendix-­‐F  Raw  data  of  UV-­‐vis  acetamiprid  detection  ............................................  91  

Appendix-­‐G  Selected  data  analysis  results  of  refined  swab  method  ...................  94  

ix

List  of  Tables  

Table 1 Prediction and recovery of TBZ from apple using the swab-SERS method ....... 46  

Table 2 CV of the surface swab method to capture 20 ppm actamiprid on glass slide .... 67  

x

List  of  Figures  

Figure 1 Average SERS spectra (N=5) of silver dendrites, DMSO and methanol ........... 28  

Figure 2 The SERS spectra of 100 µg/mL TBZ in methanol ........................................... 37  

Figure 3. Second derivative transformation of the SERS spectra for the 1285 cm-1 peaks

of TBZ of different concentrations (a), and the PCA plot of the SERS spectra of

TBZ of the low concentrations (b) ............................................................................ 38  

Figure 4 Peak heights at 784 nm-1 Raman shift under different vortex times. The peak

heights data is shown in Appendix-B Table 1. ......................................................... 39  

Figure 5 Peak heights at 784 nm-1 Raman shift under different aptamer binding times. The

peak heights data is shown in Appendix-B Table 2. ................................................. 40  

Figure 6 Peak heights at 784 nm-1 Raman shift at different swab areas. The peak heights

data is shown in Appendix-B Table 2. ...................................................................... 41  

Figure 7 Peak heights at 784 nm-1 Raman shift under different swab times. The peak

heights data is shown in Appendix-B Table 4. ......................................................... 42  

Figure 8 Second derivative transformation of the SERS spectra for the 785 cm-1 peaks

under different swab times. ....................................................................................... 42  

Figure 9 PLS plots of the calibration model (a) and the validation model (b) ................. 44  

xi

Figure 10 Schematic representation of the apatmer-blocking agent-AgD fabrication. .... 55  

Figure 11 A: Raw spectra (N=30) of AgD fully covered by 100 µM ME; AgD-ME

complex incubated in 1000 ppm Acetamiprid; AgD fully covered by 100 µM MCH;

AgD-MCH complex incubated in 1000 ppm Acetamiprid. B: Raw spectra of AgD-

ME/MCH complex incubated in 100 ppm malathion ............................................... 57  

Figure 12 Raw spectrum (N=30) of AgD-BSA complex incubated in 1000 ppm

Acetamiprid/ 100 ppm Malathion ............................................................................. 58  

Figure 13 (A) Average spectra (N=30) of the aptamer on AgD; aptamer-AgD complex

incubated in BSA (3% g/ml); aptamer-AgD complex surface blocked by BSA (3%

g/ml) to detect 1000 ppm Acetamiprid in water. (B): average Raman raw spectrum

(N=3) of pure acetamiprid powder. .......................................................................... 60  

Figure 14 Average UV-vis standard curve (N=10) of absorbance change at 245 nm under

different concentration acetamiprid in DD water. .................................................... 63  

Figure 15 Recovery rates of acetamiprid residues from a glass slide at extraction solvent

volume of 0 µL, 100 µL, 200 µL, 300 µL and 400 µL. ............................................ 64  

Figure 16 Recovery rates of water and 50% method as extraction solution to extract the

acetamiprid residues from glass slide. ...................................................................... 65  

xii

Figure 17 The illustration of the surface swab method ..................................................... 66  

Figure 18 SERS spectra of DI, TBZ and their mix (1:1) .................................................. 71


1

Chapter 1 Introduction

Pesticides, in general, are a broad range of chemicals used to destroy or control weeds,

insects, fungi, and other pests in agricultural production. Due to the fact that pests and

diseases damage up to one-third of crops during growing, harvesting or storage,

pesticides make a significant contribution to maintaining world food production and

quality. According to 1991 estimates, farmers in the United States use 500,000 tons of

600 different types, synthetic or natural pesticides every year (Pimentel et al., 1992).

Because these chemicals are designed to kill living organisms, they present a risk not just

to pests but also to people, wildlife and the environment. Even though most of acute

toxicity pesticides are well documented, information on chronic human illnesses resulting

from pesticide exposure is weak. What’s worse, most pesticides fail to natural

degradation. Thus, the wide use of pesticides in agriculture results in continuing and

direct human exposure, especially in small amounts of certain foodstuff. Therefore,

monitoring pesticide residues is one of the most crucial perspectives to minimizing

potential hazards to human health.

Fresh and processed fruits and vegetables dominate 85% of the total food considered to

contain pesticide residues, and fresh products are more likely to contain pesticides.

Apples are one of the fruits most likely to be contaminated with pesticides. Apples are a

major agricultural product and the third most valuable fruit crop in the United States with

2

a $2.72 billion value in 2011 ("commodity apples ", 2013). The U.S. Department of

Agriculture (USDA) 2009 annual summary claimed 98% of apples tested positive for

pesticide residues. 75.4% and 33.1% of apple samples showed the presence of TBZ and

acetamiprid (Pesticide Data Program Annual Summary 2009).

The process for detection of pesticides in a sample requires two general steps: separation

/concentration, following by detection. To determine the trace analytes in a complex

matrix sample, a solid sample preparation and sensitive detection method are required.

However, the first step is often the bottleneck for rapid detection, especially for the

determination of trace analytes in a complex matrix sample. A good sample preparation

method should isolate the target analytes from the sample, eliminate the interferences,

and most importantly concentrate the analytes to be able to determine the actual level.

Many detection technologies exist which are capable of extremely sensitive detection,

such as gas chromatography (GC) and high performance liquid chromatography (HPLC)

followed by Mass Spectroscopy. However, these methods require time-consuming

sample pretreatment, expensive equipment facilities and also experienced personnel.

It is desirable to have a simple and rapid detection method for screening pesticides in a

large amount of samples. In 2009, the USDA collected and analyzed 13,244 samples

(Pesticide Data Program Annual Summary 2009). What’s more, 1.9 million analyses

were reported in 2011 (Pesticide Data Program Annual Summary 2010). The long test

3

detection time especially the time consuming pre-sample treatments makes the process

painful. Simple and rapid detection methods improve the detection efficiency and allows

for a larger number of samples. Additionally, as fruit and vegetable samples are collected

in the field, at distribution centers, terminal markets and large chain stores, a simple

procedure and portable, durable technology is favored to fulfill on-site requirements.

In addition, the sensitive assay must have a limit of detection lower than the maximum

residue limits (MRLs) established by the EPA. The limit of detection must be compared

with MRL based on the average weight of ~200 g per apple.

Last, it is necessary to build a method that can be applied to a broad range of pesticides

and other food matrices. Excluding water and catfish, 791 pesticides were reported by the

FDA as Presumptive Tolerance Violations (Pesticide Data Program Annual Summary

2010). Generally, more than one pesticide will be used at different times, preharvest or

postharvest to the crop, and those pesticide residues as well as any metabolites need to be

analyzed. Thus, the method feasibility, as an important criteria, is under consideration.

The Null Hypothesis of this thesis is: there is no rapid, sensitive, selective and cost-

effective pesticide residual analytical method to detect pesticides on apple surfaces.

The specific objectives are:

4

1. Develop a surface swab method followed by Surface Enhanced Raman Scattering

(SERS) detection for TBZ on apple surfaces.

2. Develop an aptamer-based SERS method for detection of acetamiprid. The use of an

aptamer that can specifically capture the pesticide acetamiprid is expected to improve the

selectivity and accuracy of the SERS method.

5

Chapter 2 Review of Literature

Introduction the Key Apple Pesticides

TBZ

TBZ, 2-(4’-thiazolyl) benzimidazole, is a fungicide and parasticide. It’s a white

crystalline compound used to control a variety of fungi diseases such as mold, blight, rot

and stains for fruits and vegetables.

TBZ is registered for use mostly on citrus fruits as well as apples, pears, bananas, papaya,

carrots, avocados and peas as a post-harvest dip or spray. It is also used for pre-planting

dust treatment on potato seed-pieces, soybean, wheat and mushrooms as well as a

preservative and adhesive in paints, carpets, textiles, paper products (USEPA, 2002).

The human health risk assessment indicates some risk concerns for TBZ usage. The acute

toxicity studies of TBZ have been employed in mice, rabbits, dogs and the other species

in both male and female animals. The substance appears to have a toxicity at higher

doses, resulting in normochromic anemia, red blood cell destruction, hypoplasia of the

bone marrow, liver and intestinal disorders in test animals (Robinson, Stoerk, & Graessle,

1965).

For the human consumption of agricultural products, TBZ residues remain persistently in

both edible parts of raw fruit and in fruit juice (Ito et al., 2003; Veneziano, Vacca, Arana,

6

De Simone, & Rastrelli, 2004; Zamora, Pozo, López, & Hernández, 2004). Though the

chronic dietary food risk is below the EPA’s level of concern, TBZ has been claimed

likely to be carcinogenic at doses high enough to cause disturbance of the thyroid

hormone balance (USEPA, 2002). In addition, due to the ecological risks, TBZ is highly

toxic to freshwater estuarine fish (Knauer, Lampert, & Gonzalez-Valero, 2007).

The EPA established the tolerances or maximum residue limits for agricultural and

livestock commodities in 40 CFR §180.242. The MRL for apples (post-harvest) is 5 µg/g

on an apple weight basis. The most common analytical method for TBZ analysis is HPLC

coupled with UV or fluorescence detection (Bushway, 1996). It is a time and solvent-

consuming method especially in sample preparation steps before performing

chromatographic analysis. Studies published the simple, sensitive and organic solvent-

free TBZ determination method based on solid-phase microextration or dispersive liquid-

liquid microextraction coupling with HPLC with fluorescence detection (Hu et al., 2008;

Wu et al., 2009). Also, flow-injection electrospray ionization tandem mass spectrometry

for TBZ and other pesticides was investigated and implemented (Ito et al., 2003). The

other studies include an immunostrip test based on indirect competitive principle labeled

by carbon particles (Blažková, Rauch, & Fukal, 2010), capillary electrophoresis-mass

spectrometry (Rodrıguez, Picó, Font, & Manes, 2002) and monoclonal antibody-based

ELISA (Brandon, Binder, Bates, & Montague, 1992).

7

Acetamiprid

Neonicotinoids are one of the newer classes of synthetic systemic insecticides from

modifying natural products. In 1970 Shell Development Company in California

discovered the first neonicotinoids, 2-(dibromomitromethyl)-3-methylpryridine, to kill

house flies and pea aphids for crop protection (Soloway, S. B., Henry, A. C., Kollmeyer,

W. D., Padgett, W. M., Powell, J. E., Roman, S. A., ... & Horne, C. A. (1978). In the past

three decades, the neonicotinoids are the only major new class of insecticides developed,

accounting for 11-15% of the insecticide market (Guzsvány, Csanádi, Lazićb, & Gaál,

2009).

Acetamiprid, one of neoicotinoids, was introduced in Japan in 1989 (Tomizawa & Casida,

2005). It acts on a broad spectrum of insects, including Hemiptera, especially aphids,

Thysanoptera and Lepidoptera, and it is recommended as a substitute for some

organophosphate pesticides (Mateu-Sanchez, Moreno, Arrebola, & MARTÍNEZ VIDAL,

2003). It is reported that the half-life value of acetamiprid is 11.1 days under UV light,

25.1 days under sunlight soil, 1-2 days in field soils, 1.02-1.59 days on the mustard plant,

1.82 to 2.33 days on tea leaves and 2.24 days on chili peppers (Park et al., 2011). The

MRL of acetamiprid in fruits is set at 3 ppm by the EPA (EPA, 2005).

Acetamiprid is one of the frequently detected pesticides in agricultural products

(Akiyama, Yoshioka, & Tsuji, 2002). Although classified as unlikely to be a human

carcinogen, acetamiprid has been blamed for causing colony collapse disorder. In order to

8

control its application, it is very important to accurately determine the compound with

validated analytical methodologies. Currently, it is mainly analyzed with HPLC and GC,

coupled with solid phase extraction for a sample clean-up (Mateu-Sanchez et al., 2003;

Obana, Okihashi, Akutsu, Kitagawa, & Hori, 2003). Also, the official method for

acetamiprid detection in Japan requires liquid-liquid partition and Florisil column

chromatography (Watanabe, Miyake, Baba, Eun, & Endo, 2006). New approaches

include the monoclonal antibody ELISA and gold nanoparticle aggregation colorimetric

method (Q. Xu, Du, Li, & Hu, 2011). Moreover some ELISA kits are available in Japan

for rapid acetamiprid detection (Watanabe et al., 2006).

Federal Agencies Duty for Pesticide Monitoring

In 1947, the U.S. Congress enacted the Federal Insecticide, Fungicide, and Rodenticide

Act (FIFRA), for all pesticides in use in the country. It established procedures for

registering pesticides primarily concerning the efficacy of pesticides with the USDA

without regulating pesticide use. It was rewritten and amended by the Federal

Environmental Pesticide Control Act (FEPCA) in 1972.

The U.S. Department of Agriculture (USDA)

In 1991, the USDA, Agricultural Marketing Service (AMS) was in charge of designing

and implementing the pesticide data program (PDP) to determine the levels of pesticide

residues in foods. The AMS employed specialists that provide standardization, grading,

9

and market news services for major commodities critical to US agriculture. The AMS

also provides consultation and analytical testing services for private sector food

industries. According to the USDA PDP summary of 2005, food producers and the

scientific community should consider the pesticide residue data impartial, because of the

historically valued association between food producers and AMS. The PDP was part of

the 1996 Food Quality Protection Act (FQPA). The samples were collected in more than

10 States, with 27 different types of fresh fruit and vegetables, 21 different types of

processed commodities, 5 types of grain and wheat flour, cow’s milk, butter and etc.

Food and Drug Administration (FDA)

The FDA takes the responsibility to enforce MRLs established by the EPA under the

Federal Food, Drug, and Cosmetic Act. The Pesticide Analytical Manual (PAM)

published by FDA includes laboratory analytical methods to examine food pesticide

residues.

According to the efficiency and broad applicability, as well as the problem of analyzing

for unknown pesticides, multi-residue methods (MRMs) are implemented on a routine

basis. The PAM also provides the analytical methods for a single compound, which are

most often used when the likely residue is known and/or when the residue of interest

cannot be determined by common MRMs.

10

The FDA also defines limit of quantitation (Lq) as the lowest level of residue that can be

quantitated. Trace is defined in terms of the level less than the Lq. Under each analytical

situation, a specific Lq is determined by the method.

U. S. Environmental Protection Agency (EPA)

For sections 408 and 409 of the Federal Food, Drug, and Cosmetic Act, the EPA has the

statutory authority to establish tolerances for the maximum concentration of a pesticide

residue that is legally permitted to remain in a food. Tolerances are set to protect

consumers from harmful levels of pesticides on foods. The FDA and the USDA are

inspectors to monitor food in interstate commerce. The MRLs are set specifically for each

pesticide and each commodity.

The EPA’s Office of Pesticide Programs (OPP) Analytical and Environmental Chemistry

Laboratories also provides residue analytical methods (RAM) for detecting certain

pesticide residues for state, tribal, and local government laboratories. The EPA’s

laboratory has tested the reliability of most of the methods found in the RAM index.

Pesticide Detection Techniques

Current Detection Approaches for Pesticides

To facilitate proper application of detection methods, the Pesticide Analytical Manual

(PAM) provides information about percentage fat, water, and sugars in raw agricultural

11

commodities and some processed foods. GC and HPLC are usually designated as an

appropriate detection method for either fatty (>2%) or non-fatty (<2%) foods. The main

techniques for sample preparation are solvent extraction and solid-phase extraction.

Capillary gas chromatography is the technique most widely used in pesticide analysis.

FDA requires that mass spectrometry (MS) be used to confirm the identity of any residue

found for the first time.

Pesticide multi-residue methods (MRMs) are capable of simultaneously determining

more than one residue in a single analysis; this multi-residue capability is provided by a

gas-liquid chromatography (GLC) or HPLC determinative step that separates residues

from one another before detection. GLC has been the predominant determinative step in

pesticide muti-residue methodology for over 30 years. Its application is restricted to

analytes which can be vaporized without degradation since GLC involves interaction

between a vapor phase and liquid phase. For those heat-labile chemicals, HPLC offers a

variety of alternative schemes for separating analytes according to chemical or physical

characteristics.

New Pesticide Detection Approach

Although the classic approaches have very high sensitivity, these methods suffer from

many disadvantages such as requiring skilled technicians, being complex, costly and time

consuming and their on-line use for continuous monitoring is impractical (Marty, Garcia,

& Rouillon, 1995).

12

A versatile yet simple strategy for the detection of a highly selective and sensitive

pesticide is still under exploration. It is noteworthy that a big challenge for detecting

pesticides in real samples is how to eliminate potential interferences.

Biosensor

A biosensor is an analytical device for the detection of an analyte that combines a

biological component with a physicochemical detector component. It contains a sensitive

biological element, a transducer or a detector element and biosensor reader device.

Biosensors may provide solutions to some of the current problems encountered in the

measurement of pesticides. Because of their selective affinity towards certain pesticides,

a variety of biological macromolecules such as some enzymes and antibodies or other

components may be useful candidates as sensing elements for pesticide biosensors

(Marty et al., 1995).

In recent years enzyme immunoassay technologies have been growing rapidly as tools for

pesticide measurement. Several enzyme immunoassay test kits are available (Hock,

Dankwardt, Kramer, & Marx, 1995). Dichlorodiphenyltrichloroethane (DDT) was

detected by performing competitive immunoassays using a synthetic hapten conjugated

with bovine serum albumin and its specific monoclonal antibody was developed by Mar

Alvarez and co-workers in 2002. Their results indicate that nanomechanical biosensors

can achieve subnanomolar sensitivity, without the need of labeling them with fluorescent

and radioactive molecules (Alvarez et al., 2003).

13

Despite the promise of immunosensors, they do have certain limitations. Because one

antibody will permit the detection of one compound, it is necessary to know what

compound is to be measured and to select appropriate antibodies. In order to generate a

desired antibody with high affinity and specificity, the target compound is injected into

an animal and the blood is examined for any antigens that are produced by the animal as

a defense against the analyte. The antigens binding to the target analyte is then evaluated.

These procedures are expensive, time-consuming and very laborious, and sometimes the

obtained antibodies lack the required features to develop a useful immunoassay (Julicher,

Mussenbrock, Renneberg, & Cammann, 1995).

Enzymes were the first biological receptors to be used in biosensors. Pesticides act as

specific for a specific enzyme activity. Sensors, which have been developed for the

organophosphorus and carbamate insecticides, are regarded as an analytical method for

group pesticides. Vicky Vamvakaki and Nikos Chaniotakis have developed a novel

liposome-based nano-biosensor for the detection of organophosphorus pesticides.

Pesticide concentrations down to 10-10 M can be monitored using this inhibition

fluorescent biosensor. The liposome nano-biosensor was applied for the monitoring of

dichlorvos and parapxon and the determination of total toxicity in drinking water

(Vamvakaki & Chaniotakis, 2007).

14

Fluorescence with colorimetry

Haibing Li and co-workers at the Central China Normal University developed a

fenamithion probe based on Rhodamine B (RB) modified silver nanoparticles (RB-Ag

NPs). It combined fluorescence with colorimetry which results in a prompt on-site and

real-time detection of fenamithion with high sensitivity (0.1 nM) in an aqueous solution.

Moreover, when exposed to a series of interfering ionic/pesticide mixtures, the detection

system presents excellent anti-disturbance ability. The limit of detection (LOD) for

fenamithion in vegetables and different water samples can be as low as 2.6 ppm, while

the maximum contamination level of 1 ppm-250 ppm for organophosphorus pesticides as

defined by the EPA. The solution containing fenamithion changed from yellow to red

while other pesticides have no effect on the color. The UV-visible absorption

spectroscopy from 398 nm and 532 nm is used to quantify the amount of pesticides. The

absorbance ratio at two wavelengths (R=A532nm/A398nm) was determined and the R value

in the presence of fenamithion was the largest (Cui, Han, & Li, 2011).

Capillary Electrophoresis (CE)

Introduced in the 1960s, the technique of CE was designed to separate species based on

their size to charge ratio in the interior of a small capillary filled with an electrolyte. CE

has emerged as a good alternative food analysis method since it provides fast and

efficient separations (Cifuentes, 2006).

15

A combination of CE with UV or MS has been applied to detect pesticides in different

beverages below their MRLs values, achieving limits of detection of a few ppb in real

food samples (Pico, Rodriguez, & Manes, 2003; Rodriguez, Manes, & Pico, 2003)

Surface-Enhanced Raman Spectroscopy

Raman spectroscopy is a powerful molecular vibrational technique to produce

“fingerprint” spectra, which are shifted in energy from that of the excitation source

(Angel, Carrabba, & Cooney, 1995).

History

In 1923, the inelastic scattering of photons was predicted by Adolf Smekal, an Austrian

theoretical physicist. However it took until 1928, when it was simultaneously observed

independently in practice by Grigory Landsberg, Leonid Mandelstam and the Indian

scientist Sir C. V. Raman. Raman named the effect and won the Nobel Prize in Physics in

1930 for this discovery (Singh, 2002). He reported the “feeble” phenomenon from neat

solvent in a 1928 Nature paper. The invention of the laser in 1961 and the introduction of

fluorescence free FT-Raman-spectroscopy using NIR-lasers in 1986 makes Raman

experiments reasonable (Hirschfeld & Chase, 1986). SERS was discovered in 1977 by

Jeanmaire and Van Duyne (Jeanmaire & Vanduyne, 1977). The detection of a single

molecule was done using SERS in 1997 by Hildebrandt and Stockburger on silver

colloids (Haynes, McFarland, & Van Duyne, 2005; Nie & Emery, 1997).

16

Mechanisms

As mentioned, in 1977, Jeanmaire and Van Duyne demonstrated that the magnitude of

the Raman scattering signal can be significantly enhanced when the scatterer is placed on

or near a roughened noble-metal substrate surface (Jeanmaire & Vanduyne, 1977).

However, even today, the mechanism behind the enhancement is still not perfectly

understood.

Generally, it is agreed that there are electromagnetic and/or chemical effects that

contribute to enhancement mechanisms. Primarily, the large electromagnetic

enhancement induced by the excitation of the localized surface plasmon resonance

(LSPR) (Moskovits, 1985). Chemical effects refer to a charged transfer intermediate

state, resulting in metal electron-mediated resonance (Otto, Mrozek, Grabhorn, &

Akemann, 1992). Most SERS- enhancement systems were generated by a large number

of nanoparticles or closely spaced nanostructured surfaces.

SERS enhancers/ silver dendrites (AgDs)

Therefore, the SERS intensity depends on the excitation of the noble-metal substrates.

Over the past decades, new experimental and theoretical advances explain and prove the

presence of local enhancements spots, so called “ hot spots” that have an enhancement

factor of ~1011. Small nanopartical dimers and aggregates in surrounding sites produce

such hot spots (Lee, Morrill, & Moskovits, 2006).

17

A great deal of research has focused on the reproducible fabrication of metallic

nanostructures. The substrate’s size, shape, and inter-particle spacing of the materials are

the factors influencing the enhancement ability (Haynes et al., 2005). Substrates are

typically fabricated from silver, gold or copper.

In this study, AgD was employed as enhancement substrates. The previous study showed

the AgDs have acceptable reproducibility, capable of reliably producing ~ 104

enhancement factors and optimum absorption ranges from wavelengths of 400 to 800 nm

in distilled deionized (DD) water (L. L. He, Lin, Li, & Kim, 2010). Using field emission

scanning electron microscopy, the individual AgD morphology was determined to be 3-5

µm in length, symmetrical hexagonally-shaped three-dimensional branches (Fang, Ding,

Song, & Han, 2008).

AgDs were prepared via a simple replacement reaction between zinc plates introduced

into a silver nitrate solution. The prepared AgD could be kept in water at least 6 months

without signs of degradation (L. L. He, E. Lamont, et al., 2011). Due to the bending

vibration of the NO group, inorganic nitrate salts have a characteristic sharp band in the

region of 860-710 cm-1. The peak around 425 nm is the dipole surface plasmon

resonance.

Studies have demonstrated a great potential use of SERS coupled with AgDs for rapid

detection, classification, and quantification of chemical contaminants in food matrices (L.

18

He, Haynes, Diez‐Gonzalez, & Labuza, 2011; L. L. He, B. Deen, et al., 2011; L. L. He,

E. Lamont, et al., 2011). There are two formats of SERS substrate methods, the substrate-

based method and the solution-based method. In the substrate-based method, the nano-

surface is placed on the slide first and then the sample is added onto the nano-surface for

detection. This method possesses easy operation characteristics for qualitative detection

but a lower LOD. For the other method, the substrate is mixed with a sample solution

first and then pipetted onto a slide amount for detection. This method is suitable for

quantitative analyses and more sensitive and accurate.

Applications of SERS in food science

In the in vivo or in situ study of biological systems, such as foods, Raman spectroscopy

has a distinct advantage. Foods are primarily aqueous in nature and water is a polar

molecule that provides weak Raman scattering properties and thus has less interference.

The samples can be aqueous liquids, powders, gels or crystals in very small quantities

and not optically unclear (ECY Li-Chan, 1996). Though Raman scattering is inherently

weak which requires a fairly high concentration, the trace level analyte determination can

be implemented by SERS. Thus, the potential for analytical applications in food science

are immense especially for contaminants such as pathogens, allergens, pesticides and bio-

terror agents. Moreover, the portable SERS instrument makes trace on-site analysis in

clinics and the field possible.

19

One of the SERS applications has been to identify food bacterial pathogens (C. Fan, Hu,

Mustapha, & Lin, 2011; Y. Liu, Chao, Nou, & Chen, 2009). It was also reported to

separate and detect multiple pathogens in food matrices by magnetic SERS nanoprobes

(Y. Wang, Ravindranath, & Irudayaraj, 2011). Studies to detect foreign chemicals in food

matrices included melamine in milk and liquid infant formula (Betz, Cheng, & Rubloff,

2012; B. Liu, Lin, & Li, 2010), and food additives (Podstawka, Światłowska, Borowiec,

& Proniewicz, 2007). Another study used a SERS based detection method for crystal

violet and malachite green, inexpensive and violative triphenylmethane dyes in imported

seafood, at the lowest detectable level ~ 0.2 ppb (L. He, Kim, Li, Hu, & Lin, 2008).

Another application was to determine foreign proteins in food. Bands helpful for figuring

out secondary structure were assigned to the amide I, amide III, skeletal stretching of

peptides and amino acid functional groups stretching or bending vibration (E Li-Chan,

Nakai, & Hirotsuka, 1994).

SERS is capable of identifying and quantifying organic pollutatnts such as pesticides in

aqueous solutions (C. Shende, Gift, Inscore, Maksymiuk, & Farquharson, 2004;

Weissenbacher et al., 1997). Studies demonstrated to measure pesticide within high

content fruits using capillary couped SERS (C. S. Shende, Inscore, Gift, Maksymiuk, &

Farquharson, 2004).

20

Challenges in the SERS detection method

One of the challenges for SERS detection is to obtain a reproducible single-shot point

spectrum at high magnification to represent a single sample. The illumination volume

from the incident laser light may not be sufficient to encompass a whole sample and

adjacent colloid, especially for bacterial cell identification (Jarvis & Goodacre, 2008).

This problem was also encountered with small molecule detection due to the uneven

distribution of the molecules. To solve it, a simple method is needed to average SERS

spectra after acquiring multiple spectra in samples and between samples.

The reproducibility of the SERS signal is very sensitive, dependent on the SERS

substrate enhancement, as discussed above. However, the fabrication of highly regular,

reproducible hot spots on a nano surface substrate is quite challenging (Lee et al., 2006).

To develop an accurate qualitative detection method, the use of highly reproducible

substrates is critical.

Aptamers

Aptamers are single stranded DNA or RNA ligands which can be selected for binding to

different targets starting from a huge library of DNA/RNA short chain oligomeric

molecules containing randomly created sequences. The nucleic acid chain folds into a

variety of three-dimensional shapes with specific structural and ligand-binding (Ellington

& Szostak, 1990), which leads to a high binding specificity of the aptamer. Capture

21

forces are thought to include hydrogen bonding, electrostatic interactions, stacking of flat

moieties, molecular shape complementarity and/ or a combination of the effects

(Hermann & Patel, 2000). Until now, aptamers have been selected towards a wide range

of target analysts including metal ions (e.g., K+, Ni2+ and Zn2+) (Ciesiolka, Gorski, &

Yarus, 1995; Hofmann, Limmer, Hornung, & Sprinzl, 1997), small molecules (e.g.,

amino acids, ATP, anti-biotics, cocaine) (Geiger, Burgstaller, von der Eltz, Roeder, &

Famulok, 1996; Sazani, Larralde, & Szostak, 2004; Stojanovic, de Prada, & Landry,

2000; Wallace & Schroeder, 1998) and large targets (e.g., proteins, whole cells or

microorganisms) (Bruno & Kiel, 1999; X. Liu et al., 2003; Stojanovic & Landry, 2002;

C. Wang et al., 2003).

Aptamer in vitro selection

Aptamers have been engineered though repeated rounds of in vitro selection or

equivalently, termed SELEX (systematic evolution of ligands by exponential

enrichment). An enormous number of random sequences (~1015 molecules) flanked by

defined regions at the 5’ and 3’ ends nucleic acids are synthesized as an oligonucleotide

library. Then target ligands are exposed to the library and the sequences capable of

binding to ligands are enriched by affinity column chromatography. Nonbinding species

are washed off the column with high salt buffer. The bound sequences are eluted with

water, reversed to complementary DNAs, and amplified by polymerase chain reaction

(PCR) to prepare for subsequent rounds of selection. Iterative cycles of affinity

22

chromatography and in vitro amplification purify the binding sequences with higher

affinity and specificity, until the entire population can bind to the column (Ellington &

Szostak, 1990; Tuerk & Gold, 1990). The representative aptamer sequences are analyzed

and cloned. The number of rounds depends on a variety of parameters. It is estimated that

only one of every 1010 is able to fold into a three-dimensional structure specific to the

target analyte (Ellington & Szostak, 1990).

Advantages and limitations of aptamers

Aptamers are promising molecular tools for analytical applications because of their

versatility, high affinity and specificity. It is believed that aptamers are an emerging

detection method with several important advantages. First of all, aptamers can select for

single targets, complex targets or mixtures. It is considered to be a valid alternative to

antibodies as in vitro selection is independent of animals or cell lines. Also, the

automated SELEX protocol makes the selection even simpler. Secondly, aptamers

possess a high binding specificity, which are often comparable to those antibodies. The

theophylline aptamers with a dissociation constant Kd of 0.1 µM can discriminate against

high levels caffeine (Jenison, Gill, Pardi, & Polisky, 1994). The typical Kd for protein

aptamers are in the nM range or lower and in the range µM for small-molecule targets

(Nutiu & Li, 2003). Thirdly, as the size of aptamers is much smaller than those of

antibodies, aptamers have a higher surface density and less steric hindrance which helps

to increase binding (Proske, Blank, Buhmann, & Resch, 2005). The small size also makes

23

it possible for aptamers to reach a target in cells (Ulrich, Martins, & Pesquero, 2004). In

addition, it is easy to chemically modify aptamers in basic SELEX and after selection to

enhance the feasibility with a variety of fluorophores, electrochemical or other reporters.

However, aptamers hold some limitations. The major problem is the time-consuming

selection process. For assay development, aptamers prone to non-specific binding in

complex samples makes it difficult to quantify the target (Guthrie, Hamula, Zhang, & Le,

2006). Nuclease sensitivity is also the limitation of aptamers, specifically RNA as

recognition elements (Famulok, Mayer, & Blind, 2000).

Immobilization of aptamer onto nano surface substrates

General analytical formats, such as surface plasmon resonance, require immobilization of

receptors to a surface for integration into a device as well as maintenance of the binding

affinity and selectivity of aptamers in solution (Balamurugan, Obubuafo, Soper, &

Spivak, 2008). Chemical modifications of aptamers make it possible by improving the

binding capabilities or enhances the aptamer stability (Gold, Polisky, Uhlenbeck, &

Yarus, 1995). For further applications, post-SELEX modifications with functional groups

for detection or immobilization are required. For example, in affinity chromatography,

aptamers are immobilized under solution flow conditions to do the separation. In most

cases, covalent linking to surfaces is utilized such as with a thiol-Ag linkage.

24

In this present study using SERS, it was required that the aptamer be tethered within

close proximity to a metallic substrate nano structured surface to induce an analytical

signal. The immobilization of aptamers on AgD was reached by a thiol-terminated linker

via reduction of the asymmetric mixed disulfide [aptamer-S-S-(CH2)6OH] from

commercial sources. These thiol-tethered aptamers had one sulfur atom linked to the

aptamer, and the other one linked to MCH, which made it a stable nonsymmetric

disulfide.

It is crucial to obtain the free thiol from the disulfide precursor via reducing the disulfide.

The reducing agent dithiothreitoll (DTT) is typically used to cleave the disulfide into

aptamer-SH and HS-(CH2)6OH. However, the remaining DTT and MCH should be

removed by extraction or size-exclusion columns since DTT and MCH are effectively

attached onto the sliver surface (Sauthier, Carroll, Gorman, & Franzen, 2002; D.-K. Xu,

Ma, Liu, Jiang, & Liu, 1999). Tris (2-carboxyethyl) phosphine (TCEP) is an alternative

reducing agent which has the advantage over DTT as it cannot adsorb on substrate

surfaces itself (Balamurugan et al., 2008).

Aptamer-based assays for food analysis

The analytical application of aptamers in food analysis is under investigation as an

alternative recognition/trapping reagent to circumvent the limitations of conventional

immuno-assays (Tombelli, Minunni, & Mascini, 2007).

25

Aptamers for foodborne pathogen detection has been of increased interest in recent years

as an alternative to antibodies. Pan et al (2005) reported the direct selection of aptamers

for Salmonella enterica serovar Typhi proteins to inhibit bacterium action with a

reduction of cell invasion (Pan et al., 2005). Another aptamer-based capillary

electrophoretic analysis method for Campylobacter jejuni was developed with minimal

cross-reactivity to other food pathogens (McMasters & Stratis-Cullum, 2006). Other

targets included mycotoxins detection, inorganic metals, Bisphenol A from food

packaging and other food adulterants(McKeague, 2011). Aptamer technology presents a

great opportunity for application in food areas as robust and specific biosensors.

26

Chapter 3 Surface Swab Capture Method Coupled by SERS

Materials and Methods

Materials

TBZ, methanol, zinc and silver nitrate were purchased from Fisher Scientific Inc. (Fisher

Scientific, Rochester, NY, USA). The Gala apples originally from Washington State,

were purchased from Brooks Bros, a fruit broker in Minneapolis. The apples were

uniform size with average weight around 200 g.

AgD preparation

680 mg AgNO3 was dissolved into 20 ml DD water to make a 200 mM silver nitrate

solution. A zinc plate was cut into a small section of approximately 1.3 cm by 4 cm by

0.08 cm thick, and then soaked in 1N HCl for 2 minutes to remove surface

contamination. The plate was rinsed several times with DD water and dried in air. Then

the zinc plate was fixed at the bottom-center position on a 25 mm by 75 mm glass slide

and reacted with silver nitrate solution for 60 s. After precipitation on the zinc, the silver

dendrites were scrapped from the zinc plate into a 50 mL centrifuge tube with the micro-

pipet tip. The centrifuge tube was filled with 50 mL DD water, shaken for 10 s and

placed on a test tube rack. After the silver dendrites settled to the bottom of the centrifuge

tube (15 minutes), the supernatant was poured out and the dendrites were washed with 50

ml DD water again. This washing was done 5 times and then the dendrites were

27

transferred into a 20 mL glass vial filled with DD water. (Fang et al., 2007; L. L. He et

al., 2010).

Raman instrument

A Nicolet Almega XR Dispersive Raman (Thermo Fisher Scientific, Madison, WI) was

used in this study. The instrument facilitated a 780 nm excitation laser beam with light

scattering through a 10 x confocal microscope objective (laser spot diameter 3 µm). The

SERS measurements were performed with 50% laser power, 25 µm slit width for 5 s

integration time with 4 replicates. The spectra evaluated ranged from 386 to 3595 cm-1.

Five spots on the AgD surface were picked, measured and the spectra were saved as a

group. Spectral data was analyzed by the TQ Analyst software v8.0 (Thermo Fisher

Scientific, Madison, WI).

Data analysis

Spectra smoothing, second derivative transformation, and normalization as data pre-

processing algorithms were employed to enhance the spectral differences. Smoothing

eliminated the high-frequency noise from the instrument via averaging adjacent data

points. The second derivative transformation was regarded as the most straightforward

and robust method to reduce the background interference, to offset the baseline shift and

to separate overlapped absorption bands (Lin et al., 2004; O'Grady, Dennis, Denvir,

McGarvey, & Bell, 2001).

28

Selection of extraction solvent

To recover the pesticide residues, the extraction solvent should be miscible with TBZ, or

most of the pesticide to extent the method in other pesticide detection, and should be

Raman inactive. In this study, methanol and dimethyl sulfoxide (DMSO) were

investigated as extraction solvent.

The SERS spectra of different solvents are shown in Figure 1. As can be seen from

Figure 1, methanol shows a few minor peaks, thus it was selected.

Figure 1 Average SERS spectra (N=5) of silver dendrites, DMSO and methanol

Establishment of a calibration model of TBZ in methanol

TBZ powder was dissolved in methanol to make 1000 µg/mL (ppm) stock solution. The

stock solution was diluted to a series of concentrations (0.01 to 800 µg/mL) of TBZ in

29

water. 5 µL (~ 20 µg) AgD was added into 2 mL of TBZ solution and rotated under

constant speed for 4 min (Talboys Advanced Vortex mixer, speed 3000, auto model).

After the AgD settled down, we then pipetted 3 µL AgD and transferred it onto a

microscopic glass slide (25 mm X 75 mm). The AgD was air-dried in a fume hood at

room temperature for 10 min. The spectra of samples (N=5) were acquired by randomly

choosing 5 points on each AgD pile.

The spectral data at the different concentrations were analyzed by partial least squares

(PLS) method in the TQ analyst software to build the qualitative predictive model. The

five spectra at each concentration level were loaded into the TQ analyst software to

establish the calibration curve. Both the spectral information and the concentrations of

analytes were used in PLS to calculate the latent regression factors (Huang, Cavinato,

Mayes, Bledsoe, & Rasco, 2002).

The calibration model was validated by leave-one-out cross validation method, which

repeats the calibration by treating one piece of data from the data set as a prediction

sample each time (Naes, Irgens, & Martens, 1986). The validation was computed by the

software. The R2 (predicted against actual values) and the root mean square error of

prediction (RMSEP) were calculated to indicate the performance of the model. The

higher the R2, the closer the RMSEP is to zero, the better the model is.

30

Determination of the limit of detection of the SERS method for TBZ in methanol

To determine the LOD of the SERS method for TBZ in methanol, principal component

analysis (PCA) was employed to classify the samples according to different

concentrations.

PCA is a multivariate statistical technique to analyze a set of data representing

observations described by several dependent variables. This popular statistical technique

is widely used in the interpretation of infrared spectra by almost all scientific disciplines.

The data clusters shows the similarities or differences from multivariate data sets. In the

Raman spectra analysis, it has been proven to separate a Raman signal from a strong

fluorescence emission background (Takeshi Hasegawa, Nishijo, & Umemura, 2000).

Fluorescence associated with the instrument, sample or impurities, is a major interference

for Raman spectra (Angel et al., 1995). The metal substrates such as AgD we used for

SERS helps to suppress the fluorescence background to some extent (Guicheteau et al.,

2008). Besides, it is able to separate the overlapped spectra and capture minute signals

from a strong background, particularly when the band-widths of the target spectra to be

separated are largely different from each other (T. Hasegawa, 1999). Thus, it can be used

to quantitatively estimate a component’s concentration in a mixture.

The linearly uncorrelated variables called principal components (PC) reveals the

percentage of data variance. A higher percentage indicates larger data variance within the

PCA model. In PCA model, data clusters without overlapping indicate they are

31

significantly different. The LOB determined to be the lowest concentration could be

discriminated from the negative control.

To do the PCA using the TQ analyst software, first of all, we choose the discriminant

analysis which was a classification option. Then the constant path length was used. Each

of the sample names were entered into the Classes and then all the samples under the

classes were loaded in the next step. Secondly, the second derivative in the “Data

Format” section was selected and the Norris Derivative filter was employed at 5 segment

length and 5 gap between segments. All the spectrum regions were used in this study. By

clicking the drop down tab of “Diagnostics”, the software could calculate the Principal

Component Scores and bring up the PCA window.

Development of the surface-swab SERS method

A surface swab method was developed to extract and recover pesticide residues from the

apple surface. Initially cotton swabs were used but as they showed peaks due to residual

chemicals on the cotton, this was discontinued. Instead, polyester foam head swab sticks

(W x L: 0.4 x 1.0 in., CONTEC, SC) were selected in this study.

To remove unwanted residues such as wax, soil and chemicals, Veggie wash (Beaumont

Products, Inc., Kennesaw, GA) and tap water were tested to clean the apples. The steps of

Veggie wash were: first generously spray the apple surface with Veggie wash, then rub

for 30 s and rinse thoroughly with water for 2 min. The water clean step was to rinse the

32

apple surface thoroughly for 2 min. After comparing these two methods (data shown in

Appendix-A), we selected the water cleaning as it rinsed the unwanted chemicals and

saved time.

The apples were dried in the fume hood for 20 min. Then 300 mL of 10 ppm TBZ

solution (1:1 methanol and water) was prepared and filled into a 600 mL beaker. The

apples were immersed in the solution for 2 second to mimic the commercial pesticide

application procedure. The contaminated apples were then set in the fume hood until

completed dry (~ 30 min).

Effect of vortex time

In this study, we vortexed the centrifuge tube with swabbed swab head from 1 min to 5

min to determine the release of the pesticide residues from the swab head after

immerging the swab stick into 2 mL methanol. A 10 ppm TBZ solution was prepared and

distributed into five 5 mL tubes ((75 mm X 12 mm), Sarstedt, USA), 2 mL in each one.

Then the swab was dipped into each tube for 1 min. After that, the swab stick was taken

out and immersed in a new 5 mL tube with 2 mL methanol in it and vortexed at 1min, 2

min, 3 min, 4 min and 5 min. Finally, 5 µL of the dendrites were added to the tube and

vortexed for 5 s. After settling for 5 min, 3 µL AgD was sucked out from the bottom of

the tube using a 10 µL pipette and was deposited on a microscope slide and dried for 5

min. The Raman spectra were then read at 5 different locations on each AgD pile on the

slide.

33

Effect of AgD binding time

To optimize the AgD binding time with pesticide residues, we tested binding times of

0.08 min (5 s), 0.5 min, 2 min, 3 min, 4 min and 5 min under constant shaking speed (100

RPM, New Brunswick Scientific Co., Inc., New Brunswick, NJ). The swab method

followed the same procedure as the vortex time test except that the AgD binding time

was the variable.

Effect of sample swab area and swab time

To optimize the swab area needed to extract the pesticide off the apple, we tested one 2

cm X 2 cm square surface on each apple, 3 independent 2 cm X 2 cm square surfaces on

the same apple, and the whole apple surface. Firstly, we cut a 2 cm X 2 cm square out

from a parafilm. Then, the parafilm was pasted on an apple surface and the 2 cm X 2 cm

square on the center was swabbed. The same way was applied when we swabbed three

independent 2 cm X 2 cm squares on an apple surface. All the surfaces were swabbed for

1 min and the swab head was reversed every 15 s. For the optimization of the swab time,

the whole apple surfaces were swabbed for 1 min, 1.5 min and 2 min.

Then the swab stick was dipped into a 5 mL tube containing 2 mL methanol. The tube

was vortexed for 4 min with the swab stick. Then, the swab stick was taken out and 5 µL

of AgD were added to the 2 mL of methanol and shaken for 4 min. After settling for 5

min, 3 µL AgD was sucked out from the bottom of the tube using a 10 µL pipette and

was deposited on a microscope slide and dried for 5 min. The Raman spectra were then

34

read at 5 different locations on each AgD pile. Thus a total of 5 spectra were collected for

each swab time or area and averaged for the mathematical analysis.

All the parameters were optimized to fulfill the highest recovery within the shortest time.

The peak intensity at 785 cm-1 was used as a parameter to determine the extraction

efficiency.

Releasing factor

Assuming that all the pesticide residues on the apple surface could be recovered from the

swab, as the pesticide residue on the swab head may not release completely, a release

factor was used to represent the percentage of pesticide residues remaining on the swab

during the vortex step. 0.2 mL of 10 µg/mL TBZ solution was dropped on a clean glass

slide and dried. Triplicate studies were conducted on three clean glasses. The optimized

extraction method and SERS measurement were employed. Using the calibration model

the final TBZ concentration was acquired. In this way, the releasing factor was 66.6%

calculated by equation (1) below. The detailed raw data are shown in Appendix-D.

Releasing  factor =   !"#  !"#!$#%&'%("#  !"#$%  !"#$%&  !!/!"  ×!  !"!.!  !"  ×!"  !!/!"

× 100% (1)

Validation of the swab-SERS method on the apple surface

The EPA MRL for TBZ is 5.0 ppm (µg/g) by weight of apple, while the units we used are

in µg/mL. To build a solid method to meet the EPA requirement, it is important to

35

translate results to the ppm units based on the gram weight of the whole apple. The

average weight of the apples we used was approximately 200 g. Considering the 5 µg/g

(5 ppm) EPA MRL on the apples based on apple weight, there are 1 mg TBZ residues on

each apple surface (200 g x 5 µg/g = 1000 µg = 1 mg per a 200 g apple). This assumes

that diffusion into the apple is negligible. Assuming all of the pesticide residues are

recovered by the swab-SERS method, then 100% recovery of TBZ at the MRL in a 2 mL

solution is 500 µg/mL (1000 µg / 2 mL = 500 µg/mL). The translation formula is

Equation 2 below.

[TBZ concentration on apple] µg/g = [!"#  !"#!$#%&'%("#  !"  !"#$%&'(]  µ!/!"  ×  !  !"!""  !

(2)

TBZ is applied by dipping, spraying, or applying during the waxing procedure for apples.

To validate the method in real food matrices, we mimicked the real apple post-harvest

dipping procedure to intentionally contaminate the apple surface with TBZ at 0.1, 0.3, 3

and 5 ppm (µg/g) by weight of apple.

Firstly, we determined the surface uptake of the TBZ solution on apples by immersing

ten apples in a methanol water (1:1) solution for 2 s respectively, calculating the volume

difference of the solution and then dividing by ten. The average volume of the apple

surface uptake was 0.4 mL.

After that, we prepared the TBZ methanol and water (1:1) solution. Taking the 3 ppm for

example, the concentration of TBZ solution for dipping should be 1.5 mg/mL (0.03 X

36

200/ 0.4 mL = 1.5 mg/mL). The whole apple was dipped into 1.5 mg/mL TBZ solution

for 2 s, followed by air-drying in a fume hood for 20 min. Then the swab method was

applied to the apple. Five spectra were collected and analyzed by the PLS calibration

model to predict the final concentration. Triplicate tests (3 different apples) for each EPA

level were conducted and the average was used to calculate the recovery rate of the

method by equation (3). The accuracy of the swab-SERS method was calculated by

equation (4).

Recovery =   !"#$%&#!'(  !"#$%&'#$  !"#$%  !"/!  [!"#$%&  !"#$%]  !"/!

× 100% (3)

Accuracy =   !"#$%&#!'(  !"#$%&'#$  !"#$%    !"/![!"#$%&  !"#$%]    !"/!    ×  !"#"$%"  !"#$%&

× 100% (4)

Results and Discussion

LOD of SERS for TBZ in methanol

The typical SERS spectrum of 100 µg/mL TBZ in methanol enhanced by AgD is shown

in Figure 2. The TBZ molecule was bound on the AgD via the sulfur and nitrogen atoms.

The characteristic peaks at 1547, 1285, and 785 cm-1 were assigned to C=N stretching,

ring stretching, and C-H out of plane bending, respectively (Mak Soon Kim, Min Kyung

Kim, Chul Jae Lee, Young Mee Jung, & Mu Sang Lee, 2009).

37

Figure 2 The SERS spectra of 100 µg/mL TBZ in methanol

The spectrum of concentrations from 0 to 10 µg/mL TBZ in methanol solution was

collected and then analyzed, to determine the LOD of SERS for TBZ in methanol

(Appendix-C Figure 1 and Figure 2). The overlaid spectra after secondary derivative

transformation for the 1285 cm-1 peak is shown in Figure 3a. As seen, the Raman

intensity varied according to the TBZ concentration. PCA was utilized to analyze the

lowest concentration of this detection method. The Figure 3b I shows the data clusters for

different concentrations. There was a significant difference between the negative control

(0 µg/mL) and 0.01 µg/mL as no overlapping was between these two clusters. Thus, the

LOD of the TBZ in methanol was 0.01 µg/mL or 10 ppb, which was sufficiently sensitive

in the real situation of TBZ detection on apple surfaces given the EPA maximum.

38

Figure 3. Second derivative transformation of the SERS spectra for the 1285 cm-1 peaks

of TBZ of different concentrations (a), and the PCA plot of the SERS spectra of TBZ of

the low concentrations (b)

Effect of vortex time

According to the SERS peak assignment, peak intensity at 785 cm-1 wavenumber

according to C-H out-of plane bending is strongest at neutral pH among the characteristic

peaks we assigned (M. S. Kim, M. K. Kim, C. J. Lee, Y. M. Jung, & M. S. Lee, 2009).

The peak intensities at 785 cm-1 are shown in the Figure 4. As the vortex time increases,

the peak height increases from 2 min to 4 min. Also, the peak height is not significantly

different between a vortex time of 4 min and 5 min. Thus, to recover most TBZ residues

from the apple surface within the shortest time, 4 min was chosen as the vortex time. The

variations were likely caused by the manual swabbing procedure.

39

Figure 4 Peak heights at 784 nm-1 Raman shift under different vortex times. The peak

heights data is shown in Appendix-B Table 1.

Effect of AgD binding time

The AgD binding time was optimized in the same way as the vortex time. The results in

Figure 5 show the effect of different AgD-aptamer binding times on signal intensity. The

peak height increases and then levels out after the AgD binding time reaches 4 min.

Based on the peak intensity at 785 cm-1, 4 min was chosen as the optimized AgD binding

time.

0.00  

5.00  

10.00  

15.00  

20.00  

25.00  

1min   2min   3min   4min   5min  Raman  Intensity  of  784  peak  

(a.u.)    

Peak  heights    at  784  nm-­‐1  under    different    vortex  times  

40

Figure 5 Peak heights at 784 nm-1 Raman shift under different aptamer binding times. The

peak heights data is shown in Appendix-B Table 2.

Effect of sample swab area and swab time

The sample swab area and swab time was optimized on apple surface contaminated with

10 ppm TBZ solution. Figure 6 shows the effect of sample swab area on the signal when

the sample swab area was varied from 2 cm X 2 cm, 3 replicates of 2 cm X 2 cm,

swabbing on the same apple, and swabbing the whole apple surface. The results indicate,

within the swab times investigated, that the extraction efficiency increases with swab

area. The peak intensity at 785 cm-1 was used as the parameter to determine the extraction

efficiency. It is reasonable that more pesticide residues are captured in the larger apple

surface.

0.00  

4.00  

8.00  

12.00  

16.00  

20.00  

0.08  min   0.5  min   2  min   3  min   4  min   5  min  Raman  Intensity  of  784  

peak  (a.u.)  

Peak  heights  at  784  nm-­‐1  under  different  AgD  binding  times  

41

The sample swab times from 1 min to 2 min were evaluated in this study. As shown in

Figure 7 the peak intensity at 785 cm-1 increases as the swab time increases and then

decreases by increasing the swab time. The second derivative transformation of the 785

cm-1 peaks in Figure 8 also confirms the results. As shown, the spectra of 1.5 min and 2

min are overlapped. Additionally, the methanol on the swab head fully evaporated

approximately 1.5min, considering the short sample extraction time, we choose 1.5 min

as swab time.

Figure 6 Peak heights at 784 nm-1 Raman shift at different swab areas. The peak heights

data is shown in Appendix-B Table 2.

0.00  

1.00  

2.00  

3.00  

4.00  

5.00  

6.00  

7.00  

2x2cm   3x2x2cm   Whole  apple  

Raman  Intensity  of  784  

peak  (a.u.)    

Peak  heights  at  784  nm-­‐1at  different  swab  areas                  

42

Figure 7 Peak heights at 784 nm-1 Raman shift under different swab times. The peak

heights data is shown in Appendix-B Table 4.

Figure 8 Second derivative transformation of the SERS spectra for the 785 cm-1 peaks

under different swab times.

0.00  

2.00  

4.00  

6.00  

8.00  

10.00  

12.00  

1min   1.5min   2min  Raman  Intensity  of  784  peak  

(a.u.)    

Peak  heights  at  784  nm-­‐1  under  different  swab  times    

43

Thus, the optimized surface swab procedure was: firstly, the whole apple surface was

swabbed for 1.5 min using a methanol pre-soaked polyester swab. Then the swab stick

was dipped into a 5 mL tube containing 2 mL methanol. The tube was vortexed for 4 min

with the swab stick and the swab stick was taken out. Last, 5 µL of AgD were added to

this tube and incubated at 100 RPM constant shaking for 4 min. In this way, the pesticide

residue on the apple surface was extracted by methanol first, then dissolved into methanol

and captured by the AgD. After settling down on the bottom of the centrifuge tube, 3 µL

of the AgD pellet was deposited onto a glass slide and dried for 5 min at room

temperature before Raman measurement.

Establishment of calibration model and validation model

A calibration model was constructed by PLS using SERS measurement of TBZ solutions

from 0 to 100 µg/mL. The five spectra at each concentration level were loaded into the

TQ analyst software to establish the calibration curve. The average spectra were shown in

Appendix-C Figure 3. A good correlation coefficient 0.977 with the RMSEC 7.49 is

found between the actual values and the calibrated values (Figure 9a). The “leave-one-out”

validation method was then used to do self-validation. The RMSECV is 7.75 and the

correlation coefficient is 0.975 (Figure 9b). The low value of RMSEC and RMSECV, the

high value of these two correlation coefficients (close to 1) and the close values between

the calibration model and validation model indicate a reliable calibration model.

44

Prediction of the TBZ residues was based on the calibration model in the following

studies.

Figure 9 PLS plots of the calibration model (a) and the validation model (b)

45

Validation of the swab-SERS method on the apple surface

The validation studies were conducted at the final concentrations of 5, 3 and 0.3 and 0.1

ppm (µg/g per weight). For each concentration, 3 apples were dipped into the pesticide

solution for swab-SERS analysis. The secondary derivative spectra were shown in

Appendix E. The results are shown in table 1. According to equation (3), the average

recoveries of the surface swab were calculated to be 59.4 to 76.7%. When considering

the loss of pesticide residues during the vortex step, the final accuracy of the swab-SERS

method was calculated to be 89.2 to 115.4% using the equation (4). Even at the lowest

tested concentration, 0.1 ppm, the accuracy was 90%. The variance was likely caused by

the manual swab procedure, nevertheless, the quantification would likely be good enough

to trigger a more precise follow-up analysis in the case where the predicted value exceeds

the maximum allowed level of 5 ppm set by the EPA. The reliability of the calibration

model and the swab-SERS method were validated by these results.

46

Table 1 Prediction and recovery of TBZ from apple using the swab-SERS method

Spiked value on apple

Predicted value in solution

Translated predicted value

Recovery from swab

Translated predicted value / releasing factor

Accuracy

(ppm, µg/g per weight)

(ug/mL) (ppm, µg/g per weight)

(%) (ppm, µg/g per weight)

(%)

5 297.2 ± 7.2 2.97 ± 0.07 59.4% 4.46 ± 0.11 89.2% 3 178.8 ± 40.8 1.79 ± 0.41 59.7% 2.80 ± 0.64 90.0% 0.3 23.0 ± 10.0 0.23 ± 0.10 76.6% 0.35 ± 0.16 115.4% 0.1 6.0 ± 0.35 0.06 ± 0.00 60.0% 0.09 ± 0.00 90%

47

Chapter 4 Aptamer Based SERS Detection Method

Materials and Methods

Materials

Acetamiprid was purchased from Sigma-Aldrich (Sigma-Aldrich, Co., St Louis, MO,

USA), and PBS, MCH, ME were purchased Fisher Scientific Inc. (Fisher Scientific, NJ,

USA). The aptamer, TE buffer and TCEP were purchased from Integrated DNA

Technologies, Inc. (IDT, Coralville, IA, USA).

Aptamer and AgD preparation

The acetamiprid DNA aptamer was created using SELEX strategy by He et al (2011).

The final product had a sequence of 5’-TGT AAT TTG TCT GCA GCG GTT CTT GAT

CGC TGA CAC CAT ATT ATG AAG A -3’ and a dissociation constant of Kd = 4.98

µM. The target-binding region of the selected aptamer was predicted to be the loops

formed by the random sequence (J. A. He, Liu, Fan, & Liu, 2011). The sequence was

provided to Integrated DNA Technologies to obtain a thiol-tethered aptamer at the 5’ end.

To protect it from degradation, the received aptamer gel was dissolved in a 1xTE buffer

(10 mM Tris pH 8.0 and 0.1 mM EDTA) to give a stock concentration of 100 µM. The

stock solution was distributed into 2 ml micro-centrifuge tubes with 50 µl in each micro-

centrifuge tube and storage at -20 °C.

48

Prior to the analysis, 50 µl of aptamer stock solution, 5000 µM 100 µl Tris (2-

carboxyethyl) phosphine hydrochloride (TCEP) (final Ap and TCEP concentration ratio

was 1:100) were then added into 850 µl TE buffer to make the aptamer solution and

incubated for 20 min in order to reduce the disulfide (S-S) to thiol (SH) groups. The

TCEP cleaves those bonds to assure maximum capture ability.

The same AgD preparation method was used as described in Chapter 3, AgD preparation.

Before using the AgD, it was washed with 400 µl DD water, followed by 500 µl TE

buffer for three times. Then 100 µl washed AgD was dispersed in the aptamer solution.

The aptamer-AgD mixture was incubated at 4 °C at 10 RPM (Tube rotator, Fisher

Scientific International, Inc., Hampton, New Hampshire) overnight to allow the aptamer

to conjugate on the AgD surface through Ag-thiol covalent binding. After incubation, the

conjugates were centrifuged for 5 min at 14000 g (Centrifuge 5418, Eppendorf,

Hamburg, Germany) and washed three times with 500 µl DD water at room temperature.

The conjugates were dispersed in 100 µl DD water and stored at 4 °C until use.

49

Blocking the non-specific binding on the AgD surface

To select the optimal blocking agent, BSA, ME and MCH were investigated. BSA, a

serum albumin protein, is commonly employed in ELISA, immunoblots and

immunohistochemistry as a blocking agent.

Ten µl AgD were mixed with 200 µl of following solutions: 4 mM phosphate buffered

saline (PBS) (1 mM KH2PO4, 3 mM Na2HPO4.7H2O, 155mM NaCl, pH 7.4) containing

3% g/ml BSA; 1000, 100, and 1 µM ME in DD water; 1000, 100, 1 µM MCH in DD

water, respectively. After incubating for 1 h at room temperature at 200 RPM (Tube

rotator, Fisher Scientific International, Inc., Hampton, New Hampshire) (Herne & Tarlov,

1997), the conjugates were centrifuged at 14000g for 5 min at room temperature and

washed three times with 1000 µl DD water prior to the analysis.

Detecting acetamiprid using aptamer-AgD complex

The acetamiprid powder was dissolved in DD water to make a stock solution and then

diluted to give levels of 1000 to 10 µg/mL (ppm). 100 µl of each pesticide solution was

then added to a 2 mL vial containing the Aptamer-AgD complex. This was incubated at

room temperature for 1h at 200 RPM on rotator (Tube rotator, Fisher Scientific

International, Inc., Hampton, New Hampshire). The solution was decanted and then the

dendrite complex was washed with 1000 µl DD water three times. The supernatant was

50

then decanted and the complex was deposited on the gold covered microscope slide

(Thermo Scientific, Waltham, MA) for SERS measurement.

Improvement of the surface swab method

To further validate the surface swab method, a UV-vis spectrophotometer (Cary 50

SCAN, Varian, Walnut Creek, CA) was utilized as a reference detection method. The

detection was done at λmax 245 nm (Gupta, Gajbhiye, & Gupta, 2008; Khan, Haque, Mir,

Muneer, & Boxall, 2010) at 1 s average measurement time with 1 cm quartz cells at room

temperature. The data was collected by Simple Reads Setting software (version 5.0.0.999,

Cary 50 SCAN, Varian, Walnut Creek, CA). Absorbance at 245 nm at concentrations

from 0 ppm to 1000 ppm acetamiprid solution in water was measured to build the

standard curve. After testing each sample, the quartz cell was rinsed 3 times by water and

then rinsed 3 times by methanol. The raw data are in Appendix F.

To select the desirable standard curve for this assay, the four- and five-parameter logistic

model (5PL) were compared. The 5PL equation is expressed as Equation (5) below.

𝑦 = 𝑑 + !!!

[!! !!

!]!

(5)

Where:

a: estimated absorbance at zero concentration

51

b: slope factor

c: the concentration that give half-maximal effects

d: estimated absorbance at infinite concentration

g: asymmetry factor

Based on the previous study, the recovery of pesticide residues from the swab into the

solvent is the major concern for the target loss. Since the aptamer-based test included 1 h

incubation of the pesticide solution and aptamer-AgD complex, our refined method was

to leave the swab head in the micro-centrifuge tube to increase recovery of the pesticide

residues. The same polyester foam head swab sticks (W x L: 0.4 x 1.0 in., CONTEC, SC)

as described in Chapter 3 was used in this study.

Instead of pre-soaking the swab in methanol, a given certain amount (0 µL, 100 µL, 200

µL, 300 µL, 400 µL) of extraction solvent (water or methanol: water 1:1 solution) was

injected onto the swab stick head and dry swab method was also investigated. 0 µL

solvent meant dry swabbing. Too much extraction solvent may result in residue lost on

the sample surface. As the volume increased to 400 µL, the liquid might drop from the

swab. Thus, 400 µL was the maximum volume the swab could take.

The optimization was conducted on clean glass slide to mimic the fruit surface. 100 µL of

200 ppm acetamiprid solution was dropped, spread on a glass slide (25 mm X 75 mm)

52

and dried by air in the fume hood. The slide was swabbed 1.5 min by the swab stick with

different amount of extraction solvent. Then the swab stick was removed and the swab

head was remained in the 2 mL micro-centrifuge tube in order to let the pesticide residues

on the swab head fully dissolved in 1 mL DD water by vortexing for 4 min. After that,

the solution was ready to do the UV-vis measurement.

The developed method was validated in terms of its recovery rate and reproducibility.

Reproducibility determines the variation between replicate in the same assay (intra assay

variability) and in different assays (inter-assay variability) and represented by the

coefficient of variation (CV).

The validation step was also conducted on a glass slide at 20 ppm level of acetamiprid

solution with the optimized swab method. The recovery rate was calculated by equation

(6). The final solution was calculated by the standard curve established in the same day.

Each sample (glass slide surface) was analyzed twice a day and the assay was repeated on

five different days. The intra-assay variability was computed as the CV among the

replicates of each sample. The inter-assay variability was calculated among the five

individual measurement for the same samples conducted on different days. The pooled

standard curve (Sp) was calculated using the equation (7) and the pooled mean (Xp) was

calculated by the equation (8). The intra-assay and inter-assay CVs were calculated by

equation (9).

53

Recovery  rate   =   !"#$%"&'(&  !"  !"#$%  !"#$%&"'  !"#$%"!&'(  !"  !"  !!"  !"#$%  !"#$%&"'

× 100% (6)

S𝑝 = [ (𝑑𝑓𝑖×𝑆𝑖!!!! )/ 𝑑𝑓𝑖!

!!! ] (7)

X𝑝 = [ (𝑑𝑓𝑖×𝑋𝑖!!!! )/ 𝑑𝑓𝑖!

!!! ] (8)

Where Si is the individual standard deviation, Xi is individual mean, and df is the degree

of freedom which is n-1 here.

𝐶𝑉 % = (S𝑝 X𝑝)×100 (9)

Raman instrumentation and Data analysis

The same Raman measurement parameters were selected as the study described in Data

analysis section in Chapter 3. An average of 30 spectra were collected using the mapping

function in the Omnic for Disperive Raman software (Thermo Fisher Scientific, Madison,

WI) for each AgD pile.

GraphPad Prism for Windows (version 5.04, GraphPad Software, La Jolla, CA, USA)

was used to analyze the UV-vis data and SERS data. ANOVA was performed and P <

0.05 was considered to be statistically significant.

54

Results and Discussion

Blocking non-specific binding on the AgD surface

The basic idea of this aptamer-SERS biosensor is to conjugate the substrate surface with

the aptamer first. Then, the blocking agent is introduced to cover the non-specific binding

sites on the AgD surface. Because aptamers typically bind on the surface of AgD via the

thiolated 5’ end with three-dimensional configuration, there are empty sites between the

aptamers on the substrate surface that could be covered by the interference from the

sample extraction solution. The interference signal would likely make the spectra

interpretation unclear. By introducing a blocking agent, any binding except the

recognition binding between aptamer and acetamipirid is inhibited. After conjugating the

aptamer and blocking agent, the AgD pellets are used to capture the target analyte from

complex food matrices. Figure 10 illustrates the schematic representation of the aptamer-

blocking agent-AgD construction.

55

Figure 10 Schematic representation of the apatmer-blocking agent-AgD fabrication.

There are several criteria for an appropriate blocking agent for this assay. First of all, the

blocking agent molecule should be able to adsorb on the surface and the subsequently

formed layer should not interact with the binding sites of the aptamer or interfere with the

aptamer configuration. Both MCH and ME have the same or shorter carbon chain length

than the methylene group spacer in the HS-aptamer, thus hybridization reactions with

aptamers should not occur (Herne & Tarlov, 1997). However, BSA is large molecule

with a molecular weight of 65.5 kDa. Using it could influence the three-dimensional

shapes of the aptamer. In addition, it is important that the blocking agent not interact or

be replaced by the target or other interfering molecules. Otherwise, the blocking agent

will be useless and the specificity of the assay is going to be weak.

Several assays use MCH to block nonspecific sites (L. Fan, Zhao, Shi, Liu, & Li, 2012;

Herne & Tarlov, 1997). Besides the reason discussed before, MCH (ME) was also

predicted to avoid the nitrogen containing nucleotides interaction with the substrate

surface (Herne & Tarlov, 1997). It was proven that the DNA molecules interact with the

nanoparticle surfaces through both the nitrogen atom of the imidazole or the pyrimidine

ring and the sulfur atom of the thiol group (Herne & Tarlov, 1997; Jang, 2002). The

56

desirable aptamer three-dimensional conformation changes in this way. After treated with

MCH, the nucleotide bases of DNA molecules do not interact with the surface.

To test the blocking agent, ME and MCH was conjugated to AgD surface without

involving aptamer. As seen in Figure 11A, the spectra pattern of AgD+ME and

AgD+MCH doesn’t change after adding our target acetamiprid. Thus, the ME and MCH

are able to cover the whole surface of the AgD and are not breplaced by any actamiprid

molecules. However, when malathion is added as a possible inference from the sample as

shown in Figure 11B, the spectra changes immensely for both ME and MCH. The peaks

at 1720 cm-1, around 650 cm-1 and the bands between 700 and 800 cm-1 are assigned to

the carbonyl group, the P=S group and the P-O-C stretching from the malathion

respectively (Spencer, Sylvia, Clauson, Bertone, & Christesen, 2004; Tanner & Leung,

1996). In this way, ME or MCH can not be appropriate blocking agents as they may be

replaced by other molecules such as malathion.

Further studies are needed to investigate the coverage of oligonucleotides on the substrate

surface with thiol-tagged oligonucleotides based on the fluorescence method (Demers et

al., 2000). By quantitation of the fluorophore-labeled oligonucleotides, we would be able

to determine whether the target pesticide replaces the oligonucleotide on the surface. In

addition, to increase the specificity, functionalized SERS substrates with aptamers can be

used for amplified optical detection in this method in the sandwich configuration in any

further studies.

57

Figure 11 A: Raw spectra (N=30) of AgD fully covered by 100 µM ME; AgD-ME

complex incubated in 1000 ppm Acetamiprid; AgD fully covered by 100 µM MCH;

58

AgD-MCH complex incubated in 1000 ppm Acetamiprid. B: Raw spectra of AgD-

ME/MCH complex incubated in 100 ppm malathion

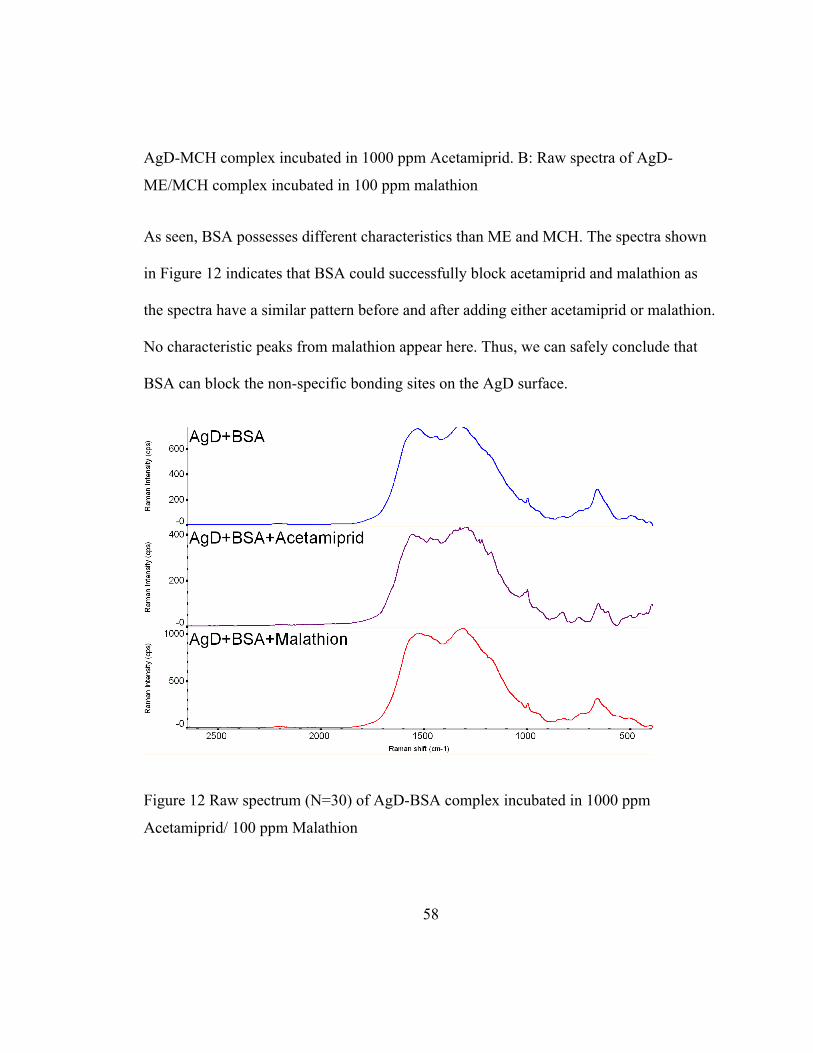
As seen, BSA possesses different characteristics than ME and MCH. The spectra shown

in Figure 12 indicates that BSA could successfully block acetamiprid and malathion as

the spectra have a similar pattern before and after adding either acetamiprid or malathion.

No characteristic peaks from malathion appear here. Thus, we can safely conclude that

BSA can block the non-specific bonding sites on the AgD surface.

Figure 12 Raw spectrum (N=30) of AgD-BSA complex incubated in 1000 ppm

Acetamiprid/ 100 ppm Malathion

59

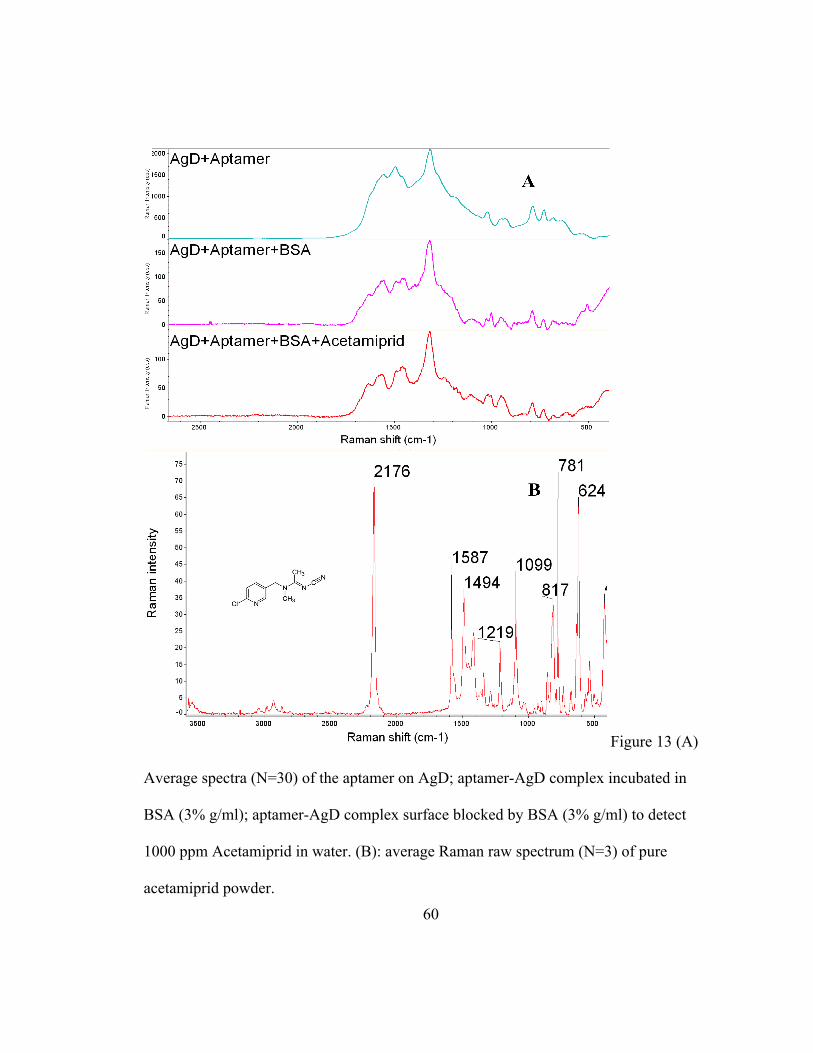
Determination of acetamiprid using a aptamer-AgD complex

Based on the previous study, BSA can block the AgD surface. Thus, the following study

used the AgD-aptamer-BSA complex to capture acetamiprid residues. As shown in

Figure 13A, the highest peak at 1316 cm-1 is assigned to the Stokes modes of adenine

(Barhoumi, Zhang, Tam, & Halas, 2008; Bell & Sirimuthu, 2006) which means the

aptamer successfully binds to the AgD surface. After the blocking agent (BSA) is added,

this peak intensity drops tremendously from 2000 to 160. This is due to the covering of

the blocking agent that reduces the nucleotide bases interaction with the substrate surface

(Herne & Tarlov, 1997).

However, when using the AgD-Aptamer-BSA complex to capture actamiprid residue, no

peaks from actamiprid appear. The SERS spectra pattern and intensity before and after

capturing acetamiprid (1000 ppm) look the same. The bands at 2176 cm-1 or 624 cm-1

band shifts from acetamiprid in the normal Raman spectra (Figure 13B) do not occur in

the SERS spectrum of AgD+Aptamer+BSA+Acetamiprid or overlap with

AgD+Aptamer+BSA.

60

Figure 13 (A)

Average spectra (N=30) of the aptamer on AgD; aptamer-AgD complex incubated in

BSA (3% g/ml); aptamer-AgD complex surface blocked by BSA (3% g/ml) to detect

1000 ppm Acetamiprid in water. (B): average Raman raw spectrum (N=3) of pure

acetamiprid powder.

61

Several reasons could explain why the acetamipird peaks do not appear. One possibility

is that the large molecular size of BSA affects the three-dimensional shape of the aptamer

structure, resulting in an ineffective aptamer configuration or blocking the binding sites

of the aptamer. Generally, there are two major categories of configuration: single-site

binding and dual-site binding. For small molecular targets such as pesticides, studies

based on nuclear magnetic resonance (NMR) have indicated the aptamer structures bury

the target via the binding pockets, leaving little room for the target to interact with a

second molecule. Thus, small molecule biosensors are often assayed with the single-site

binding configuration (Hermann & Patel, 2000; Stojanovic & Landry, 2002). It is

possible that BSA only blocks the o binding site. To develop a better biosensor, it would

be more useful to figure out the recognition modes of each aptamer- target pair.

Another possible reason is the low affinity of the aptamer in this assay. The selected

aptamer reported the Kd value of 4.98 µM (J. A. He et al., 2011), in the range of the

typical Kd for small molecule targets. An electrochemical impedance spectroscopy

method using this aptamer has been built which further proves high selectivity and

affinity of this aptamer. In that study, the aptamer was immobilized on the bare gold

electrode surface via cycle voltammetry (L. Fan et al., 2012). However, aptamer affinity

varies considerably depending on sample properties such as ionic strength and pH

(Hianik, Ostatná, Sonlajtnerova, & Grman, 2007). To maintain the highest binding

affinity of the aptamer, selected buffers will need to be investigated.

62

Aptamers in the solution are also able to bind any small complementary oligonucleotide

and form a DNA/DNA duplex structure (Nutiu & Li, 2003). This could also be the

reason why the aptamer didn’t work. The target-capture rates and the duplex formation

are dependent on the DNA density on the substrate surface. The density can be controlled

by the aptamer-AgD exposure time, solution ionic strength, or by applying an attractive

electrostatic field to assist the immobilization of DNA (Peterson, Heaton, & Georgiadis,

2001). The other strategy would be to switch the DNA/DNA duplex into the DNA/target

complex is to engineer several fluorescent reporters for DNA aptamers (Nutiu & Li,

2003). However, the fluorescent reporter as a part of the signal transductionis costly and

complicated to construct (Niemeyer & Blohm, 1999).

Improvement of the surface swab method

Acetamiprid detection standard curve

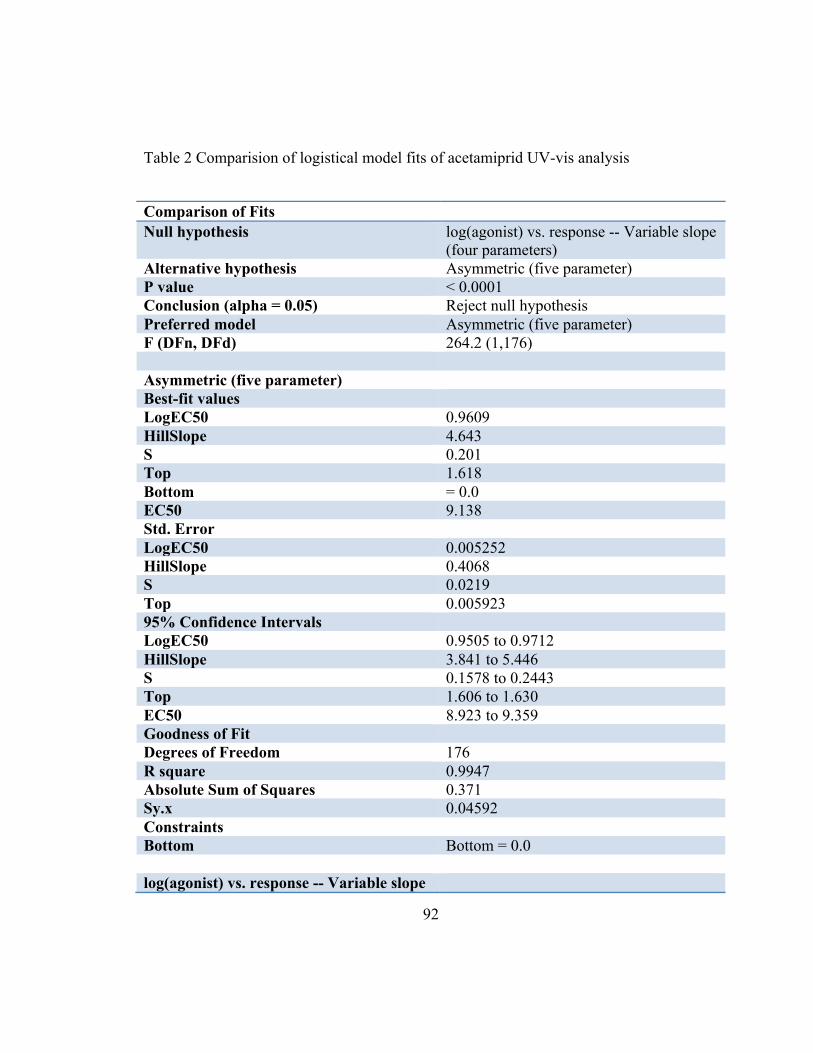
The standard derivative was calculated based on absorbance at 245 nm vs concentration

(0 ppm to 1000 ppm) for 10 days of replicates. The raw data and the analysis results are

shown in Appendix-F. Both the four- and five parameter logistical model were computed

and the five-parameter logistical model was selected to establish the standard curves as it

had the higher r2 (Figure 14). The value r2 (0.9947) quantifies goodness of fit. The actual

concentration of residues in the samples and efficiency of the extraction method was

determined using this standard curve.

63

Figure 14 Average UV-vis standard curve (N=10) of absorbance change at 245 nm at

different concentrations of acetamiprid in DD water.

Optimization of the pre-soak extraction solution volume

The results of different pre-soak volume recovery rates are shown in Figure 15. The

lower recovery rate of the dry swab method as compared to other extraction volumes

indicates its inefficiency. As the volume increases, the recovery rate goes down because

the solution remains more on the glass slide with pesticide residues in it. The high

recovery of 100 and 200 µL indicates the extraction volume is sufficient. Based on the

unpaired t test with Welch's correction, there is no significant difference (P < 0.05, see

Appendix-G). 100 µL was selected as presoak extraction volume.

64

Figure 15 Recovery rates of acetamiprid residues from a glass slide at extraction solvent

volumes of 0 µL, 100 µL, 200 µL, 300 µL and 400 µL.

Selection of extraction solution

To maintain the aptamer secondary structure configuration and its stability, 100%

methanol was used as was done in the previous study (Chapter 3 establishment of a

calibration model of TBZ in methanol). This was found to not be possible. Thus a water

and 50% method solution were investigated.

0

20

40

60

80

100

0 100 200 300 400

Rec

over

y ra

te (%

)

Presoak Volume (mL)

Recovery rate (%) of differnet presoak volumes

65

Figure 16 Recovery rates of water and 50%water/50% methanol as the e solution to

extract the acetamiprid residues from the glass slide.

The results are shown in Figure 16. The 50% 50% indicates a slightly higher recovery

rate (87.6 % ± 1.3 %) than the pure water (85.9 % ± 4.8%). Based on the one-way

ANOVA, there is no significant difference (P =0.686 > 0.05). While 100% water keeps

the method simple, in real food matrices such as an apple surface, it might not work well.

Thus, the 50% methanol solution is selected as our extraction solution.

0 10 20 30 40 50 60 70 80 90

100

Water 50% methanol

Rec

over

y ra

te (%

)

Recovery rate (%) of two different solvents

66

Figure 17 Illustration of the surface swab method

Thus procedure of the surface swab method is: 100 µL of 50% methanol/50% water

solution is added into swab head. The fruit surface or the glass surface is swabbed for 1.5

min and then the swab is placed into 1 mL water in a 2 mL micro-centrifuge tube. The

swab stick is cut and the micro-centrifuge tube is vortexed for 4 min with the swab head

inside to maximize the extraction.

The surface swab method was validated by capturing 20ppm actamiprid solution on a

glass slide surface for five days with replicates. The results were presented in Table 2.

The recovery rate of this method is 90.6 % ± 1.4 % (n=5) calculated by equation (6). This

assay had a low intra- and inter-assay CV (< 5 %) which indicated good reproducibility.

The method should be validated at other concentration levels in the future. Additionally,

this method can be coupled with aptamer-SERS to quantify the pesticide amount on the

fruit surface and the assay reproducibility can be validated in the same way presented.

67

Table 2 CV of the surface swab method to capture 20 ppm actamiprid on glass slide

Day Absorbance Xi Si Intra Assay CV %

Inter Assay CV %

1 1.3561 1.3559 0.0003 0.0209 0.0581 1.3557  

2 1.2164 1.2158 0.0008 0.0698  1.2152  

3 1.1879 1.1880 0.0001 0.0119  1.1881  

4 1.2637 1.2627 0.0013 0.1064  1.2618  

5 1.2303 1.2304 0.0001 0.0115  1.2305  

68

Chapter 5 Conclusion

In this thesis we present two type of SERS methods for pesticide detection. Overall, these

methods are based on Quick, Easy, Cheap, Effective, Rugged and Safe, which is

“QuEChERS” method for pesticide detection. The first direct TBZ detection procedure

uses a surface swab method as sample extraction technique followed by SERS detection.

The method specificity is reached by distinct Raman fingerprint peaks. The other method

is an indirect SERS method using an aptamer as a biosensor. This method enhances the

specificity as well as the Raman spectral fingerprints. Based on the study presented, the

null hypothesis is proven to be not true. The developed method for the analysis of

pesticides in fresh fruit surface can result in short duration sample analyses, significant

reductions in solvent usage and hazardous waste production, and fairly quantitative to

meet the US Government regulatory agencies requirements.

Summary of Methods

The Swab-SERS method

When apple samples from farms, fruit brokers or distribution centers are needed to be

test, the amount of TBZ on the apple surface can be determined by a swab-SERS method.

Briefly, the whole outer surface of the apple is swabbed for 1.5 min with a polyester swab

presoaked with methanol. The swab is then immersed into 2 ml of methanol and vortexed

for 4 min to release the pesticide residues into the solution. Released pesticide residues

69

are mixed with AgD for 4 min. Then the AgD are deposited onto a glass slide and dried

for 1 minute in a hood before Raman measurement. The total analytical time is about 11

min. The procedure could be scaled up if there are a large amount of samples.

The acquired spectrum can be loaded in the software with a calibration model established

before and analyzed automatically by a programmed method in a second. A specific

calibration model for different analyzed matrices can be created and pre-loaded on the

devices or software to make the onsite data analysis possible.

The Aptamer based SERS method

This method is developed to analyze acetamiprid on fruit surfaces especially pome fruits.

After an appropriate blocking agent is selected, the aptamer-blocking agent AgD complex

can be prepared and stored at 4 °C until the time of analysis. As the overnight incubation

steps are time-consuming, this saves time. The sample surface is swabbed by a polyester

swab for 1.5 min with 100 µM 50% methanol/50%water and the swab stick is placed into

a micro-centrifuge tube. The tube with the swab head is vortexed 4 min to make the

sample extraction solution. The complexes are simply added into the sample extraction

solution, vortexed and sampled for Raman measurement. The established calibration

curve and the programmed data analysis method would lead to an analysis in a very short

time.

70

Future Studies

Feasibility of using a portable Raman instrument

Since the final goal is to develop a rapid and easy method for agricultural monitoring, the

capability of on-site detection is crucial. Further investigation as to whether the portable

Raman can be utilized and retain its sensitivity and selectivity. A portable Raman is much

less costly and suitable for on-site detection. Compared to the state-of-the-art Raman

instrument, due to the low resolution and the coarse adjustment on the instrument, spectra

from the portable Raman probably show a larger variance (L. L. He, B. Deen, et al.,

2011).

Multi-residual detection development

Given the success of the present the swab-SERS detection method on the apple surface, it

is important to test the feasibility of detecting simultaneously multiple pesticides in food

matrices. The preliminary data has shown the method is able to detect both TBZ and

diphenolaminde (DI). With further investigation and development, it is believed a multi-

analyte detection method can be applied to food matrices.

71

Figure 18 SERS spectra of DI, TBZ and their mix (1:1)

Selection of the blocking agent and immobilized the aptamer on AgD

The aptamer and blocking agent immobility on AgD should be further investigated and

the method needs to be modified. The other pesticide aptamer can be tested coupled with

BSA as a blocking agent to exclude the possibility of an unworkable acetamiprid

aptamer. More blocking agents can be investigated to select a proper one.

72

Chapter 6 References Cited

Akiyama, Y., Yoshioka, N., & Tsuji, M. (2002). Pesticide residues in agricultural products monitored in Hyogo Prefecture, Japan, FYs 19951999. Journal of Aoac International, 85(3), 692-703.

Alvarez, M., Calle, A., Tamayo, J., Lechuga, L. M., Abad, A., & Montoya, A. (2003). Development of nanomechanical biosensors for detection of the pesticide DDT. Biosensors & Bioelectronics, 18(5-6), 649-653. doi: Doi 10.1016/S0956-5663(03)00035-6

Angel, S. M., Carrabba, M., & Cooney, T. F. (1995). The utilization of diode lasers for Raman spectroscopy. Spectrochimica Acta Part a-Molecular and Biomolecular Spectroscopy, 51(11), 1779-1799. doi: Doi 10.1016/0584-8539(95)01443-X

Balamurugan, S., Obubuafo, A., Soper, S. A., & Spivak, D. A. (2008). Surface immobilization methods for aptamer diagnostic applications. Analytical and Bioanalytical Chemistry, 390(4), 1009-1021.

Barhoumi, A., Zhang, D., Tam, F., & Halas, N. J. (2008). Surface-enhanced Raman spectroscopy of DNA. Journal of the American Chemical Society, 130(16), 5523-5529.

Bell, S. E. J., & Sirimuthu, N. M. S. (2006). Surface-enhanced Raman spectroscopy (SERS) for sub-micromolar detection of DNA/RNA mononucleotides. Journal of the American Chemical Society, 128(49), 15580-15581. doi: Doi 10.1021/Ja066263w

Betz, J. F., Cheng, Y., & Rubloff, G. W. (2012). Direct SERS detection of contaminants in a complex mixture: rapid, single step screening for melamine in liquid infant formula. Analyst, 137(4), 826-828.

Blažková, M., Rauch, P., & Fukal, L. (2010). Strip-based immunoassay for rapid detection of thiabendazole. Biosensors and Bioelectronics, 25(9), 2122-2128.

Brandon, D. L., Binder, R. G., Bates, A. H., & Montague, W. C. (1992). A monoclonal antibody-based ELISA for thiabendazole in liver. Journal of Agricultural and Food Chemistry, 40(9), 1722-1726.

Bruno, J. G., & Kiel, J. L. (1999). In vitro selection of DNA aptamers to anthrax spores with electrochemiluminescence detection. Biosensors and Bioelectronics, 14(5), 457-464.

Bushway, R. J. (1996). Complementation of direct-injection high-performance liquid chromatography and enzyme-linked immunosorbent assay for the analysis of thiabendazole in fruit juices and concentrates. Journal of Chromatography A, 754(1), 431-435.

Ciesiolka, J., Gorski, J., & Yarus, M. (1995). Selection of an Rna Domain That Binds Zn2+. Rna-a Publication of the Rna Society, 1(5), 538-550.

73

Cifuentes, A. (2006). Recent advances in the application of capillary electromigration methods for food analysis. Electrophoresis, 27(1), 283-303. doi: DOI 10.1002/elps.200500474

commodity apples (2013). http://www.agmrc.org/commodities__products/fruits/apples/commodity-apples/

Cui, Z. M., Han, C. P., & Li, H. B. (2011). Dual-signal fenamithion probe by combining fluorescence with colorimetry based on Rhodamine B modified silver nanoparticles. Analyst, 136(7), 1351-1356. doi: Doi 10.1039/C0an00617c

Demers, L. M., Mirkin, C. A., Mucic, R. C., Reynolds, R. A., Letsinger, R. L., Elghanian, R., & Viswanadham, G. (2000). A fluorescence-based method for determining the surface coverage and hybridization efficiency of thiol-capped oligonucleotides bound to gold thin films and nanoparticles. Analytical Chemistry, 72(22), 5535-5541.

Ellington, A. D., & Szostak, J. W. (1990). Invitro Selection of Rna Molecules That Bind Specific Ligands. Nature, 346(6287), 818-822. doi: Doi 10.1038/346818a0

Code of Federal Regulations (CFR) (2005). Famulok, M., Mayer, G., & Blind, M. (2000). Nucleic acid aptamers from selection in

vitro to applications in vivo. Accounts of Chemical Research, 33(9), 591-599. Fan, C., Hu, Z., Mustapha, A., & Lin, M. (2011). Rapid detection of food-and waterborne

bacteria using surface-enhanced Raman spectroscopy coupled with silver nanosubstrates. Applied Microbiology and Biotechnology, 92(5), 1053-1061.

Fan, L., Zhao, G., Shi, H., Liu, M., & Li, Z. (2012). A highly selective electrochemical impedance spectroscopy-based aptasensor for sensitive detection of acetamiprid. Biosensors and Bioelectronics.

Fang, J. X., Ding, B. J., Song, X. P., & Han, Y. (2008). How a silver dendritic mesocrystal converts to a single crystal. Applied Physics Letters, 92(17). doi: Artn 173120

Doi 10.1063/1.2888770 Fang, J. X., You, H. J., Zhu, C., Kong, P., Shi, M., Song, X. P., & Ding, B. J. (2007).

Thermodynamic and kinetic competition in silver dendrite growth. Chemical Physics Letters, 439(1-3), 204-208. doi: Doi 10.1016/J.Cplett.2007.03.046

Geiger, A., Burgstaller, P., von der Eltz, H., Roeder, A., & Famulok, M. (1996). RNA aptamers that bind L-arginine with sub-micromolar dissociation constants and high enantioselectivity. Nucleic acids research, 24(6), 1029-1036.

Gold, L., Polisky, B., Uhlenbeck, O., & Yarus, M. (1995). Diversity of oligonucleotide functions. Annual review of biochemistry, 64(1), 763-797.

Guicheteau, J., Argue, L., Emge, D., Hyre, A., Jacobson, M., & Christesen, S. (2008). < i> Bacillus</i> Spore Classification via Surface-Enhanced Raman Spectroscopy and Principal Component Analysis. Applied Spectroscopy, 62(3), 267-272.

74

Gupta, S., Gajbhiye, V., & Gupta, R. (2008). Effect of light on the degradation of two neonicotinoids viz acetamiprid and thiacloprid in soil. Bulletin of Environmental Contamination and Toxicology, 81(2), 185-189.

Guthrie, J. W., Hamula, C. L., Zhang, H., & Le, X. C. (2006). Assays for cytokines using aptamers. Methods, 38(4), 324-330.

Guzsvány, V. J., Csanádi, J. J., Lazićb, S. D., & Gaál, F. F. (2009). Photocatalytic Degradation of the Insecticide Acetamiprid on TiO. J. Braz. Chem. Soc, 20(1), 152-159.

Hasegawa, T. (1999). Detection of minute chemical species by principal component analysis. Analytical Chemistry, 71(15), 3085-3091. doi: Doi 10.1021/Ac981430z

Hasegawa, T., Nishijo, J., & Umemura, J. (2000). Separation of Raman spectra from fluorescence emission background by principal component analysis. Chemical Physics Letters, 317(6), 642-646.

Haynes, C. L., McFarland, A. D., & Van Duyne, R. P. (2005). Surface-enhanced Raman spectroscopy. Analytical Chemistry, 77(17), 338a-346a. doi: Doi 10.1021/Ac053456d

He, J. A., Liu, Y. A., Fan, M. T., & Liu, X. J. (2011). Isolation and Identification of the DNA Aptamer Target to Acetamiprid. Journal of Agricultural and Food Chemistry, 59(5), 1582-1586. doi: Doi 10.1021/Jf104189g

He, L., Haynes, C. L., Diez‐Gonzalez, F., & Labuza, T. P. (2011). Rapid detection of a foreign protein in milk using IMS–SERS. Journal of Raman Spectroscopy, 42(6), 1428-1434.

He, L., Kim, N.-J., Li, H., Hu, Z., & Lin, M. (2008). Use of a fractal-like gold nanostructure in surface-enhanced Raman spectroscopy for detection of selected food contaminants. Journal of Agricultural and Food Chemistry, 56(21), 9843-9847.

He, L. L., Deen, B., Rodda, T., Ronningen, I., Blasius, T., Haynes, C., . . . Labuza, T. P. (2011). Rapid Detection of Ricin in Milk Using Immunomagnetic Separation Combined with Surface-Enhanced Raman Spectroscopy. Journal of Food Science, 76(5), N49-N53. doi: Doi 10.1111/J.1750-3841.2011.02196.X

He, L. L., Lamont, E., Veeregowda, B., Sreevatsan, S., Haynes, C. L., Diez-Gonzalez, F., & Labuza, T. P. (2011). Aptamer-based surface-enhanced Raman scattering detection of ricin in liquid foods. Chemical Science, 2(8), 1579-1582. doi: Doi 10.1039/C1sc00201e

He, L. L., Lin, M. S., Li, H., & Kim, N. J. (2010). Surface-enhanced Raman spectroscopy coupled with dendritic silver nanosubstrate for detection of restricted antibiotics. Journal of Raman Spectroscopy, 41(7), 739-744. doi: Doi 10.1002/Jrs.2505

Hermann, T., & Patel, D. J. (2000). Biochemistry - Adaptive recognition by nucleic acid aptamers. Science, 287(5454), 820-825. doi: Doi 10.1126/Science.287.5454.820

Herne, T. M., & Tarlov, M. J. (1997). Characterization of DNA probes immobilized on gold surfaces. Journal of the American Chemical Society, 119(38), 8916-8920.

75

Hianik, T., Ostatná, V., Sonlajtnerova, M., & Grman, I. (2007). Influence of ionic strength, pH and aptamer configuration for binding affinity to thrombin. Bioelectrochemistry, 70(1), 127-133.

Hirschfeld, T., & Chase, B. (1986). Ft-Raman Spectroscopy - Development and Justification. Applied Spectroscopy, 40(2), 133-137. doi: Doi 10.1366/0003702864509538

Hock, B., Dankwardt, A., Kramer, K., & Marx, A. (1995). Immunochemical Techniques - Antibody-Production for Pesticide Analysis - a Review. Analytica Chimica Acta, 311(3), 393-405.

Hofmann, H., Limmer, S., Hornung, V., & Sprinzl, M. (1997). Ni2+-binding RNA motifs with an asymmetric purine-rich internal loop and a GA base pair. Rna, 3(11), 1289.

Hu, Y., Yang, X., Wang, C., Zhao, J., Li, W., & Wang, Z. (2008). A sensitive determination method for carbendazim and thiabendazole in apples by solid-phase microextraction− high performance liquid chromatography with fluorescence detection. Food Additives and Contaminants, 25(3), 314-319.

Huang, Y., Cavinato, A. G., Mayes, D. M., Bledsoe, G. E., & Rasco, B. A. (2002). Nondestructive prediction of moisture and sodium chloride in cold smoked Atlantic salmon (Salmo salar). Journal of Food Science, 67(7), 2543-2547. doi: Doi 10.1111/J.1365-2621.2002.Tb08773.X

Ito, Y., Goto, T., Oka, H., Matsumoto, H., Miyazaki, Y., Takahashi, N., & Nakazawa, H. (2003). Simple and rapid determination of thiabendazole, imazalil, and o-phenylphenol in citrus fruit using flow-injection electrospray ionization tandem mass spectrometry. Journal of Agricultural and Food Chemistry, 51(4), 861-866.

Jang, N. H. (2002). The coordination chemistry of DNA nucleosides on gold nanoparticles as a probe by SERS. BULLETIN-KOREAN CHEMICAL SOCIETY, 23(12), 1790-1800.

Jarvis, R. M., & Goodacre, R. (2008). Characterisation and identification of bacteria using SERS. Chemical Society Reviews, 37(5), 931-936.

Jeanmaire, D. L., & Vanduyne, R. P. (1977). Surface Raman Spectroelectrochemistry .1. Heterocyclic, Aromatic, and Aliphatic-Amines Adsorbed on Anodized Silver Electrode. Journal of Electroanalytical Chemistry, 84(1), 1-20. doi: Doi 10.1016/S0022-0728(77)80224-6

Jenison, R. D., Gill, S. C., Pardi, A., & Polisky, B. (1994). High-Resolution Molecular Discrimination by Rna. Science, 263(5152), 1425-1429. doi: Doi 10.1126/Science.7510417

Julicher, P., Mussenbrock, E., Renneberg, R., & Cammann, K. (1995). Broadening the Antibody Specificity by Hapten Design for an Enzyme-Linked Immunoassay as an Improved Screening Method for the Determination of Nitroaromatic Residues in Soils. Analytica Chimica Acta, 315(3), 279-287.

76

Khan, A., Haque, M. M., Mir, N. A., Muneer, M., & Boxall, C. (2010). Heterogeneous photocatalysed degradation of an insecticide derivative acetamiprid in aqueous suspensions of semiconductor. Desalination, 261(1-2), 169-174. doi: Doi 10.1016/J.Desal.2010.05.001

Kim, M. S., Kim, M. K., Lee, C. J., Jung, Y. M., & Lee, M. S. (2009). Surface-enhanced Raman spectroscopy of benzimidazolic fungicides: benzimidazole and thiabendazole. Bull. Korean Chen. Soc. Papers, 30(12), 2930-2934.

Kim, M. S., Kim, M. K., Lee, C. J., Jung, Y. M., & Lee, M. S. (2009). Surface-enhanced Raman Spectroscopy of Benzimidazolic Fungicides: Benzimidazole and Thiabendazole. Bulletin of the Korean Chemical Society, 30(12), 2930-2934. doi: DOI 10.5012/bkcs.2009.30.12.2930

Knauer, K., Lampert, C., & Gonzalez-Valero, J. (2007). Comparison of< i> in vitro</i> and< i> in vivo</i> acute fish toxicity in relation to toxicant mode of action. Chemosphere, 68(8), 1435-1441.

Lee, S. J., Morrill, A. R., & Moskovits, M. (2006). Hot spots in silver nanowire bundles for surface-enhanced Raman spectroscopy. Journal of the American Chemical Society, 128(7), 2200-2201.

Li-Chan, E. (1996). The applications of Raman spectroscopy in food science. Trends in Food Science & Technology, 7(11), 361-370.

Li-Chan, E., Nakai, S., & Hirotsuka, M. (1994). Raman spectroscopy as a probe of protein structure in food systems Protein structure-function relationships in foods (pp. 163-197): Springer.

Lin, M., Al-Holy, M., Al-Qadiri, H., Kang, D.-H., Cavinato, A. G., Huang, Y., & Rasco, B. A. (2004). Discrimination of intact and injured Listeria monocytogenes by Fourier transform infrared spectroscopy and principal component analysis. Journal of Agricultural and Food Chemistry, 52(19), 5769-5772.

Liu, B., Lin, M., & Li, H. (2010). Potential of SERS for rapid detection of melamine and cyanuric acid extracted from milk. Sensing and Instrumentation for Food Quality and Safety, 4(1), 13-19.

Liu, X., Zhang, D., Cao, G., Yang, G., Ding, H., Liu, G., . . . Shao, N. (2003). RNA aptamers specific for bovine thrombin. Journal of Molecular Recognition, 16(1), 23-27.

Liu, Y., Chao, K., Nou, X., & Chen, Y.-R. (2009). Feasibility of colloidal silver SERS for rapid bacterial screening. Sensing and Instrumentation for Food Quality and Safety, 3(2), 100-107.

Marty, J. L., Garcia, D., & Rouillon, R. (1995). Biosensors - Potential in Pesticide Detection. Trac-Trends in Analytical Chemistry, 14(7), 329-333.

Mateu-Sanchez, M., Moreno, M., Arrebola, F. J., & MARTÍNEZ VIDAL, J. L. (2003). Analysis of acetamiprid in vegetables using gas chromatography-tandem mass spectrometry. Analytical Sciences, 19(5), 701-704.

77

McKeague, M., Giamberardino, A. & DeRosa, M.C. (2011). Advanceds in aptamer-based biosensor for food safety. In e. In V. Somerset (Ed.), Environmental biosensors (pp. 17-42). InTech.

McMasters, S., & Stratis-Cullum, D. N. (2006). Evaluation of aptamers as molecular recognition elements for pathogens using capillary electrophoretic analysis. Paper presented at the Optics East 2006.

Moskovits, M. (1985). Surface-enhanced spectroscopy. Reviews of Modern Physics, 57(3), 783.

Naes, T., Irgens, C., & Martens, H. (1986). Comparison of linear statistical methods for calibration of NIR instruments. Applied statistics, 195-206.

Nie, S. M., & Emery, S. R. (1997). Probing single molecules and single nanoparticles by surface-enhanced Raman scattering. Science, 275(5303), 1102-1106. doi: DOI 10.1126/science.275.5303.1102

Niemeyer, C. M., & Blohm, D. (1999). DNA microarrays. Angewandte Chemie International Edition, 38(19), 2865-2869.

Nutiu, R., & Li, Y. F. (2003). Structure-switching signaling aptamers. Journal of the American Chemical Society, 125(16), 4771-4778. doi: Doi 10.1021/Ja028962o

O'Grady, A., Dennis, A. C., Denvir, D., McGarvey, J. J., & Bell, S. E. (2001). Quantitative Raman spectroscopy of highly fluorescent samples using pseudosecond derivatives and multivariate analysis. Analytical Chemistry, 73(9), 2058-2065.

Obana, H., Okihashi, M., Akutsu, K., Kitagawa, Y., & Hori, S. (2003). Determination of neonicotinoid pesticide residues in vegetables and fruits with solid phase extraction and liquid chromatography mass spectrometry. Journal of Agricultural and Food Chemistry, 51(9), 2501-2505.

Otto, A., Mrozek, I., Grabhorn, H., & Akemann, W. (1992). Surface-enhanced Raman scattering. Journal of Physics: Condensed Matter, 4(5), 1143.

Pan, Q., Zhang, X.-L., Wu, H.-Y., He, P.-W., Wang, F., Zhang, M.-S., . . . Wu, J. (2005). Aptamers that preferentially bind type IVB pili and inhibit human monocytic-cell invasion by Salmonella enterica serovar typhi. Antimicrobial agents and chemotherapy, 49(10), 4052-4060.

Park, J. Y., Choi, J. H., Kim, B. M., Park, J. H., Cho, S. K., Ghafar, M. W., . . . Shim, J. H. (2011). Determination of acetamiprid residues in zucchini grown under greenhouse conditions: application to behavioral dynamics. Biomedical Chromatography, 25(1-2), 136-146. doi: Doi 10.1002/Bmc.1529

. Pesticide Data Program Annual Summary (2009). http://www.ams.usda.gov/pdp: U.S. Department of Agriculture

. Pesticide Data Program Annual Summary (2010). Peterson, A. W., Heaton, R. J., & Georgiadis, R. M. (2001). The effect of surface probe

density on DNA hybridization. Nucleic acids research, 29(24), 5163-5168.

78

Pico, Y., Rodriguez, R., & Manes, J. (2003). Capillary electrophoresis for the determination of pesticide residues. Trac-Trends in Analytical Chemistry, 22(3), 133-151. doi: Doi 10.1016/S0165-9936(03)00302-9

Pimentel, D., Acquay, H., Biltonen, M., Rice, P., Silva, M., Nelson, J., . . . Damore, M. (1992). Environmental and Economic Costs of Pesticide Use. Bioscience, 42(10), 750-760. doi: Doi 10.2307/1311994

Podstawka, E., Światłowska, M., Borowiec, E., & Proniewicz, L. M. (2007). Food additives characterization by infrared, Raman, and surface‐enhanced Raman spectroscopies. Journal of Raman Spectroscopy, 38(3), 356-363.

Proske, D., Blank, M., Buhmann, R., & Resch, A. (2005). Aptamers - basic research, drug development, and clinical applications. Applied Microbiology and Biotechnology, 69(4), 367-374. doi: DOI 10.1007/s00253-005-0193-5

Robinson, H. J., Stoerk, H. C., & Graessle, O. E. (1965). Studies on the toxicologic and pharmacologic properties of thiabendazole. Toxicology and Applied Pharmacology, 7(1), 53-63.

Rodriguez, R., Manes, J., & Pico, Y. (2003). Off-line solid-phase microextraction and capillary electrophoresis mass spectrometry to determine acidic pesticides in fruits. Analytical Chemistry, 75(3), 452-459. doi: Doi 10.1021/Ac025884e

Rodrıguez, R., Picó, Y., Font, G., & Manes, J. (2002). Analysis of thiabendazole and procymidone in fruits and vegetables by capillary electrophoresis–electrospray mass spectrometry. Journal of Chromatography A, 949(1), 359-366.

Sauthier, M. L., Carroll, R. L., Gorman, C. B., & Franzen, S. (2002). Nanoparticle layers assembled through DNA hybridization: characterization and optimization. Langmuir, 18(5), 1825-1830.

Sazani, P. L., Larralde, R., & Szostak, J. W. (2004). A small aptamer with strong and specific recognition of the triphosphate of ATP. Journal of the American Chemical Society, 126(27), 8370-8371.

Shende, C., Gift, A., Inscore, F., Maksymiuk, P., & Farquharson, S. (2004). Inspection of pesticide residues on food by surface-enhanced Raman spectroscopy. Paper presented at the Proc. of SPIE Vol.

Shende, C. S., Inscore, F., Gift, A., Maksymiuk, P., & Farquharson, S. (2004). Analysis of pesticides on or in fruit by surface-enhanced Raman spectroscopy. Paper presented at the Proc. SPIE.

Singh, R. (2002). C. V. Raman and the discovery of the Raman effect. Physics in Perspective, 4(4), 399-420. doi: DOI 10.1007/s000160200002

Spencer, K. M., Sylvia, J. M., Clauson, S. L., Bertone, J. F., & Christesen, S. D. (2004). Surface-enhanced Raman for monitoring toxins in water. Paper presented at the Optical Technologies for Industrial, Environmental, and Biological Sensing.

Stojanovic, M. N., de Prada, P., & Landry, D. W. (2000). Fluorescent sensors based on aptamer self-assembly. Journal of the American Chemical Society, 122(46), 11547-11548.

79

Stojanovic, M. N., & Landry, D. W. (2002). Aptamer-based colorimetric probe for cocaine. Journal of the American Chemical Society, 124(33), 9678-9679.

Tanner, P. A., & Leung, K.-H. (1996). Spectral interpretation and qualitative analysis of organophosphorus pesticides using FT-Raman and FT-infrared spectroscopy. Applied Spectroscopy, 50(5), 565-571.

Tombelli, S., Minunni, M., & Mascini, M. (2007). Aptamers-based assays for diagnostics, environmental and food analysis. Biomolecular engineering, 24(2), 191-200.

Tomizawa, M., & Casida, J. E. (2005). Neonicotinoid insecticide toxicology: Mechanisms of selective action. Annual Review of Pharmacology and Toxicology, 45, 247-+. doi: DOI 10.1146/annurev.pharmtox.45.120403.095930

Tuerk, C., & Gold, L. (1990). Systematic evolution of ligands by exponential enrichment: RNA ligands to bacteriophage T4 DNA polymerase. Science, 249(4968), 505-510.

Ulrich, H., Martins, A. H. B., & Pesquero, J. B. (2004). RNA and DNA aptamers in cytomics analysis. Cytometry Part A, 59(2), 220-231.

EPA rereigstration eligibility decision thiabendazole (2002). Vamvakaki, V., & Chaniotakis, N. A. (2007). Pesticide detection with a liposome-based

nano-biosensor. Biosensors & Bioelectronics, 22(12), 2848-2853. doi: DOI 10.1016/j.bios.2006.11.024

Veneziano, A., Vacca, G., Arana, S., De Simone, F., & Rastrelli, L. (2004). Determination of carbendazim, thiabendazole and thiophanate-methyl in banana (< i> Musa acuminata</i>) samples imported to Italy. Food Chemistry, 87(3), 383-386.

Wallace, S. T., & Schroeder, R. (1998). In vitro selection and characterization of streptomycin-binding RNAs: recognition discrimination between antibiotics. Rna, 4(1), 112-123.

Wang, C., Zhang, M., Yang, G., Zhang, D., Ding, H., Wang, H., . . . Shao, N. (2003). Single-stranded DNA aptamers that bind differentiated but not parental cells: subtractive systematic evolution of ligands by exponential enrichment. Journal of biotechnology, 102(1), 15-22.

Wang, Y., Ravindranath, S., & Irudayaraj, J. (2011). Separation and detection of multiple pathogens in a food matrix by magnetic SERS nanoprobes. Analytical and Bioanalytical Chemistry, 399(3), 1271-1278.

Watanabe, E., Miyake, S., Baba, K., Eun, H., & Endo, S. (2006). Immunoassay for acetamiprid detection: application to residue analysis and comparison with liquid chromatography. Analytical and Bioanalytical Chemistry, 386(5), 1441-1448.

Weissenbacher, N., Lendl, B., Frank, J., Wanzenbock, H. D., Mizaikoff, B., & Kellner, R. (1997). Continuous surface enhanced Raman spectroscopy for the detection of trace organic pollutants in aqueous systems. Journal of Molecular Structure, 410, 539-542.

80

Wu, Q., Li, Y., Wang, C., Liu, Z., Zang, X., Zhou, X., & Wang, Z. (2009). Dispersive liquid–liquid microextraction combined with high performance liquid chromatography–fluorescence detection for the determination of carbendazim and thiabendazole in environmental samples. Analytica Chimica Acta, 638(2), 139-145.

Xu, D.-K., Ma, L.-R., Liu, Y.-Q., Jiang, Z.-H., & Liu, Z.-H. (1999). Development of chemiluminescent biosensing of nucleic acids based on oligonucleotide-immobilized gold surfaces. Analyst, 124(4), 533-536.

Xu, Q., Du, S., Li, H., & Hu, X. Y. (2011). Determination of acetamiprid by a colorimetric method based on the aggregation of gold nanoparticles. Microchimica Acta, 173(3-4), 323-329.

Zamora, T., Pozo, O., López, F., & Hernández, F. (2004). Determination of tridemorph and other fungicide residues in fruit samples by liquid chromatography–electrospray tandem mass spectrometry. Journal of chromatography A, 1045(1), 137-143.

81

Appendix-A Average spectra of negative control

Figure 1 Average spectra (N=5) of negative control (methanol, cotton swab with

methanol, swab unwashed apple with cotton swab, swab water washed apple and swab

veggiewashed apple)

82

Appendix-B Selected data of swab optimization

Table 1 Peak heights at 784 nm-1 Raman shift under different vortex times

Vortex Time Peak Height at 784 nm-1 Raman shift

Mean SD

1min 3.78 3.29 0.95 3.70 4.20 3.02 1.78 2min 1.93 2.54 2.37 0.73 6.02 1.48

NA

3min 4.73 7.41 4.01 2.61 12.97 9.20 7.57 4min 9.84 14.60 5.65 16.36 5.16 7.46 19.99 5min 12.67 13.07 2.25 7.88 12.31 10.11 11.29

83

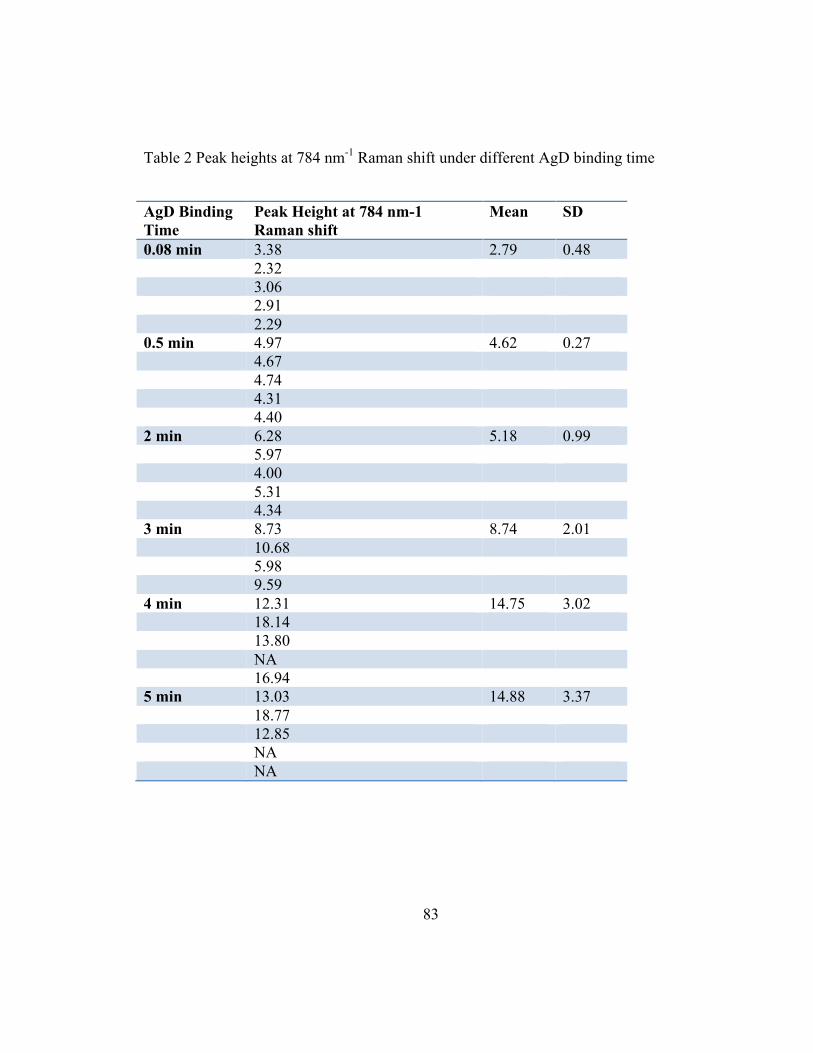
Table 2 Peak heights at 784 nm-1 Raman shift under different AgD binding time

AgD Binding Time

Peak Height at 784 nm-1 Raman shift

Mean SD

0.08 min 3.38 2.79 0.48 2.32 3.06 2.91 2.29 0.5 min 4.97 4.62 0.27 4.67 4.74 4.31 4.40 2 min 6.28 5.18 0.99 5.97 4.00 5.31 4.34 3 min 8.73 8.74 2.01 10.68 5.98 9.59 4 min 12.31 14.75 3.02 18.14 13.80 NA 16.94 5 min 13.03 14.88 3.37 18.77 12.85 NA NA

84

Table 3 Peak heights at 784 nm-1 Raman shift of different swab areas

Swab Area Peak Height at 784 nm-1 Raman shift

Mean SD

2x2cm 1.49 1.74 0.35 1.99 NA NA NA 3x2x2cm 2.48 2.69 1.08 1.82 4.25 NA 2.19 Whole apple 6.80 4.67 1.56 4.86 3.35 3.68

NA

85

Table 4 Peak heights at 784 nm-1 Raman shift under different swab times

Swab Time Peak Height at 784 nm-1 Raman shift

Mean SD

1min 3.43 3.12 0.36 2.58 3.34 2.94 3.31

1.5min 9.90 8.67 1.72 8.39 7.04 7.10 10.93

2min 9.05 7.73 1.06 7.55 6.84 8.57 6.62

86

Appendix-C PCA plot of different concentrations TBZ solution

Figure 1 Average spectra (N=5) of methanol, 0.1 ppm TBZ, 1 ppm TBZ, 2 ppm TBZ, 4

ppm TBZ, 6 ppm TBZ, 8 ppm TBZ and 10 ppm TBZ

87

Figure 2 Classification of different concentrations of TBZ using first two principle

components

88

Figure 3 Average spectra (N=5) of methanol, 0 ppm TBZ, 10 ppm TBZ, 20 ppm TBZ, 40

ppm TBZ, 60 ppm TBZ, 80 ppm TBZ and 100 ppm TBZ

89

Appendix-D Selected data of releasing factor

Table 1 final concentration of TBZ solution in releasing factor study

Triplicate TBZ (µg/mL )

Average Concentration (µg/mL) for each sample

Average releasing factor %

1 5.84 5.1 66.6 5.14 4.34 4.78 4.63 7.92

2 7.14 7.39 4.18 11.92 7.98 7.06

3 7.93 7.49 7.1 7.39 6.12 7.54 8.25

90

Appendix-E The swab-SERS method validation data

Figure 1 Second derivative transformation of the SERS spectra for method validation.

Apples were dipped into the pesticide solution at the final concentrations of 5, 3 and 0.3

and 0.1 ppm (µg/g per weight).

91

Appendix-F Raw data of UV-vis acetamiprid detection

Table 1 Raw data of difference concentration acetamiprid solution absorbance in 10 days

Con

cen

-tra

tion

(ppm

) D

ay 1

Day

2

Day

3

Day

4

Day

5

Day

6

Day

7

Day

8

Day

9

Day

10

0 0 0 0 0 0 0 0 0 0 0 0 0 0 0 0 0 0 0 0 0

0.4

0.04

69

0.04

63

0.05

85

0.05

86

0.03

42

0.03

42

0.04

76

0.04

82

0.05

62

0.05

66

0.04

31

0.04

45

0.05

12

0.05

14

0.03

74

0.03

76

0.03

76

0.03

74

0.03

73

0.03

65

2 0.20

34

0.20

34

0.21

74

0.21

58

0.18

08

0.18

0.17

95

0.17

93

0.18

94

0.18

98

0.21

42

0.21

37

0.20

37

0.20

34

0.19

25

0.19

25

0.30

15

0.30

11

0.20

06

0.19

98

5 0.45

97

0.45

81

0.47

13

0.47

03

0.44

31

0.44

29

0.42

66

0.42

83

0.43

87

0.43

87

0.47

19

0.47

18

0.45

93

0.45

95

0.44

04

0.44

1

0.43

4

0.43

33

0.46

59

0.46

52

10

0.84

52

0.84

51

0.91

65

0.91

56

0.88

96

0.88

85

0.87

85

0.87

75

1.09

35

1.09

07

0.86

7

0.86

62

0.88

2

0.88

0.75

84

0.75

81

0.84

3

0.84

22

0.85

59

0.85

57

20

1.43

87

1.43

77

1.43

07

1.43

06

1.44

68

1.45

06

1.38

74

1.38

49

1.60

2

1.59

72

1.42

67

1.42

35

1.44

16

1.43

83

1.35

5

1.35

38

1.40

5

1.40

18

1.43

29

1.42

99

30

1.52

62

1.52

52

1.55

88

1.55

22

1.61

83

1.61

49

1.55

36

1.55

19

1.59

71

1.59

28

1.59

69

1.68

97

1.58

99

1.58

62

1.56

49

1.56

35

1.61

5

1.63

61

1.57

01

1.56

96

50

1.60

81

1.60

37

1.53

72

1.53

81

1.65

72

1.65

09

1.56

77

1.56

39

1.63

1.62

39

1.61

26

1.60

75

1.63

74

1.63

82

1.64

8

1.64

43

1.63

61

1.63

16

1.58

26

1.58

14

250

1.54

87

1.54

27

1.56

01

1.56

1.71

2

1.71

75

1.56

86

1.56

77

1.61

58

1.61

09

1.66

4

1.65

82

1.67

7

1.64

63

1.62

48

1.62

47

1.63

65

1.63

29

1.57

62

1.57

63

1000

1.57

22

1.56

91

1.57

95

1.57

77

1.69

13

1.68

84

1.59

19

1.58

84

1.64

19

1.63

59

1.65

48

1.65

02

1.64

63

1.64

13

1.61

9

1.61

59

1.63

17

1.63

11

1.61

99

1.61

46

92

Table 2 Comparision of logistical model fits of acetamiprid UV-vis analysis

Comparison of Fits Null hypothesis log(agonist) vs. response -- Variable slope

(four parameters) Alternative hypothesis Asymmetric (five parameter) P value < 0.0001 Conclusion (alpha = 0.05) Reject null hypothesis Preferred model Asymmetric (five parameter) F (DFn, DFd) 264.2 (1,176) Asymmetric (five parameter) Best-fit values LogEC50 0.9609 HillSlope 4.643 S 0.201 Top 1.618 Bottom = 0.0 EC50 9.138 Std. Error LogEC50 0.005252 HillSlope 0.4068 S 0.0219 Top 0.005923 95% Confidence Intervals LogEC50 0.9505 to 0.9712 HillSlope 3.841 to 5.446 S 0.1578 to 0.2443 Top 1.606 to 1.630 EC50 8.923 to 9.359 Goodness of Fit Degrees of Freedom 176 R square 0.9947 Absolute Sum of Squares 0.371 Sy.x 0.04592 Constraints Bottom Bottom = 0.0 log(agonist) vs. response -- Variable slope

93

(four parameters) Best-fit values Bottom = 0.0 Top 1.657 LogEC50 0.9267 HillSlope 1.887 EC50 8.448 Span = 1.657 Std. Error Top 0.01008 LogEC50 0.007534 HillSlope 0.0535 95% Confidence Intervals Top 1.638 to 1.677 LogEC50 0.9119 to 0.9416 HillSlope 1.782 to 1.993 EC50 8.163 to 8.742 Goodness of Fit Degrees of Freedom 177 R square 0.9868 Absolute Sum of Squares 0.928 Sy.x 0.07241 Constraints Bottom Bottom = 0.0 Number of points Analyzed 180

94

Appendix-G Selected data analysis results of refined swab

method

Table 1 Data analysis results of preload solvent volume (100 µL vs. 200 µL)

Table Analyzed Baseline-corrected of 50/50

Column B Preload 200 µL vs. vs. Column A Preload 100 µL Unpaired t test with Welch's correction

P value 0.1798 P value summary ns Significantly different? (P < 0.05) No One- or two-tailed P value? Two-tailed Welch-corrected t, df t=1.433 df=10.93 How big is the difference? Mean ± SEM of column A 90.62 ± 1.399, n=10 Mean ± SEM of column B 88.51 ± 0.4611, n=10 Difference between means -2.111 ± 1.473 95% confidence interval -5.356 to 1.134 R squared 0.1581 F test to compare variances F,DFn, Dfd 9.208, 9, 9 P value 0.0029 P value summary ** Significantly different? (P < 0.05) Yes


Recommended