ORIGINAL PAPER Detection of Pesticides in Fruits by Surface-Enhanced Raman Spectroscopy Coupled with Gold Nanostructures Bin Liu & Peng Zhou & Xiaoming Liu & Xin Sun & Hao Li & Mengshi Lin Received: 25 July 2011 / Accepted: 29 December 2011 / Published online: 17 January 2012 # Springer Science+Business Media, LLC 2012 Abstract There is growing concern in recent years for consumers about contamination of pesticides in fruits due to increasing use of pesticides in fruits. The objective of this study was to use surface-enhanced Raman spectroscopy (SERS) to detect and characterize pesticides extracted from fruit surfaces. Gold-coated SERS-active nanosubstrates were used for SERS measurement. Three types of pesticides (carbaryl, phosmet, and azinphos-methyl) widely used in apples and tomatoes were selected. Significantly enhanced Raman signals of pesticides were acquired by SERS from the extract of fruit samples and exhibited characteristic patterns of the analytes. Multivariate statistical methods such as partial least squares and principal component anal- ysis were used to develop quantitative and qualitative mod- els. SERS was able to detect all three types of pesticides extracted from fruit samples at the parts per million level. The study of detection limit demonstrated that at 99.86% confidence interval, SERS can detect carbaryl at 4.51 ppm, phosmet at 6.51 ppm, and azinphos-methyl at 6.66 ppm spiked on apples; and carbaryl at 5.35 ppm, phosmet at 2.91 ppm, and azinphos-methyl at 2.94 ppm on tomatoes. Most of these detection limits meet the maximum residue limits established by Food and Agriculture Organization of the United Nations and World Health Organization. Satis- factory recoveries (78–124%) were achieved for samples with concentrations at and larger than the detection limit. These results demonstrate that SERS coupled with novel SERS-active nanosubstrates is a rapid, sensitive, and reli- able method for detection and characterization of chemical contaminants in foods. Keywords Gold nanosubstrates . SERS . Pesticide . Apple . Tomato Introduction Organophosphosphate (OP) and carbamate (CB) pesticides have been used for decades to fight against pests to increase the yields of agricultural products. Because of their ability of inactivating acetylcholinesterase, OP and CB are considered to have potent neurotoxicity (Costa 2006; Gupta 2004; He 2000). Several studies suggest that chronic exposure to OP and CB, even at low to mild doses, may lead to long-term adverse neurobehavioral effects (Costa 2006; Wesseling et al. 2002). OP and CB are widely used in fruits and vegetable crops (Kegley and Wise 1998). According to Residue Mon- itoring Reports published by the US Food and Drugs Administration (US FDA), pesticide residues exist in a large portion of certain types of fruits and vegetables such as apple and tomato (FDA 2006, 2007a). There is growing concern in recent years for consumers about contamination of pesticides in fruits because FDA found that from 2004 to 2007, more domestic fruit samples contain pesticide resi- dues, suggesting that the use of pesticides in fruits is in- creasing (FDA 2007b). Therefore, reliable and consistent B. Liu : P. Zhou (*) : X. Liu School of Food Science and Technology, Jiangnan University, Wuxi, Jiangsu Province 214122, China e-mail: [email protected]B. Liu : M. Lin (*) Food Science Program, Division of Food Systems & Bioengineering, University of Missouri, Columbia, MO 65211, USA e-mail: [email protected]X. Sun : H. Li Department of Mechanical and Aerospace Engineering, University of Missouri, Columbia, MO 65211, USA Food Bioprocess Technol (2013) 6:710–718 DOI 10.1007/s11947-011-0774-5
Transcript
ORIGINAL PAPER
Detection of Pesticides in Fruits by Surface-EnhancedRaman Spectroscopy Coupled with Gold Nanostructures
Bin Liu & Peng Zhou & Xiaoming Liu & Xin Sun & Hao Li &Mengshi Lin
Received: 25 July 2011 /Accepted: 29 December 2011 /Published online: 17 January 2012# Springer Science+Business Media, LLC 2012
Abstract There is growing concern in recent years forconsumers about contamination of pesticides in fruits dueto increasing use of pesticides in fruits. The objective of thisstudy was to use surface-enhanced Raman spectroscopy(SERS) to detect and characterize pesticides extracted fromfruit surfaces. Gold-coated SERS-active nanosubstrateswere used for SERS measurement. Three types of pesticides(carbaryl, phosmet, and azinphos-methyl) widely used inapples and tomatoes were selected. Significantly enhancedRaman signals of pesticides were acquired by SERS fromthe extract of fruit samples and exhibited characteristicpatterns of the analytes. Multivariate statistical methodssuch as partial least squares and principal component anal-ysis were used to develop quantitative and qualitative mod-els. SERS was able to detect all three types of pesticidesextracted from fruit samples at the parts per million level.The study of detection limit demonstrated that at 99.86%confidence interval, SERS can detect carbaryl at 4.51 ppm,phosmet at 6.51 ppm, and azinphos-methyl at 6.66 ppmspiked on apples; and carbaryl at 5.35 ppm, phosmet at2.91 ppm, and azinphos-methyl at 2.94 ppm on tomatoes.
Most of these detection limits meet the maximum residuelimits established by Food and Agriculture Organization ofthe United Nations and World Health Organization. Satis-factory recoveries (78–124%) were achieved for sampleswith concentrations at and larger than the detection limit.These results demonstrate that SERS coupled with novelSERS-active nanosubstrates is a rapid, sensitive, and reli-able method for detection and characterization of chemicalcontaminants in foods.
Keywords Gold nanosubstrates . SERS . Pesticide . Apple .
Tomato
Introduction
Organophosphosphate (OP) and carbamate (CB) pesticideshave been used for decades to fight against pests to increasethe yields of agricultural products. Because of their ability ofinactivating acetylcholinesterase, OP and CB are consideredto have potent neurotoxicity (Costa 2006; Gupta 2004; He2000). Several studies suggest that chronic exposure to OPand CB, even at low to mild doses, may lead to long-termadverse neurobehavioral effects (Costa 2006; Wesseling etal. 2002). OP and CB are widely used in fruits and vegetablecrops (Kegley and Wise 1998). According to Residue Mon-itoring Reports published by the US Food and DrugsAdministration (US FDA), pesticide residues exist in a largeportion of certain types of fruits and vegetables such asapple and tomato (FDA 2006, 2007a). There is growingconcern in recent years for consumers about contaminationof pesticides in fruits because FDA found that from 2004 to2007, more domestic fruit samples contain pesticide resi-dues, suggesting that the use of pesticides in fruits is in-creasing (FDA 2007b). Therefore, reliable and consistent
B. Liu : P. Zhou (*) :X. LiuSchool of Food Science and Technology, Jiangnan University,Wuxi, Jiangsu Province 214122, Chinae-mail: [email protected]
B. Liu :M. Lin (*)Food Science Program,Division of Food Systems & Bioengineering,University of Missouri,Columbia, MO 65211, USAe-mail: [email protected]
X. Sun :H. LiDepartment of Mechanical and Aerospace Engineering,University of Missouri,Columbia, MO 65211, USA
detection methods for OP and CB in fruits and vegetablesare crucially needed.
Current methods adopted by AOAC for detection of OPand CB in fruits and vegetables are various thin-layer chro-matography and gas chromatography setups (AOAC 2005;Ortelli et al. 2005; Rawn et al. 2006). In recent years, novelanalytical methods for detection of OP and CB pesticides infruits and vegetables have been developed, including liquidchromatography–mass spectrometry (Grimalt et al. 2007;Liu et al. 2005; Ortelli et al. 2005), fluorescence polarizationimmunoassay (Kolosova et al. 2003), multienzyme inhibi-tion assay (Walz and Schwack 2007), and biosensors(Valdés-Ramírez et al. 2008; Zhang et al. 2005). Althoughthese methods can be used to detect trace amount of pesti-cide residues, they are time-consuming, labor-intensive, andoften require complicated procedures of sample preparation.In addition, a narrow range of application is another majorhindrance to applying these techniques for food analysis.
Vibrational spectroscopic methods such as Raman spec-troscopy have long been considered a useful analyticaltechnique to evaluate food safety and quality (Lu et al.2011). Although Raman spectrum can provide “finger-print-like” information about various chemical and bio-chemical components in a complex system with little or nosample preparation, traditional Raman spectroscopy is onlysuitable for measuring compounds present in high concen-tration because only one out of one million photons under-goes Raman scattering, thus generating only weak signals.Surface-enhanced Raman spectroscopy (SERS), discoveredin the 1970s (Albrecht and Creighton 1977; Fleischmannet al. 1974; Jeanmaire and Van Duyne 1977), significantlyenhances the sensitivity of traditional Raman spectroscopy.Over the last 10 years, with rapid development of nanotech-nology and nanomaterials, the interest in SERS was revived.SERS is a technique in which probed molecules areabsorbed onto the roughened surface of transition metals,resulting in significant enhancement of the Raman signalsby many orders of magnitude in highly localized opticalfields of nanostructures. Coupled with metal nanosubstrates,SERS can increase the intensity of Raman signals by morethan one million times due to the effects of electromagneticfield enhancement and chemical enhancement (Haynes et al.2005; Kneipp et al. 2002). Many applications are beingexplored using novel nanosized or nanostructured substratesfor SERS measurements. For example, nanosized particlescan be used as SERS-active substrates because they have avery high surface/volume aspect ratio, which is an importantparameter to ensure that a great number of probe moleculesare captured in the close vicinity of the metal surface. Todate, gold and silver are two most frequently used materialsfor fabrication of SERS-active nanosubstrates.
SERS has been used in rapid detection and characteriza-tion of various food contaminants and adulterants, including
banned seafood drugs such as crystal violet and malachitegreen (He et al. 2008a; Lai et al. 2011), melamine and itsderivatives (He et al. 2008b; Liu et al. 2010), and bannedfood dye Sudan-1 (Shadi et al. 2010). The objective of thisstudy was to use SERS coupled with novel nanosubstratesfor rapid detection of OP and CB pesticides extracted fromfruit surfaces. Two types of fruits (i.e., apple and tomato)were selected in this study because they are major targets ofpesticide residue monitoring and have been found to beheavily contaminated with various pesticides (FDA 2006,2007a). Multivariate statistical methods were used to ana-lyze SERS spectral data and develop quantitative and qual-itative models for data analysis.
Materials and Methods
Materials
Two OP pesticides (azinphos-methyl and phosmet) and oneCB pesticide (carbaryl) were purchased from Fisher Scien-tific Inc. (Pittsburgh, PA, USA). Organic apples (GrannySmith) and tomatoes were purchased from a local supermarket.Organic fruits were selected and cleaned to ensure that nopesticide residues existed on the samples.
Sample Preparation
Pure pesticide solutions: 100 ppm (w/v) of azinphos-methyl,phosmet, and carbaryl stock solutions were prepared using amixed solvent system (acetonitrile/H2O01:1, v/v). Solutionsof 50, 10, 5, 1, 0.5, and 0.1 ppm pesticides were prepared byserial dilutions from the 100 ppm solution. The solventwithout pesticides was used as the control.
Apples and tomatoes were weighed, and their diameterswere measured. Assuming that an apple or a tomato is ofspherical shape, the surface area of the fruit was calculated.Using these data, given designated pesticide concentrationon a fruit (parts per million, or equivalently, micrograms pergram), the mass of pesticide (microgram) that should bespiked on 1 cm2 of fruit skin was obtained. Then, certainamounts of pesticide solutions were dropped with a pipetteronto a piece of ~4 cm2 fruit skin freshly peeled from thefruit. Extra care was taken to ensure even distribution of thesolution on the fruit skin. The skin of the samples were thenblown dry, cut into small pieces, and placed in conical tubescontaining 4 mL of mixed solvent (acetonitrile/H2O01:1,v/v). After vigorous vortexing for 1 min, the mixture wassonicated using an ultrasonic processor equipped with a6.5-mm tapered microtip (Sonics & Materials, Inc. New-town, CT, USA) for 5 min with 30-s working and 10-sinterval at an amplitude of 30%. Finally, the supernatant
Food Bioprocess Technol (2013) 6:710–718 711
was filtered with a 0.22-μm syringe filter, and the filtratewas used for SERS measurement.
SERS Substrates
The SERS substrates, Q-SERS™ G1, were obtained fromNanova Inc. (Columbia, MO, USA). Q-SERS™ substratesare gold-based nanostructures fabricated on a silicon wafer.A volume of ~0.3–0.5 μL of the filtrate from previous stepwas dropped on the surface of a substrate using a micropi-pette. The substrate, which was fixed on a glass slide, wasthen placed on a hot plate and heated at 40°C until thesolvent completely evaporated.
SERS Measurement
A Renishaw RM1000 Raman Spectrometer System(Gloucestershire, UK) equipped with a Leica DMLB micro-scope (Wetzlar, Germany) was used in this study. Thissystem is equipped with a 785-nm near-infrared diode lasersource. During the measurement, light from the high power(maximum at 300 mW) diode laser was directed andfocused onto the sample at a microscope stage througha ×50 objective. Raman scattering signals were detectedby a 578×385 pixels charge-coupled device array detector.The size of each pixel was 22×22 μm. Spectral data werecollected by WiRE 3.2 software (Gloucestershire, UK). Inthis study, spectra of samples were collected using a ×50objective with 10-s exposure time, 0% focus, and ~20 mWlaser power in the extended mode. Detection ranges for eachpesticide were 550–1,650 cm−1 for azinphos-methyl, 550–1,800 cm−1 for phosmet, and 600–1,700 cm−1 for carbaryl.The detection range was determined in a way that the rangewas as narrow as possible, but no obvious signals weremissed.
Data Analysis
The software Delight version 3.2.1 (D-Squared Develop-ment Inc., LaGrande, OR, USA) was used in data analysis.SERS spectral data were analyzed following previouslydeveloped methods with slight modification (He et al.2008a; Liu et al. 2010). Briefly, data pre-processing algo-rithms including polynomial subtract and Gaussian smooth-ing were employed to subtract the baseline shift andeliminate high frequency noises from the instrument. Thepartial least squares (PLS) model, a multivariate statisticalregression model, was constructed to predict analyte con-centrations in tested samples. The PLS model was validatedby leave-one-out cross validation, which uses all but onesample to build a calibration curve and repeats for eachsample in the data set. The number of PLS latent variableswas optimized based on the lowest root mean square error of
prediction (RMSEP) values to avoid overfitting of spectraldata.
In this equation, n is the number of samples, ĉi is thepredicted pesticide concentration (ppm), and ci is the actualpesticide concentration (ppm). The correlation coefficient(R) and RMSEP were used to evaluate the model. Thehigher the R value or the lower the RMSEP value is, thebetter predictability the model has.
The detection limit (DL) with 99.86% confidence intervalcan be calculated from the PLS calibration curve based oncharacteristic peaks in SERS spectra using the followingformula (Strickland and Batt 2009):
DL ¼ 3σ m= ð2Þin which σ is the standard error of predicted concentration,and m is the slope of the calibration curve. In a PLS model,σ equals to RMSEP.
Principal component analysis (PCA) is a statistical tech-nique used to reduce a multidimensional data set to its mostdominant features, to remove random variations (noise), andto retain the principal components (PCs) that explain mostvariations between sample treatments (Goodacre et al.1998). In this study, spectral data were smoothed with aGaussian function at 4 cm−1 followed by a second derivativetransformation with a 12 cm−1 gap before PCA wasconducted.
Concentrations of pesticide solutions extracted from fruitsamples were determined via PLS using the calibration curve.The recovery percentage was calculated with quantified pesti-cide concentrations divided by spiked pesticide concentrations.
100nm
10nm
100nm100nm
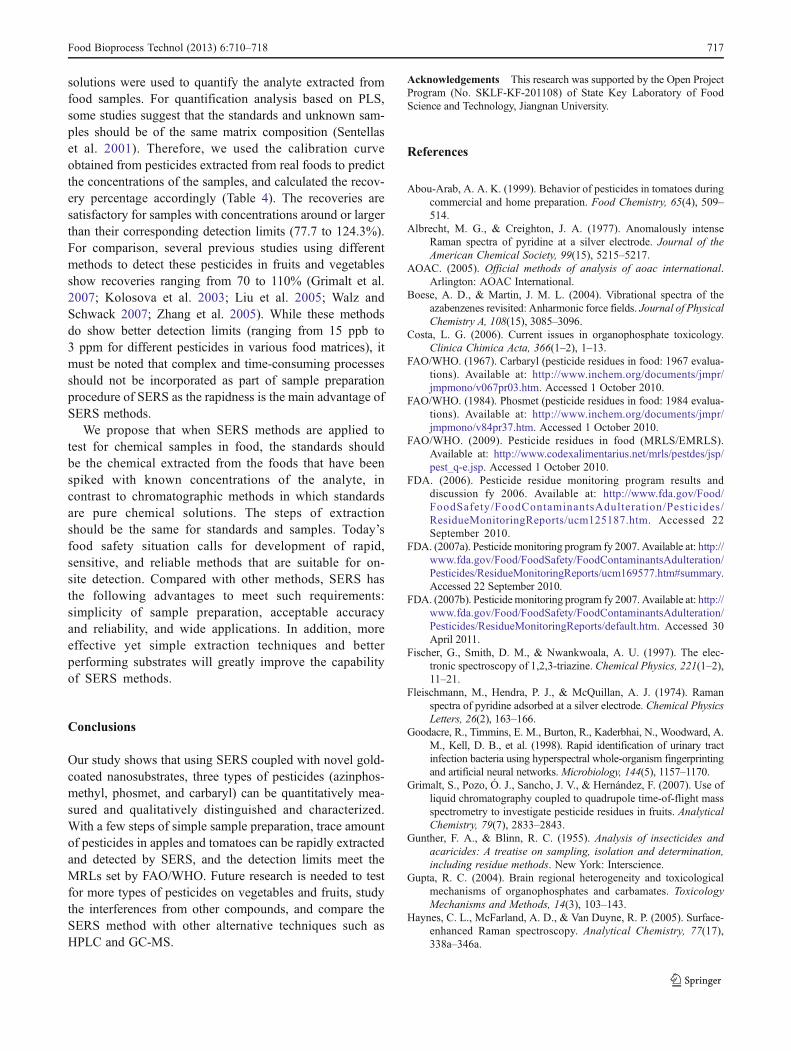
Fig. 1 Scanning electron microscope image of a Q-SERS™ G1 sub-strate surfaces (inset high magnification image of an individualnanoparticle)
712 Food Bioprocess Technol (2013) 6:710–718
Results and Discussion
Figure 1 shows an SEM image of the surface of a gold-coated Q-SERS™ G1 substrate, which exhibits two layersof nanostructures. The larger nanoparticles have sizes of 20-60 nm and their surfaces are covered by smaller nanopar-ticles with sizes of 4-6 nm. Most of those bigger nano-particles with sizes of 40-50 nm are connected, but someof them have a gap of about 20 nm between each other. Thestructures of nanosubstrates are not highly uniform whenobserving at nanoscale. Thus, the SERS enhancement fac-tors at different locations are expected to be differentdepending on the size and spacing of nanoparticles. How-ever, if one spot on the substrate is compared to another atmicroscale, the structures of substrates are very uniform.During SERS measurement, a laser beam with a diameterof 5 μm was typically applied. If a spot with a diameter of5 μm is compared with another spot of identical size on asubstrate, the numbers of active hotspots should be at thesame level, and the enhancement factors of these two spotsare almost identical. The surface coverage of the nanopar-ticles by a thin layer of gold is uniform and complete, whichis confirmed by the fact that no silicon peak was detected inthe SERS spectra.
Figure 2 shows molecular structures of three types ofpesticides (azinphos-methyl, carbaryl, and phosmet). To
Fig. 3 Average SERS spectra(n08) of pesticide solutionsand solid (a1 azinphos-methylsolution, a2 azinphos-methylsolid, b1 carbaryl solution, b2carbaryl solid, c1 phosmetsolution, c2 phosmet solid). Theconcentration of all solutions is50 ppm. Measurements wereconducted with a 10-s exposuretime and ~20 mW laser power.Spectra were presented withsmoothing at 4 cm−1 and base-line adjustment by subtracting asecond order polynomialfunction
N
NN
OSP
S
OO
Azinphos-methyl
N
S
O
O
P
O
S
O
Phosmet
O
NH
O
Carbaryl
Fig. 2 Molecular structures of three types of pesticides (azinphos-methyl, carbaryl, and phosmet)
Food Bioprocess Technol (2013) 6:710–718 713
confirm that no interfering signals were introduced by sol-vent or other factors, SERS spectra of the three pesticides inboth solution and solid forms were obtained and compared,as shown in Fig. 3. For all three pesticides, signals ofsolution and solid forms agree well with each other, indi-cating that the solvent used did not produce interferingsignals in measurement. The intensity of some peaks inspectra obtained from the solution is apparently differentfrom their counterparts in spectra obtained from the solid(e.g., a peak at 730 cm−1 in carbaryl spectra and peaks in580–740 cm−1 region in phosmet spectra). This may be dueto the interaction between solute and solvent molecules.These peaks were not used for quantification analysis.
SERS was used to measure solutions containing differentconcentrations of three pesticides. Average SERS spectra(n08) of carbaryl are shown in Fig. 4, while similar resultswere obtained for the other two pesticides (data not shown).The carbaryl spectra are highly consistent with a previousreport using Ag nanoparticle-coated Si nanowire as SERSsubstrate, in which the intensity of 1,380 and 1,440 cm−1
peaks decreased as concentration of carbaryl decreased(Wang et al. 2010). Band assignments were summarized inTable 1 based on other published data (Boese and Martin
2004; Fischer et al. 1997; Socrates 2004; Trotter 1977). Forexample, a strong peak at 1,380 cm−1 may be due to thesymmetric vibration of the naphthalene ring. The naphthalenering of carbaryl is mono-substituted, and the 1,440 cm−1 peakmay be from unspecified vibrations of this ring. Anotherstrong peak at 1,565 cm−1 can be attributed to the stretchingof C0C double bonds in the naphthalene ring. In general, ourresults agreed well with previous reports.
Second derivative transformation is a powerful tool inanalysis of spectral data. It can separate overlapping peaks,eliminate baseline effects, and enhance spectral resolution.Spectra of carbaryl solutions were preprocessed using sec-ond derivative transformation. Figure 5 shows the mostprominent feature at 1,380 cm−1 in the spectra. This figuredemonstrates that SERS is able to differentiate spectral pat-terns between different concentrations of carbaryl in a mixedsolvent. A drawback of this approach is that it may not provide
Fig. 4 Average SERS spectra (n08) of carbaryl solutions with differentconcentrations. Measurements were conducted with a 10-s exposure timeand ~20mW laser power. Spectra were presentedwith smoothing at 4 cm−1
and baseline adjustment by subtracting a second order polynomial function
Table 1 Band assignments of major peak in SERS spectra acquiredfrom three pesticides
Band (cm−1) Assignment
Azinphos-methyl
587w δ(C0O)
674m υ(P0S)
703s Benzene ring breathing
775s, 897m 1,2,3-triazine ring breathing
1026m Asymmetric P–O–C deformation vibration
1221s γ(C–H) in P–O–CH3
1258s υ(C–N) in S–CH2–N
1283m, 1302s υ(C–N) in O0C–N
1332w 1,2,3-triazine ring breathing
1399w γ(C–H) in S–CH2–N
1450s υ(N0N)
1495w,1576vw
1,2,3-triazine ring breathing
Carbaryl
1380vs Symmetric ring vibration
1440m Unspecified ring vibration of mono-substitutednaphthalene
1565s υ(C0C) in naphthalene ring
Phosmet
606s δ(C0O)
653m δ(P0S)
675m υ(P0S)
712m Benzene ring breathing
1014m Asymmetric P–O–C deformation vibration
1191m γ(C–H) in P–O–CH3
1260m υ(C–N) in S–CH2–N
1409w γ(C–H) in S–CH2–N
1714m υ(C0O)
w weak, m medium, s strong, v very, υ stretching, δ in-plain deforma-tion vibration, γ out-of plane deformation vibration
714 Food Bioprocess Technol (2013) 6:710–718
a direct discrimination between samples containing relativelyhigh concentrations of pesticides (larger than 10 ppm). Asshown in Fig. 5, the height of the peak at 1,380 cm−1 does notdiffer much between the spectral samples of 10 and 50 ppm,which is also the case for the other two pesticides.
PLS analysis was applied on spectra of all three pesticidesamples. RMSEP values obtained from the PLS models ofcarbaryl with different latent variables are shown in Fig. 6.The spectral data were preprocessed with smoothing at 4 cm−1
in the whole spectral region. The lowest RMSEP value wasachieved when five latent variables were used, suggesting thatthe optimal number of latent variables to construct a PLSmodel is 5. The optimal number for building PLS models is5 for azinphos-methyl and 6 for phosmet. PLS predictionresults for carbaryl (n054) are shown in Fig. 7 by plottingpredicted pesticide concentrations against actual pesticideconcentrations (R00.84; RMSEP01.954×10−5). Forazinphos-methyl and phosmet, R values are 0.98 and 0.85,
and RMSEP values are 7.269×10⁻⁶ and 1.823×10⁻⁵. With Rvalues all larger than 0.83, results of PLS analyses suggest thatPLS can serve as a reliable method to quantify pesticides.
PCA was conducted based on the spectra acquired fromall three pesticides to investigate if SERS can differentiatedifferent pesticides. The results of using the first two PCs toclassify samples are shown in Fig. 8, indicating that PCAwith the first two PCs could be used to discriminate the threepesticide samples quite well. Although Fig. 8 shows clearsegregation between the three pesticide samples, a smallportion of samples overlapped with each other. Because aSERS spectrum reflects the characteristics of chemicalstructure of the analyte, it is possible that one of the PCscan be assigned to common chemical groups. Bothazinphos-methyl and phosmet are organophosphorus com-pounds and possess a functional group [S0P(OCH3)2], sowhen using the first two PCs to classify them, overlappingof data clusters may occur. In contrast, carbaryl does not
Fig. 5 Part of second derivative transformation of average SERS spectra(n08) acquired from different concentrations of carbaryl solutions
Fig. 6 Root mean square error of prediction (RMSEP) values obtainedfrom the partial least squares (PLS) models based on carbaryl spectrawith different latent variables
R = 0.8386RMSEP = 19.54
Fig. 7 Predicted carbaryl concentration (ppm) vs. actual carbaryl con-centration (ppm) using the PLS models: smoothing 4 cm−1, baselineadjustment by subtracting a second order polynomial function; five latentvariables; spectral region, 1,200–1,700 cm−1; spectral number n054
Fig. 8 Classification of pesticides using first two principal compo-nents (PCs)
Food Bioprocess Technol (2013) 6:710–718 715
contain such phosphorus group, but it has a naphthalenestructure, which is similar to aromatic rings that the othertwo pesticides have. This would explain why some of carbarylsamples overlapped with those of phosmet and azinphos-methyl. SERS spectra acquired from higher concentrationsof samples exhibited more significant differences from eachother because richer information of chemical structures of theanalytes was reflected in SERS spectra.
SERS was used to detect carbaryl, phosmet, andazinphos-methyl extracted from real food samples. Detec-tion limits for the pesticides were calculated by Eq. 2. As anexample, calibration curve of carbaryl extracted from appleskin is shown in Fig. 9. Results of detection limit for threepesticides are summarized in Table 2, indicating that satis-factory prediction results could be obtained by SERS. Max-imum residue limits (MRLs) of the three pesticides tested inthis study have been established for apples and tomatoes byFood and Agriculture Organization of the United Nations(FAO) and World Health Organization (WHO), as shown inTable 3 (FAO/WHO 1967, 1984, 2009). Comparing the
MRLs with the results in Table 2, it can be concluded thatthe SERS method meets the requirement of carbaryl andphosmet. For azinphos-methyl, more efficient extractionprocedures and better performing substrates is needed toimprove the result.
It was argued that a thicker waxy outer layer of tomato skinfavors penetration of pesticides because the layer contributesto the stability of pesticides in it (Gunther and Blinn 1955).This claimwas supported by the fact that after being applied towhole tomatoes, most of dimethoate, profenofos, andpirimiphos-methyl, all of which are organophosphorus pesti-cides, were found to be retained in the skin of tomatoes(Abou-Arab 1999). In addition, peeling reduces over 83% ofthe three organophosphorus pesticides in tomatoes (Abou-Arab 1999). For apples, it was shown that 24 h after applica-tion, over 85% of azinphos-methyl and phosmet residueslocate in the skin and the outside 2 mm of the apple flesh(Wise et al. 2009). Therefore, our method of peeling the fruitand applying pesticide solutions onto the skin did not causesignificant sampling errors compared to common approachessuch as extracting pesticides from whole fruit homogenates.
To calculate the recovery of pesticides, we took anapproach different from common chromatographic methodsin which the calibration curves obtained from pure pesticide
Fig. 9 Calibration curve of carbaryl extracted from apple skin usingthe PLS models, showing standard error: smoothing 4 cm−1, baselineadjustment by subtracting a second order polynomial function; fourlatent variables; spectral region, 1,340–1,420 cm−1; spectral numbern030
Table 2 Calculation of detection limits (DL) of SERS method forcarbaryl, phosmet, and azinphos-methyl extracted from apple andtomato samples
R Standard error Slope DL (ppm)
Sample: apple
Carbaryl 0.94 1.41 0.94 4.51
Phosmet 0.87 1.77 0.82 6.51
Azinphos-methyl 0.88 1.89 0.85 6.66
Sample: tomato
Carbaryl 0.82 1.19 0.67 5.35
Phosmet 0.91 0.83 0.86 2.91
Azinphos-methyl 0.91 0.84 0.85 2.94
Table 4 Recovery of pesticide concentration (percentage) in applesand tomatoes
a Quantified values are shown as mean±standard deviation (n06)
Table 3 Maximum residue limits (MRLs) of carbaryl, azinphos-methyl, and phosmet in apples and tomatoes established by FAO/WHO
Pesticide Maximum residue limits (ppm)
Apple Tomato
Carbaryl 6–10 5
Phosmet 10 N/A
Azinphos-methyl 1 2
716 Food Bioprocess Technol (2013) 6:710–718
solutions were used to quantify the analyte extracted fromfood samples. For quantification analysis based on PLS,some studies suggest that the standards and unknown sam-ples should be of the same matrix composition (Sentellaset al. 2001). Therefore, we used the calibration curveobtained from pesticides extracted from real foods to predictthe concentrations of the samples, and calculated the recov-ery percentage accordingly (Table 4). The recoveries aresatisfactory for samples with concentrations around or largerthan their corresponding detection limits (77.7 to 124.3%).For comparison, several previous studies using differentmethods to detect these pesticides in fruits and vegetablesshow recoveries ranging from 70 to 110% (Grimalt et al.2007; Kolosova et al. 2003; Liu et al. 2005; Walz andSchwack 2007; Zhang et al. 2005). While these methodsdo show better detection limits (ranging from 15 ppb to3 ppm for different pesticides in various food matrices), itmust be noted that complex and time-consuming processesshould not be incorporated as part of sample preparationprocedure of SERS as the rapidness is the main advantage ofSERS methods.
We propose that when SERS methods are applied totest for chemical samples in food, the standards shouldbe the chemical extracted from the foods that have beenspiked with known concentrations of the analyte, incontrast to chromatographic methods in which standardsare pure chemical solutions. The steps of extractionshould be the same for standards and samples. Today’sfood safety situation calls for development of rapid,sensitive, and reliable methods that are suitable for on-site detection. Compared with other methods, SERS hasthe following advantages to meet such requirements:simplicity of sample preparation, acceptable accuracyand reliability, and wide applications. In addition, moreeffective yet simple extraction techniques and betterperforming substrates will greatly improve the capabilityof SERS methods.
Conclusions
Our study shows that using SERS coupled with novel gold-coated nanosubstrates, three types of pesticides (azinphos-methyl, phosmet, and carbaryl) can be quantitatively mea-sured and qualitatively distinguished and characterized.With a few steps of simple sample preparation, trace amountof pesticides in apples and tomatoes can be rapidly extractedand detected by SERS, and the detection limits meet theMRLs set by FAO/WHO. Future research is needed to testfor more types of pesticides on vegetables and fruits, studythe interferences from other compounds, and compare theSERS method with other alternative techniques such asHPLC and GC-MS.
Acknowledgements This research was supported by the Open ProjectProgram (No. SKLF-KF-201108) of State Key Laboratory of FoodScience and Technology, Jiangnan University.
References
Abou-Arab, A. A. K. (1999). Behavior of pesticides in tomatoes duringcommercial and home preparation. Food Chemistry, 65(4), 509–514.
Albrecht, M. G., & Creighton, J. A. (1977). Anomalously intenseRaman spectra of pyridine at a silver electrode. Journal of theAmerican Chemical Society, 99(15), 5215–5217.
AOAC. (2005). Official methods of analysis of aoac international.Arlington: AOAC International.
Boese, A. D., & Martin, J. M. L. (2004). Vibrational spectra of theazabenzenes revisited: Anharmonic force fields. Journal of PhysicalChemistry A, 108(15), 3085–3096.
Costa, L. G. (2006). Current issues in organophosphate toxicology.Clinica Chimica Acta, 366(1–2), 1–13.
FAO/WHO. (1967). Carbaryl (pesticide residues in food: 1967 evalua-tions). Available at: http://www.inchem.org/documents/jmpr/jmpmono/v067pr03.htm. Accessed 1 October 2010.
FAO/WHO. (1984). Phosmet (pesticide residues in food: 1984 evalua-tions). Available at: http://www.inchem.org/documents/jmpr/jmpmono/v84pr37.htm. Accessed 1 October 2010.
FAO/WHO. (2009). Pesticide residues in food (MRLS/EMRLS).Available at: http://www.codexalimentarius.net/mrls/pestdes/jsp/pest_q-e.jsp. Accessed 1 October 2010.
FDA. (2006). Pesticide residue monitoring program results anddiscussion fy 2006. Available at: http://www.fda.gov/Food/FoodSafety/FoodContaminantsAdulteration/Pesticides/ResidueMonitoringReports/ucm125187.htm. Accessed 22September 2010.
FDA. (2007a). Pesticide monitoring program fy 2007. Available at: http://www.fda.gov/Food/FoodSafety/FoodContaminantsAdulteration/Pesticides/ResidueMonitoringReports/ucm169577.htm#summary.Accessed 22 September 2010.
FDA. (2007b). Pesticidemonitoring program fy 2007. Available at: http://www.fda.gov/Food/FoodSafety/FoodContaminantsAdulteration/Pesticides/ResidueMonitoringReports/default.htm. Accessed 30April 2011.
Fischer, G., Smith, D. M., & Nwankwoala, A. U. (1997). The elec-tronic spectroscopy of 1,2,3-triazine. Chemical Physics, 221(1–2),11–21.
Fleischmann, M., Hendra, P. J., & McQuillan, A. J. (1974). Ramanspectra of pyridine adsorbed at a silver electrode. Chemical PhysicsLetters, 26(2), 163–166.
Goodacre, R., Timmins, E. M., Burton, R., Kaderbhai, N., Woodward, A.M., Kell, D. B., et al. (1998). Rapid identification of urinary tractinfection bacteria using hyperspectral whole-organism fingerprintingand artificial neural networks. Microbiology, 144(5), 1157–1170.
Grimalt, S., Pozo, Ó. J., Sancho, J. V., & Hernández, F. (2007). Use ofliquid chromatography coupled to quadrupole time-of-flight massspectrometry to investigate pesticide residues in fruits. AnalyticalChemistry, 79(7), 2833–2843.
Gunther, F. A., & Blinn, R. C. (1955). Analysis of insecticides andacaricides: A treatise on sampling, isolation and determination,including residue methods. New York: Interscience.
Gupta, R. C. (2004). Brain regional heterogeneity and toxicologicalmechanisms of organophosphates and carbamates. ToxicologyMechanisms and Methods, 14(3), 103–143.
Haynes, C. L., McFarland, A. D., & Van Duyne, R. P. (2005). Surface-enhanced Raman spectroscopy. Analytical Chemistry, 77(17),338a–346a.
He, F. (2000). Neurotoxic effects of insecticides—Current and futureresearch: A review. Neurotoxicology, 21(5), 829–835.
He, L., Kim, N.-J., Li, H., Hu, Z., & Lin, M. (2008a). Use of a fractal-like gold nanostructure in surface enhanced Raman spectroscopyfor detection of selected food contaminants. Journal of Agriculturaland Food Chemistry, 56(21), 9843–9847.
He, L., Liu, Y., Lin, M., Awika, J., Ledoux, D. R., Li, H., et al. (2008b).A new approach to measure melamine, cyanuric acid, and mela-mine cyanurate using surface enhanced Raman spectroscopy cou-pled with gold nanosubstrates. Sensing and Instrumentation forFood Quality and Safety, 2(1), 66–71.
Jeanmaire, D. L., & Van Duyne, R. P. (1977). Surface raman spectroe-lectrochemistry: Part I. Heterocyclic, aromatic, and aliphaticamines adsorbed on the anodized silver electrode. Journal ofElectroanalytical Chemistry, 84(1), 1–20.
Kegley, S. E., & Wise, L. J. (1998). Pesticides in fruits and vegetables.Mill Valley: University Science Books.
Kneipp, K., Kneipp, H., Itzkan, I., Dasari, R. R., & Feld, M. S. (2002).Surface-enhanced Raman scattering and biophysics. Journal ofPhysics: Condensed Matter, 14(18), R597–R624.
Kolosova, A. Y., Park, J.-H., Eremin, S. A., Kang, S.-J., & Chung,D.-H. (2003). Fluorescence polarization immunoassay based on amonoclonal antibody for the detection of the organophosphoruspesticide parathion-methyl. Journal of Agricultural and FoodChemistry, 51(5), 1107–1114.
Lai, K., Zhang, Y., Du, R., Zhai, F., Rasco, B., & Huang, Y. (2011).Determination of chloramphenicol and crystal violet with surfaceenhanced Raman spectroscopy. Sensing and Instrumentation forFood Quality and Safety, 5(1), 19–24.
Liu, M., Hashi, Y., Song, Y., & Lin, J.-M. (2005). Simultaneousdetermination of carbamate and organophosphorus pesticides infruits and vegetables by liquid chromatography–mass spectrometry.Journal of Chromatography A, 1097(1–2), 183–187.
Liu, B., Lin, M., & Li, H. (2010). Potential of sers for rapid detectionof melamine and cyanuric acid extracted from milk. Sensing andInstrumentation for Food Quality and Safety, 4(1), 13–19.
Lu, X., Al-Qadiri, H., Lin, M., & Rasco, B. (2011). Application ofmid-infrared and Raman spectroscopy to the study of bacteria.Food and Bioprocess Technology, 4(6), 919–935.
Ortelli, D., Edder, P., & Corvi, C. (2005). Pesticide residues survey incitrus fruits. Food Additives and Contaminants, 22(5), 423–428.
Rawn, D. F. K., Quade, S. C., Shields, J. B., Conca, G., Sun, W.-F.,Lacroix, G. M. A., et al. (2006). Organophosphate levels in apple
composites and individual apples from a treated canadian orchard.Journal of Agricultural and Food Chemistry, 54(5), 1943–1948.
Sentellas, S., Saurina, J., Hernández-Cassou, S., Galceran, M. T., &Puignou, L. S. (2001). Multivariate calibration methods for quan-tification in strongly overlapping capillary electrophoretic peaks.Journal of Chromatography A, 909(2), 259–269.
Shadi, I. T., Xu, Y., & Goodacre, R. (2010). Quantitative analysis of thebanned food dye sudan-1 using surface enhanced Raman scatteringwith multivariate chemometrics. Journal of Physical Chemistry C,114(16), 7285–7290.
Socrates, G. (2004). Infrared and Raman characteristic group frequencies.New York: Wiley.
Strickland, A. D., & Batt, C. A. (2009). Detection of carbendazim bysurface-enhanced Raman scattering using cyclodextrin inclusioncomplexes on gold nanorods. Analytical Chemistry, 81(8), 2895–2903.
Trotter, P. J. (1977). Azo dye tautomeric structures determined by laser-Raman spectroscopy. Applied Spectroscopy, 31(1), 30–35.
Valdés-Ramírez, G., Fournier, D., Ramírez-Silva, M. T., & Marty, J. L.(2008). Sensitive amperometric biosensor for dichlorovos quanti-fication: Application to detection of residues on apple skin.Talanta, 74(4), 741–746.
Walz, I., & Schwack, W. (2007). Multienzyme inhibition assay forresidue analysis of insecticidal organophosphates and carbamates.Journal of Agricultural and Food Chemistry, 55(26), 10563–10571.
Wang, X. T., Shi, W. S., She, G. W., Mu, L. X., & Lee, S. T. (2010).High-performance surface-enhanced Raman scattering sensorsbased on ag nanoparticles-coated si nanowire arrays for quantita-tive detection of pesticides. Applied Physics Letters, 96, 053104–053104.
Wesseling, C., Keifer, M., Ahlbom, A., McConnell, R., Moon, J.-D.,Rosenstock, L., et al. (2002). Long-term neurobehavioral effectsof mild poisonings with organophosphate and n-methyl carbamatepesticides among banana workers. International Journal ofOccupational and Environmental Health, 8(1), 27–34.
Wise, J. C., Vanderpoppen, R., & Vandervoort, C. (2009). Curativeactivity of insecticides on rhagoletis pomonella (Diptera: Tephri-tidae) in apples. Journal of Economic Entomology, 102(5), 1884–1890.
Zhang, Y., Muench, S. B., Schulze, H., Perz, R., Yang, B., Schmid, R.D., et al. (2005). Disposable biosensor test for organophosphateand carbamate insecticides in milk. Journal of Agricultural andFood Chemistry, 53(13), 5110–5115.