MNRAS 441, 1134–1146 (2014) doi:10.1093/mnras/stu641 Detection of vibronic bands of C 3 in a translucent cloud towards HD 169454 M. R. Schmidt, 1 ‹ J. Krelowski, 2 G. A. Galazutdinov, 3, 4 D. Zhao, 5 M. A. Haddad, 6 W. Ubachs 6 and H. Linnartz 5 1 Department of Astrophysics, N. Copernicus Astronomical Center, ul. Rabia´ nska 8, PL-87-100 Toru´ n, Poland 2 Centre for Astronomy, Nicolaus Copernicus University, Gagarina 11, PL-87-100 Toru´ n, Poland 3 Instituto de Astronomia, Universidad Catolica del Norte, Av. Angamos 0610, Antofagasta, Chile 4 Pulkovo Observatory, Pulkovskoe Shosse 65, Saint-Petersburg 196140, Russia 5 Raymond and Beverly Sackler Laboratory for Astrophysics, Leiden Observatory, Leiden University, PO Box 9513, NL-2300 RA Leiden, the Netherlands 6 Department of Physics and Astronomy, LaserLaB, VU University, De Boelelaan 1081, NL-1081 HV Amsterdam, the Netherlands Accepted 2014 March 26. Received 2014 March 21; in original form 2013 June 13 ABSTRACT We report the detection of eight vibronic bands of C 3 , seven of which have been hitherto unobserved in astrophysical objects, in the translucent cloud towards HD 169454. Four of these bands are also found towards two additional objects: HD 73882 and HD 154368. Very high signal-to-noise ratio (∼1000 and higher) and high resolving power (R = 80 000) UVES-VLT spectra (Paranal, Chile) allow for detecting novel spectral features of C 3 , even revealing weak perturbed features in the strongest bands. The work presented here provides the most complete spectroscopic survey of the so far largest carbon chain detected in translucent interstellar clouds. High-quality laboratory spectra of C 3 are measured using cavity ring-down absorption spectroscopy in a supersonically expanding hydrocarbon plasma, to support the analysis of the identified bands towards HD 169454. A column density of N(C 3 ) = (6.6 ± 0.2) × 10 12 cm −2 is inferred and the excitation of the molecule exhibits two temperature components; T exc = 22 ± 1 K for the low-J states and T exc = 187 ± 25 K for the high-J tail. The rotational excitation of C 3 is reasonably well explained by models involving a mechanism including inelastic collisions, formation and destruction of the molecule, and radiative pumping in the far-infrared. These models yield gas kinetic temperatures comparable to those found for T exc . The assignment of spectral features in the UV-blue range 3793–4054Å may be of relevance for future studies aiming at unravelling spectra to identify interstellar molecules associated with the diffuse interstellar bands (DIBs). Key words: stars: individual: HD 169454 – ISM: abundances – ISM: clouds – ISM: molecu- les. 1 INTRODUCTION Currently, some 180 different molecules have been detected in dense inter- and circumstellar clouds, largely in radio- and submilimetre surveys, with this number growing with several new species per year. However, only about 10 simple molecules are observed in the visible part of the electromagnetic spectrum as absorption fea- tures originating in translucent clouds, transparent for optical wave- lengths. Among them are homonuclear species, such as H 2 ,C 2 and C 3 , which are not accessible to radio observations. Bare carbon chains do not exhibit pure rotational transitions, because of the lack of a permanent dipole moment, and thus only their electronic or E-mail: [email protected]vibrational spectral features can be observed. The latter cover the spectral range from the vacuum UV until the far-infrared. Determi- nation of the abundances of simple carbon molecules in interstellar clouds is important, as they are considered building blocks for many already known interstellar molecules with a carbon skeleton. After the 19th century discovery of the 4052 Å band in the spec- trum of comet Tebbutt (Huggins 1881) and the assignment of this blue absorption feature to the C 3 molecule (Douglas 1951), the tri- atomic carbon chain radical was detected in the circumstellar shell of the star IRC+10216 (Hinkle, Keady & Bernath 1988) and sub- sequently, albeit tentatively, in the interstellar medium (Haffner & Meyer 1995). Cernicharo, Goicochea & Caux (2000) detected nine lines of the ν 2 bending mode towards Sgr B2 and IRC+10216, ob- served in the laboratory by Giesen et al. (2001). This spectral range is, however, not applicable to observations of translucent clouds. C 2014 The Authors Published by Oxford University Press on behalf of the Royal Astronomical Society at Leiden University on August 18, 2014 http://mnras.oxfordjournals.org/ Downloaded from
Detection of vibronic bands of C3 in a translucent cloud towardsHD 169454
M. R. Schmidt,1‹ J. Krełowski,2 G. A. Galazutdinov,3,4 D. Zhao,5 M. A. Haddad,6
W. Ubachs6 and H. Linnartz5
1Department of Astrophysics, N. Copernicus Astronomical Center, ul. Rabianska 8, PL-87-100 Torun, Poland2Centre for Astronomy, Nicolaus Copernicus University, Gagarina 11, PL-87-100 Torun, Poland3Instituto de Astronomia, Universidad Catolica del Norte, Av. Angamos 0610, Antofagasta, Chile4Pulkovo Observatory, Pulkovskoe Shosse 65, Saint-Petersburg 196140, Russia5Raymond and Beverly Sackler Laboratory for Astrophysics, Leiden Observatory, Leiden University, PO Box 9513, NL-2300 RA Leiden, the Netherlands6Department of Physics and Astronomy, LaserLaB, VU University, De Boelelaan 1081, NL-1081 HV Amsterdam, the Netherlands
Accepted 2014 March 26. Received 2014 March 21; in original form 2013 June 13
ABSTRACTWe report the detection of eight vibronic bands of C3, seven of which have been hithertounobserved in astrophysical objects, in the translucent cloud towards HD 169454. Four ofthese bands are also found towards two additional objects: HD 73882 and HD 154368.Very high signal-to-noise ratio (∼1000 and higher) and high resolving power (R = 80 000)UVES-VLT spectra (Paranal, Chile) allow for detecting novel spectral features of C3, evenrevealing weak perturbed features in the strongest bands. The work presented here provides themost complete spectroscopic survey of the so far largest carbon chain detected in translucentinterstellar clouds. High-quality laboratory spectra of C3 are measured using cavity ring-downabsorption spectroscopy in a supersonically expanding hydrocarbon plasma, to support theanalysis of the identified bands towards HD 169454. A column density of N(C3) = (6.6 ±0.2) × 1012 cm−2 is inferred and the excitation of the molecule exhibits two temperaturecomponents; Texc = 22 ± 1 K for the low-J states and Texc = 187 ± 25 K for the high-J tail.The rotational excitation of C3 is reasonably well explained by models involving a mechanismincluding inelastic collisions, formation and destruction of the molecule, and radiative pumpingin the far-infrared. These models yield gas kinetic temperatures comparable to those foundfor Texc. The assignment of spectral features in the UV-blue range 3793–4054 Å may be ofrelevance for future studies aiming at unravelling spectra to identify interstellar moleculesassociated with the diffuse interstellar bands (DIBs).
Currently, some 180 different molecules have been detected in denseinter- and circumstellar clouds, largely in radio- and submilimetresurveys, with this number growing with several new species peryear. However, only about 10 simple molecules are observed inthe visible part of the electromagnetic spectrum as absorption fea-tures originating in translucent clouds, transparent for optical wave-lengths. Among them are homonuclear species, such as H2, C2 andC3, which are not accessible to radio observations. Bare carbonchains do not exhibit pure rotational transitions, because of the lackof a permanent dipole moment, and thus only their electronic or
vibrational spectral features can be observed. The latter cover thespectral range from the vacuum UV until the far-infrared. Determi-nation of the abundances of simple carbon molecules in interstellarclouds is important, as they are considered building blocks for manyalready known interstellar molecules with a carbon skeleton.
After the 19th century discovery of the 4052 Å band in the spec-trum of comet Tebbutt (Huggins 1881) and the assignment of thisblue absorption feature to the C3 molecule (Douglas 1951), the tri-atomic carbon chain radical was detected in the circumstellar shellof the star IRC+10216 (Hinkle, Keady & Bernath 1988) and sub-sequently, albeit tentatively, in the interstellar medium (Haffner &Meyer 1995). Cernicharo, Goicochea & Caux (2000) detected ninelines of the ν2 bending mode towards Sgr B2 and IRC+10216, ob-served in the laboratory by Giesen et al. (2001). This spectral rangeis, however, not applicable to observations of translucent clouds.
High-resolution observations using the Herschel/HIFI instrumentdetected transitions of C3 originating in the warm envelopes of mas-sive star-forming regions (Mookerjea et al. 2010, 2012); in theseenvironments high densities of 105–106 cm−3 prevail, whereas indiffuse clouds densities are limited to 103 cm−3. The presence ofC3 in the diffuse interstellar medium was proven by Maier et al.(2001), based on the detection of the A1�u– X 1�+
g 000–000 band
close to 4052 Å towards three reddened stars. Up to now, the high-est resolution study of C3 in such environments was reported byGalazutdinov et al. (2002b), although restricted to a few objectsonly. These observations provided the only reliable estimates sofar of the abundance of this molecule, yielding values an order ofmagnitude below that of C2. Other observations of C3 in translucentclouds (Roueff et al. 2002; Adamkovics, Blake & McCall 2003;Oka et al. 2003) suffered from lower signal-to-noise ratios (S/N),giving rise to large uncertainties in the deduced column densities.
The existing data for linear carbon molecules longer than C3,like C4 (Linnartz et al. 2000), or C5 (Motylewski et al. 1999),fail to provide firm evidence for their existence in the interstellarmedium (Galazutdinov et al. 2002a; Maier, Walker & Bohlender2002, 2004). For a systematic investigation of the conditions un-der which carbon-based molecules are produced in the interstel-lar medium, a larger class of targets exhibiting a variety of op-tical properties and physical conditions in the intervening cloudshas to be observed. The targeted objects should be selected fortranslucent clouds with the carbon-bearing molecules producinga single Doppler-velocity component, thus allowing for an unam-biguous analysis of the spectrum, and resulting in accurate columndensities.
The identification of the carriers of diffuse interstellar bands(DIBs) remains, since their discovery by Heger (1922), one of thepersistently unresolved problems in spectroscopy. The current list ofunidentified interstellar absorption features contains more than 400entries (Hobbs et al. 2008). The presence of substructures inside DIBprofiles, discovered by Sarre et al. (1995) and by Kerr et al. (1998),supports the hypothesis of their molecular origin. The establishedrelation between profile widths of DIBs and rotational temperaturesof linear carbon molecules (Kazmierczak et al. 2010a) makes thelatter interesting targets for observations. Both C2 and C3 may showdifferent rotational temperatures along different lines of sight, asshown by Adamkovics et al. (2003). This is associated with the factthat their rotational transitions are forbidden and thus cooling oftheir internal degrees of freedom is inefficient. For this reason, anaccurate determination of rotational excitation temperatures of shortcarbon chains may help to shed light on the origin of the mysteriouscarriers of the DIBs (Kazmierczak et al. 2010b).
Observationally, the spectral features originating from either C2
or C3 typically turn out to be rather shallow and thus high S/N andhigh spectral resolution are required to establish accurate values forthe excitation temperature. The aim of the present investigation isto use the superior capabilities of UVES-VLT to obtain high qualityspectra of C3. All previous studies were based solely on the strongest000–000 band of the A1�u– X 1�+
g electronic system. Here, ad-ditional vibronic bands in the A1�u– X 1�+
g electronic systemof C3 are identified along sightlines towards objects HD 169454,HD 73882, and HD 154368. A detailed analysis of eight vibronicbands detected towards the object HD 169454 is presented. The as-tronomical observations are supported by a high-quality laboratoryinvestigation, using cavity ring-down laser spectroscopy, producingfully rotationally resolved C3 spectra of the vibronic bands in theA– X system. The combined information of laboratory and ob-served spectra is used to deduce column densities and a rotational
Table 1. A list of observed targets in which C3 was detected at4052 Å with specific physical characteristics and observed S/N.
Star SpL V B − V E(B − V) S/NHD 73882 O8V 7.21 +0.40 0.67 ∼1900HD 154368 O9.5Iab 6.14 +0.50 0.73 ∼2200HD 169454 B1Ia 6.62 +0.90 1.11 ∼2800
temperature of C3 in HD 169454 The results are interpreted in termsof excitation models for C3 (Roueff et al. 2002) and a chemicalmodel of a translucent cloud towards HD 169454.
2 M E T H O D S
2.1 Observations
The observational material, of which a target list is presented inTable 1, was obtained using the UVES spectrograph mounted onthe ESO Very Large Telescope at Paranal (Chile) with resolutionR = 80 000 in the blue arm (3020–4980 Å) occupying the C3 bandsof interest, as well as CH and CH+. The data set comprises spectraacquired during our observation run of 2009 March [program 082.C-0566(A)] and data from the ESO Archive programs 71.C-0367(A)and 076.C-0431(B). The spectra, averaged over 10–50 exposures,are of exceptionally high S/N with values between 1900 and 2800.
All spectra were reduced with the standard IRAF packages, as wellas our own DECH code (Galazutdinov 1992), providing the standardprocedures of image and spectra processing. Using different com-puter codes for data analysis reduces the inaccuracies connectedto the slightly different ways of dark subtraction, flat fielding, orexcision of cosmic ray hits.
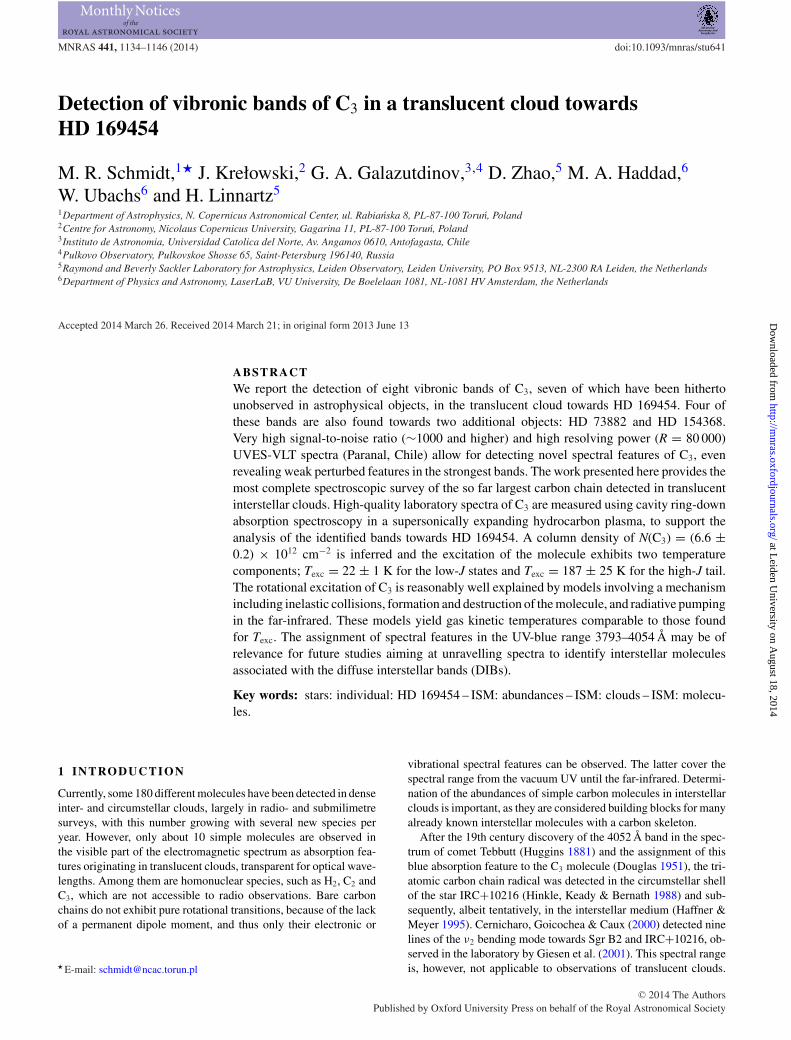
The very high S/N of the spectra allowed us to detect sevenA– X vibronic C3 bands in addition to the A– X origin (000–000)band in the spectrum of the heavily reddened star: HD 169454.Four vibronic bands were also detected in sightlines towards HD73882 and HD 154368. These two sightlines are not analysed indetail in this paper. The resulting spectra for these four bands in allthree objects are shown in Fig. 1 and are illustrative for the qual-ity of the observational data. All targets are heavily reddened andcharacterized by strong molecular features. The individual spectraof identified vibronic bands in the sightline to HD 169454 are pre-sented in Figs 2–9, alongside with the laboratory spectra, in the orderof excited vibrations: ν1ν
+/−2 ν3 for symmetric stretching, bending,
degenerate, and asymmetric stretching, respectively, as well as com-bination modes. In this sequence of figures the laboratory spectraare plotted with blue lines, the astronomical spectra are displayed asblack histograms overlaid with a thin line representing a syntheticspectrum based on the detailed analysis. The identification of rota-tional lines is indicated by vertical lines. In the C3 A1�u– X 1�+
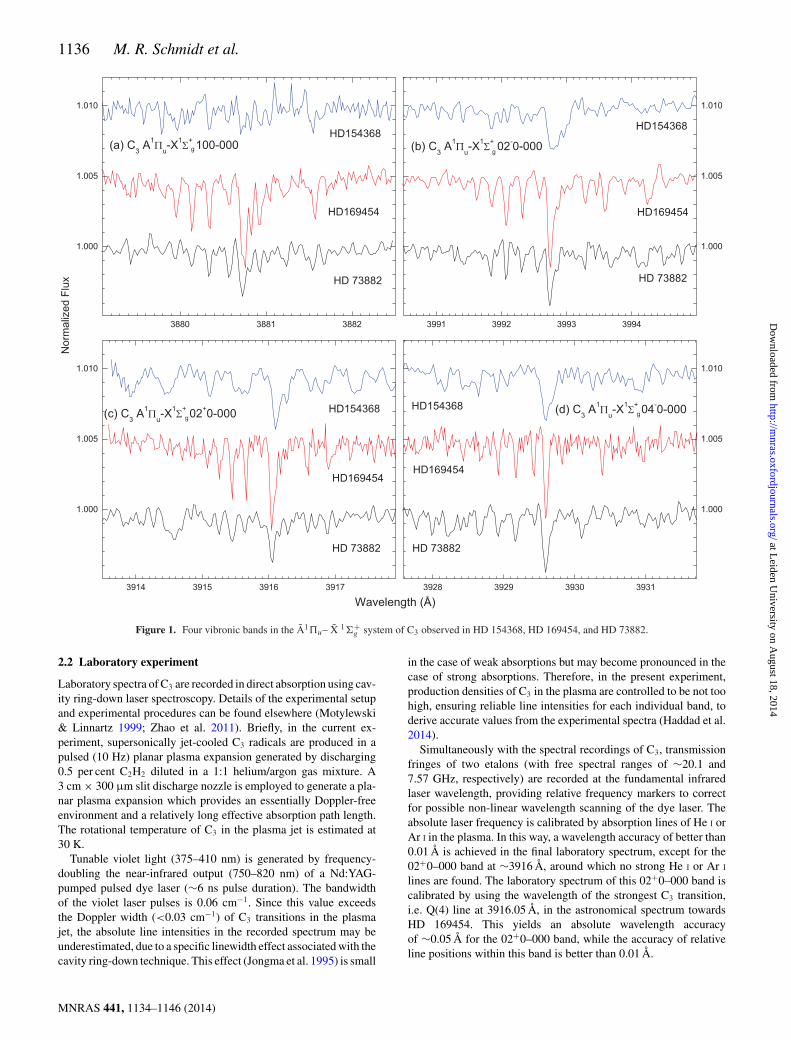
g
000–000 band (see Fig. 2), a series of perturber lines is observed,confirming findings of a laboratory study by Zhang et al. (2005).These perturber features are marked with additional thin verticallines in Fig. 2.
For the detailed analysis of the vibronic bands in the sightlineto HD 169454 the spectrum was shifted to the rest wavelengthvelocity frame using the CH A-X and B-X lines. Redshifts as largeas 0.85 km s−1 were observed in the case of CN B-X (0,0) linesand 2.8 km s−1 in the case of the Ca I 4226.7 Å line. While fittingindividual bands some shifts in wavelengths are necessary, mostlyconsistent with velocities of the CN lines.
Figure 1. Four vibronic bands in the A1�u– X 1�+g system of C3 observed in HD 154368, HD 169454, and HD 73882.
2.2 Laboratory experiment
Laboratory spectra of C3 are recorded in direct absorption using cav-ity ring-down laser spectroscopy. Details of the experimental setupand experimental procedures can be found elsewhere (Motylewski& Linnartz 1999; Zhao et al. 2011). Briefly, in the current ex-periment, supersonically jet-cooled C3 radicals are produced in apulsed (10 Hz) planar plasma expansion generated by discharging0.5 per cent C2H2 diluted in a 1:1 helium/argon gas mixture. A3 cm × 300 µm slit discharge nozzle is employed to generate a pla-nar plasma expansion which provides an essentially Doppler-freeenvironment and a relatively long effective absorption path length.The rotational temperature of C3 in the plasma jet is estimated at30 K.
Tunable violet light (375–410 nm) is generated by frequency-doubling the near-infrared output (750–820 nm) of a Nd:YAG-pumped pulsed dye laser (∼6 ns pulse duration). The bandwidthof the violet laser pulses is 0.06 cm−1. Since this value exceedsthe Doppler width (<0.03 cm−1) of C3 transitions in the plasmajet, the absolute line intensities in the recorded spectrum may beunderestimated, due to a specific linewidth effect associated with thecavity ring-down technique. This effect (Jongma et al. 1995) is small
in the case of weak absorptions but may become pronounced in thecase of strong absorptions. Therefore, in the present experiment,production densities of C3 in the plasma are controlled to be not toohigh, ensuring reliable line intensities for each individual band, toderive accurate values from the experimental spectra (Haddad et al.2014).
Simultaneously with the spectral recordings of C3, transmissionfringes of two etalons (with free spectral ranges of ∼20.1 and7.57 GHz, respectively) are recorded at the fundamental infraredlaser wavelength, providing relative frequency markers to correctfor possible non-linear wavelength scanning of the dye laser. Theabsolute laser frequency is calibrated by absorption lines of He I orAr I in the plasma. In this way, a wavelength accuracy of better than0.01 Å is achieved in the final laboratory spectrum, except for the02+0–000 band at ∼3916 Å, around which no strong He I or Ar I
lines are found. The laboratory spectrum of this 02+0–000 band iscalibrated by using the wavelength of the strongest C3 transition,i.e. Q(4) line at 3916.05 Å, in the astronomical spectrum towardsHD 169454. This yields an absolute wavelength accuracyof ∼0.05 Å for the 02+0–000 band, while the accuracy of relativeline positions within this band is better than 0.01 Å.
Figure 2. Spectrum of the C3 A1�u - X 1�+g 000–000 band. Upper spectrum: laboratory measurement by cavity ring-down spectroscopy in a planar plasma
jet. Lower spectrum: observation in the sightline to HD 169454. Positions of rotational lines are tagged with thick lines. Thin lines tag rotational lines due toperturbing states based on the analysis of Zhang et al. (2005). The astronomical spectrum is overlaid with fitted curves: the red curve represents a fit usingonly unperturbed lines; for the blue curve perturber lines are included in the fit. Note the remaining deviation for the intensity of the R(0) line in the simulatedspectrum (see text).
These data sets are used to build a C3 line list, as is discussed inthe next section.
3 MO L E C U L A R DATA
The vibronic bands in the A1�u– X 1�+g electronic system of
C3 have been previously investigated in the laboratory by Gaussetet al. (1965); Balfour et al. (1994); Tokaryk & Chomiak (1997);McCall et al. (2003); Tanabashi et al. (2005); Zhang et al. (2005);Chen et al. (2010). Most studies were performed at lower spectralresolution and consequently lower wavelength precision than thedata presented here. The present laboratory spectra, combined withthe previously reported data, allow us to build a highly preciseline list for C3. Tables 3–5 summarize the list of laboratory linepositions, details of which are given in the subsections below.
3.1 A– X oscillator strength and Franck–Condon factors
In our analysis we rely on the determination of the oscillator strengthfrom a measurement of the lifetime of the upper electronic stateA1�u corresponding to a value of fel = 0.0246 (Becker, Tatarcyk& Radic-Peric 1979). With a calculation of the Franck–Condonfactor (FCF) for the 000–000 band (Radic-Peric et al. 1977) yield-ing 0.74, this translates approximately to f000 = 0.016, a valuepreviously used in the analyses of interstellar C3 by Maier et al.(2001), Adamkovics et al. (2003), and Oka et al. (2003). Com-putations of FCFs carried out by Jungen & Merer (1980) in aneffective large amplitude formalism lead to 15 per cent lower valueof f000 = 0.0146 used by Roueff et al. (2002). Our choice is dictatedby easy comparison to earlier determinations of C3 column densi-ties in sightline to HD 169454 in light of uncertainty of the FCFvalue.
Figure 3. Laboratory spectrum (blue line) and astronomical spectrum inthe sightline to HD 169454 (black) for the C3 A1�u– X 1�+
g 100–000band. A synthetic spectrum overplots the observed spectrum with a redline. Positions of rotational lines are indicated with vertical lines. Note thepresence of additional lines marked by (*) in the laboratory spectrum (seetext).
Figure 4. Laboratory spectrum (blue line) and astronomical spectrum inthe sightline to HD 169454 (black) for the C3 A1�u– X 1�+
g 02−0–000band.
Figure 5. Laboratory spectrum (blue line) and astronomical spectrum inthe sightline to HD 169454 (black) for the C3 A1�u– X 1�+
g 02+0–000band.
Figure 6. Spectrum in sightline to HD 169454 (black) and laboratory spec-trum (blue line) for the C3 A1�u– X 1�+
g 04−0–000 band.
Figure 7. Spectrum in sightline to HD 169454 (black) and laboratory spec-trum (blue line) of the C3 A1�u– X 1�+
g 04+0–000 band. Perturber linesare marked with (*); see text.
Figure 8. Spectrum in sightline to HD 169454 (black) and laboratory spec-trum (blue line) of the C3 A1�u– X 1�+
J&M Jungen & Merer (1980); R-P Radic-Peric et al. (1977); References:(1) Zhang et al. (2005); (2) This work; (3) Tokaryk & Chomiak (1997); (4)Gausset et al. (1965); (5) Chen et al. (2010).
Interpretation of the other band intensities requires knowledge ofthe FCFs for individual vibronic bands. Calculation of FCFs is ham-pered by the occurrence of low-frequency and large-angle bendingmodes, as well as by perturbations in the A1�u state, which affectsthe A– X electronic transition moment as well as the FCFs. Com-putations of FCFs were carried out by Jungen & Merer (1980) inan effective large amplitude formalism for the transitions involvingbending modes. Calculations performed by Radic-Peric et al. (1977)resulted in different FCF values. The intensities in the astronomicalspectra were used to experimentally determine FCFs as well. Forthis purpose the intensities for R(0), R(2), R(4) and R(6) transitions,most easily identifiable, except in the 120–000 band, were used, andnormalized to the value of f000 = 0.016 of Radic-Peric et al. (1977)adopted in this paper. A summary of available FCFs from the twotheoretical studies and the presently determined experimental val-ues is listed in Table 2. The experimentally determined values, thatagree in most cases with the average of both theoretical studies, areused for producing the line strengths included in the molecular linelists in Tables 3–5.
Because all bands have a � (K = 1) upper vibronic state and a� (K = 0) lower ground state, the Honl–London factors for thesebands, for �K = 1 (corresponding to both �l = 0 and �l = 2) are:1/2(J + 2)/(2J + 1), 1/2, and 1/2(J − 1)/(2J + 1) for R-, Q-, andP-branch transitions, respectively. The heavily perturbed 000–000band requires a more sophisticated treatment, as is discussed below.
Table 3. The C3 line list for the A– X 000–000 band as obtained from thepresent analysis. Perturber lines are marked with an asterisk (*).
The origin band has been analysed in detail in various laboratoryinvestigations (Gausset et al. 1965; McCall et al. 2003; Tanabashiet al. 2005; Zhang et al. 2005). Earlier indications of a misassignedR(0) transition were clarified and a number of extra transitions wereidentified by McCall et al. (2003). Zhang et al. (2005) proposed anexplanation for the existence of extra transitions via intensity bor-rowing to two perturbing states lying close to the upper A1�u 000state, and presented an effective Hamiltonian for the upper A1�u
000 state. The laboratory spectrum for this band, shown in Fig. 2,agrees reasonably well with previous work, and provides more reli-able line intensities for the sightline spectrum towards HD 169454,particularly for the weaker transitions and transitions involving per-turbing states. Using the new laboratory data it was possible to im-prove the Hamiltonian significantly, and the perturbed componentsare now better reproduced. Note that some perturbed transitions arepositively identified in the astronomical spectra – see transitionsmarked with an asterisk in Fig. 2. Still, in this perturbation analysisthere remains a discrepancy for the R(0) line, as is clearly seen inthe simulated spectrum, shown in Fig. 2. For the R(0) line there is anearly equal mixture between singlet and triplet characters with anindication of an additional perturbation for the very lowest J-value,not addressed previously. Oscillator strengths obtained from this
new analysis together with derived column densities are presentedin Table 3. However, data for the R(0) and P(2) lines of this band arenot used for deriving column densities, in view of the severe per-turbations in the J = 1 excited level and the deviations still presentin the modelling in this part of the spectrum (cf. Fig. 2). For J > 20the values are taken from Tanabashi et al. (2005).
Because of the remaining discrepancies, we propose the fol-lowing approach to deal with intensities of perturbed components.Under the assumption of a single electronic transition moment, per-turbed components related to a high vibrational level of the b 3�g
state borrow intensity from the A– X transition. Summing overequivalent widths of regular and perturbed components, columndensities can be derived for the A– X 000–000 band using lineintensities neglecting effects of perturbations. The correspondingoscillator strengths are then based on the Honl–London factors andpresented in Table 4 with wavelengths of regular components. Thisapproach is finally used in the determination of column densities inSection 4.
3.3 A– X 100–000 band at 3881 Å
A line list for the 100–000 band is deduced from the present lab-oratory spectrum, shown in Fig. 3, providing line positions at anaccuracy better than 0.01 Å. The line list is extended by transitionsnot observed in the laboratory spectrum by the following proce-dure. First, the observed lines are used for the determination ofspectroscopic constants of the upper state, fixing the spectroscopicconstants of the X ground state to values derived by Tanabashiet al. (2005). The evaluated spectroscopic constants of the A 100upper state are then used for extending the line list for J up to 50.The residuals between experimental and predicted line positions are
Table 5. The C3 line list for transitions to excited vibrational levels in theA state.
in general at the level of 0.01 Å. The laboratory spectrum containsthree extra lines, which are not indicative for a perturbation, butrather due to another unknown species present in the plasma expan-sion, as cavity ring down is not mass selective. These features donot appear in the spectrum of HD 169454.
The line positions from Tokaryk & Chomiak (1997), the most accu-rate analysis of this band up to now, agree well with our laboratorydata, shown in Fig. 4. Earlier laboratory work by Gausset et al.(1965) and Balfour et al. (1994) suffered from low resolution andmost probably from contamination by 020–020 emission bands,resulting in misassignments of some rotational lines. Consistencybetween our spectrum towards HD 169454 and the laboratory spec-trum further strengthens the assignments by Tokaryk & Chomiak(1997).
3.5 A– X 02+0–000 band at 3916 Å
Entries for the line list are taken from the present laboratory spec-trum, shown in Fig. 5, and extended to higher-J transitions based onthe deduced molecular constants. As the absolute wavelength cal-ibration relies on the observational spectrum towards HD 169454,the wavelength positions in this band are of a lower accuracy, at thelevel of ∼0.05 Å.
3.6 A– X 04−0–000 band at 3930 Å
The line list is extracted from the present laboratory data, shown inFig. 6, and extended to higher-J transitions. Previously reported databy Gausset et al. (1965) and Balfour et al. (1994) do not reproducethe observed spectrum in a consistent manner, likely for misassignas explained in Section 3.4.
3.7 A– X 04+0–000 band at 3802 Å
The line list is extracted from the present laboratory data, shown inFig. 7. Extra lines in the laboratory spectrum marked with an asterisk(*) are associated with perturbation features; based on combinationdifferences these extra lines are assigned as R(6) and P(8) lines.
3.8 A– X 002–000 band at 3794 Å
The line list is extracted from the laboratory data shown in Fig. 8.Spectroscopic constants for the upper state are derived, yieldingmore accurate values than in Chen et al. (2010). Large residualsof ∼0.05 Å are found indicating perturbations in the upper statefor J > 14 transitions. Therefore, the line list of this band is notextended beyond this J value.
3.9 A– X 120–000 band at 3826 Å
The line list for this band is extracted from the laboratory data. Dueto its weakness, this band is barely visible towards HD 169454.However the detection of this band, based on the low-J Q branchlines clearly visible in Fig. 9, is certain. The quality of the datais not of sufficient accuracy to determine line strengths or columndensities.
The line lists providing the C3 molecular data are presented inTable 3 for the A– X 000–000 band taking into account the effectof perturbations, in Table 4 for regular transitions only, and inTable 5 for the vibronic bands probing excited vibrations in theupper state, with exception of the 120–000 band system. For a fulllist of laboratory line positions of the A– X 000–000 band anda more detailed account of the perturbation analysis, we refer toHaddad et al. (2014).
4 DATA A NA LY SI S: COLUMN DENSI TI ES
Equivalent widths of rotationally resolved lines in vibronic bands ofthe C3 A– X system have been measured using DECH and indepen-dently with the DEBLEND task of the IRAF package. Errors of equivalentwidths were based on a noise model with constant Gaussian widthtaken from a measured S/N estimated at 2000. When tracing of thecontinuum was dubious, a systematic error was added. Further, incase of blends, or broad absorptions underlying spectral lines, thefull width at half-maximum (FWHM) of a Gaussian profile wasfixed to the value of the instrumental width (0.051 Å) for the as-tronomical observations (corresponding to R = 80 000). This valuefor the FWHM of the instrumental profile is confirmed by the bestfits to clean absorbing lines. The C3 line positions were found to besystematically redshifted by a value comparable or smaller than theaccuracy of the laboratory measurements, 0.01 Å, corresponding toa maximal redshift of 0.8 km s−1.
Observations of C2 in the sightline to HD 169454 with the UltraHigh Resolution Facility (Crawford 1997) indicated the existenceof at least two velocity components present in the intervening dif-fuse cloud. Yet, the components are barely resolved and a possiblesplitting has been ignored in our analysis. Since the C3 lines in thepresent study are relatively weak, Wλ ≤ 2 mÅ, column densities ofC3 can be deduced assuming the cloud to be optically thin, so thatthe total column density is equal to the sum of those of the veloc-ity components. This assumption may influence the final excitationtemperatures but does not affect the observed column densities.
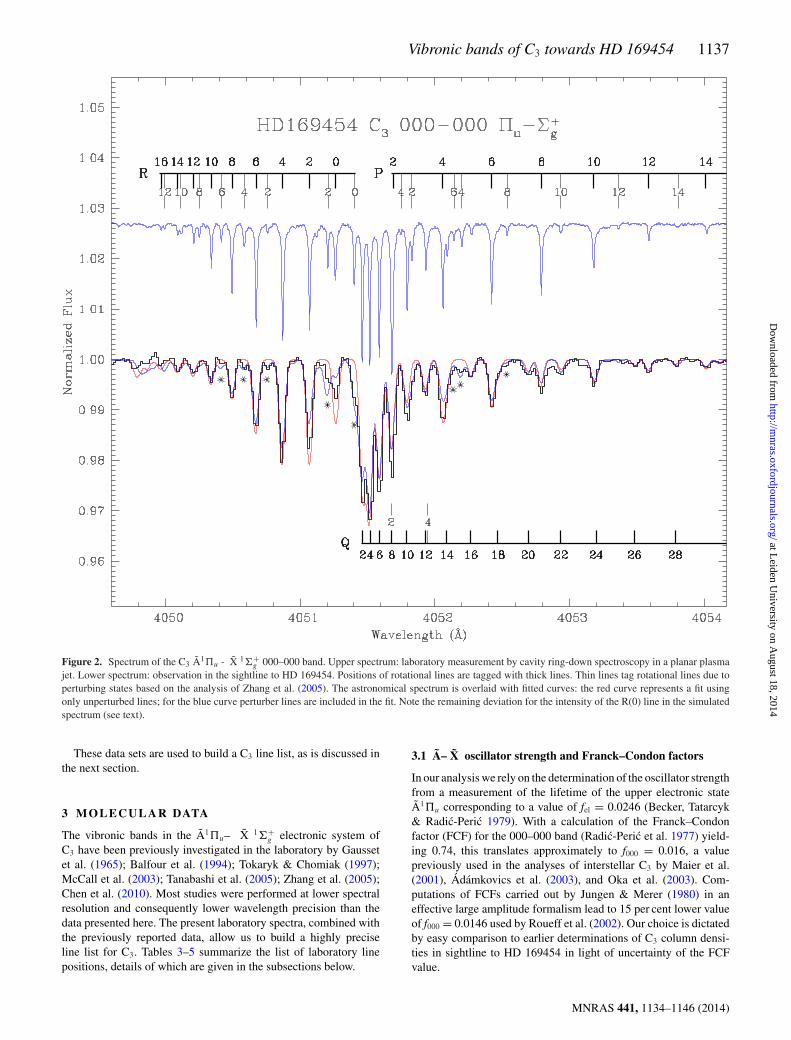
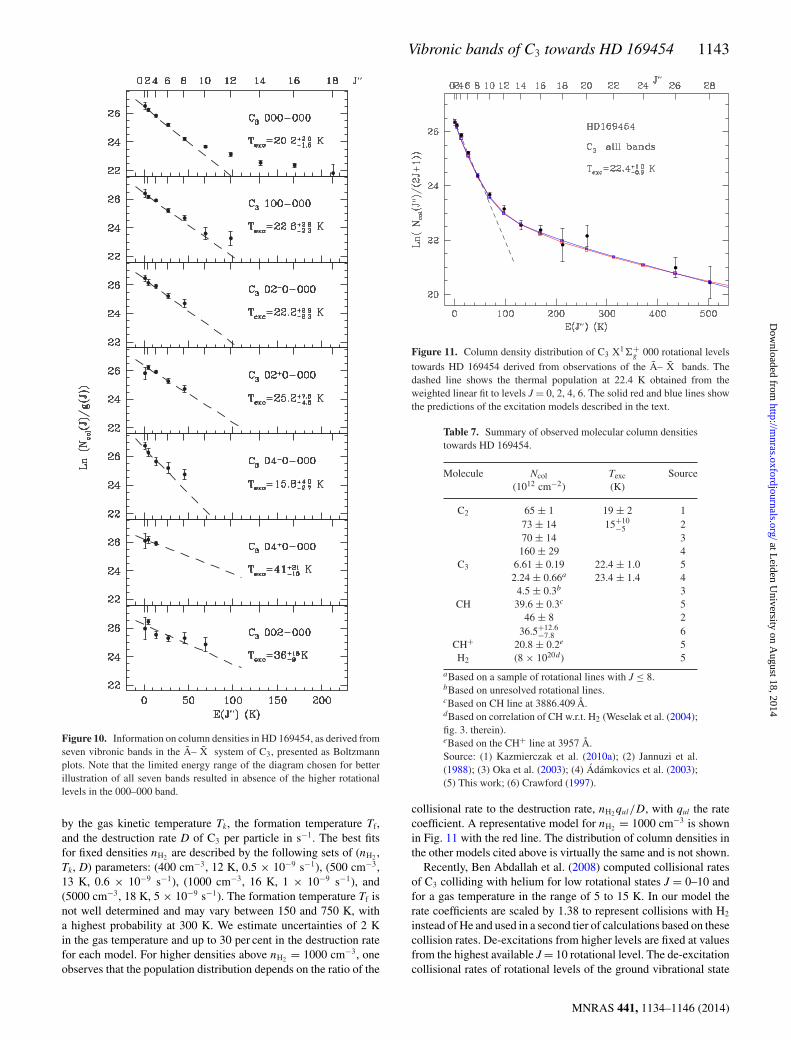
Column densities of the X ground state levels for each quantumnumber J are derived from the equivalent widths and based onthe line lists of Tables 4 and 5. Note that the equivalent widths inTable 4 are sum of regular and perturbed components available fromTable 3. The resulting column densities are listed in Table 6 for eachband separately. The last column contains the weighted average ofall analysed bands. The one-but-last row of Table 6 shows columndensities summed over the observed transitions in each separateband. The derived column densities, listed in Table 6, are presentedin the form of Boltzmann plots for individual bands in Fig. 10, upto J = 18. An extended Boltzmann plot for the weighted averagecolumn densities of the analysed A– X bands, including higher Jlevels solely dependent on the A– X 000–000 band, is presented inFig. 11. In such plots the negative inverse of the slope of the straightline is equal to the excitation temperature. For each band we showthe least square fit for the lowest J = 0, 2, 4, 6 rotational levels andthe resulting value of the excitation temperature. The distributionof the column densities shows a characteristic ‘two-temperature’behaviour, as was also found in previous studies (e.g. Maier et al.2001, see their fig. 5).
To assess the quality of the analysis and line lists we have per-formed a simulation of all observed bands based on the obtainedparameters for the column densities and the excitation temperature.Synthetic spectra are computed, assuming an instrumental FWHMof 0.051 Å, and included in Figs 2–9 as a thin red line. Inspection ofthe eight vibronic bands observed towards HD 169454 (see Figs 2–9) shows that intensities in the Q-branch are slightly overestimatedin spectra of the bending modes. When using line lists compiledfrom literature data, this caused a serious problem, particularly inthe case of the 04+0–000 band, where the best fit to the R branchoverestimated the Q band intensity at least twice. With the newlycomposed line lists (Tables 3 and 5) these discrepancies vanished,suggesting that the origin of the inconsistencies were in erroneousassignments of the lines, and/or improper treatment of perturbationsin the spectra.
The excitation temperature of the lowest levels is expected tobe close to the gas kinetic temperature in analogy to the excitationmodel for C2 (van Dishoeck & Black 1982). The information of theweighted average column densities of all bands is used to derive anaccurate excitation temperature. The low-J rotational lines of theA– X 000–000 band are strongly perturbed, but using the procedureof summation of equivalent widths of regular and perturbed transi-tions we believe to have reduced significantly the effect of unknownintensities of individual components. The excitation temperature ofthe lowest J = 0, 2, 4, and 6 levels determined from the best fit isfound to be 22.4+1.0
−0.9 K. The excitation temperature of the high-J tailis 187+25
−19 K (see also Fig. 11).For the determination of the total column density an estimate for
the population of the unobserved levels must be invoked. This isaccomplished by fitting the observed average column densities withthe analytical formula
lnNcol(J )
2J + 1= a exp(−E(J )/b) + c + d E(J ), (1)
where E is the excitation energy of level J, and a, b, c and d arefree parameters. The population of the lowest J = 0, 2, 4, 6, 8levels is represented by a linear fit corresponding to an excitationtemperature of 22.4 K. Using this approach we have computed thetotal C3 column densities (see the last row of Table 6) resulting in avalue of Ncol = (6.61 ± 0.19) × 1012 cm−2 for the weighted averageover all bands.
The differences between the column densities determined for theindividual bands are representative for the overall quality of our dataand the procedures followed. The total column density concludedfrom the weighted average of all bands is shown in Table 7 as avalue representative for C3 along with column densities for otherspecies.
From the present observations it is also possible to deduce a CHcolumn density towards HD 169454 from the lowest Q and R linesin the B-X violet band at 3886.409 and 3890.217 Å, probing bothlowest-J �-doublet components, under the assumption that the linesare optically thin. The column density of CH+ towards HD 169454
is obtained from the 3597 Å transition in the A-X (1,0) band. Theresulting values are included in Table 7.
5 E X C I TAT I O N M O D E L S
Recently, Roueff et al. (2002; see also Welty et al. 2013) presentedan excitation model of C3 towards HD 210121. An interesting as-pect of their approach was the inclusion of destruction and forma-tion processes of C3, in view of its short lifetime in typical diffuseclouds. As a consequence, the initial population of the highest rota-tional levels in the formation process may not change significantlyby collisions before the molecule is destroyed by photodissociation.For a quantitative estimate of the population distribution two crudeapproximations were made. First, it was assumed that the destruc-tion rate of C3 is the same in each energetic state. Secondly, C3 isassumed to be formed in rotational states following a Boltzmanndistribution characterized by a formation temperature, Tf.
For the analysis of our data, we have performed computationsstrictly following this approach outlined by Roueff et al. (2002)using their original collisional rates in the first set of models andmodified collisional rates as described below in a second set ofmodels. The calculations are performed with the RADEX code of vander Tak et al. (2007). Minor modifications are necessary to includeproduction and destruction terms into the statistical equilibriumequations.
There is some degeneracy in the model parameters providinggood fits to the observed populations. A one-parameter family ofmodels may be constructed as a function of the gas density, hereassumed to be composed of molecular hydrogen. The density nH2
is varied in a range between 400 and 5000 cm−3, since it cannotbe determined unambiguously. A χ2-test of the goodness-of-fit wasused for the determination of the best fits among the family of mod-els assuming a 1 per cent significance level. Values below 400 cm−3
are ruled out by the fit. The upper bound of 5000 cm−3 is chosen onphysical grounds as a value significantly exceeding the gas densityin the sightline to HD 169454 as concluded from models describingC2 excitation (Kazmierczak et al. 2010a; Casu & Cecchi-Pestellini2012), nH2 = 350–500 cm−3. The models are also characterized
Figure 10. Information on column densities in HD 169454, as derived fromseven vibronic bands in the A– X system of C3, presented as Boltzmannplots. Note that the limited energy range of the diagram chosen for betterillustration of all seven bands resulted in absence of the higher rotationallevels in the 000–000 band.
by the gas kinetic temperature Tk, the formation temperature Tf,and the destruction rate D of C3 per particle in s−1. The best fitsfor fixed densities nH2 are described by the following sets of (nH2 ,Tk, D) parameters: (400 cm−3, 12 K, 0.5 × 10⁻⁹ s−1), (500 cm−3,13 K, 0.6 × 10⁻⁹ s−1), (1000 cm−3, 16 K, 1 × 10⁻⁹ s−1), and(5000 cm−3, 18 K, 5 × 10⁻⁹ s−1). The formation temperature Tf isnot well determined and may vary between 150 and 750 K, witha highest probability at 300 K. We estimate uncertainties of 2 Kin the gas temperature and up to 30 per cent in the destruction ratefor each model. For higher densities above nH2 = 1000 cm−3, oneobserves that the population distribution depends on the ratio of the
Figure 11. Column density distribution of C3 X1�+g 000 rotational levels
towards HD 169454 derived from observations of the A– X bands. Thedashed line shows the thermal population at 22.4 K obtained from theweighted linear fit to levels J = 0, 2, 4, 6. The solid red and blue lines showthe predictions of the excitation models described in the text.
Table 7. Summary of observed molecular column densitiestowards HD 169454.
aBased on a sample of rotational lines with J ≤ 8.bBased on unresolved rotational lines.cBased on CH line at 3886.409 Å.dBased on correlation of CH w.r.t. H2 (Weselak et al. (2004);fig. 3. therein).eBased on the CH+ line at 3957 Å.Source: (1) Kazmierczak et al. (2010a); (2) Jannuzi et al.(1988); (3) Oka et al. (2003); (4) Adamkovics et al. (2003);(5) This work; (6) Crawford (1997).
collisional rate to the destruction rate, nH2qul/D, with qul the ratecoefficient. A representative model for nH2 = 1000 cm−3 is shownin Fig. 11 with the red line. The distribution of column densities inthe other models cited above is virtually the same and is not shown.
Recently, Ben Abdallah et al. (2008) computed collisional ratesof C3 colliding with helium for low rotational states J = 0–10 andfor a gas temperature in the range of 5 to 15 K. In our model therate coefficients are scaled by 1.38 to represent collisions with H2
instead of He and used in a second tier of calculations based on thesecollision rates. De-excitations from higher levels are fixed at valuesfrom the highest available J = 10 rotational level. The de-excitationcollisional rates of rotational levels of the ground vibrational state
are an order of magnitude larger than the qul = 2 × 10⁻¹¹ cm3 s−1
assumed by Roueff et al. (2002). As a result, the models with thenew collisional rates require a much higher destruction rate to fit theobserved column densities well. This is shown in the two exemplarymodels characterized by set of (nH2 , Tk, D) parameters: (500 cm−3,18 K, 12 × 10−9 s−1) and (1000 cm−3, 18 K, 24 × 10−9 s−1). Alsoin this set of models the broad range of formation temperaturesbetween 150 and 750 K with peak probability around 250 K isacceptable. In a large range of densities the gas temperature isvirtually constant and amounts to 18 K with a higher uncertainty of3 K. The representative model corresponding to nH2=500 cm−3 isshown in Fig. 11 as a blue line. Even if the conversion of collisionalrates to collisions with H2 is inaccurate, collisions with only He(20 per cent of the molecular hydrogen density) require an increaseof the destruction rate D by over a factor of 2 with respect to theoriginal model of Roueff et al. (2002).
The presented models cannot determine uniquely the gas den-sity nor the destruction rate or the formation temperature withoutadditional assumptions made for these parameters. The first set ofexcitation models requires that nH2 must be higher than 2000 cm−3
to produce a gas kinetic temperature Tk in agreement with the ex-citation temperature Texc, here 22 K, derived from the low-J curvein the Boltzmann plot. The second set of models does not allow toput any such constraints on the density.
If the destruction of C3 is mainly caused by photodissociationthen the photodissociation rate in the radiative field defined byDraine (1978) amounts to 5 × 10⁻⁹ s−1 (van Dishoeck 1988).Assuming that the centre of the cloud for a total extinction AV of2.8–3.4 (see section 7) is penetrated by such a radiation field andthat in the UV-range extinction is twice as high as in the visiblerange, a destruction rate of 0.5 × 10⁻⁹ follows. Hence, a significantenhancement of the radiation field is necessary to explain the resultsof models with collisional rates based on computations by BenAbdallah et al. (2008). Another possibility, not further discussedhere, is that other C3 destruction processes are decisive. Clearly,more detailed research on collisional rates is necessary before thephysical conditions of the molecular gas can be deduced in detailfrom the C3 column densities.
6 D ISCUSSION
Since the first identification of C3 in diffuse clouds by Maier et al.(2001) estimations of C3 abundances are prone to large uncertain-ties due to low S/N of the astronomical observations. Availabledeterminations of column densities for C3 towards HD 169454 aresummarized in Table 7. Adamkovics et al. (2003) were able toextract populations of only five rotational levels up to J = 8. Anestimate of the column density was made by Oka et al. (2003) on thebasis of the contour shape of the pile of Q-lines. In the present high-resolution analysis individual transitions are resolved in the A1�u–X 1�+
g 000–000 band and complementary information from thevibronic bands is used, yielding accurate column densities for C3.
The chemical formation pathway of C3 in diffuse clouds is closelyrelated to two other molecules commonly observed in the opticalrange, C2 and CH (see e.g. Oka et al. 2003). The C2 moleculeprovides also information on the gas temperature, analogous to C3.
The column density of C2 in the sightline to HD 169454was analysed previously. Kazmierczak et al. (2010a) derivedNcol(C2) =1013 cm−2 and a gas temperature of 19 K. Recently,Casu & Cecchi-Pestellini (2012) redefined the C2 excitation model
by van Dishoeck & Black (1982), and based on new collisionalrates of Najar et al. (2008) it was suggested that this diffuse cloudmust be composed of two spatial components. From an analysisof the observational C2 data of Kazmierczak et al. (2010a), theyidentified a dense component with nH2 = 500 cm−3 and a morediffuse component of 50 cm−3 assuming background galactic radi-ation as in van Dishoeck & Black (1982). The gas temperatures inthe two components were estimated at 20 and 100 K, respectively.The parameters of the dense component are very close to thosedetermined by Kazmierczak et al. (2010a), ntot = 330 cm−3 andTkin = 19 K, using the original model by van Dishoeck & Black(1982).
Column densities of CH based on the strong 4300 Å line in thesightline to HD 169454 have been reported previously (e.g. Jannuziet al. 1988). Here we determine a column density from the weakerCH B-X system, which is in agreement with the previous result, butmore accurate.
The column density of molecular hydrogen towards HD 169454was never directly determined. We estimate N(H2) at 8 × 1020 cm−2
indirectly from the correlation of H2 with CH using a relation foundby Weselak et al. (2004). The total column density of N(C3) =6.6 × 1012 cm−2 then corresponds to a fractional abundanceC3/H2 = 8.2 × 10⁻⁹.
The present determination of the collisional temperature of 22 ±1 K for C3 compares well with the value of 19 ± 2 K ob-tained for C2 towards the same line of sight (Kazmierczak et al.2010a). Excitation models for C3 (Roueff et al. 2002) and for C2
(van Dishoeck & Black 1982) assume that the lowest rotational lev-els from which the excitation temperature is determined are closeto thermal. This suggests that the gas temperature for both speciesshould be about the same, i.e. 21 ± 2 K. A detailed analysis interms of excitation models for C3 shows that the value of 21 Klies in acceptable range of parameters, with some exceptions forwhen the gas density nH2 is lower than 2000 cm−3 in the first set ofmodels. At lower gas densities of 350-500 cm−3, as suggested bythe analysis of excitation of C2 towards HD 169454 (Kazmierczaket al. 2010a; Casu & Cecchi-Pestellini 2012), a lower value forthe gas temperature is necessary. This may be attributed to the factthat C3 should form in the central part of the diffuse cloud towardsHD 169454, at a slightly lower gas kinetic temperature. In viewof the many uncertainties in the prevailing excitation models weconsider these values as in acceptable agreement.
The derived value of the gas temperature is close to that foundin detailed models of diffuse molecular clouds including processeson grains (Hollenbach et al. 2009). For AV = 1.7 the gas kinetictemperature for n = 103 cm−3 and radiation field expressed in unitsof the Draine field intensity G0 = 1 is in the range between 15and 20 K (see fig. 11 in Hollenbach et al. 2009) and similarly forn = 104 cm−3 and G0=10 (see fig. 7 in Hollenbach et al. 2009).The excitation model for C2 allows an estimation of the ratio of nto G0 and does not constrain the radiation field.
Crawford (1997) observed C2 and CH (as well as CN) towardsHD 169454 detecting two slightly separated (by 0.7 ± 0.1 km s−1)velocity components in the C2 lines. The possible presence of mul-tiple clouds in the sightline does not impair the obtained results,because the lines are optically thin and the excitation conditionsand gas densities derived by Crawford (1997) are quite similar.However, the presence of multiple clouds may influence the chem-ical analysis, effectively lowering the optical depth to the externalradiation field in each cloud.
7 IN T E R S T E L L A R C L O U D TOWA R D SH D 1 6 9 4 5 4
The observational data offer another opportunity to analyse thechemical abundances of small carbon chains in a molecular cloudin the sightline to HD 169454. Such a model was presented in anextensive analysis by Jannuzi et al. (1988). Here we use the MeudonPDR code (Le Petit et al. 2006) for the computation of the chemicalcomposition of the plane-parallel cloud irradiated by the averagegalactic background radiation field.
HD 169454 is a B1 Ia star (Mendoza 1958) with B − V determinedat 0.90 (Fernie 1983). This translates to E(B − V) = 1.09 accordingto Papaj, Krełowski & Wegner (1993). Assuming the typical totalto selective extinction ratio R = 3.1, we find that AV, tot = 3.4.The standard mean Galactic extinction curve (Fitzpatrick & Massa1990) is used in the model, which seems to reproduce the extinctioncurve towards HD 169454 (Wegner 2002) well. We further assumethat the translucent cloud is irradiated from both sides by the far-ultraviolet radiation field. The resulting field in the central part ofthe cloud of total thickness AV, tot is then reduced by extinction ofonly half of that. In the case of asymmetric illumination, or of aspecial arrangement of the cloud in the line of sight, AV may beeven smaller.
We have performed a calculation for a single cloud with a totaldensity of 500 cm−3 and a gas temperature of 20 K illuminated bythe radiation field enhanced with a factor G0 of 4 relative to thestandard value of Draine (1978). The results are shown in Fig. 12.With these parameters we reproduce the observed abundance ratioof C2/C3 ∼ 10 for AV = 2.36. The prediction for the abundance ofC4 at this AV value is two orders lower than the abundance of C3
suggesting that more observational efforts are necessary to detectalso C4 in translucent clouds. The calculated abundance of CH isslightly higher than the observed value. Assuming that the opticalextinction AV lower than the value is estimated from E(B − V),good agreement may be reached also for other combinations of AV
and G0: e.g. AV = 1.86 and G0 = 2, AV = 2.66 and G0 = 6.It is a very complex task to make reasonable assumptions con-
cerning the internal structure of any interstellar cloud. Clouds arelikely non-homogeneous and asymmetrically irradiated by neigh-bouring stars. Another problem is the dust content. As demonstratedrecently by Krełowski & Strobel (2012) the abundance ratio of
Figure 12. Abundances of CH, C2, C3, and C4 carbon species computedas a function of the total visual absorption AV.
Figure 13. Spectral range of C2 Phillips (2,0) band towards two objectsHD 210121 and HD 147165 with similar colour excesses E(B − V) anddifferent abundances of C2.
the simple radicals CH and CN also depends on the shape of theextinction curve.
To illustrate the strong dependence on far-UV extinction we dis-play spectra with very distinct C2 spectral features towards two starsthat have practically the same E(B − V). The data, shown in Fig. 13,are obtained from our present observation [HD 147165 in ESO Pro-gram 082.C-0566(A)] and from the ESO Archive [HD 210121 inProgram 71.C-0513(C)]. These spectra show that the C2 abundanceis drastically lower for the diffuse cloud towards HD 147165, whichundergoes a low far-UV extinction field, than for the cloud towardsHD 210121, which undergoes a high far-UV extinction field. Thefar-UV extinction curves can be found in figs 4.20 and 4.31 in thesurvey by Fitzpatrick & Massa (2007).
8 C O N C L U S I O N
We report on a high-quality absorption spectrum, in terms of bothresolution and S/N, of the C3 molecule towards HD 169454. Besidesa fully resolved spectrum of the A– X 000–000 band at ∼4052 Åseven further vibronic C3 bands were identified in the range 3793–4000 Å. These absorptions had been suspected previously (Gaussetet al. 1965), but now these bands are unambiguously detected forthe first time with UVES-VLT. Four of those vibronic bands havebeen observed as well along the sightlines to two heavily reddenedstars: HD 154368 and HD 73882. The observations are supportedby laboratory measurements of all eight bands under high resolutionusing cavity ring-down laser spectroscopy.
The accurate value for the C3 column density in the translucentcloud towards HD 169454 was included in an excitation model,applying the Meudon PDR-code by Roueff et al. (2002), yield-ing good agreement for the column densities of rotational levels.The calculations do not allow to determine gas density and de-struction rate uniquely. As far as the rate coefficients and pho-todissociation rates are established, the model depends on the ra-tio of gas density to intensity of radiation field. When modifyingthe model with recently updated collisional rates (Ben Abdallahet al. 2008) the model results in high destruction rates required forC3, inconsistent with the present understanding of the destructionprocess.
Observation of carbon chain molecules in optical spectra of dif-fuse clouds was up to now unsuccessful, except for C3. All com-plex organic molecules identified in the interstellar space have beenfound in dense protostellar clouds. The detection and identificationof a number of very weak absorptions of the C3 molecule raiseshope that the forest of narrow absorptions in the blue-violet partof the spectrum towards reddened stars may uncover assignmentsof heavier carbon species. Many weak as yet unidentified spectralfeatures appear to be molecular lines, rather than noise. The regularpattern of C3 bands allows for an unambiguous identification, asshown in the present study. Heavier species like C4 and C5 wouldproduce more compact patterns due to the smaller rotational con-stant or due to a strong Q-branch compared to R- and P-branchescharacteristic for �–� transitions in case of C5, particularly forlow excitation temperature, which may lead to their detection. Theassignment of absorption features in the UV-blue spectral rangeto the C3 molecule is of relevance in the context of searches forcarriers of the DIBs. While most of the absorption features de-tected in translucent clouds in sightlines towards reddened starsare ascribed to DIBs of unknown origin, the presently observedfeatures can be excluded from the DIB lists for which carriers aresought.
AC K N OW L E D G E M E N T S
We are indebted to John H. Black for providing us with detailedinformation on the collisional model for C3. JK acknowledges finan-cial support from the Polish National Center for Science during theperiod 2011–2013 (grant UMO-2011/01/B/ST2/05399). GAG ac-knowledges support of Chilean fund FONDECYT-regular (project1120190). MRS acknowledges support by the National ScienceCenter under grant (DEC-2011/01/B/ST9/02229). WU acknowl-edges support from the Templeton Foundation. The authors situatedin the Netherlands acknowledge support through FOM, NOVA, andthe Dutch Astrochemistry Program. We are grateful for the assis-tance of the Paranal Observatory staff members. The data anal-ysed here are based on observations made with ESO Telescopes atthe Paranal Observatory under programmes 71.C-0367(A), 076.C-0431(B) and 082.C-0566(A).
R E F E R E N C E S
Adamkovics M., Blake G. A., McCall B. J., 2003, ApJ, 595, 235Balfour W. J., Ca J., Prasad C. V. V., Qian C. X. W., 1994, J. Chem. Phys.,
502Ben Abdallah D., Hammami K., Najar F., Jaidane N., Ben Lakhdar Z.,
Senent M. L., Chambaud G., Hochlaf M., 2008, ApJ, 686, 379Casu S., Cecchi-Pestellini C., 2012, ApJ, 749, 48Cernicharo J., Goicochea J. R., Caux E., 2000, ApJ, 534, L199Chen C.-W., Merer A., Chao J.-W., Hsu Y.-C., 2010, J. Mol. Spec., 263, 56Crawford I. A., 1997, MNRAS, 290, 41Douglas A. E., 1951, ApJ, 114, 466Draine B. T., 1978, ApJS, 36, 595Fernie J. D., 1983, ApJS, 52, 7Fitzpatrick E. L., Massa D., 1990, ApJS, 72, 163Fitzpatrick E. L., Massa D., 2007, ApJ, 663, 320Galazutdinov G. A., 1992, Software publicly available via: http://gazinur.
com/DECH-software.htmlGalazutdinov G., Petlewski A., Musaev F., Moutou C., Lo Curto G.,
Krełowski J., 2002a, A&A, 395, 223Galazutdinov G., Petlewski A., Musaev F., Moutou C., Lo Curto G.,
Krełowski J., 2002b, A&A, 395, 969
Gausset L., Herzberg G., Lagerqvist A., Rosen B., 1965, ApJ, 142, 45Giesen T. F., Van Orden A. O., Cruzan J. D., Provencal R. A., Saykally
R. J., Gendriesch R., Lewen F., Winnewisser G., 2001, ApJ, 551,L181
Haddad M. A., Zhao D., Linnartz H., Ubachs W., 2014, J. Mol. Spec., 297,41
Haffner L. M., Meyer D. M., 1995, ApJ, 453, 450Heger M. L., 1922, Lick. Obs. Bull. 10, 146Hinkle K. W., Keady J. J., Bernath P. F., 1988, Science, 241, 1319Hobbs L. M. et al., 2008, ApJ, 680, 1256Hollenbach D., Kaufman M. J., Bergin E. A., Melnick G. J., 2009, ApJ, 690,
1497Huggins W., 1881, Proc. R. Soc. Lond. A, 33, 1Jannuzi B. T., Black J. H., Lada C. J., van Dishoeck E. F., 1988, ApJ, 332,
995Jongma R. T., Boogaarts M. G. H., Holleman I., Meijer G., 1995, Rev. Sci.
Instrum., 66, 2821Jungen C., Merer A. J., 1980, Mol. Phys., 40, 95Kazmierczak M., Schmidt M. R., Bondar A., Krełowski J., 2010a, MNRAS,
402, 2548Kazmierczak M., Schmidt M. R., Galazutdinov G. A., Betelesky Y.,
Krełowski J., 2010b, MNRAS, 408, 1590Kerr T. H., Hibbins R. E., Fossey S. J., Miles J. R., Sarre P. J., 1998, ApJ,
495, 941Krełowski J., Strobel A., 2012, Astron. Nachr., 333, 60Le Petit F., Nehme C., Le Bourlot J., Roueff E., 2006, ApJS, 164,
506Linnartz H., Vizert O., Motylewski T., Maier J. P., 2000, J. Chem. Phys.,
112, 9777McCall B. J., Casaes R. N., Adamkovics M., Saykally R. J., 2003, Chem.
Phys. Lett., 374, 583Maier J. P., Lakin N. M., Walker G. A. H., Bohlender D. A., 2001, ApJ, 553,
267Maier J. P., Walker G. A. H., Bohlender D. A., 2002, ApJ, 566, 332Maier J. P., Walker G. A. H., Bohlender D. A., 2004, ApJ, 602, 286Mendoza E. E., 1958, ApJ, 128, 207Mookerjea B. et al., 2010, A&A, 521, L13Mookerjea B. et al., 2012, A&A, 546, A75Motylewski T., Linnartz H., 1999, Rev. Sci. Instrum., 70, 1305Motylewski T., Vaizert O., Giesen T. F., Linnartz H., Maier J. P., 1999,
J. Chem. Phys., 111, 6161Najar F., Ben Abdallah D., Jaidane N., Ben Lakhdar Z., 2008, Chem. Phys.
Lett., 460, 31Oka T., Thorburn J. A., McCall B. J., Friedman S. D., Hobbs L. M., Son-
nentrucker P., Welty D. E., York D. G., 2003, ApJ, 582, 823Papaj J., Krełowski J., Wegner W., 1993, A&A, 273, 575Radic-Peric J., Roemelt J., Peyerimhoff S. D., Buenker R. J., 1977, Chem.
Phys. Lett., 50, 344Roueff E., Felenbok P., Black J. H., Gry C., 2002, A&A, 384, 629Sarre P. J., Miles J. R., Kerr T. H., Hibbins R. E., Fossey S. J., Somerville
W. B., 1995, MNRAS, 277, L41Tanabashi A., Hirao T., Amano T., Bernath P. F., 2005, ApJ, 624, 1116Tokaryk D. W., Chomiak D. E., 1997, J. Chem. Phys., 106, 7600van der Tak F. F. S., Black J. H., Schoier F. L., Jansen D. J., van Dishoeck
E. F., 2007, A&A, 468, 627van Dishoeck E. F., 1988, ASSL, 146, 49van Dishoeck E. F., Black J. H., 1982, ApJ, 258, 533Wegner W., 2002, Balt. Astron., 11, 1Welty D. E., Howk J. C., Lehner N., Black J. H., 2013, MNRAS, 428,
1107Weselak T., Galazutdinov G. A., Musaev F. A., Krełowski J., 2004, A&A,