35
Detector Stability Analysis Using MoRI Data David Barnhill UCLA
| Date post: | 21-Dec-2015 |
| Category: |
Documents |
| View: | 218 times |
| Download: | 1 times |

Detector Stability Analysis Using MoRI Data
David Barnhill
UCLA
Motivation
• Monitor detector performance of key quantities:– Anode and Dynode Baselines– VEM Area and Area/Peak– Dynode Anode ratio
• Detect any peculiar behavior as a function of temperature and/or time
• Check Quality Assurance specifications suggested in November meeting

Method• We analyzed 188 preproduction tanks from
January to February this year• We used LS Calibration Data (MoRI)• We analyzed RMS over this period for Anode and
Dynode baselines and RMS/Mean for Dynode/Anode, VEM Area, and Area/Peak for each tank
• We also looked at behavior over time and as a function of temperature
• * In the next slides:– Then = September – October 2003
– Now = January – February 2004
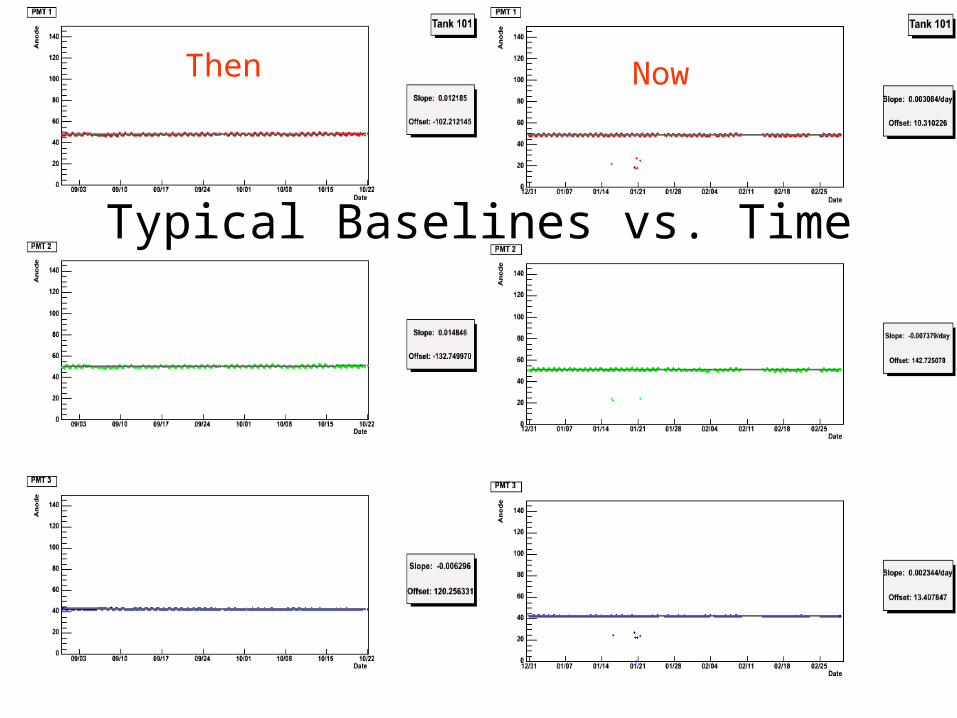
Typical Baselines vs. Time
Then Now

Anode Baseline RMS
Then
Now45 over 2 channel RMS
15 are due to pedestal readjustments
30 out of spec – 5.3%
3 out of spec – 2.2%

Dynode Baseline RMS
Then
Now
32 over 2 channel RMS
8 are due to pedestal readjustments
24 out of spec – 4.3%
1 out of spec – 0.7%

Baseline RMS vs. Station IDAnode
Dynode

Baseline Problems
All 6 channels => FE problems? (~10 tanks)

Temperature Coefficients - Baselines
AnodeThen
Now
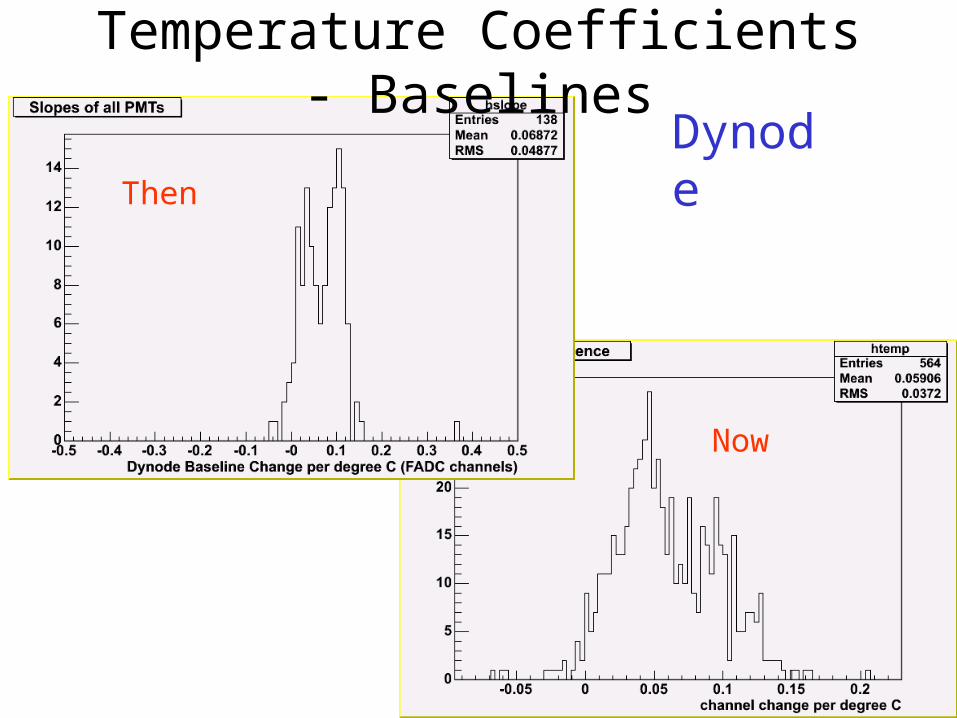
Temperature Coefficients - BaselinesDynode
Now
Then

Typical LS VEM vs. Time and TemperatureThen

Typical LS VEM vs. Time and TemperatureNow

VEM Area vs. Station ID

LS VEM AreaThen
Now
29 over 5%
11 due to recalib.
18 out of spec – 3.2%
6 out of spec – 4.4%

Tank 205 (Mage) VEM Area
PMT 1 seems to be decaying
Then Now

Temperature – LS VEM Area
LS VEM AreaThen
Now
Temperature Problem
• As documented in Bugzilla:– http://bugzilla.auger.org.ar/
• There is a known problem with temperature causing jumps in certain quantities– Tanks 116, 147 and possible 158 and 167
• Problem is known, but cause and solution are unknown

Tank 147 VEM Area
Then Now

Tank 116 VEM Area
Then Now

New Problems

Typical LS VEM Area/Peak vs. Time
Then Now

Area/Peak vs. Station ID

LS VEM Area/PeakThen
Now
All 3 PMTs in each tank affected
35 over 5% -> 6.2%
2 out of spec – 1.5%
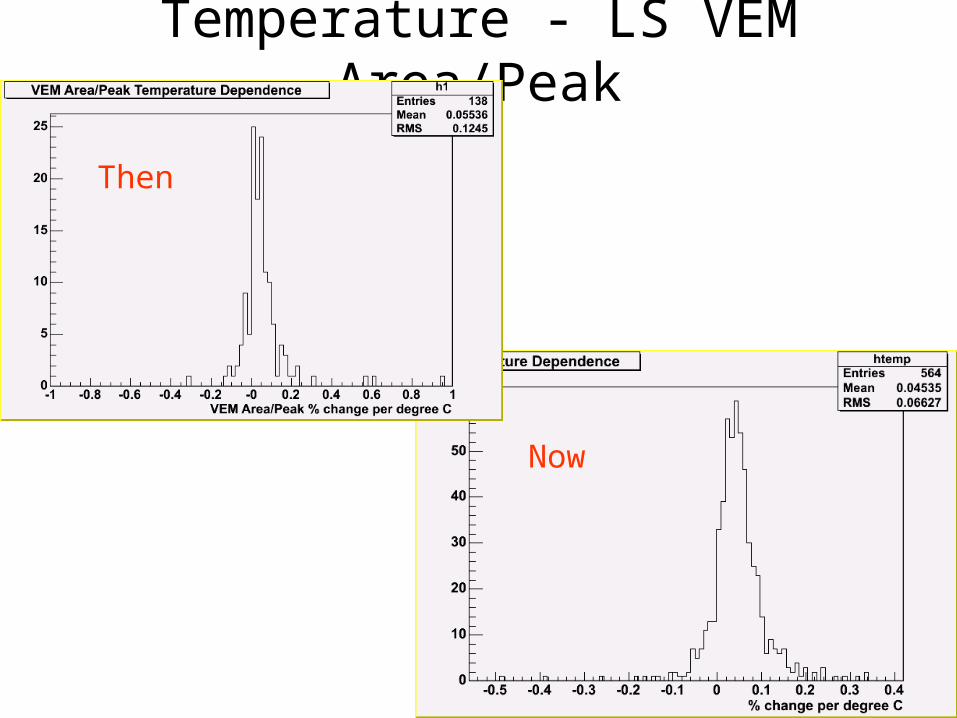
Temperature - LS VEM Area/Peak
Then
Now
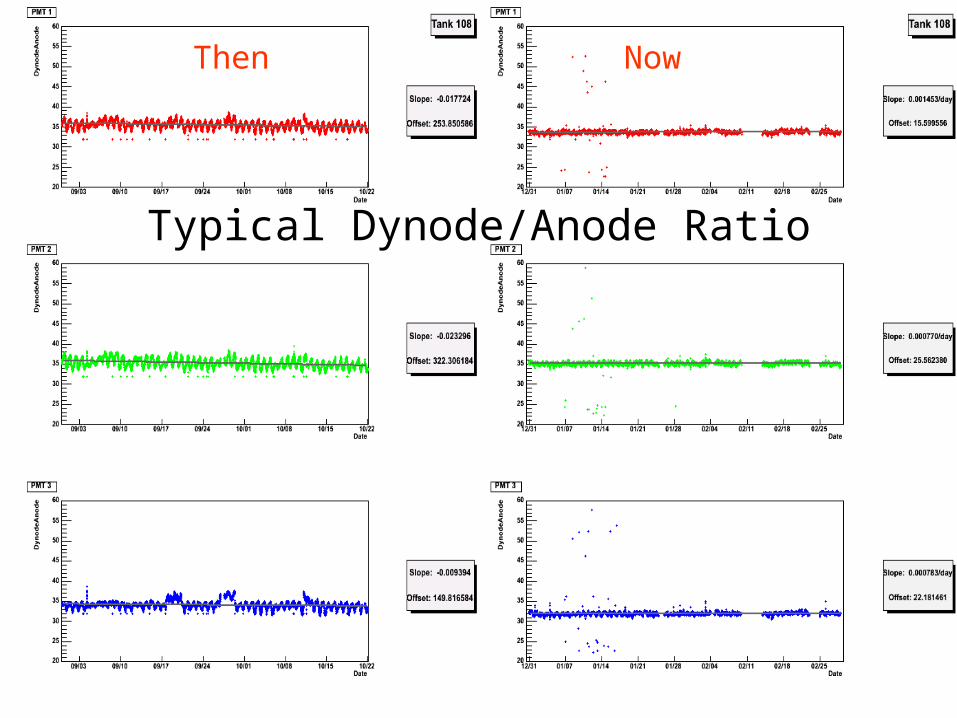
Typical Dynode/Anode Ratio
Then Now
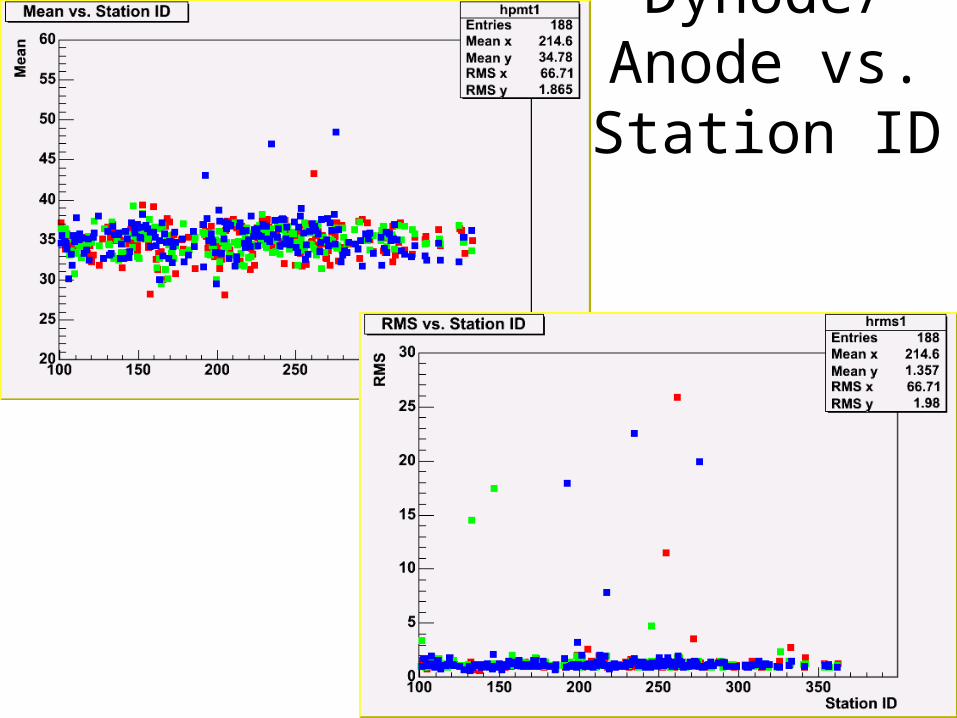
Dynode/Anode vs. Station ID

Dynode/AnodeThen
Now
8 out of spec -> 1.4%
7 out of spec -> 5.1%

Dynode/Anode Problems

Temperature – Dynode Anode Ratio
Then
Now

Tank 128 (Vatly) Dynode/Anode
No entries in bugzilla
Then Now

Dynode/Anode Spiky Behavior - Gone
Then Now

Quality Assurance Specifications
Specification No. PMTs Failed % of Total PMTsDynode Baseline < 2 channel RMS 30 5.32Anode Baseline < 2 channel RMS 24 4.26VEM Area < 5% RMS/Mean 18 3.19Area/Peak < 5% RMS/Mean 35 6.21Dynode/Anode < 6% RMS/Mean 8 1.42
NOW
Specification No. PMTs Failed % of Total PMTsDynode Baseline < 2 channel RMS 1 0.72Anode Baseline < 2 channel RMS 3 2.17VEM Area < 5% RMS/Mean 6 4.35Area/Peak < 5% RMS/Mean 2 1.45Dynode/Anode < 6% RMS/Mean 7 5.07
THEN

Stability Conclusions• Pedestals:
– All due to ~10 tanks with varying pedestals on all 6 channels
• Area/Peak:– All 3 PMTs in a tank affected when one goes bad ~13 tanks– Statistics looks bad, but roughly divide 6.2% by 3 = ~2%
problem
• Dynode Anode ratio is more consistent and stable, 3 PMTs with bad D/A problem only
• VEM Area– Temperature correlation issues ~7 PMTs– Other problems ~3 PMTs
• Tanks with PMTs failing multiple specs:– 102, 193, 214, 262

PE at 1st Dynode

PE at 1st Dynode vs. Gain


