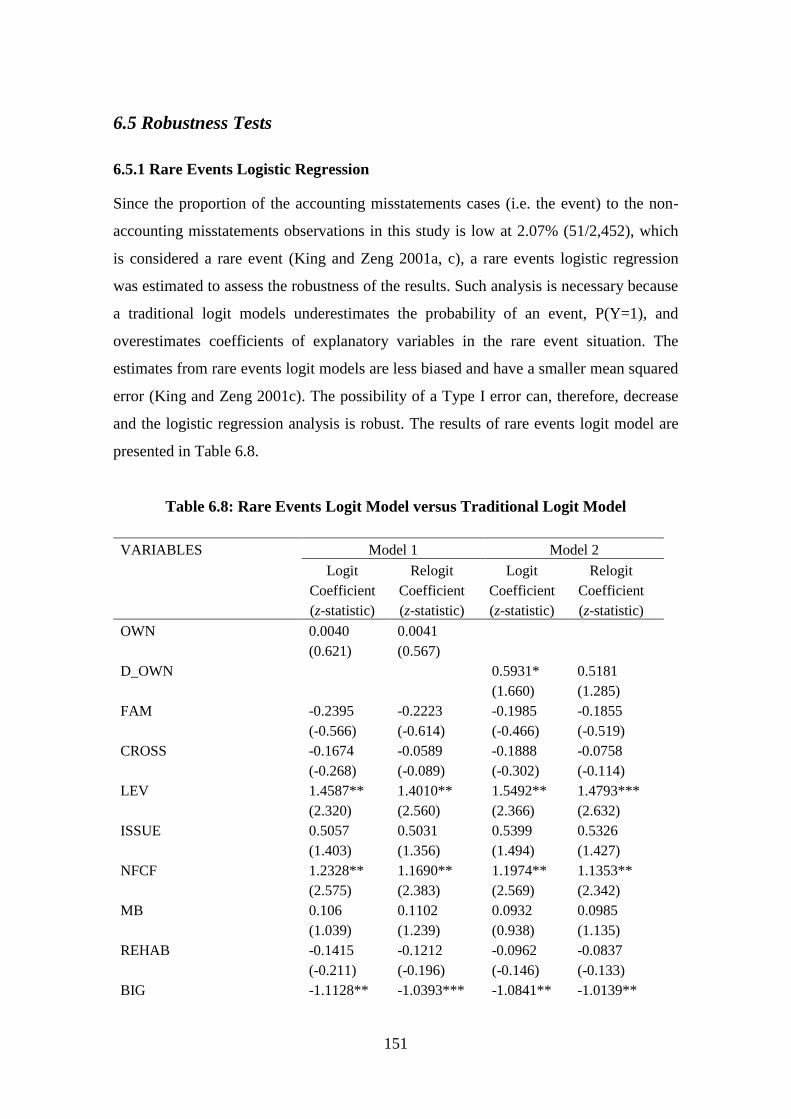
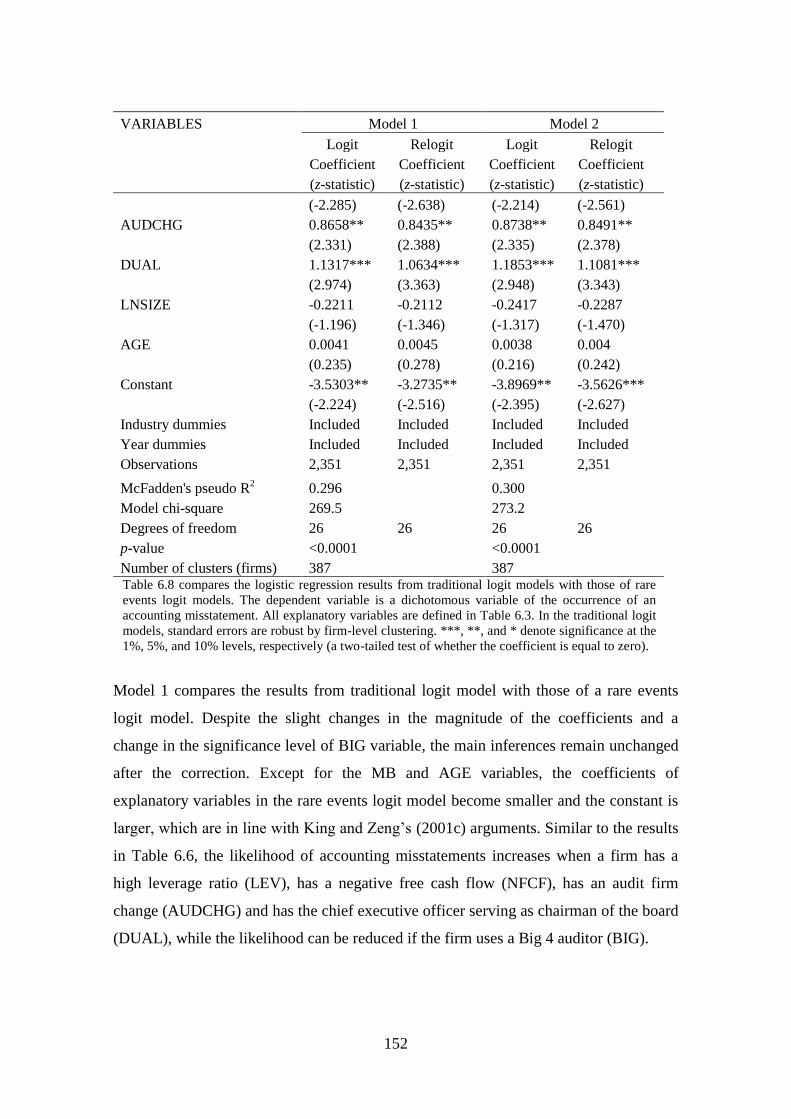
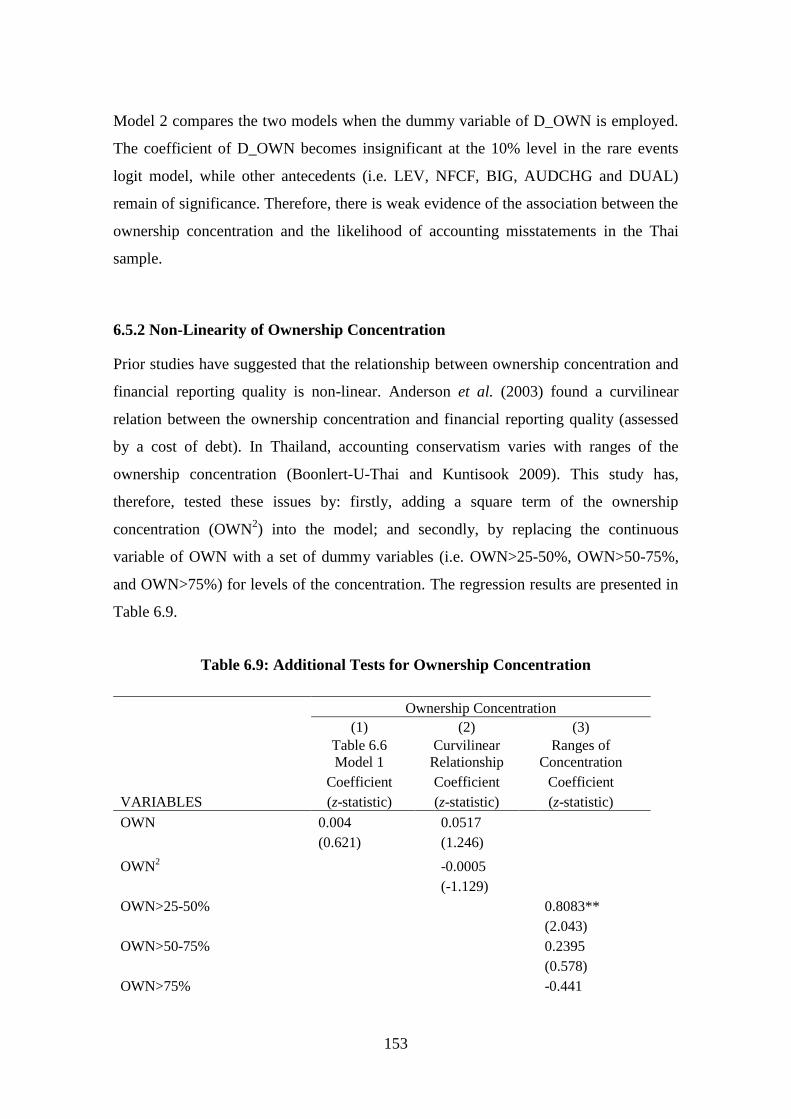
DETERMINANTS AND CONSEQUENCES OF ACCOUNTING MISSTATEMENTS IN THAILAND: AN ANALYSIS OF FIRMS SUBJECT TO ENFORCEMENT ACTIONS AND RESTATED FINANCIAL REPORTS BY SUNEERAT WUTTICHINDANON A Thesis Submitted in Fulfilment of the Requirements for the Degree of Doctor of Philosophy of Cardiff University CARDIFF BUSINESS SCHOOL CARDIFF UNIVERSITY AUGUST 2012
Transcript
DETERMINANTS AND CONSEQUENCES OF ACCOUNTING
MISSTATEMENTS IN THAILAND:
AN ANALYSIS OF FIRMS SUBJECT TO ENFORCEMENT ACTIONS
AND RESTATED FINANCIAL REPORTS
BY
SUNEERAT WUTTICHINDANON
A Thesis Submitted in Fulfilment of the Requirements for the Degree of Doctor
of Philosophy of Cardiff University
CARDIFF BUSINESS SCHOOL
CARDIFF UNIVERSITY
AUGUST 2012
i
DECLARATION AND STATEMENTS
DECLARATION
This work has not previously been accepted in substance for any degree and is not
concurrently submitted in candidature for any degree.
Signed …Suneerat Wuttichindanon… (candidate)
Date ………6/8/2012……
STATEMENT 1
This thesis is being submitted in partial fulfilment of the requirements for the degree of
PhD.
Signed …Suneerat Wuttichindanon… (candidate)
Date ………6/8/2012……
STATEMENT 2
This thesis is the result of my own independent work/investigation, except where
otherwise stated. Other sources are acknowledged by footnotes giving explicit
references.
Signed …Suneerat Wuttichindanon… (candidate)
Date ………6/8/2012……
STATEMENT 3
I hereby give consent for my thesis, if accepted, to be available for photocopying and
for inter-library loan, and for the title and summary to be made available to outside
organisations.
Signed …Suneerat Wuttichindanon… (candidate)
Date ………6/8/2012……
ii
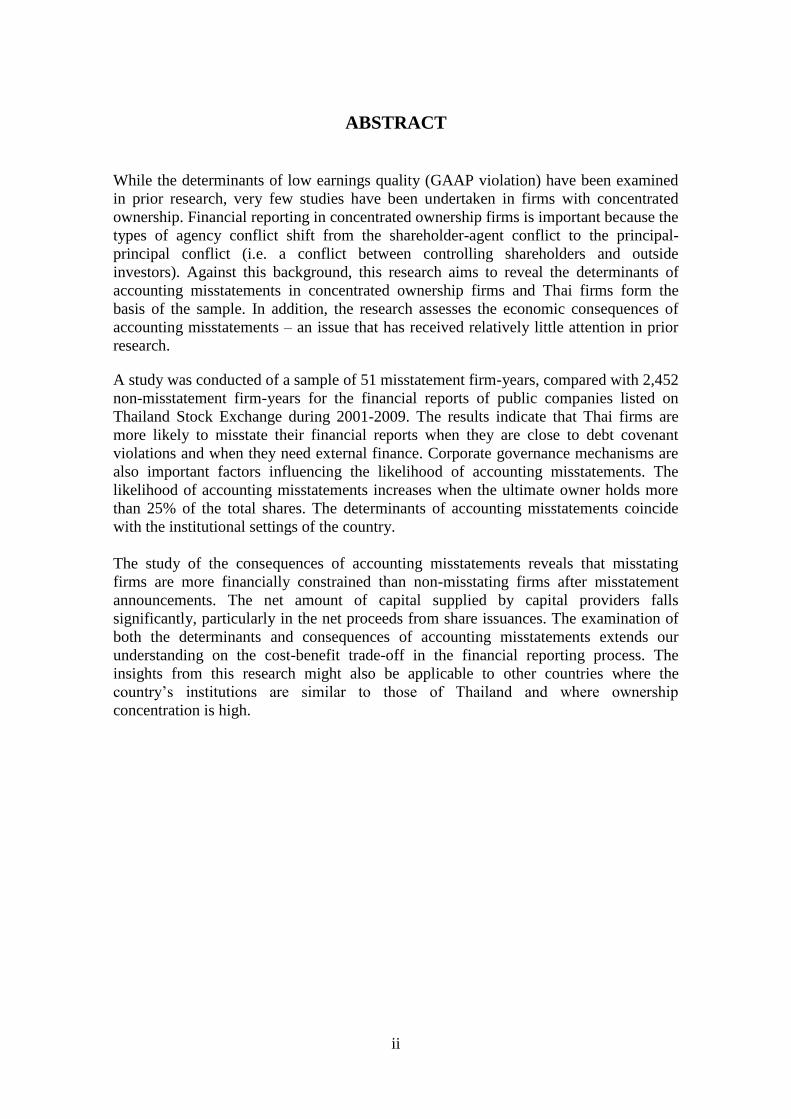
ABSTRACT
While the determinants of low earnings quality (GAAP violation) have been examined
in prior research, very few studies have been undertaken in firms with concentrated
ownership. Financial reporting in concentrated ownership firms is important because the
types of agency conflict shift from the shareholder-agent conflict to the principal-
principal conflict (i.e. a conflict between controlling shareholders and outside
investors). Against this background, this research aims to reveal the determinants of
accounting misstatements in concentrated ownership firms and Thai firms form the
basis of the sample. In addition, the research assesses the economic consequences of
accounting misstatements – an issue that has received relatively little attention in prior
research.
A study was conducted of a sample of 51 misstatement firm-years, compared with 2,452
non-misstatement firm-years for the financial reports of public companies listed on
Thailand Stock Exchange during 2001-2009. The results indicate that Thai firms are
more likely to misstate their financial reports when they are close to debt covenant
violations and when they need external finance. Corporate governance mechanisms are
also important factors influencing the likelihood of accounting misstatements. The
likelihood of accounting misstatements increases when the ultimate owner holds more
than 25% of the total shares. The determinants of accounting misstatements coincide
with the institutional settings of the country.
The study of the consequences of accounting misstatements reveals that misstating
firms are more financially constrained than non-misstating firms after misstatement
announcements. The net amount of capital supplied by capital providers falls
significantly, particularly in the net proceeds from share issuances. The examination of
both the determinants and consequences of accounting misstatements extends our
understanding on the cost-benefit trade-off in the financial reporting process. The
insights from this research might also be applicable to other countries where the
country’s institutions are similar to those of Thailand and where ownership
concentration is high.
iii
DEDICATION
In memory of my beloved Brother, Sarawut LERTMALAIMAN
iv
ACKNOWLEDGEMENTS
I would like to begin my acknowledgements by first offering my deep gratitude to my
sponsor, the Faculty of Business Administration, Kasetsart University. Without the
Faculty’s financial support, my PhD study would not have been made possible.
Secondly, I must acknowledge my primary supervisor, Professor Mark Clatworthy. I am
very fortunate to have been his student. There are no words big enough to describe how
thankful I am for his support and encouragement during my four years at Cardiff
Business School. I have learned much from his academic expertise as well as his
example as a warm, caring person. My deep appreciation goes also to my secondary
supervisor, Professor Roy Chandler, and my third supervisor, Dr Svetlana Taylor. Their
comments and advice have been invaluable.
I would also like to express my thanks to all faculty members of Cardiff Business
School and those in other schools who taught me the research fundamentals while I was
taking a diploma course in social science research. These include Professor Stephen
Walker, who kindly approved my application and provided funding to attend the
EIASM seminar in empirical financial accounting research in Frankfurt, Germany,
Professor John Doyle, Professor Peter Morgan, and Professor Mike Peel, who gave very
helpful advice on statistics.
My appreciation is also extended to the PhD secretaries, Elsie Phillips and Lainey
Clayton, for their generous support and assistance. Special thanks go to Aberconway
librarians, Susan Smith and Stephen Ratcliffe, and the school IT technician, Wayne
Findlay, for their enthusiastic support.
I am deeply indebted to my friends in Cardiff, especially the happy gathering group
(Aiza, Hyunmi, Mary, May, Noom, Polin, Poti, and Saeyeon) and Iram Ansari, and
friends in Thailand including Nisanart Udomseth and Pornthip Klinbuakao, for their
friendship, help, assistance, and encouragement during the period of this study.
Lastly, I would like to express my deepest gratitude to my family; my dear father who
has always prayed for me to accomplish this goal, my beloved mother who has always
been a rock to lean on in hard times, and my only sister who has always coloured my
world.
Without the love and support from all of you, I would not have been this far and
reached this destination.
v
TABLE OF CONTENTS
Contents Page
DECLARATION AND STATEMENTS .......................................................................... i
ABSTRACT ..................................................................................................................... ii
DEDICATION ................................................................................................................ iii
ACKNOWLEDGEMENTS ............................................................................................ iv
TABLE OF CONTENTS ................................................................................................. v
LIST OF TABLES .......................................................................................................... ix
LIST OF FIGURES .......................................................................................................... x
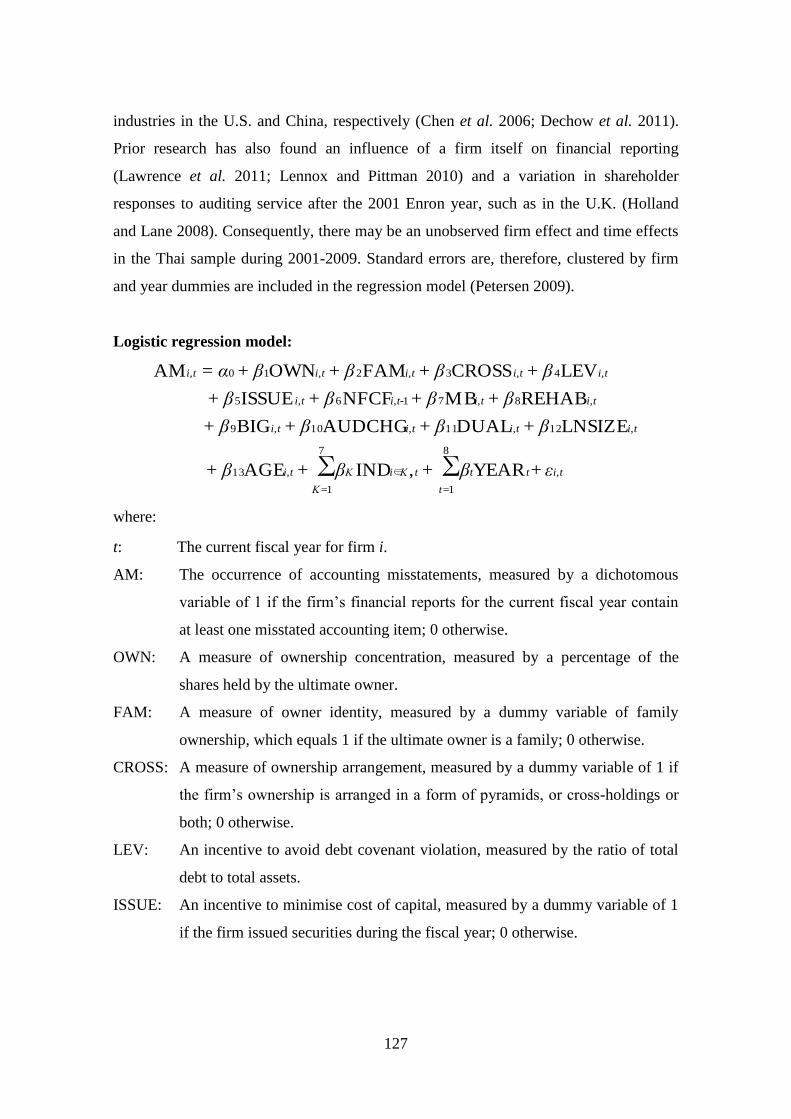
According to agency theory (Jensen and Meckling 1976) the primary agency conflict in
corporations (i.e. the principal-agent conflict) occurs between dispersed shareholders
and professional managers (Berle and Means 1932). In contrast, in emerging markets
(e.g. East Asian countries) where their institutional contexts differ from those of
developed markets (e.g. the U.S. and the U.K.) the agency conflict becomes one
between large shareholders (who can control the firm’s operations through their
majority of voting rights) and outside capital providers (i.e. minority shareholders and
creditors). This has been referred to as a principal-principal conflict (Young et al. 2008).
Controlling shareholders can exploit private benefits of control, which can be costly to
outside investors. Companies with a controlling shareholder are the dominant form
among public firms in many countries (e.g. Bebchuk and Hamdani 2009; Bebchuk and
Weisbach 2010; La Porta et al. 1999), even in the U.S. where this form is more
common than it is often assumed (Holderness 2009). Therefore, the principal-principal
conflict is an important issue for consideration (Young et al. 2008). Unfortunately, the
literature on this type of conflict is still limited (e.g. Morck et al. 2005); therefore, this
research aims to shed light on this subject through an empirical study of accounting
quality in Thailand.
As far as accounting is concerned, accounts manipulation can be exploited in a conflict
of interest setting (Stolowy and Breton 2004). A certain set of accounting quality
measures has been determined by previous empirical research (see, for example, the
summary in Dechow et al. 2010) and one of these measures is GAAP violation (e.g. in
Beneish 1997; Chen et al. 2006; Dechow et al. 1996). This measure has some
advantages in showing a problem of agency conflicts (Dechow et al. 2010). The
measure of GAAP violation is employed in this research in order to show financial
2
reporting when a principal-principal conflict occurs.1 A GAAP violation consists of
both unintentional (i.e. accounting errors) and intentional (i.e. fraud) misstatements
(Dechow et al. 2010). The term ‘accounting misstatements’ has recently come into use
and studies into cases of accounting misstatement have of perennial interest (e.g.
Dechow et al. 2011; Efendi et al. 2007; Ettredge et al. 2010; Firth et al. 2011).
Following these prior studies, this research uses the term ‘accounting misstatement’ to
refer to those financial statements that are alleged of fraud or material misstated
accounting items (which are detected by market regulators) and those financial
statements that are later restated because of prior accounting errors. One common aim
of the prior studies and this research into accounting misstatement cases is to discover
what the exact causes of financial misreporting are and why some firms suffer from
them while others do not. Managers’ incentives and the weaknesses of corporate
governance mechanisms are suggested as two primary factors driving an occurrence of
accounting misstatements (Jiambalvo 1996) and these factors are supported by previous
empirical evidence (e.g. Dechow et al. 1996; Efendi et al. 2007; Peasnell et al. 2001).
However, most of the existing findings were derived from samples in diffused
ownership systems (such as the U.S. and the U.K.) where the principal-agent conflict
usually appears. An interesting question is whether the results of previous research will
generalise to firms with a principal-principal conflict.
Recent studies (such as Coffee 2006; Morck et al. 2005; Young et al. 2008) have
brought up the issue of the relationship between corporate ownership (i.e. diffused and
concentrated) and a firm’s financial reporting. Bebchuk and Hamdani (2009) suggest
that one of the key elements of the governance arrangement is corporate ownership
structure; consequently, assessing corporate governance matrices without consideration
of companies’ ownership structure is discouraged. Therefore, the attribute of ownership
1This research acknowledges that under the principles-based International Accounting Standards that are
applied in European and Asian countries there are cases when a firm’s financial reports depart from the
letter of law and/or accounting standards in order to give a true and fair view of financial reports, such as
the override cases in the U.K. (Livne and McNichols 2009) which is not considered to be fraudulent
(Stolowy and Breton 2004, p. 12). However, according to IAS 1 (IASB 2003 paragraph 19) the IASB
considers this override an extremely rare circumstance and it does not want to initially include an
override (Benston et al. 2006). Similar to the experience of European countries that is observed in
Benston et al. (2006), this research is not aware of any override cases in Thailand and, therefore, the
override case is exempted from the scope of ‘GAAP violation’ term in this research.
3
structure should be taken into account in an examination of the causes of accounting
misstatements. Accordingly, three prospective determinants of accounting
misstatements were examined in this research: the controlling shareholders’ incentives,
corporate governance mechanisms, and ownership structures.
In this thesis, Thai companies were sampled for firms in concentrated ownership
systems. The principal-principal conflict can be found in Asian firms (Claessens and
Fan 2002) and the financial reporting quality of firms in this region is generally deemed
to be low (Ball et al. 2003). Thailand was the origin of the Asian Financial Crisis in
1997 that made the East Asian region become a popular focus of prior research. The
ownership structure of Thai firms is found to be highly concentrated (Wiwattanakantang
2001) and there is evidence of an adverse effect of the high ownership concentration on
the transparency of financial reports (Alba et al. 2003) and on the expropriation
behaviour of controlling shareholders (Lemmon and Lins 2003; Mitton 2002). The
principal-principal conflict, therefore, features quite often in Thai firms.
The financial reporting quality of Thai firms has previously been assessed in many
aspects (such as earnings management and discretionary accruals (Pornupatham 2006),
earnings smoothness (Charoenwong and Jiraporn 2009), and, accounting conservatism
(Boonlert-U-Thai and Kuntisook 2009)); however, there is a lack of research into
GAAP violation. Although there has been some pioneering research which has focused
on the characteristics of those firms that are subject to enforcement actions by the
Securities and Exchange Commission, Thailand (Tummanon 2005b), these studies were
conducted on a small scale and no comparison was made with a control group.
Therefore, this research project aims to extend the previous literature. A study into
accounting misstatements in Thai firms can provide an insight into the causes of
accounting misstatements in the context of the principal-principal conflict in
concentrated ownership systems.
In addition to investigating the determinants of accounting misstatements, this research
will also assess the economic consequences of accounting misstatements in the periods
after the accounting misstatements are revealed. Reactions of equity investors through
4
share prices have been investigated by many prior studies, while the reactions of lenders
have recently been revealed by studies, such as Chen et al. (2009) and Graham et al
(2008). Using a Thai sample allows the research to particularly contribute to the latter
issue. The financial system of Thai firms are debt-oriented, even though they are listed
on stock exchanges (Alba et al. 2003). In addition, there is evidence showing personal
connections between banks and firms (Charumilind et al. 2006). Therefore, Thai firms
may be less concerned about the capital market participants’ reactions when their
accounts manipulation is revealed. Since accounts manipulation signals a conflict of
interest among the parties in the contracting process (as presumed to be the principal-
principal conflict in Thai firms) (Stolowy and Breton 2004), it is interesting to assess
whether an announcement of accounting misstatements impacts the decision of outside
capital providers. Corporate external financing activity is given specific attention.
Moreover, a study of both the determinants and consequences of accounting
misstatements will facilitate an understanding of the cost and benefit trade-offs in
financial reporting processes: the research containing both aspects is still limited
(Dechow et al. 2010).
The remainder of this chapter provides a summary of the contents of this thesis. Section
1.2 presents the purposes of the study and research questions. Section 1.3 describes the
scope of the study while Section 1.4 outlines the structure of thesis.
1.2 Purpose of the Study
As previously discussed, the evidence on the antecedents of accounting misstatements
in concentrated ownership systems (where conflicts between controlling shareholders
and outside investors relatively appear) is limited and the evidence on whether the
concentrated ownership firms are penalised after the revelation of accounting
misstatements is even more scarce. This study will provide empirical evidence using a
sample of Thai firms to fill the gap left by these limitations. Accordingly, the main
research objectives and research questions are as follows.
5
The objectives of the research are:
1. To document the occurrence of accounting misstatements in Thailand;
2. To discover the causes of accounting misstatements in Thailand; and,
3. To assess the economic consequences imposed on misstating firms in Thailand
after the revelation of accounting misstatements.
The detailed research questions that constitute the specific interests in the causes and
consequences of accounting misstatements are:
1. What are the determinants of accounting misstatements in Thailand?2
1.1 To what extent is the ownership structure associated with accounting
misstatements?
1.2 What are the incentives of the dominant shareholders?
1.3 To what extent is corporate governance associated with accounting
misstatements?
2. What are the economic consequences imposed on misstating firms after the
announcement of accounting misstatements?
2.1 Have these firms become more financially constrained?
2.2 To what extent does the announcement of accounting misstatements
affect subsequent external financing activity?
By addressing these questions, the research results will contribute to the literature on a
variety of issues that have been suggested by prior studies as requiring research
attention, including the incentives of financial statements preparers in East Asian
countries (Ball et al. 2003), the relationship between corporate governance and earnings
manipulation in Asia context (Brown et al. 2011), an effect of earnings quality on the
decision of capital providers (Armstrong et al. 2010), and an explanation why some
firms violate GAAP and some do not (Wahlen 2004).
2This research ultimately aims to contribute an insight into the causes of accounting misstatements.
However, since the data analysis (including in previous studies) has been conducted through logistic
regression models, the term ‘determinants’ is more appropriately used than the ‘causes’. Accordingly, in
this thesis the term ‘causes’ is used when the research refers to an understanding why some firms
experience accounting misstatements but some do not and when it makes an argument on an implication
of the research findings. The term ‘determinants’ is used when referring to empirical evidence of the
causes of accounting misstatements.
6
1.3 Scope of the Study
The scope of this study is accounting misstatements occurring in listed companies in
Thailand. The focus on Thailand (where corporate ownership is mostly concentrated) is
a proxy to mirror the opportunistic financial reporting of controlling shareholders that
costs minority shareholders and lenders. A focus on listed companies can cover those
who offer public funding (e.g. share investment and public debt) and private funding
(e.g. bank loans and loans from directors and subsidiaries). In addition, the firms’
willingness to invest in corporate governance mechanisms is naturally seen more in
public firms than in private firms. The research period ranges from 2001 to 2009. The
year 2001 is the earliest year when the data on corporate ownership is available. The
sample and data are gathered from public sources and commercial databases. The
sources of sample collection comprise announcements of the Securities and Exchange
Commission, Thailand about fraud and material accounting misstatements of listed
firms and corporate restated financial reports. The final sample comprises 51
misstatement firm-years, compared with 2,452 non-misstatement firm-years.3 The
number of observations, however, reduces in the data analysis because of the constraints
of the model (more details are provided on this issue in Chapters 6 and 7). Regression
models are the primary techniques used to uncover the causes and economic
consequences of accounting misstatements in Thailand.
1.4 Structure of the Thesis
This thesis is organised into eight chapters. This current chapter introduces the study
and provides a guide to the rest of the thesis. Figure 1.1 shows the schematic diagram of
the thesis.
3Since the misstatement cases are only revealed if discovered and/or corrected by restatements,
unidentified misstatements are likely extant. It is necessary to assume that financial reports of the control
group do not contain misstated accounting items.
7
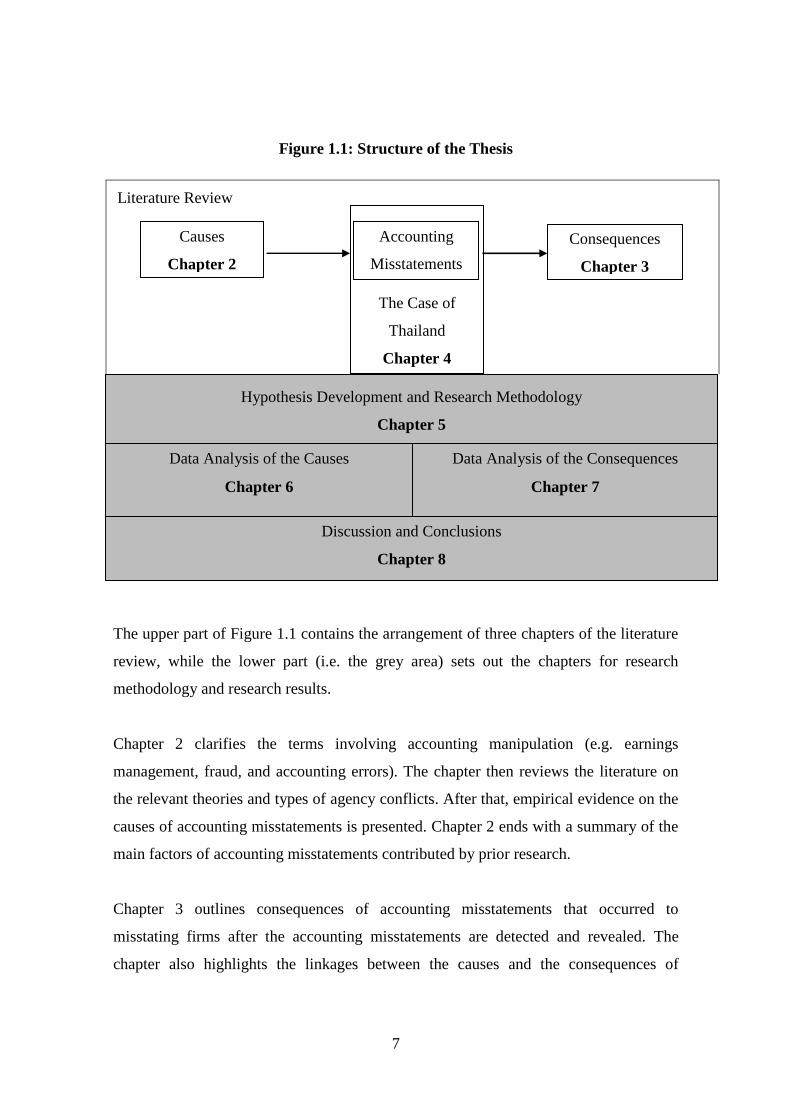
Figure 1.1: Structure of the Thesis
Literature Review
The upper part of Figure 1.1 contains the arrangement of three chapters of the literature
review, while the lower part (i.e. the grey area) sets out the chapters for research
methodology and research results.
Chapter 2 clarifies the terms involving accounting manipulation (e.g. earnings
management, fraud, and accounting errors). The chapter then reviews the literature on
the relevant theories and types of agency conflicts. After that, empirical evidence on the
causes of accounting misstatements is presented. Chapter 2 ends with a summary of the
main factors of accounting misstatements contributed by prior research.
Chapter 3 outlines consequences of accounting misstatements that occurred to
misstating firms after the accounting misstatements are detected and revealed. The
chapter also highlights the linkages between the causes and the consequences of
Hypothesis Development and Research Methodology
Chapter 5
The Case of
Thailand
Chapter 4
Consequences
Chapter 3
Causes
Chapter 2
Accounting
Misstatements
Data Analysis of the Causes
Chapter 6
Data Analysis of the Consequences
Chapter 7
Discussion and Conclusions
Chapter 8
8
accounting misstatements. In addition, some methodological issues in prior research and
the timeline of accounting misstatements are addressed in this chapter.
Chapter 4 describes the institutional background of Thailand and the financial reporting
quality of Thai firms, which are the sample of firms in concentrated ownership systems.
The financial reporting quality of Thai firms has been criticised since the Asian
Financial Crisis of 1997. Although many governance mechanisms have since been
introduced and form the basis of regulatory action towards Thai firms, because the
ownership structure has not changed (ownership is concentrated and usually held by a
single family), it is still questionable whether the financial reporting quality is
improved. This research, consequently, focuses on the low quality of financial reports
(i.e. GAAP violation) and will determine its determinants and economic consequences.
As well as being of academic import, the findings on the antecedents of misstatements
are beneficial to capital providers and to regulators in Thailand. The discoveries relating
to the economic consequences might help us to understand how accounting quality
affects the decision of capital providers in Thailand. These insights are discussed at the
end of Chapter 4.
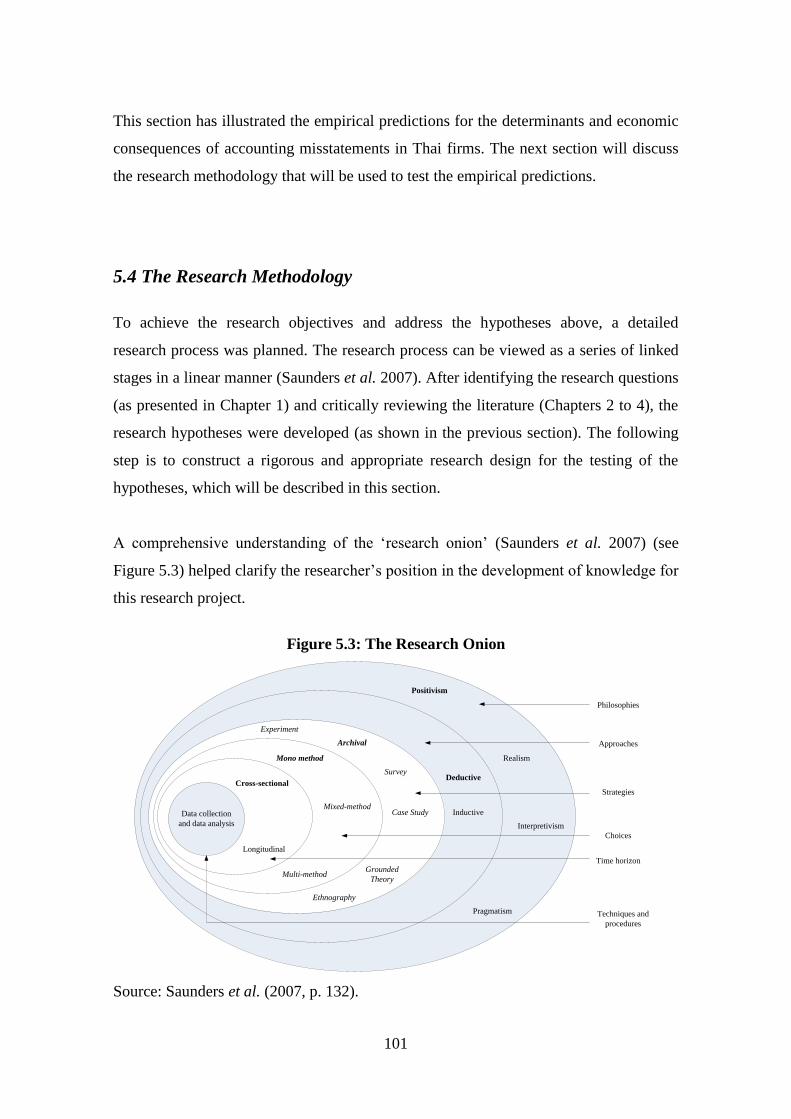
Chapter 5 specifies the empirical predictions and the research methodology. The
research hypotheses are developed according to the literature and empirical prior results.
The approaches for the hypothesis testing and the sample and data collection are
presented in Chapter 5, while procedures for the ownership data collection and the
companies included in the sample are detailed in Appendices A and B. Measures of
interest for the hypotheses are later described in Chapters 6 and 7.
The structure of Chapters 6 and 7 are similar. Both chapters start with the measures of
the variables for data analysis, they then describe the results of the data analysis.
Chapter 6 presents the findings on the determinants of accounting misstatements, while
Chapter 7 contains the results for the economic consequences. Regression models are
employed in the analysis, and post-estimation tests for the regression assumptions are
attached in Appendices C and D.
9
Chapter 8 provides a discussion and conclusion of this thesis. An acknowledgement of
the research limitations and suggested areas for future research are also included in
Chapter 8.
10
CHAPTER TWO
THEORY AND EVIDENCE ON THE CAUSES OF ACCOUNTING
MISSTATEMENTS
2.1 Introduction
This research aims to shed light on the causes and economic consequences of
accounting misstatements in concentrated ownership systems, using Thailand as the
case country. In investigating the causes of accounting misstatements, the thesis aims to
understand why they occur and what role the incentives of the controlling shareholders
to mislead financial statements users are. A set of potential determinants of accounting
misstatements will be examined. The research will then go on to assess the responses of
capital providers after misstatements have occurred. In this chapter, the theoretical
background and empirical evidence of the causes of accounting misstatements are
discussed. The literature on the consequences of accounting misstatements will be
reviewed in Chapter 3 and the financial and institutional background of Thailand is then
described in Chapter 4.
This chapter is arranged as follows. Section Two provides a definition of accounting
misstatements in order to provide an appropriate background to the thesis. Section
Three discusses the theories aiming to explain the occurrence of accounting
misstatements. Section Four summarises the evidence of causes of accounting
misstatements found in prior studies. The final section concludes the chapter.
2.2 Definition of Accounting Misstatements
Existing research has examined many aspects of accounts manipulation, but few of
these papers provide a comprehensive description of the phenomenon (Stolowy and
Breton 2004). There are many attributes of financial reporting quality (Dechow et al.
2010). In the case of low accounting quality, earnings management (e.g. in Dechow and
11
Skinner 2000; Healy and Wahlen 1999), accounting misstatements (e.g. in Dechow et
al. 2011), accounting errors (e.g. in DeFond and Jiambalvo 1991), and financial
statement fraud (e.g. in Beasley 1996) have been explored in previous studies.
However, not many studies carefully define the terms they use. Therefore, it is
important to discuss them all at this stage and then to define precisely which attribute of
financial reporting quality this thesis focuses on.
Stolowy and Breton (2004) provide a diagram (Figure 2.1) showing the differences
between fair presentation and accounts manipulation.
Figure 2.1: Diagram of Accounts Manipulation and Fair Presentation
Adapted from: Stolowy and Breton (2004, p. 11) (The terms ‘understatement’ and
‘overstatement’ are added and the earnings line is changed to a two-way direction).
Compliance with Generally Accepted Accounting Principles (GAAP) is a criterion for
differentiating types of accounts manipulation. Financial statements should be fairly
presented and comply with GAAP. According to the recent IASB Conceptual
Framework for Financial Reporting (IASB 2010b), a fair presentation shows a true and
fair view of financial position, performance, and changes in the financial position of an
entity. The financial position involves an expectation that future economic benefits will
flow to or from an entity, while the performance is a net measure of the increases and
decreases in economic benefits during an accounting period. In line with the objectives
of financial statements, a fair presentation should provide useful information for users in
economic decision-making and should also reveal the results of management
stewardship.
Fair
Presentation
Manipulation Manipulation Fraud
Level of Earnings
Fraud
Overstatement
Manipulated > Fair
Understatement
Manipulated < Fair
12
In respect of earnings, which is one of the main outputs of the financial reporting
system, manipulation occurs when managers alter financial reports to either mislead
stakeholders about underlying economic performance or influence contractual outcomes
that depend on the reported earnings number (Healy and Wahlen 1999). When the
earnings number does not represent the capacity of a firm to generate earnings, then this
number falls outside the fair presentation zone (Stolowy and Breton 2004). Earnings can
be either overstated or understated, so the misrepresentation goes in both directions.
Dechow and Skinner (2000) further suggest that financial reports engage many laws,
acts, and accounting standards, some misrepresentation might be in violation of a
regulation and that fraud occurs. Dechow and Skinner (2000), and Stolowy and Breton
(2004) both suggest to use a criterion of GAAP to differentiate manipulation from
fraud. Therefore, the misrepresentation occurring within GAAP is regarded as earnings
manipulation, while the misrepresentation in violation of GAAP is regarded as fraud.
They are presented in Figure 2.1.
Earnings manipulation (within GAAP) can be performed through real manipulation
(e.g. by delaying an investment project or research and development expenditures) and
accounting manipulation (e.g. change in accounting principles or adjust the estimate of
bad debt expenses) (Jiambalvo 1996). In light of accounts manipulation, the use of
accounting discretion is one area of interest in prior research, particularly in the
measurement of discretionary accruals. Based on the usual accruals basis of preparing
accounts, accruals are normal. In the case of earnings manipulation, managers may
opportunistically use a certain set of accounting policies to conceal the real economic
performance, including recording an unusual level of accruals (Fields et al. 2001).
Researchers typically assess the unusual level of accruals by assuming that total
accruals are composed of expected accruals, which are normally occurred in operations,
and unexpected accruals or discretionary accruals, which occur from an intention to
misstate earnings. Accordingly, the measurement of discretionary accruals is considered
to be a measure of earnings management (within GAAP).4
4A statistical approach is normally used, where observations of total accruals from prior years are used to
estimate what is believed to represent the normal accruals in operation. These estimates are used to
estimate expected accruals for the current period, with the difference between total accruals and expected
13
A firm’s objectives to use accounting practices to manage earnings (within GAAP)
include income smoothing and big bath accounting. Income smoothing has a clear
objective to produce a steadily growing stream of profits (Stolowy and Breton 2004).
Since a consistent pattern of growing earnings commands a higher price-to-earnings
ratio (Barth et al. 1999), there is a strong incentive for earnings management to be used
in order to avoid reporting an earnings decrease (Burgstahler and Dichev 1997). Big
bath accounting (Moore 1973) is an income-decreasing decision (typically associated
with large losses) made after a change in management. New management gains at least
two benefits from such accounting treatments: firstly, the reported low earnings are
blamed on old management; and secondly, future income will be free of these charges
and an improving earnings trend is more easily achieved, leaving the new management
with increased potential for increasing future bonuses.
An income-decreasing approach is also employed and potentially useful for firms with a
debt restructuring plan (Saleh and Ahmed 2005) and firms who have a dividend
reduction policy (DeAngelo et al. 1994). On the other hand, an income-increasing
approach is beneficial to firms who want to avoid defaults (Watts and Zimmerman
1986). Accordingly, what the managers have done to benefit or harm shareholders is
still unclear (Guay 2008). Earnings management will certainly be harmful if managers
use accounting discretion to inflate their bonuses or facilitate stock sales at an inflated
price. In contrast, if the accounting discretion is used to avoid debt covenant violation,
succeed a debt negotiation plan, or meet a certain forecasting benchmark then all of
these samples can be beneficial to firms and shareholders (although they may
sometimes cost creditors and other parties). Supporting this view, Bowen et al. (2008)
found a positive relationship between accounting discretion (within GAAP) and firm
performance, as measured by stock returns and ROA. Based on Bowen et al. (2008)’s
findings the managers did not employ accounting discretion at the expense of the
shareholders, but it can cost the creditors. Accordingly, earnings manipulation occurs
accruals being treated as discretionary accruals. The amount of discretionary accruals, thus, can be either
negative (expected<actual) or positive (expected>actual) balance. There are many models used to assess
discretionary accruals. The definitions of total accruals and the independent variables used in creating a
prediction regression model also vary depending on the researchers’ judgement, such as a pioneering
model by Healy (1985), a popular Jones’ (1991) model, the modified Jones’ model by Dechow et al.
(1995), Dechow and Dichev (2002), and McNichols (2002).
14
due to certain purpose(s), but to justify whether it is a good or bad practice depends on
whom the managers “work for” and whose conflict of interests are in focus. This
research is interested in the principal-principal conflict. An assumption is that there is
information asymmetry between insiders (i.e. controlling shareholders) and outsiders
(i.e. minority shareholders and creditors). Financial reports are one source of
information that the outsiders can use to determine the economic status of a firm.
However, it is not simply the earnings number that outsiders are interested in; they also
take account of other accounting items such as asset and liability accounts. Therefore,
the quality of the financial reports as a whole is the interest of this research, particularly
when the financial reports are not in compliance with the GAAP.
The presentation of accounting items that is in violation of GAAP is called an
accounting misstatement in this research. Except for the true and fair overrides (e.g. in
Livne and McNichols 2009), GAAP violation can show an agency conflict problem
(Dechow et al. 2010). The term ‘accounting misstatement’ has been used for a non-
GAAP report in a number of recent studies. The samples in these studies are typically
firms subject to enforcement actions by independent enforcement agencies, such as the
U.S. Securities and Exchange Commission (e.g. Dechow et al. 2011) and firms that
later restated their financial reports (e.g. Chen et al. 2006; Firth et al. 2011) . Some of
the misstatements later become fraud cases when the misstatements are proved
intentional, while some are errors because they are unintentional. Accordingly, this
thesis assumes that the term ‘accounting misstatements’ comprises both errors and
frauds. This view is consistent with paragraph 4 in ISA 240 (IAASB 2006),5 which
accepts that misstatements in financial statements can arise from fraud or error.
Accounting errors are unintentional acts that violate GAAP. They might occur either
due to the misapplication of GAAP, or an ineffectiveness of financial reporting control,
and specific standards are in place to deal with them (e.g. IAS 8 (IASB 2010a)) since
their occurrence is inevitable. There are a number of studies which have examined
5Thailand adopts the International Standards of Auditing of IAASB, including the ISA 240. The
accountability of auditors in Thailand for material misstatements is similar to that of the auditors in other
countries using the ISA.
15
‘accounting errors’ (e.g. DeFond and Jiambalvo 1991), but the term ‘accounting
restatements’ might be more familiar. ‘Accounting restatements’ is more often used in
the literature because the sample is gathered from accounting restatement cases. Both
terms are used interchangeably, except when accounting restatements later become
fraud cases. Therefore, the readers of the accounting restatement literature need to be
aware that the cases may comprise both fraud and accounting errors (e.g. Ettredge et al.
2010).
In professional context, Dechow and Skinner (2000) regard earnings manipulation that
is illegal as fraud. In the ISA 240 paragraph 6 (IAASB 2006) “[f]raud refers to an
intentional act by one or more individuals among management, those charged with
governance, employees, or third parties, involving the use of deception to obtain an
unjust or illegal advantage”. Because of the presence of intent, fraud is also classified as
an intentional misstatement in ISA 240. Fraud was previously referred to as an
accounting irregularity in SAS No.82 (AICPA 1997). The terms accounting irregularity,
intentional misstatement and fraud may be used interchangeably (Mulford and
Comiskey 2002). Since intention is not in itself observable, in academic research the
term fraud is often reserved for cases where a firm is subject to legal action (e.g.
Beasley 1996; Lee et al. 1999).
From the distinctions among the terms above, the thesis makes an adjustment to the
diagram of Stolowy and Breton (2004) (Figure 2.1) and create a new diagram in Figure
2.2.
The middle zone of Figure 2.2 represents fair presentation; i.e., financial reports present
real economic performance. Because of their incentives, some managers manipulate
earnings to mislead financial statement users. The earnings then do not fairly present the
real economic performance of firms and can be either overstated or understated,
depending on the managers’ incentives. The earnings manipulation is still within
GAAP. An accounting error is an unintentional financial reporting mistake that is in
violation of the GAAP, while fraud refers to an allegation that the error is intentionally
acted. However, the intention is difficult to prove. A violation of related law is
16
sometimes used to differentiate fraud from accounting errors. An empirical study into
the U.S. firms by Hennes et al. (2008), for example, indicates that an average amount of
restatements is significantly greater for fraud cases than for error cases: 11.9% versus
4% of total assets in the year prior to the restatement announcement.
Figure 2.2: Accounting Misstatements, Earnings Management and Fair Presentation
Adapted from: Stolowy and Breton (2004). (The specific terms under the earnings line
are added).
This research focuses on accounting misstatements and disregards the distinction of
fraud and error; this is similar to prior studies in the area (e.g. Beneish 1997; Dechow et
al. 1996). In particular, the sample comprises firms whose financial reports are in
violation of Thailand Securities and Exchange Act section 312 (SECT 1992), firms that
have restated their financial reports due to prior period errors, and a control group. Like
Dechow et al. (2011) this research does not take the directions of misstatements (i.e.
overstatement and understatement) into account.6 The study into the determinants of
accounting misstatements will help us understand the causes of accounting
misstatements and that it benefits regulators and financial statements users.
6This research realises the potential loss of power in the analysis that might exist when the sample
combines both mandatory and voluntary restatements (the cases subject to the SECT’s enforcement
actions and the restated financial reports, respectively) and when the sample aggregates both fraud and
error cases; however, because of the small sample size in both aspects of the sample, an additional
analysis cannot be performed and this issue opens for analysis by future research. This constraint is
acknowledged again in Chapter 8, Section 8.4.
Fair
presentation
Earnings
Management
Error Error Fraud
Accounting Misstatements Accounting Misstatements
GAAP GAAP Intention/Law Intention/Law
Level of earnings
Fraud Earnings
Management
Real Economic
Performance and Financial
Position
Overstatement Understatement
17
2.3 Theoretical Perspective
This section describes theory justification and agency theory, which the researcher
decided to use as the theoretical background for the phenomenon of accounting
misstatements.
2.3.1 Theory Justification
Although a comprehensive theory of GAAP violation is absent (Beneish 1997; Wahlen
2004), agency theory (Jensen and Meckling 1976), which addresses opportunistic
behaviour of the parties in the contracting process, has been frequently used to explain
the opportunistic financial reporting. This research agrees to continue using agency
theory and its details will be described in the next subsection. This subsection aims to
describe a few of the other theories that have been used in prior studies of financial
reporting. It will also give the reasons why they are not chosen for use in this current
research.
In addition to agency theory, other theories that have been used in the study of financial
reporting include institutional theory, operational legitimacy and signalling theory.
Institutional theory (Scott 2004) offers a generic framework to analyse corporate
practices. It posits that organisations adopt or adapt to institutional norms and rules to
gain stability and enhance their survival aspects. Institutional theory is deemed to point
out what makes organisations so similar in a country and different among countries, as
seen in a cross-country study by Rahman et al. (2010), whose research is interested in
explaining what makes firms in different countries behave differently in terms of
financial reporting. Institutional theory does not seem to fit this research, where the
samples are in one country and an objective of the research is to explore why firms
release varied quality of financial reports (i.e. some financial reports contain accounting
misstatements, while some do not).
The theory of operational legitimacy offers ‘an assumption that the actions of an entity
are desirable, proper, or appropriate within some socially constructed system of norms,
values, beliefs, and definitions’ (Suchman 1995, p. 574). Accordingly, a manager’s
18
decisions are constructed by the same belief systems. Arthaud-Day et al. (2006) find
that accounting restatements pose a serious threat to organisational legitimacy and,
therefore, restating firms dismiss their executives after restatement announcements in
order to recover their reputation and maintain their survival. The concept of legitimacy
can be used to explain a restating firm’s action after the restatement announcement (e.g.
executive replacement in Arthaud-Day et al. (2006)) so that the firm can reduce the
negative effects imposed by a social audience. However, since this research project is
interested in assessing reactions from outsiders (i.e. the social audience), particularly in
terms of economic consequences rather than a change in restating firms themselves, the
analysis is in a reverse direction. Legitimacy proposes that a firm changes itself to be
consistent with social forces; consequently, it does not exactly match the aims of this
project. On the other hand, an economic perspective of agency theory is a better fit
because it addresses a conflict of interests and it can lead to an explanation for capital
providers’ reactions after the conflict of interests happen.
Signalling theory (Spence 1973, 2002), as emphasised by Connelly et al. (2011), is
fundamentally concerned with reducing information asymmetry between two parties
(i.e. controlling shareholders and outside investors), such as attributes of CEOs signal
unobservable quality of their firms to potential investors via the observable quality of
financial statements (Zhang and Wiersema 2009). The concept of signalling is that high-
quality firms are motivated to signal and low quality firms are not. The signaller should
benefit by some actions from the receiver that the receiver would not otherwise have
done (Connelly et al. 2011). As far as financial reporting is concerned, firms prepare
and publish financial reports in order to reduce information asymmetry between the
firms and investors. For instance, some firms pay a higher audit fee and voluntarily
disclose more information than others so that they can distinguish themselves from
others (Ball et al. 2012). Signalling theory is deemed to fit financial reporting in a
situation that a firm gets a benefit from high-level disclosures. In contrast, this thesis
focuses on the financial reports that have low quality (either subject to the regulators’
enforcement actions or later restated). The preparation of this low quality financial
reports is an unpleasant situation for investors and they react negatively after the
misstatements are revealed (e.g. Palmrose et al. 2004) while the high-level disclosures
19
are a pleasant policy for outside investors. Therefore, the release of misstated financial
reports does not signal a good message to investors and as such signalling theory does
not fit this research very well.
After considering the concept of these theories, this research project has decided to
employ agency theory as a theoretical background to explain the phenomenon of
accounting misstatements. The next subsection reviews agency problems and their
relation to financial reporting.
2.3.2 Agency Problems
An agency conflict emerges when corporate ownership and control are separated (Fama
1980; Fama and Jensen 1983; Jensen and Meckling 1976). According to Berle and
Means (1932) ownership of corporations is dispersed across a large number of public
shareholders. The shareholders (the principals) delegate powers to a manager (the agent)
to operate day-to-day activities. Since there is no dominant shareholder, the manager
has control over the business operations. Such power of control may enable the manager
to extract private benefits at the expense of the shareholders. This conflict is referred to
as the shareholder-agent conflict, or the principal-agent conflict (e.g. Young et al.
2008). The shareholders thus initiate some monitoring activities (e.g. a board of
directors and some independent directors on the board) to control the managers’
operations so that their benefits are protected (Jensen and Meckling 1976). An earnings-
based compensation plan is also initiated to align the interests of the shareholders and
the manager.
In contrast to the standard agency view of Berle and Means (1932), there are many
firms where the large shareholders direct the business themselves, such as firms in Asia
(Claessens et al. 2000; Claessens and Fan 2002), or some having a two-tier relationship
of the ownership and control involving investors, investment managers and company
managers (Bricker and Chandar 2000). When the shareholders are also the managers,
then the shareholder-agent conflict is less likely to occur (Young et al. 2008). A shorter
distance of ownership and control leads to a reduction in monitoring costs and
20
compensation plans are deemed to be less necessary (Coffee 2006; Jensen and Meckling
1976). An additional disbursement for extra monitoring costs will occur in the aspect of
a cost-benefit trade-off (Doidge et al. 2007). For instance, firms are more likely to hire
Big 4 auditors and pay a higher audit fee when they are raising funds from capital
markets since these audit firms are often perceived as providing higher quality audit
work (Fan and Wong 2005). Only large firms implement voluntary corporate
governance practices (Ananchotikul et al. 2010; Kouwenberg 2010). As a result,
corporate governance of the firms with large shareholders is potentially suspected:
whether their corporate governance is effective enough to protect the interests of capital
providers and to monitor corporate financial reporting is unclear. The weak corporate
governance mechanisms in concentrated ownership firms can increase the incentive of
controlling shareholders to exploit private benefits of control (Shleifer and Vishny
1997), particularly when there is a divergence between cash-flow and voting rights
(Morck et al. 2005). Therefore, in firms with dominant shareholders, the agency
problem shifts from the shareholder-agent conflict to a conflict between controlling
shareholders and outside investors (e.g. minority shareholders and creditors) (Bebchuk
and Hamdani 2009; Claessens et al. 2000; Young et al. 2008). This type of conflict is
sometimes called the principal-principal conflict (e.g. in Young et al. 2008), or Type II
agency problem (Claessens et al. 2000; Setia-Atmaja et al. 2011).
Collectively, there are two main types of agency conflicts, depending on the ownership
structure. Young et al. (2008) provides a comparative view of the two primary types of
agency conflicts in the following diagram (Figure 2.3).
In Figure 2.3, it can be seen that the principal-agent conflict is more likely to exist in
dispersed ownership firms. The managers are professionals from labour markets and
they do not bear the residual claims that result from their decisions. On the other hand,
in concentrated ownership systems, managers are affiliated with controlling
shareholders. They both may cooperate to extract private benefits, which are the
expenses of outside investors.
21
Figure 2.3: Principal-Principal Conflict versus Principal-Agent Conflict
Source: Young et al. (2008, p. 200).
In addition to agency conflicts, there are some other attributes that occur differently in
the two ownership systems, which are presented in Table 2.1.
Table 2.1: Comparative Views of the Ownership Systems
Dispersed Ownership System Concentrated Ownership System
Institutional settings:
- Wide public share ownership
- Strong securities markets
- Rigorous disclosure standards
- High share turnover, and high market
transparency
Institutional settings:
- Controlling shareholders
- Weaker securities markets
- High private benefits of control
- Lower disclosure and market
transparency standards
- A possibly role played by large banks
and non-controlling shareholders
Financial system:
- Equity-based system
- Arm’s-length system
Financial system:
- Debt-based system
- Relational-based transaction
Expropriation:
- Aggressive accounting to maximise
compensation benefits
Expropriation:
- Private benefits of control, usually by
financial transactions
Controlling
shareholders
Professional
managers
(Agents)
Managers affiliated
with controlling
shareholders
(Principals)
Principal-Agent Conflicts
Principal-Principal Conflicts
Widely-dispersed shareholders
(principals)
Widely-dispersed
shareholders
(principals)
22
Dispersed Ownership System Concentrated Ownership System
- High interest in the day-to-day stock
prices
- High propensity to be scrutinised by
professional services
- High propensity of restatements
- Harsh penalty from capital markets
- Less interest in the day-to-day stock
prices
- Low propensity to be scrutinised by
professional services
- Restatements are rarely occurred
- Not severe penalty from capital markets
due to weak capacity of the markets
Corporate governance:
- Management dominated
- Shareholder focused
- Strong shareholder rights
- Shareholder litigation culture
Corporate governance:
- Controlling shareholder dominated
- Stakeholder focused
- Less strong shareholder rights
- Less strong litigation culture
Sources: Coffee (2006), Rahman et al. (2010), Rajan and Zingales (1998), and Salacuse
(2006).
By linking the two types of agency conflicts in Figure 2.3 to the two ownership systems
in Table 2.1, the distinctions of two systems can be described as follows.
An aggregated view for the effect of country institutions on financial systems and
corporate ownership is in the first two rows of Table 2.1. Pioneering cross-country
research provides an explanation of why firms are owned and financed differently.
Country institutional background characteristics, such as legal systems and legal
protection for minority shareholders, lead to a variety of different types of capital
market growth (La Porta et al. 1997), and eventually result in a number of different
corporate capital structures and forms of ownership concentration (La Porta et al. 1998).
On average, capital markets in common-law countries are larger than capital markets in
civil-law countries. However, the capital markets in some common law countries, such
as emerging markets in East Asia, are not as well advanced as the markets in the U.S. or
the U.K. because they have a low quality of legal enforcement. The weaker legal
protection for equity investors impedes the growth of capital markets, and firms in such
an environment are inclined to use debt financing choice more frequently than an equity
23
alternative (La Porta et al. 1998). Consequently, the corporate ownership in Asian
capital markets is relatively more concentrated (La Porta et al. 1999; La Porta et al.
1997, 1998). In addition, corporate founders still control a majority of the shares even
though the company is listed on stock exchanges, and the founders remain dominant
shareholders (Claessens et al. 2000).
Consequently, there are certain differences between the two main categories of the
ownership. The dispersed ownership system comprises characteristics of strong security
markets, rigorous disclosure standards, high share turnover and high market
transparency. The enhancement of capital markets attracts firms to raise their funds
from stock markets. External financing activities of the firms in this system are thus
equity-oriented (Rajan and Zingales 1998) and corporate ownership appears to be
widely-held. In contrast, the concentrated ownership system consists of controlling
shareholders, weaker security markets, a higher possibility of private benefits of control,
and lower disclosure and market transparency standards. The weaker institutional
settings force the concentrated ownership firms to employ debt finance more frequently
than equity (Rajan and Zingales 1998).
In addition to the difference in the financial systems between the two systems, the
characteristics of expropriation risks are also dissimilar. As shown in the third row of
Table 2.1, Coffee (2006) posits that in dispersed ownership firms, managers are key
actors and they are the origin of the shareholder-agent conflict, while in concentrated
ownership firms controlling shareholders are the originator of the conflict between
themselves and outside investors. In comparison, Coffee (2006) argues that corporate
managers are more engaged in earnings manipulation, while controlling shareholders
are inclined to exploit the private benefits of control. The managers’ opportunism
encompasses an incentive to maximise their earnings-based compensation, or to
maintain the corporate share prices. The controlling shareholders’ expropriation usually
occurs through financial transactions (e.g. transferring resources to their privately-
owned companies) and, therefore, the ownership arrangement of pyramids and cross-
holdings can be an important channel for the resource transfer in concentrated-
24
ownership firms (e.g. Bebchuk and Hamdani 2009; Brown et al. 2011; Morck et al.
2005). Transactions with related parties should be subject to the attention of monitors.
With regard to the role of monitors, Salacuse (2006) points out some differences in
corporate governance between the two ownership systems (the fourth row of Table 2.1).
Widely held firms are relatively more scrutinised by professional services: monitors in
the contracting process (e.g. auditors and regulators) and capital market participants
(e.g. securities analysts and credit rating agencies). In contrast, because of the lower
number of the financial transactions with capital markets and the under-development of
the capital markets, concentrated ownership firms are less disciplined by market
participants. The low quality of legal enforcement actions in the concentrated ownership
system weakens the litigation culture and shareholders’ rights are less protected. The
monitoring process in this system is often found to be dominated by controlling
shareholders.
Since the corporate governance in the concentrated ownership system is relatively
weaker than that of the dispersed ownership system, a question is raised: what is the
quality of financial reporting in the concentrated ownership system? The next
subsection will review the literature on the linkage between the country institutions,
corporate governance, and financial reporting quality.
2.3.3 Ownership, Corporate Governance and Financial Reporting Quality
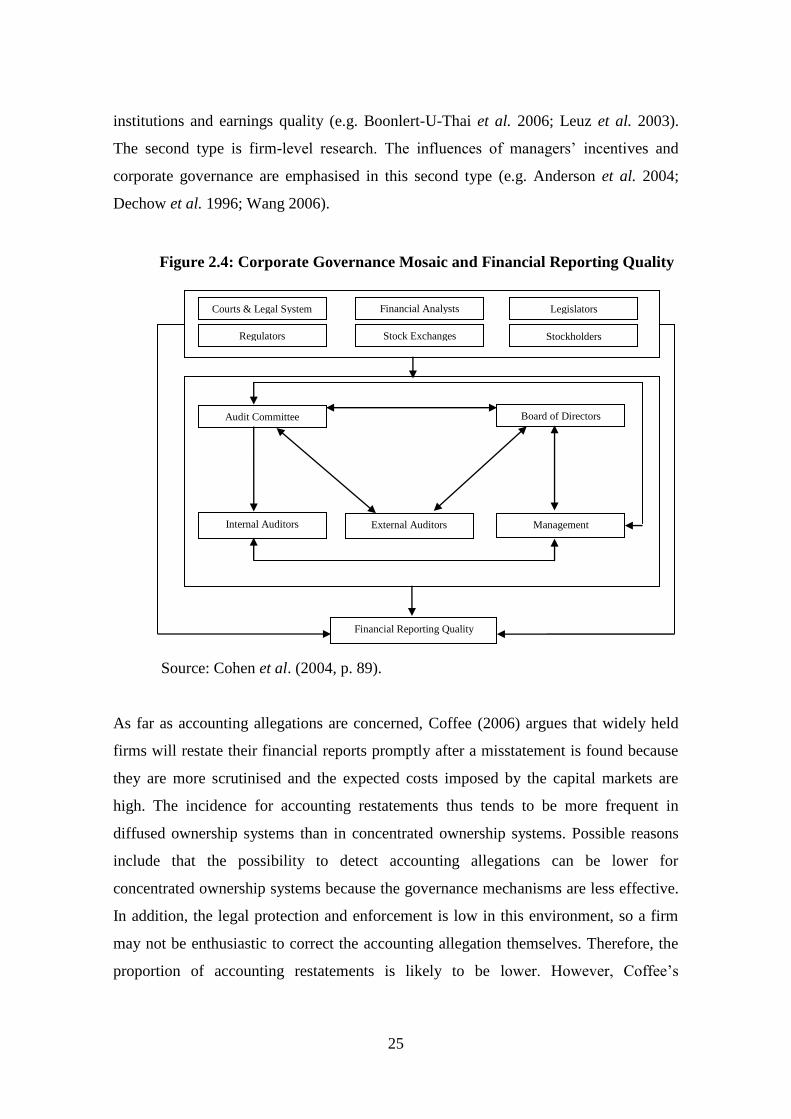
Cohen et al. (2004) provide a framework (Figure 2.4) for gathering relevant
determinants of financial reporting quality.
The Figure 2.4 shows the interrelationships between the various factors and their effects
on financial reporting quality. The upper level contains the country’s institutions and
corporate ownership structure. The second level encompasses corporate governance
mechanisms. All these factors affect financial reporting quality. The study into the
determinants of financial reporting quality can be divided into two types of research.
The first category is cross-country research, such as relationships between country
25
institutions and earnings quality (e.g. Boonlert-U-Thai et al. 2006; Leuz et al. 2003).
The second type is firm-level research. The influences of managers’ incentives and
corporate governance are emphasised in this second type (e.g. Anderson et al. 2004;
Dechow et al. 1996; Wang 2006).
Source: Cohen et al. (2004, p. 89).
As far as accounting allegations are concerned, Coffee (2006) argues that widely held
firms will restate their financial reports promptly after a misstatement is found because
they are more scrutinised and the expected costs imposed by the capital markets are
high. The incidence for accounting restatements thus tends to be more frequent in
diffused ownership systems than in concentrated ownership systems. Possible reasons
include that the possibility to detect accounting allegations can be lower for
concentrated ownership systems because the governance mechanisms are less effective.
In addition, the legal protection and enforcement is low in this environment, so a firm
may not be enthusiastic to correct the accounting allegation themselves. Therefore, the
proportion of accounting restatements is likely to be lower. However, Coffee’s
Figure 2.4: Corporate Governance Mosaic and Financial Reporting Quality
Stock Exchanges
Financial Analysts
Stockholders
Legislators
Regulators
Courts & Legal System
Board of Directors Audit Committee
Management Internal Auditors External Auditors
Financial Reporting Quality
26
argument on the restatements in the concentrated ownership systems has not yet been
proved. The majority of the previous studies have based their samples on dispersed
ownership systems, such as in the U.S. (e.g. Burns and Kedia 2006; Dechow et al. 2011;
DeFond and Jiambalvo 1991) and the U.K. (e.g. Peasnell et al. 2001), and they have
found an increase in the cases of accounting misstatements, particularly in the U.S.
(Coffee 2006; Efendi et al. 2007). Meanwhile, the occurrence of accounting
restatements in concentrated ownership systems has rarely been documented.
To summarise, Section 2.3 illustrates the importance of corporate ownership, which can
vary, types of agency conflicts (i.e. principal-agent conflict and principal-principal
conflict), financial systems (i.e. debt- or equity-oriented), and corporate governance
policies (i.e. management dominated or controlling shareholder dominated). To address
the limitations of the literature, the occurrence of accounting misstatements in the
environment of principal-principal conflict is the focus of this research. As far as an
accounting misstatement is concerned, incentives of owner-managers and the
effectiveness of corporate governance are two potential factors in the occurrence of
accounting misstatements. The next section will review the empirical findings of these
two factors in prior studies.
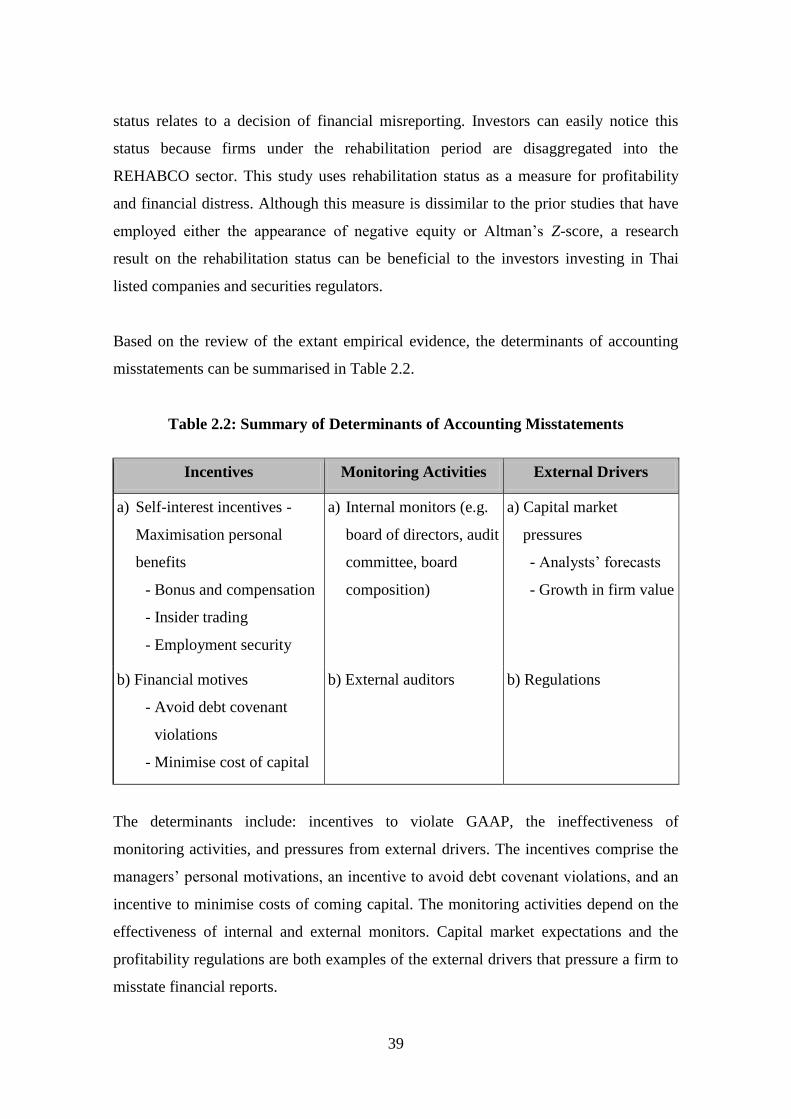
2.4 Empirical Evidence on the Causes of Accounting Misstatements
As described in the previous section, theoretically the managers’ opportunistic
behaviour can occur when monitoring processes are weak (Jensen and Meckling 1976;
Watts and Zimmerman 1986). Empirical predictions for the antecedents of accounting
misstatements thus concern the managers’ incentives and the weakness of corporate
governance (Jiambalvo 1996). Consistent with the predictions, previous research has
found the effect of managers’ incentives and weak corporate governance to be present
in misstating firms. Details of the findings in prior studies are categorised into three
sectors: the managers’ incentives, monitoring activities and the pressure from outside
parties.
27
2.4.1 Incentives
The managers’ incentives to manipulate financial reports include maximising their
earnings-based compensations (e.g. Burns and Kedia 2006; Efendi et al. 2007), to
secure their employment (Watts and Zimmerman 1986), to avoid debt covenant
violations (Watts and Zimmerman 1986) and to minimise costs of external financing
(e.g. Dechow et al. 1996). When ownership and control are separated, compensation
plans are implemented into the contracting process because of shareholders’ desire to
align the interests of the managers with their own (Jensen and Meckling 1976; Watts
and Zimmerman 1986). The compensation-relevant incentive is thus more likely to
become significant when managers are professional (i.e. hired) managers and they do
not have to bear the costs of what they have done. The incentive involving
compensation plans has been found of significance in dispersed ownership firms where
the shareholder-agent conflict is more likely to exist, such as the U.S. (e.g. Burns and
Kedia 2006; Efendi et al. 2007). In contrast, in concentrated ownership firms, the
managers are often affiliated with the controlling shareholders (Claessens et al. 2000), a
compensation plan is often unnecessary (Bebchuk and Hamdani 2009; Peng and Jiang
2010; Pornupatham 2006). Likewise, because of the affiliation, the managers are
unlikely to be concerned about losing their job if the firm performance is poor. This
thesis does not regard the incentives involving compensation and employment security
as significant proxies for the antecedents of accounting misstatements in concentrated
ownership systems and the case of Thailand. Rather, the debt hypothesis and the
minimisation of the cost of capital are two potential incentives for financial
misreporting in Thailand. A review on both proxies is presented as follows.
a) Debt Covenant Hypothesis
The capital structure of Thai firms is based heavily on debt (e.g. Alba et al. 2003;
Rahman et al. 2010; Wiwattanakantang 1999). In addition, accounting conservatism
reduces when a firm’s leverage ratio increases (Boonlert-U-Thai and Kuntisook 2009).
Therefore, the debt-hypothesis is important when assessing the role of the incentives in
GAAP violation in Thailand.
28
Debt covenants constrain a firm from not doing those things that jeopardise creditors’
returns. When debt covenants are tied to accounting numbers, then an accounting
misstatement is more likely to occur when a firm is close to debt covenant violations.
Managers select accounting choices (Watts and Zimmerman 1986), or they manage
their operations and financial reporting (Nikolaev 2010) to avoid the violation. For
example, a manager does not write off inventory because it reduces the earnings number
and increases the debt-to-equity ratio, ceteris paribus. This instance results in the firm’s
financial statements to not fairly present the real economic performance of the firm.
Firms can also transfer earnings from future periods to the current period (Jiambalvo
1996; Watts and Zimmerman 1986), and an income-increasing procedure is often used
for this purpose (DeFond and Jiambalvo 1994; Sweeney 1994). Managers can use
accounting manipulation and the manipulation approaches include creating early
recognition of revenues and/or delaying recognition of expenses (Dechow et al. 2011).
Previous studies have used two measures to examine the debt hypothesis: the leverage
ratio (an ex ante measure) and technical defaults (an ex post measure).
Leverage Ratio
The first measurement attempts to capture the existence and closeness of accounting-
based covenants. The more frequently used measure is the leverage ratio, in the form of
either total debt to equity (Watts and Zimmerman 1986) or total debt to total assets
(Dechow et al. 1996). The larger the ratio, the more likely a firm is to misstate its
financial reports. The ratio of total debt to total assets is often used in the examination
of accounting misstatements. This might be because subsequent studies follow the
measure which was used in pioneering research (Dechow et al. 1996) or because it is
generally a more stable ratio than debt/equity (as the denominator can be very small
and/or negative). Some research (e.g. Lee et al. 1999) arrives at the same result as
Dechow et al. (1996), while other studies do not (e.g. Beneish 1997; Beneish 1999a;
Dechow et al. 2011).
29
Debt Defaults
The measure of technical default can exactly indicate that creditors’ interests are
expropriated by managers owing to accounting misstatements. Dechow et al. (1996)
compared a proportion of technical default for their sample with a control group during
the misstatement period, or up to two years after that. They found that the proportion of
defaults is significantly higher for the misstatement sample than it is for the control
firms. Dichev and Skinner (2002) argue that the leverage ratio does not represent the
debt covenant violation and the ex post measure of technical default better indicates the
expropriation on the creditors’ interests7; however, the issue of data availability limits
the employment of this measure. Prior studies (e.g. Dechow et al. 1996) manually
collect the default data from companies’ annual reports. Currently, in the U.S., there is a
requirement for covenant violation disclosure (Roberts and Sufi 2009, p. 1661) and the
data are also available in some commercial databases, such as DealScan (Dichev and
Skinner 2002). Unfortunately, there is no such requirement in some countries, including
Thailand. The likelihood that Thai firms voluntarily disclose the violation information
in their annual reports is low because the disclosures of corporate governance in
Thailand is low (Chuanrommanee and Swierczek 2007); the propensity for the data to
be missing is therefore high. Hence, after considering costs and benefits of manual
collection, this research leaves the examination of the effect of debt defaults on
accounting misstatements to future research where the data are available. Nonetheless,
the pioneering research by Dechow et al. (1996) did not find the significant relationship
between the technical default and the likelihood of accounting misstatements. The
default is only significant when there is an interaction with a low oversight of internal
monitors in the multivariate model of the likelihood of accounting misstatements.
b) Minimisation of the Cost of Capital
While the debt hypothesis previously discussed involves pre-existing creditors, the
financial motive of minimising the cost of capital is relevant to prospective capital
providers.
7Dichev and Skinner (2002) found a negative correlation between the leverage ratio and technical
defaults, while prior empirical research assumes that they are positively correlated and the leverage ratio
is used to measure for the closeness to debt covenant violation.
30
The pioneering research by Dechow et al. (1996) found evidence of the financing-cost-
minimisation incentive. They developed two proxies for firms’ financing need: one is an
ex ante measure, a dummy variable indicating negative free cash flow, and the other is
an ex post measure, a dummy variable of new stock issuance. When a firm has negative
free cash flow, it is more likely to need financing. Private debt, public debt, and equity
issuances are preferred orderly alternatives (Myers and Majluf 1984). An accounts
manipulation might occur at this moment to minimise the cost of capital. These two
measures were found to be statistically higher in misstating firms than in non-misstating
firms (Dechow et al. 1996). Subsequent studies have continued using these variables.
The ex post measure of stock issuance is a significant result in many studies (e.g. Efendi
et al. 2007; Lee et al. 1999; Peasnell et al. 2001), whereas the ex ante negative free cash
flow is significant, but in a smaller number of studies (e.g. Dechow et al. 1996; Skousen
et al. 2008).
The incentive to minimise the cost of capital by account manipulations costs both equity
and debt holders. Since information asymmetry costs are inherent, capital providers
charge for the risks. However, if financial reports are misstated, then equity holders may
face incorrect asset pricing, while debt holders might be unable to be repaid. In
comparison, lenders tend to have more opportunities to scrutinise firms’ financial
reports than equity investors do. However, the scrutiny is useless if the financial reports
are incorrectly presented and firms do not have effective corporate governance in
monitoring the financial reporting process. For instance, during the Asian Financial
Crisis in 1997, fifty-six financial institutions in Thailand were closed down within a
year and had a dramatic loss on their non-performing loans. One reason for such a
collapse was the poor quality of financial reporting (Alba et al. 2003; Montreevat 2007).
Accordingly, creditors are still at risk, particularly when the institutional environment is
weak. Debt financing is the most frequently used source of funding for Thai firms and
Thai firms are unlikely to be disciplined by the capital markets (Alba et al. 2003). Also,
personal relationships informally play a role in obtaining funding from banks
(Charumilind et al. 2006). These factors can lead to a low incentive to provide high
quality financial reporting. This argument is in line with the results of a recent study by
31
Rahman et al. (2010) who found an adverse effect of the debt-based financial system on
financial reporting quality (measured by abnormal accruals). The current thesis will
further shed light on how capital structure (i.e. leverage ratio and external financing
need) relates to the appearance of accounting misstatements.
This section has reviewed the financial motives (i.e. the closeness to debt covenant
violation and the minimisation of cost of capital) which have a propensity to impact on
the likelihood of accounting misstatements in Thai firms. The next section will present
the monitoring mechanisms that can reduce the abilities of the managers to misstate the
financial reports. It will also emphasise how these mechanisms behave in the presence
of controlling shareholders.
2.4.2 Monitoring Activities
There are two groups of corporate governance mechanisms in the financial reporting
process (Cohen et al. 2004): the financial reporting quality of a firm depends on
country-level governance policies (e.g. legislators, enforcement actions by authorities)
and firm-level governance policies (e.g. an audit committee, a boards of directors and an
external auditor). As a firm-level research, this thesis particularly focuses on the firm-
level policies. The roles of monitors are suspected why they are unable to detect
accounting misstatements before financial statements are released.
a) Internal Monitors
In the presence of an accounting misstatement, boards of directors and audit committees
of misstating firms are suspected in two points: firstly, whether boards of directors and
audit committees exist; and secondly, whether they are qualified and independent of the
managers. The misreporting firms have significantly weaker governance mechanisms
than the control firms, such as: boards of directors which are dominated by
management, a chief executive officer who also serves as chairman of the board, a lack
of an audit committee, and a lack of financial expertise (Agrawal and Chadha 2005;
Dechow et al. 1996; Efendi et al. 2007; Skousen and Wright 2006). In contrast, there is
no evidence of weak board structure in U.K. firms subject to adverse rulings in Peasnell
32
et al. (2001) (e.g. on average a proportion of outside audit committee members and a
fraction of separating the roles of chief executive officers and chairmen of the board are
higher for the misstating firms than the non-misstating firms). Beasley (1996) does not
find a significant effect of an audit committee on the likelihood of fraud. Beasley’s
investigation also shows that there were on average 1.8 meetings held by the audit
committee of the firms he analysed, this same number was found in fraudulent and non-
fraudulent firms alike. These results indicate that the existence of a board of directors
and an audit committee is not an important monitoring activity to control a firm’s
financial reporting practice, but their competence and independence.
A number of outside directors are included on the boards because the boards of directors
and audit committees may perform ineffectively (Beasley 1996; Fama 1980; Fama and
Jensen 1983). However, the presence of outside directors does not determine the
quality, whereas the outside directors’ qualifications and working experiences may do.
Neither the number of board meetings nor the inclusion of outside directors is
associated with the likelihood of an accounting restatement or the lawsuit case of fraud
(Larcker et al. 2007). Only the boards or audit committees that have an independent
director with financial expertise can reduce the likelihood of accounting restatements
(Agrawal and Chadha 2005). In China, the inclusion of outside directors increases the
opportunity to detect fraud, but it does not impact the point when a firm decides
whether it will commit fraud (Firth et al. 2011). These last two studies can suggest that
the role of outside directors and independent members of audit committees is to detect
ongoing fraud rather than to protect a company from fraud. If correct, then these
findings help to clarify why the monitors’ competence is more important than their
presence.
Peasnell et al. (2001) suggest that the inconsistent results in the prior research might
imply that there may be some complex issues behind the quality of governance
mechanisms. Ownership structure can be argued to be one of these complex issues. As
Bebchuk and Hamdani (2009) suggest, companies’ ownership structure considerably
affects the corporate governance arrangements. In dispersed ownership systems
shareholders elect a board of director and the effectiveness of the board depends on
33
whether the directors are competent and independent from the managers (Armstrong et
al. 2010). The shareholders’ selection tends to be important; specifically, shareholders
elect directors whose interest is aligned with that of the shareholders and thereby the
directors will be motivated to protect the shareholders’ interests. Meanwhile, in
concentrated ownership systems, corporate governance is dominated by controlling
shareholders (Salacuse 2006) and the controlling shareholders usually have boards
follow their preferences (Bebchuk and Hamdani 2009; Cohen et al. 2002).
Consequently, the independence of internal monitors (i.e. boards and audit committees)
can be absent. The effectiveness and establishment of corporate governance policies in
the latter system are thus likely to depend on the owner-managers’ incentives (i.e.
whether they want to govern or be governed by the monitors). As a result, such matters
as a majority of voting rights held by controlling shareholders become of importance.
This research, therefore, proposes to include proxies of corporate ownership structure
(i.e. ownership concentration, owner identity and an appearance of pyramids and cross-
holdings) into the analysis of the determinants of accounting misstatements. On the
other hand, following the Bebchuk and Hamdani (2009) and Larcker et al. (2007)
guidance, the researcher considers independent directors and audit committees as
potentially unimportant determinants of accounting misstatements in firms with a
controlling shareholder and, therefore, they are excluded in the analysis (more details
for weaknesses of independent director and audit committee arrangements in Thai firms
are illustrated in Chapter 4).
b) External Auditors
The empirical evidence for the role of external auditors on the existence of accounting
misstatements is inconclusive. Stakeholders expect the monitoring role of external
auditors because they are not employees of firms. External auditors are contracted with
shareholders to audit the accuracy of financial reports. Currently, external auditors are
likely to have more responsibilities: they are required to identify not only material errors
on financial reports but also risks of material misstatements due to fraud [SAS No.99
(AICPA 2002) and ISA 240 (IAASB 2006)]. Even so, the question of why accounting
misstatements remain where financial reports are audited by external auditors is
important. Possible answers include: firstly, the misstatements are immaterial; or,
34
secondly, the auditors are not able to detect them; or, thirdly, the auditors find them, and
provide qualified, disclaimer of, or adverse audit opinions.8
The auditors’ materiality level is unobservable and it varies among firms. Therefore, it
is difficult to test the point that the misstatements appeared because they were
immaterial and the auditors did not correct them. As for the second potential answer,
one exploratory study from Feroz et al. (1991) found that 45% of audits of the
misreporting firms have audit deficiencies (such as improper professional conduct and
the lack of quality control) and, therefore, low audit quality is an important factor of the
likelihood of accounting misstatement. As for the third presumption, Skousen and
Wright (2006) find that although some misstated financial statements are reported in the
qualified audit report, qualified audit opinions are not significantly associated with the
incidence of fraud.
Another principal focus in the prior literature is the impact of being audited by one of
the Big 4, or non-Big 4, audit firms on the likelihood of misstatements. Feroz et al.
(1991) explored the GAAP violators and found that 46% of those were audited by Big 4
audit firms while 31% were audited by local firms. Meanwhile, the proportion of Big 4
audit firms is smaller in the population of misreporting companies in the U.K. (Peasnell
et al. 2001). Thus, the use of a Big 4 auditor was found to have been a significant
variable to reduce the likelihood of accounting misstatements in Peasnell et al. (2001).
In contrast, some studies have shown that Big 4 auditors do not reduce the probability
8The researcher is aware that there can be cases when auditors compromise their independence and agree
not to disclose accounting misstatements. However, this scenario is hardly likely to be observed and,
therefore, an assumption must be made that auditors maintain their practices according to the standards
of auditing but a variation in audit quality happens because of, for example, in-house expertise and audit
teams (see Francis 2011). The researcher is interested in types of audit firms. In Thailand, the
respondents in Pornupatham (2006) address that non-Big 4 auditors are less resistant to management’s
discretion, particularly when firms are highly concentrated. If this is the case, then the audit quality of
Big 4 and non-Big 4 should be far more different in highly-concentrated firms. The researcher made an
additional analysis into the roles of auditors in firms with high and low ownership concentration (25% is
a cut-off point) and the main model which is described in Chapter 6, Section 6.3 was used. The
regression results show that there is no significant relation between a use of Big 4 auditors and
accounting misstatements in firms with low ownership concentration (the coefficient of -0.3648, p-value
of 0.665), but a negative relationship between them significantly appears in the sample with high
ownership concentration (the coefficient of -1.0367, p-value of 0.046). Accordingly, the results support
the prior finding of Pornupatham (2006) on the lower resistance of non-Big 4 auditors in firms with high
ownership concentration. On the other hand, the resistance of auditors in firms with low ownership
concentration, does not differ for Big 4 and non-Big 4 firms.
35
of accounting misstatements (e.g. Dechow et al. 1996; Lee et al. 1999). One reason to
explain why the use of a Big 4 auditor is not an important explanatory variable in the
accounting misstatement model possibly involves the sample’s character. Almost all of
the studies use listed firms as a sample. Due to the Big 4’s reputations, most listed
companies are more likely to hire Big 4 auditors; for example, more than 99% of S&P
500 companies (Wang 2006) and more than a half of listed companies in the U.K.
(Abidin et al. 2010; Beattie et al. 2003) and in European and Asian countries (Choi and
Zéghal 1999; Fan and Wong 2005; Narasimhan and Chung 1998) use Big 4 auditors.
Therefore, there is a high possibility that the proportion of companies hiring Big 4
auditors in the sample group does not statistically differ from that of the control group
(such as in Dechow et al. 1996).
It is widely accepted that Big 4 firms provide better audit quality than non-Big 4 firms
(Becker et al. 1998; Teoh and Wong 1993). In particular, Big 4 auditors in the East
Asian region play important roles in monitoring activities, especially when firms issue
new stocks (Fan and Wong 2005). In Thailand Big 4 clients have been shown to have a
lower amount of discretionary accruals (Pornupatham 2006) and 75% of the misstating
firms in Thailand during 2003-2005 were audited by local firms (Tummanon 2005b).
Overall, therefore, Big 4 auditors appear to be a significant monitor in reducing the
likelihood of accounting misstatements in Thailand. An influence of the usage of Big 4
auditors on the likelihood of accounting misstatements in Thailand will therefore be
examined.
2.4.3 External Drivers
There are two external drivers that prior studies have found to be significant in the
financial reporting process: capital market participants and regulations. They are
classified as external drivers because they are not originally initiated by the managers
but because of these forces from outside parties, the managers are activated to
manipulate accounting items.
36
a) Capital Markets
Capital market participants are significant external drivers that can compel some
managers to misstate financial reports. Firms’ reported earnings numbers are
constrained by two forces: analysts’ forecasts and market reactions to the reported
earnings numbers. Previous research has shown that managers care about capital
markets (Fama 1980). Because accounting numbers have an influence on share
valuation (Watts and Zimmerman 1986, pp. 15-70), managers are certainly aware of an
announcement on those numbers (Graham et al. 2005). An earnings announcement can
influence a market’s valuation of the firm, and stock prices react to the deviation of the
actual announced earnings and the market’s prior expectation. The growth of stock
values in capital markets has been found to have a large negative price response to
negative earnings surprise (Skinner and Sloan 2002). Therefore, managers are forced to
maintain satisfactory earnings numbers, even by earnings management (Dechow and
Skinner 2000). The executives accept that earnings numbers and analysts’ forecasts are
their critical benchmarks (Graham et al. 2005), and fraudulent firms admit that they
avoid reporting losses and exaggerate financial performance because they are concerned
of markets’ expectation and reactions (Rezaee 2005). Although the pressure of the
market on financial reporting quality is supported by previous studies, its measurement
in empirical research is limited.
Researchers acknowledge the limitations of quantifying capital market pressure. The
measures that are found in the literature are based on the amounts of market value and
equity; however, the designation for numerators and denominators varies among studies
(either book-to-market or market-to-book ratio is used and, although the coefficients are
in an opposite direction, their interpretation is the same). For example, the book-to-
market ratio is determined as a capital market pressure (e.g. Dechow et al. 2011;
Ettredge et al. 2010). A lower ratio shows the greater multiple of the market value to the
book value, and it implies the higher pressure a firm must maintain. Dechow et al.
(2011) find that the book-to-market ratio is negatively associated with the likelihood of
accounting misstatements, both in the misstatement year and one year earlier. However,
the book-to-market ratio is significant only in the case of accounting errors, but not in
fraud cases (Ettredge et al. 2010). This might imply that a firm can anticipate an
37
extreme negative response from the market if fraud is detected, so the market pressure
does not relate to the likelihood of fraud. Some studies do not find a significant effect of
market pressure. For example, Burns et al. (2010) and Burns and Kedia (2006) use a
market-to-book ratio to determine the market driver, but they do not find a significant
association between the market-to-book ratio and financial misreporting. A test of this
determinant on the likelihood of accounting misstatements in other countries is rarely
witnessed. Although equity financing is not a predominant source of funds in Thai
firms, Pornupatham (2006) finds that capital market pressure is a significant factor in
the earnings management for Thai firms. It is thus possible that the capital market
pressure is one of the determinants of the causes of accounting misstatements in
Thailand and the measure of market-to-book ratio will be used in this study.
b) Regulations
Another external driver involves regulations (Healy and Wahlen 1999). Fraud firms
accept that they mask the reports to prevent being delisted (Rezaee 2005). An empirical
study into Chinese firms by Chen et al. (2001) find that the companies under the
profitability regulation of Chinese Securities Regulatory Commission (CSRC) are more
aggressive in earnings management. The regulation is a command to either suspend
shares from trading, or delist a company when the company reports losses for three
consecutive years.
In Thailand, there is one regulation that is akin to the profitability regulation of the
CSRC. In the Stock Exchange of Thailand, when shareholders’ equity in a listed
company, as shown in its audited financial statements, is less than zero, or the amount
of shareholders’ equity, when adjusted according to the qualified opinion of external
auditors, is less than zero, then, the company is subject to preparing a rehabilitation
plan. The company’s shares will be suspended from trading for the negotiation period.
The firm then has 30 days to make a decision on whether it will submit for
rehabilitation or delisting. If it continues, then the firm’s stock will be transferred to the
REHABCO sector. Then, the company is required to generate positive shareholders’
equity within two years, or ask for a one-time extension, not exceeding one year, to
resume a normal status; otherwise, the company will be delisted. This rehabilitation
38
status tends to put considerable pressure on the firm and its managers. After the
financial crisis of 1997, many Thai firms experienced dramatic losses and were subject
to a rehabilitation plan. Tummanon (2005b) finds that during 2003-2005 the accounting
enforcement actions of the Securities and Exchange Commission, Thailand appeared the
most frequently in REHABCO sector, 30.8%.
Besides the recovery requirement that the firms under profitability regulation have to
maintain, the financial status of these firms is also in a critical condition. The negative
amount of the equity indicates the large value of debt and potential liquidity problems.
There is evidence in previous literature showing a relationship between financial
difficulties and financial reporting quality. Empirical studies in the earnings
management area have found that firms with financial distress, defined by two to three
consecutive years of negative earnings, employ income-decreasing approaches when
they are going to negotiate debt restructuring (Saleh and Ahmed 2005) and reduce
dividend payout (DeAngelo et al. 1994). With regard to the area of GAAP violation, the
financial distress is usually examined in respect of the closeness to bankruptcy or
Altman’s Z-score. For instance, Malaysian firms are more likely to commit fraud when
they are close to filing a bankruptcy (i.e. higher Z-score) (Hasnan et al. 2008) and
Australian firms are more likely to commit fraud when they report at least three annual
net losses in the six year period preceding the first year of fraud (Sharma 2004). There
is a higher tendency for highly-levered firms to commit fraud (Maksimovic and Titman
1991, p. 189)9 because their reputation costs after committing fraud are likely to be low
(Agrawal et al. 1999, p. 313).
The regulation involving a rehabilitation status for the firms in the Stock Exchange of
Thailand can indicate both the pressure from the profitability requirement and a
financial deficiency. It is, therefore, interesting to assess whether the rehabilitation
9A hypothesis by Maksimovic and Titman (1991) suggests that highly-levered firms have a tendency to
cut costs and reduce the quality of their products in order to avoid immediate bankruptcy and maintain
cash balances. Rational investors can anticipate the lower incoming cash flow due to such unimproved
product quality. Therefore, they will offer lower amount of funds with a higher cost of capital. The
distressed firms know at this current period that they will be suffering a high cost of capital in the next
period, so their incentives to maintain reputation reduce. As a result, there is a tendency to commit fraud
for by highly-levered firms, even if there is no possibility of financial distress in the next period.
39
status relates to a decision of financial misreporting. Investors can easily notice this
status because firms under the rehabilitation period are disaggregated into the
REHABCO sector. This study uses rehabilitation status as a measure for profitability
and financial distress. Although this measure is dissimilar to the prior studies that have
employed either the appearance of negative equity or Altman’s Z-score, a research
result on the rehabilitation status can be beneficial to the investors investing in Thai
listed companies and securities regulators.
Based on the review of the extant empirical evidence, the determinants of accounting
misstatements can be summarised in Table 2.2.
Table 2.2: Summary of Determinants of Accounting Misstatements
Incentives Monitoring Activities External Drivers
a) Self-interest incentives -
Maximisation personal
benefits
- Bonus and compensation
- Insider trading
- Employment security
a) Internal monitors (e.g.
board of directors, audit
committee, board
composition)
a) Capital market
pressures
- Analysts’ forecasts
- Growth in firm value
b) Financial motives
- Avoid debt covenant
violations
- Minimise cost of capital
b) External auditors
b) Regulations
The determinants include: incentives to violate GAAP, the ineffectiveness of
monitoring activities, and pressures from external drivers. The incentives comprise the
managers’ personal motivations, an incentive to avoid debt covenant violations, and an
incentive to minimise costs of coming capital. The monitoring activities depend on the
effectiveness of internal and external monitors. Capital market expectations and the
profitability regulations are both examples of the external drivers that pressure a firm to
misstate financial reports.
40
In the contexts of principal-principal conflict and concentrated ownership systems, the
researcher argues that self-seeking incentives of managers are unlikely to occur due to
the affiliation of managers and controlling shareholders. The likely determinants of
accounting misstatements in Thailand examined in this research are financial motives,
monitoring activities and external drivers. The hypotheses for testing whether these
proxies are significant determinants of accounting misstatements in Thailand are
presented in Chapter 5.
Evidence on the determinants of accounting misstatements can imply a reason why
firms release misstated financial reports. The cause of, or a decision to release,
misstatements may illustrate the benefits that a firm can get from the financial
misreporting (e.g. minimised cost of capital and maximised firm value). Positivist
researchers thus believe that there is a cost and benefit trade-off when managers decide
whether they will manipulate earnings (Beneish 1997; Dechow et al. 1996; Rezaee
2005). The determinants of accounting misstatements, or an implication for the causes
of an accounting misstatement, have already been discussed in this chapter. The next
chapter will illustrate the empirical evidence on the costs imposed to the misstating
firms after the accounting misstatement is detected and revealed.
2.5 Summary
Managerial opportunism can occur when there is a separation between ownership and
control. A principal-agent conflict relatively occurs in diffused ownership firms, while a
principal-principal conflict is more likely to appear in concentrated ownership firms.
Accounts manipulation can be involved in the expropriation scheme of the agent (i.e.
the managers) and the majority shareholders. Revelation of the determinants of accounts
manipulation will consequently be able to provide an insight for investors and
regulators. However, mainstream research has so far been more concentrated on
samples in diffused ownership systems. Our understanding of concentrated ownership
systems is, therefore, limited. This study aims to bring the causes of accounts
41
manipulation in the concentrated ownership systems into light. To do this Thailand is
selected to serve as a case study. This thesis will examine the determinants of
accounting misstatements in Thailand, particularly focusing on managers’ incentives,
governance mechanisms, and corporate ownership structure.
The next chapter discusses the consequences imposed to misstating firms after their
accounting misstatements are revealed.
42
CHAPTER THREE
PRIOR EVIDENCE ON THE CONSEQUENCES OF ACCOUNTING
MISSTATEMENTS
3.1 Introduction
The causes of accounting misstatements were reviewed in the previous chapter. This
chapter will review the previous literature on the consequences for misstatement firms
after accounting misstatements have been detected. To date, the research that
investigates both the causes and consequences of accounting misstatements is scarce
(Dechow et al. 2010). The disparity between the cause and consequence examinations
limits our ability to understand why a firm decides to commit accounts manipulation
and what the constraints are in cases where such behaviour is intentional. To overcome
this limitation, this thesis aims to examine both the determinants and the consequences
of accounting misstatements. With regard to the study of consequences, many prior
studies have assessed the effect of accounting misstatements on share prices shortly
after the misstatements have been announced. Only a few studies focus on the reactions
of creditors and all of them were conducted on widely held firms. The capital structure
of the concentrated ownership system (including Thai firms) is primarily based on debt,
making the reaction from the creditors more appropriate to be examined.
This chapter will start with a review of the relevant literature on the consequences of
accounting misstatements. It then outlines the link between causes and consequences.
Finally, the limitations of the prior literature and the objectives of the present research
will be discussed.
3.2 Consequences of Accounting Misstatements
A number of previous studies (e.g. Beneish 1997; Dechow et al. 1996; Rezaee 2005)
have agreed that accounting misstatements are deemed to be part of a cost-benefit trade-
43
off in the process of financial reporting; however, quantifying them is difficult. Revsine
et al. (2002, pp. 295-319) provide a number of examples of financial reporting costs,
which include: preparation and publication costs, competitive advantage costs, litigation
costs, and political costs. Moreover, additional costs seem to appear when financial
reporting includes accounts manipulation, such as: costs for lawsuits, costs of future
financing and reputational costs (Jiambalvo 1996). Although many scholars believe that
there are cost-benefit trade-offs in the decision-making process (e.g. Jiambalvo 1996;
Kellogg 1984; Rezaee 2005), this hypothesis has not received conclusive support. The
previous research on the subject is restricted by possible issues. Firstly, there is no
theory that dictates costs and benefits of GAAP and non-GAAP reporting (Wahlen
2004) and, therefore, a number of methodological issues can occur. For example,
Palmrose and Scholz (2004) predicted and found empirical evidence that firms with
restatements of core accounts are more likely to be sued after being controlled for other
relevant factors; however, why firms with core accounts ended up in court while other
firms with restatements of non-core accounts did not was not explained, particularly in a
theoretical view (Wahlen 2004, p. 186). Secondly, quantifying all of the costs involved
in financial reporting decision-making is difficult (Francis 2001, p. 313). Additionally,
to date much research has been constrained by data availability. However, despite these
limitations, empirical researchers have attempted to identify many of the costs and
benefits of accounting misstatements. Some benefits of accounting misstatements were
discussed in respect of the determinants of accounting misstatements (presented in the
previous chapter). In this chapter, the costs imposed on misstating firms will be
discussed.
Many aspects of the costs, or consequences, for misstating firms have been explored.
Capital market reaction and management turnover are two common measures that a
number of previous studies have utilised, probably because most mainstream research
has focused on the shareholder-agent conflict. Therefore, the shareholders’ responses
and penalties for the agent are two possible outcomes relevant to such conflict. Other
consequences comprise class actions lawsuits, litigation costs, and corporate governance
reforms. Unlike the shareholder-agent conflict, the principal-principal conflict occurs
between controlling shareholders and outside investors. Therefore, the researcher is
44
interested in the reactions of those outside investors and economic consequences (i.e.
subsequent financing activities). Nevertheless, there are certain methodological issues in
the other types of consequences (i.e. corporate governance reforms and legal costs) that
the researcher found during the review into literature and they are worth considering.
There are also linkages between the causes that were previously reviewed in Chapter 2
and the consequences imposed on misstating firms and monitors when misstatements
are revealed. Therefore, some space in this section is dedicated to discuss the other
types of consequences, even though the main focus of this research is on economic
consequences.
The following subsections will review the empirical evidence of consequences imposed
on misstating firms, which can be divided into three groups according to the entities in
the contracting process (Stolowy and Breton 2004). The first category is the response of
capital providers (i.e. shareholders and creditors) through costs of capital and contracts.
The second group engages subsequent improvements in monitoring mechanisms, which
involve penalties for managers and incompetent monitors. The third group is a response
from society, particularly from legislators and authorities.
3.2.1 The Effect of Information Uncertainty
Because financial reports play an important role in providing economic information for
funds providers, concern about information uncertainty must occur after an accounting
misstatement is revealed.
a) Cost of Equity
Share Prices
Since a listed firm’s funding comes from equity investors, there is a likelihood that
investors will penalise the firm if it commits an accounting misstatement. A measure of
market reaction is ascertained by change in share prices. Pioneering researchers
observed changes in share prices around the misstatement announcement and they
found an average negative cumulative abnormal return after an announcement of
accounting misstatements of about 9-13% (e.g. Dechow et al. 1996; Feroz et al. 1991;
45
Kellogg 1984; Palmrose et al. 2004). The literature then shifted from exploring
abnormal returns in misstating firms to exploring the effect of misrepresentation on
abnormal returns through a multivariate regression model. Despite an absence of theory
explaining the linkage between a misstatement announcement and a negative abnormal
return (Wahlen 2004), empirical research has tested a casual relationship between the
two. Kinney and McDaniel (1989) discovered two characteristics of the misstatements
influencing abnormal returns: the sign (overstatement) and magnitude of misstatements.
Abnormal returns are greater when there is a larger misstatement in relation to
overstatements. Because the findings in Kinney and McDaniel (1989) are limited to the
sample of accounting errors in quarterly financial reports, Palmrose et al. (2004) later
tested the same issue in a sample of annual financial misreporting. Apart from testing a
relationship between a restatement announcement and abnormal returns, Palmrose et al.
(2004) also examined relationships between abnormal returns and the characteristics of
restatements (such as the magnitude of restatements and reasons for restatements).
Similar to Wahlen (2004), Kasznik (2004) argues that the lack of theory makes it
difficult to explain why these characteristics generate greater adverse responses on the
abnormal returns.
Besides the adverse effect on the misstating firms, Gleason et al. (2008) found that non-
restating firms in the same industry also experienced share price declines at the same
time. Many previous studies find negative abnormal returns for both misstating firms
and non-misstating firms in the same industry around the restatement period. Ball and
Brown (1968), and Ball (1972) detected the earlier movement of abnormal returns and
its appearance in the industry. The pre-existing abnormal returns had appeared for a
year before the detection of accounting misstatements in Kellogg’s (1984) sample.
Wilson (2008) acknowledges the contagion effect and, therefore, used a sample
containing both misstatement firms and matched non-misstatement firms. The results
reveal an interaction effect of the restatement announcement on abnormal returns:
abnormal returns are greater when unexpected earnings appear due to the restatement
announcement. Meanwhile the abnormal returns of non-restating firms did not
significantly vary across time; even when unexpected earnings appeared in these firms.
Therefore, Wilson argues that abnormal returns are a result of restatement
46
announcement and they are not caused by time-period trends. Some studies (e.g. Kinney
and McDaniel 1989; Palmrose et al. 2004) argue that there is news leakage. Ball and
Brown (1968), emphasised by Watts and Zimmerman (1986, p. 45), point out that the
earlier movement can occur because investors usually get information from quarterly
financial reporting and from non-accounting sources. Therefore, the investors regularly
revise the asset pricing, and the revision can also make the expected earnings of the
firms in the same industry fluctuate (Watts and Zimmerman 1986, pp. 71-110). A recent
study by Bardos et al. (2011) supports this point of view. They found that investors can
anticipate subsequent restatements and start marking the share prices down several
months (i.e. four months in their study) before a restatement announcement. This price
reduction costs a misstating firm three times as much as does the effect of a restatement
announcement.
Watts and Zimmerman (1986, p. 88) urged caution in the research design for an
examination of abnormal returns. Because the research sample is usually selected on the
basis of one variable (i.e. accounting restatement), if the research cannot control for
other factors, it might later be found that the sample differs from the population due to
some other variables. If this happens then it should not be concluded that the abnormal
returns in the misstating firms around the misstatement period are a result of the
restatement announcement (Ball 1972). In addition, Watts and Zimmerman (1986, pp.
92-93) argue that if investors’ expectations are correct, then why the firm waits for
years to announce the restatement. Alternatively, whether the firm waits until when
there appears to be no correlation between price change and restatement
announcements. This point of view is consistent with the no-effect hypothesis.10
Consequently, the appearance of prior movement of abnormal returns is an issue that
researchers must be aware of if they are interested in observing a change in share price
after the announcement.
10
The no-effect hypothesis underlines the efficient market hypothesis, which implies that the share price is
a function of the firm’s expected future cash-flows and the expected rate of return and earnings are
unimportant (unless they capture the primary drivers). The mechanistic hypothesis implies that there is a
relation between stock prices and accounting earnings changes, supported by Ball and Brown (1968).
However, it was later clarified that the stock prices will react to the accounting earnings changes that
reflect real economic changes, but they do not react to the earnings changes that have no cash flow
effect (Ball 1972; Watts and Zimmerman 1986, p. 97).
47
Other responses of capital market participants
Besides the decline in stock prices, prior research has measured the reactions of capital
market participants to misstatements through bid-ask spreads, estimated rates of returns
and analysts’ reactions. Dechow et al. (1996) found an adverse effect of misstatement
announcements on bid-ask spreads. Meanwhile, Hribar and Jenkins (2004) argue that
the bid-ask spread is an indirect measure for costs of capital, so they applied three asset-
pricing models to estimate the effect of a restatement announcement on cost of capital.
Their premise is that a restatement announcement generally leads to downward
revisions in future expected earnings. They therefore used analyst forecast revisions to
proxy for an effect of the announcement on expected future cash flows. Data for the
assessment include book value of equity, analyst forecasts and long-term growth rates.
The rates of returns were calculated and analysed to determine whether they changed
between the periods. They found that the rates of return rose by 10.8%-19.5% during
the five days after the revelation of misstatements.
Investors tend to find corporate information from other sources when they are
concerned about the information uncertainty in misstating firms, including analysts’
forecasts (Barniv and Cao 2009). Dechow et al. (1996) showed a significant increase in
the dispersion of analysts’ forecasts after the misstatement announcement (year -3 to
year +3), while they do not find a change in dispersion of forecasts for control firms.
Similarly, Palmrose et al. (2004) discovered a wider dispersion in restating firms along
the 45 days after the announcement. The number of analysts following has also been
studied in prior studies. Dechow et al. (1996) observed changes in the median number
of analysts following during a six year window (year -3 to year +3) when compared
with those of the control firms. They found a significant decline in the numbers from
year -1 to year +1. More interestingly, for the three years before the misstatement
announcement the median number of analysts following in the misstating firms is found
to be higher than that of the control firms. Dechow et al. (1996) posit that the higher
rate supports the proposition that the managers of growing firms are under more intense
pressures from the markets and that they are consequently more likely to misstate
financial reports.
48
In brief, studies into the reactions of market participants are available, and their findings
are all alike: affirming that a misstating firm suffers negative consequences from
investors and analysts. However, the lack of theoretical foundation limits empirical
researchers’ explanations in some circumstances; for example, why misstatements of
core accounts results in a higher level of abnormal returns, or why share prices start
marking down several months before a restatement announcement (Kasznik 2004;
Wahlen 2004). Therefore, it might be improper to conclude a casual relationship
between misstatement announcements and a higher cost of capital, but it is useful to
confirm their correlation.
To assess the reactions of equity investors is deemed to be an effective measure for
dispersed ownership systems, where capital market participants (e.g. shareholders and
analysts) importantly discipline the firms. In contrast, capital markets in the
concentrated ownership system are not enhanced and firms are more likely to choose
debt alternatives than equity (La Porta et al. 1997; Rajan and Zingales 1995). Therefore,
concentrated ownership firms might be less concerned about the market reaction. Rather
they can be more concerned about creditors’ responses. The next section reviews the
reactions of creditors studied in prior literature.
b) Cost of Debt
A revelation of accounting misstatements signals the low quality of the financial
reporting process, so it would seem rational for creditors to call for efficient monitoring
and higher charges to secure their investment returns. A higher interest rate, tighter debt
covenants and stricter requirements for collateral are instances of debt features that the
creditors might prefer from misstating firms.
Graham et al. (2008) examined the impact of restatement announcements on loan
features. An average cost of debt, measured by the amount of the interest rate above
LIBOR rate (named loan spreads) is higher after a restatement announcement. An
investigation into the characteristics of the misstatements was conducted, similar to the
approach used in abnormal-returns studies. An average loan spread was found to be
49
larger when the restatement involved fraud, but was irrelevant to the restatement
initiated by auditors, company, and capital market regulators. With reference to loan
obligations, the restatement announcement resulted in a decline in loan maturity, a
requirement for collateral, and an increase in the number of covenants. General
covenants (such as prepayment, dividends, and voting rights) were added into the new
debt covenants - more so than financial covenants (e.g. ratios). This possibly happened
because financial covenants can be manipulated. In addition, misstating firms had to
pay more for upfront and annual fee charges. The results from Graham et al. (2008)
confirm the negative impact of the restatement announcements on loan features. Chen et
al. (2009) argue that since the sample in Graham et al.(2008) comprises only of firms
getting subsequent loans, there may be some restating firms that also need funds but the
firms are unable to get them because they are high in financial constraints. Therefore,
Chen et al. (2009) explored the financial constraint status and external financing
capability of the restating firms and compared these with matched non-restating firms.
Chen et al. (2009) found that about half of restating firms do not raise any external
financing within two years after the restatements. They assessed whether misstating
firms need financing in the post-announcement period by using two indices. The first
measured the level of financial constraint, following the approach used by Kaplan and
Zingales (1997). The data were collected from misstating firms’ annual reports. The
second measure is a calculation of a financial constraint index, as developed by Whited
and Wu (2006). Both measures provided consistent results in that an average of the
constraint level of the restating firms did not differ from that of the non-restating firms
before the restatement announcement, but the average is greater for the restating firms
after the announcement. After assuring that the restating firms need financing but are
less likely to find it because their ability to get new funding is lower, Chen et al. (2009)
then examined the dynamic changes of financing choices around the misstatement
period. Based on the financing choices from pecking order theory (Myers and Majluf
1984), Chen et al.’s (2009) study found that the proportion of private debt increases
while the proportion of public debt and equity decrease after the misstatement
announcement. This result agrees with the financial constraint indices, affirming that
misstating firms suffer from financial constraints in the post-restatement period. The
50
increase in private debt funding is consistent with the description by Bharath et al.
(2008) of how firms with low quality financial reports prefer private-debt alternatives.
This is consistent with pecking order theory in that the cost of equity is the highest
because it is associated with the highest information asymmetry costs. Since the
restatement announcement raises information asymmetry between the firm and the users
of financial statements, it is a persuasive argument that these firms should prefer private
debt to equity. In addition, firms tend to lose their credibility of financial reporting and,
therefore, the costs of capital from public debt and stock issuance are deemed higher.
Even equity-based firms, such as the U.S. firms in Chen et al. (2009), are more likely to
prefer private debt after the restatement period. This finding raises a question of how the
external financing choices change for misstating firms in debt-based firms. Due to the
primary preference on debt financing, debt-based firms have already had a relatively
high leverage ratio and debt covenants to maintain. After an announcement of
accounting misstatements, a number of questions arise, including: whether they can
raise more debt, or change to issue stocks, and whether minority shareholders and
creditors charge the firms more. Unfortunately, the answers for these questions are
unavailable. Having a sample of debt-based firms (i.e. Thai firms) allows the present
research to respond to these questions.
This thesis will therefore assess the economic consequences of accounting
misstatements in Thailand, with a particular focus placed on the firms’ external
financing activities. With regard to the reactions from capital markets, previous studies
in Thailand have found results that are consistent with prior studies into other countries.
For example, Tummanon (2005a) finds an average of cumulative abnormal return of -
9.78% in Thai firms after they are subject to accounting enforcement actions by the
Securities and Exchange Commission, Thailand. The concentration on the debt
financing activities of Thai firms will enable the present research to contribute new
evidence to the literature in order to understand the reactions of creditors and minority
shareholders.
51
Financial difficulties after the misstatement announcement lead firms to face a
restriction on their investment (Kedia and Philippon 2009). Since misstating firms risk a
higher cost of capital, (some cannot even get new finances) corporate liquidity and debt
covenants are deemed to restrict the firms from investing activities. During the two
years after the restatement period, misstating firms’ operations are more economically
constrained than are those of non-restating firms in the same industry, measured by the
growth rates of capital expenditures, employees, sales, and market values (Kedia and
Philippon 2009). If these restrictions last for long then the cost of a restatement
announcement is inclined to be dramatic and might cost more than the firm can quantify
(Graham et al. 2008).
One possible solution to reduce the severity of the costs of information uncertainty is to
improve corporate governance structures so that the reforms can lessen the potential
costs of capital and can restore the firms’ credibility to investors and creditors. The next
section illustrates changes in corporate governance for the misstating firms in the post-
restatement period.
3.2.2 Improvement in Corporate Governance Structures
Improvements in corporate governance mechanisms are a potential mechanism to help
restore misstating firms’ reputation. The revelation of accounting misstatements
indicate the weakness of corporate governance (Dechow et al. 1996) and it decreases
value of the firm’s reputational capital (Agrawal et al. 1999). The misstating firms may
thus desire to show their investors the improvement on corporate governance systems in
order to restore their credibility; for example, firing the managers (Feroz et al. 1991) or
increasing the number and proportion of outside directors (Farber 2005).
a) Change in Top Management Position
The benefit of a managerial change is still a controversial point of debate. Since a firm’s
market value decreases after a misstatement announcement (e.g. Dechow et al. 1996;
Palmrose et al. 2004), the firm is anticipated that a managerial change may increase its
firm’s value (Weisbach 1988). Previous studies have found that management turnover is
52
significantly higher in misstating firms after the revelation of accounting misstatements
(e.g. Desai et al. 2006; Feroz et al. 1991; Hennes et al. 2008), yet many studies have not
(e.g. Agrawal et al. 1999; Beneish 1999b; Peasnell et al. 2001).
Hennes et al. (2008) advise that the inconsistency of evidence in prior studies into the
management turnover may be a methodological issue. When accounting misstatement
cases (i.e. both error and fraud samples) are aggregated, the sample is not as powerful as
the disaggregation between them in predicting a managerial change. In their study, there
is a significant positive relationship between the accounting irregularity (intentional
misstatements) and the CEO/CFO turnover, but there is none in the group of accounting
errors. Agrawal et al. (1999) emphasise that there is a complex process behind the
decision for a managerial change. A firm tends to have a trade-off between the benefits
of a managerial change (e.g. restoring reputational capital, reduced legal liability costs)
and the costs (e.g. loss of human capital and expertise). In addition, Weisbach (1988)
raises that some CEOs might voluntarily resign from the poorly performing companies
because of their difficulties in recovery and the threat of stakeholder suits; so an
observation on the appearance of turnover only cannot deal with this argument.
Unfortunately, this suggestion can be achieved only if the data are available and even
Weisbash (1988) recognises this limitation.
Besides management turnover, subsequent employment of the restating firms’ managers
has been also investigated in prior studies. When an accounting misstatement is
detected, it will at least be reported in the restated financial statements in following
years, while they go public for listed firms. Therefore, the managers tend to lose their
reputation and it might be difficult for them to find employment afterwards. Desai et al.
(2006) discovered that the appearance of restatements reduces the managers' ability to
find comparable employment at another firm. This finding is consistent with an
exploratory study by Beneish (1999b). In addition, Persons (2006) found that the
compensation (bonus and salary) of executives decreased after the revelation of fraud or
a lawsuit. These insights confirm the important role of the managerial labour market in
disciplining the managers’ behaviour.
53
In concentrated ownership systems, although studies into management turnover are
scarce, this type of penalty is unlikely to occur because of the affiliation between the
managers and controlling shareholders. Gibson (2003) finds a weak negative correlation
between corporate poor accounting-based performance (i.e. profitability and sales
growth) and CEO turnovers in emerging markets, including Thailand, particularly when
firms have a large shareholder (holding > 20% of the total shares). In addition, there is
no significant correlation between stock performance (i.e. stock market returns) and
CEO turnover in Gibson’s sample. These results may indicate that the monitoring
system to control managers’ performance in emerging markets is weak because it is
often in emerging markets that CEO are affiliated with the controlling shareholder, and
sometimes the CEO is one of the controlling shareholders (Morck et al. 2005; Young et
al. 2008) and, therefore, the probability that the CEO is fired is reduced. In addition,
there is a smaller opportunity for investors in emerging markets to be able to discipline
managers and request effective corporate governance (La Porta et al. 1997, 1998;
Shleifer and Vishny 1997). Accordingly, concentrated ownership firms may not need to
fire managers in order to minimise the cost imposed by the markets. The weak
relationship between the CEO turnover and accounting performance which was found in
the Thai sample of Gibson (2003) indicates an absence of support for an examination
into the managerial change in Thai firms. Therefore, managerial change tends not to be
a significant consequence suffered by misstating firms in Thailand and that the
consequence imposed on managers is not an interest in this research.
b) Change in Monitoring Systems
When a misstatement is found, not only are the executives sometimes fired, but the
monitors themselves are also occasionally dismissed. Srinivasan (2005) points to a
higher rate of outside director turnover, particularly when the outside directors are also
audit committee members. He also finds that the labour market penalises outside
directors of misstating firms. Outside directors are shown by Srinivasan (2005) to lose
their position in other companies after the companies they service had announced
income-decreasing restatements. However, the multivariate tests of Srinivasan’s (2005)
findings were run on misstating firms only and, therefore, these results are not entirely
surprising (Richardson 2005). In contrast, Agrawal et al. (1999) do not find a higher
54
turnover of outside directors by the three year post-period window, when compared
with control firms; however, they do notice a significant change in the turnover of
inside directors. In terms of the board size, the number of directors on a board is larger
for fraud firms than for control firms in year t-1, but it is slightly smaller and close to
that of the control firms in the post-restatement period. This result supports the previous
studies into corporate governance structures which found that the size of the board is
not significant in monitoring roles (Beasley 1996), but qualifications are important
(Agrawal and Chadha 2005).
Auditors can also receive a penalty. Detecting and disclosing fraud is an auditors’
responsibility (ISA 240 (IAASB 2006)), and a suspension and litigation costs can be
imposed on those auditors who fail to fulfil their obligations. Feroz et al. (1991) find
that 85 auditors of the 188 misstating firms were censured by the SEC and 89% of them
were penalised. Bonner et al. (1998) developed a model to predict the possibility that
the auditors will be sued based on characteristics of the misstatements. They discover
that auditors are more likely to be sued when litigation relates to the frequently
misstated accounts (e.g. revenues and assets) or to fictitious transactions.
Unsurprisingly, the severity level also increases the likelihood of auditor litigation.
Since fictitious transactions are illegal, the more severe the offence, the more
stakeholders lose and the more likely auditors are to be sued. With regard to the reaction
of the market participants when the auditors are dismissed, restating firms with auditor
changes have a quarter shorter penalty for the decline in share prices when compared
with restating firms who have no audit change (Wilson 2008).
Significant changes in the monitoring level have been found in misstating firms, but the
benefits of these changes is inconclusive. By three years after the revelation of fraud,
the fraud firms studied by Farber (2005) were shown to have improved their corporate
governance mechanisms to the same level as those of the control firms. Farber (2005)
finds that the governance reformation informs the capital markets and leads to a higher
stock price performance, as measured by buy-and-hold abnormal returns. Yet, when an
evaluation is performed of a stock following by financial analysts, these reforms have
been shown to have no effect on subsequent institutional ownership and short sales.
55
Although there is evidence supporting a positive relationship between governance
reforms and an average share return, like in Farber’s (2005) study, it is still somewhat
difficult to argue that corporate governance reforms benefit the firm in terms of an
increase in stock performance because a firm’s value is principally derived from future
expected cash flows (Watts and Zimmerman 1986, pp. 15-36), or might be linked to the
earnings number, as Ball and Brown (1968) argue. Consequently, a confirmation of the
correlation between the governance reforms and stock performance is persuasive, but it
is too early to confirm a casual relationship. This conclusion is similar to the situation of
the relationship between share price and the announcement of accounting misstatements
in Section 3.2.1 in that both occurred but explanations for the results are constrained.
3.2.3 Legal and Regulatory Penalties
The previous subsections reviewed the reactions of capital providers to misstating firms
and the corporate governance reformation in misstating firms after accounting
misstatements are announced. This subsection will review legal and regulatory costs
imposed on misstating firms, when accounting misstatements are in violation of laws
(such as fraud) or when the misstatement costs stakeholders who then file a lawsuit
against the firm. The prior literature asserts that legal liabilities limit, but do not
eliminate, GAAP violation (Jiambalvo 1996). Moreover, some research is against the
view that the legal liabilities are an inadequate deterrence in the protecting mechanism
(e.g. Coffee 2001). Exploratory results from previous studies, based on litigation cases,
show that the likelihood of litigation increases when a misstatement is fraudulent
financial reporting and involves core accounts (Palmrose and Scholz 2004). In the same
vein, the probability of litigation for auditors increases when they cannot detect
fictitious items and the core accounts (Bonner et al. 1998). These studies show the
correlations between accounting attributes and litigation probability, and the adverse
consequence for supplying low quality financial reports.
Although there is a significant relationship between financial reporting and litigation
probability, based on the statistics in previous research, the managers might still take a
risk (Wahlen 2004). According to the results in Palmrose and Scholz (2004), only 38%
56
of misstating firms were sued and the chance of being sued occurs only when the
misstatements are in core accounts. These findings tend not to be economically
significant enough to deter self-seeking managers from the temptation to misstate
elements of earnings. Karpoff et al. (2008) develop certain measures for the costs
imposed to a misstating firm: for every pound of inflated value after the detection, the
firm’s value decreases by that pound, plus £0.36 for fines and class-action settlements
and £2.71 for reputational loss. Even though there are some limitations in their study
(Karpoff et al. 2008, p. 606), it is a rare attempt to disentangle the measurement of
reputational cost.
To summarise, this section has reviewed the consequences imposed to misstating firms,
management team, and monitors. There is empirical evidence showing that misstating
firms and managers receive penalties from stakeholders, in terms of economic
consequences (i.e. costs of capital, financing abilities, litigation and regulatory costs),
managerial changes, costs of the corporate governance restructuring, and reputational
costs.
The next section discusses the linkages from the causes of accounting misstatements to
the consequences after the misstatements have been detected (a link from Chapter 2 to
Chapter 3).
3.3 Linkages between the Causes and Consequences
Chapter 2 reviewed the determinants of the causes of accounting misstatements. The
previous section (Section 3.2) discussed the evidence on the consequences imposed on
misstating firms and relevant parties. From this, it can be seen that the causes and
consequences are related, as shown in Table 3.1.
In Table 3.1, the left-hand column presents the causes of accounting misstatement,
which were taken from the determinants of the causes in Table 2.2. The causes can be
divided into three groups: incentives, weakness of monitoring activities and external
57
drivers (see Chapter 2). The right-hand column contains the consequences of accounting
misstatements. As discussed earlier, they consist of managerial changes, economic
consequences, corporate governance reforms, and litigation costs.
Table 3.1: Relevance between Causes and Consequences of Accounting Misstatements
Causes Consequences
Incentives
Managers’ own benefits
Higher compensation
Profit from selling shares at inflated price
Reputation gain
Financial motives
Circumvent debt covenant violation
Minimisation of costs of capital
Management turnover
Managers
Decreased compensation
The loss of employment and poorer
subsequent employment
Economic consequences
Ability to obtain external financing
Higher costs of capital
Weak monitoring activities
Audit deficiency
Ineffective and/or incompetence internal
monitors (board of directors, audit
committee, internal auditors)
Corporate governance reforms
Auditors (suspended, dismissed)
Internal monitors (decreased
remuneration, dismissed)
Improve governance structures
External drivers
Maintain or raise share price by meeting
earnings benchmarks and analysts’
forecast
Comply with requirements and
regulations
Economic consequences
Capital market participant’s reactions
(decreased share price, increased bid-
ask spread, downward analysts’
revisions)
Legal and regulatory penalty
Firm
Management
Auditors and internal monitors
58
The linkages between the causes and consequences can be explained as follows. Firstly,
if the accounting misstatement is created to maximise personal gains then the self-
seeking or incompetent managers are fired or face a reduction in compensation. They
are also penalised by the labour market in subsequent employment. Secondly, if the
misstatement is performed so that the firm can avoid debt covenants and minimise cost
of debt then the creditors will penalise the firm by tightening debt covenants and
increasing interest rates. Thirdly, the managers may offer an excuse that they had to
create a misstatement to meet the capital market’s expectations; however, the capital
market participants disagree. They are likely to sell the firm’s shares and the firm's
value will then decrease. As for prospective investors, they will require a higher rate of
returns due to concerns over information uncertainty. Financial analysts are also
concerned about the market performance of the firm. Fourthly, the misstatement signals
the weaknesses of corporate governance structures and, therefore, the firm is more
likely to improve the governance systems in order to assure the investors and minimise
the likelihood of accounting misstatements in future. Finally, if the misstatement is in
violation of the law then the firm will face a lawsuit case and litigation costs will be
incurred. Due to the limitation of research in concentrated ownership systems, it is
acknowledged that the attributes of the causes and consequences in the Table are mainly
driven by the samples from dispersed ownership systems.
The linkage of the causes and consequences of an accounting misstatement can also be
integrated into a timeline (see Figure 3.1) devised by Wahlen (2004, p. 184).
At the outset of Figure 3.1, there is a certain set of circumstances that can lead to an
occurrence of non-GAAP reporting. Similar to the review conducted in this research,
the antecedents are composed of: managers’ incentives, internal control systems,
external pressures from capital markets and a firm’s characteristics that are usually
control variables in research analyses (e.g. size, growth, and industry). Three columns at
the middle present the process of non-GAAP reporting after an incentive occurs. The
internal control systems are common protection tools to weaken the incentives but if the
control systems are weak then non-GAAP financial reports will be released. The GAAP
violation might take the form of an error on a core account, inadequate disclosures, or
59
fraudulent financial reporting. The non-GAAP reporting expropriates some
stakeholders’ interests, depending on the incentives of the misreporting. For instance,
inflated earnings numbers misleads the capital-market participants, or lenders are misled
by manipulated accounts when the firm is close to default. The board of directors and
compensation committee are deceived, if the manager wants to mask his poor operating
performance or maximise his compensation, respectively.
Figure 3.1: Factors Associated With Non-GAAP Financial Reporting
Timeline
Non-GAAP report is:
Released Used Restated
Antecedent
circumstances
Actions taken to
misstate
earnings
Resource allocation
decisions
Detection
triggers
restatement
Restatement triggers
consequences and ex
post settling up
Managers’
incentives
Internal
Controls
Prior earnings
and returns
Earnings
expectations
Size
Growth
Industry
Others
Core and non-
core elements
of earnings
Pervasiveness
Transactions
versus accounts
Estimates
versus
allocations
Annual or
interim
financial
statements
Number of
periods restated
Disclosures
Auditor
negligence or
compliance
Fraud
Others
Are users fooled?
Capital-market
participants
Lenders
Boards of directors
Compensation
committees
Regulators
Others
Who detects
misstatement?
Who triggers
restatements?
Capital-market
participants
Directors and
officers
The SEC and
other regulators
Auditors
Other managers
within the firms
Others
Share price
reactions in the
capital markets
Cost of capital
implications
Litigation and
resolution
Managers sued
and/or fired
SEC actions
(AAERs) or other
regulatory actions
Auditors sued
and/or fired
Delisting
Bankruptcy
Survivorship
Others
Source: Wahlen et al. (2004, p. 184).
Since non-GAAP reporting can be very costly to relevant users, a certain set of
monitoring systems is instituted to detect misstatements (the fourth column). The
monitors include authorities (e.g. stock exchange authority), external auditors, and
internal monitors (e.g. directors, an audit committee, and officers). A requirement for an
accounting restatement arises after these monitors have detected the misreporting. Once
the restatement, or the detection of the misstatement, is revealed, the relevant
60
stakeholders take action (the fifth column). These actions are in accordance with the
review in the previous section. Equity holders are then expected to sell the firm’s stocks
(or buyers are prepared to pay less for them) and the share price declines. Possible
capital providers increase their charges for the capital provided because of the firm’s
poor quality of financial reporting. The self-seeking and incompetent manager can be
dismissed, as might incompetent auditors and monitors. The related authority will file a
lawsuit against the perpetrator(s) and/or issue a specific command to the firm (such as
an enforcement action or delisting). Existing studies have been conducted in line with
this Wahlen (2004) timeline; however, it is useful to divide it into two phases: causes
and consequences.
The extant literature frequently separates the occurrence of accounting misstatements
into two parts. The samples in previous research are usually the ex post cases, i.e.,
studying non-GAAP reporting after it is detected. For instance, mainstream U.S.
research has collected samples from the U.S. Securities and Exchange Commission
Accounting and Auditing Enforcement Releases, AAERs, or accounting restatement
filings in the U.S. Government Accountability Office database. Detection, either by the
independent authorities or by the internal monitors, is at the midpoint of the timeline.
Therefore, the detection is deemed to have become a cut-off point for the specification
of independent and dependent variables in the research. By the AAERs (or restatements),
these ex post case studies go backwards to find the causes of accounting misstatements.
When the causes are being examined, the substance of the consequences is assumed to
be less than the economic benefits that the misstating firms get from the manipulation
(e.g. in Efendi et al. 2007), and it is assumed that the managers decide to misstate
financial reports. With regard to the consequences, from the revelation of an accounting
misstatement point, the studies go forward to investigate the costs imposed to the
misstating firm after the discovery, such as capital market reactions, legal penalty, and
corporate governance reforms.
To be consistent with the methodology of previous studies, and the timeline suggested
by Wahlen (2004), this thesis is interested in gathering samples from the Securities and
Exchange Commission, Thailand. The research will then examine the determinants of
61
accounting misstatements, where the occurrence of accounting misstatements is the
dependent variable of the determination. After that, it will assess the economic
consequences after the accounting misstatements have been disclosed. The incidence of
accounting misstatements, therefore, is an independent variable in the consequence
assessment. Both the determinants and consequences of accounting misstatements will
be determined in one study, consistent with the recommendation of Dechow et al.
(2010).
3.4 Summary
The consequences of accounting misstatements can be categorised into three groups:
capital market participants’ reactions, improvements in monitoring mechanisms, and
liability and litigation commitments. An absence of theory explaining the relationship
between GAAP violation and the consequences imposed on misstating firms means that
some research results contain limitations (Wahlen 2004). For instance, a casual
relationship between the announcement of an accounting misstatement and abnormal
returns cannot be confirmed because the abnormal returns have already appeared before
the announcement, and have also happened with other firms in the same industry. There
is also a lack of theoretical grounds to explain the incremental effects of some variables
(i.e. initiators, characteristics of errors). Nevertheless, the available empirical findings
can provide us with many important insights of the costs and benefits of financial
reporting decision-making.
The evidence on the causes and consequences in the setting of the principal-principal
conflict is found to be smaller than that of the principal-agent conflict. Since most of the
mainstream research to date has been conducted on samples in the U.S., where the
shareholder-agent conflict appears, analysis of the causes has mostly focused on the
agent’s personal incentives and capital market drivers. As a result, the consequences are
predominantly focused on capital market reactions and management turnovers. In the
presence of a principal-principal conflict, a majority of shares are usually held by
controlling shareholders and the managers are affiliated with them. Consequently, the
62
potential agency conflicts in this setting are a conflict between the controlling
shareholders and the outside investors. The related causes and consequences of those
misstatements that involve outside investors are less well explored when compared with
those of the principal-agent conflict. An examination of these issues in Thailand can
help to bring them into light.
The next chapter provides a brief background for the country of Thailand and will
describe the financial reporting regime for Thai firms.
63
CHAPTER FOUR
THE CASE OF THAILAND
4.1 Introduction
As previously discussed in Chapters 2 and 3, the aim of this research is to study the
determinants and consequences of accounting misstatements in concentrated ownership
systems. Thai firms are selected to serve as a sample of firms from a concentrated
ownership system. In this chapter, the country’s institutions and financial reporting
regulations are described. Hypothesis development and the research methodology will
be set out in Chapter 5, while secondary data analysis for the determinants and
economic consequences of accounting misstatements in Thailand are contained in
Chapters 6 and 7 respectively.
Thailand’s institutions and firms are highly representative of a concentrated ownership
system (Rahman et al. 2010). Thai firms mostly use debt financing and the power of
capital markets to discipline a firm is low (Alba et al. 2003). Approximately 83% of
non-financial firms listed in the Stock Exchange of Thailand are firms with controlling
shareholder(s) (Wiwattanakantang 2001) and the high ownership concentration risks
weakening corporate governance mechanisms (Alba et al. 2003; SECT 2005a). These
attributes call into question the quality of financial reporting in Thailand. Since the 1997
crisis, the authorities in Thailand have enacted many regulations to improve corporate
governance structures and the quality of financial reporting. For example, listed firms
are now required to have an audit committee with at least one member who has
financial expertise (SET 2000a). However, so far, it is reported that such changes have
had little impact on the management and behaviour of Thai firms (White 2004). These
reforms are still in an early stage and have not yet worked effectively in financial
reporting control (Tengamnuay and Stapleton 2009). Therefore, it is likely that financial
reporting in Thailand is not of a particularly high quality.
64
In light of this, this research examines financial reporting quality in Thailand,
particularly focusing on the occurrences of accounting misstatements. It has been
suggested in the literature that Thailand’s financial statement preparers’ incentives are
more important than the body of accounting standards (Ball et al. 2003). Consequently,
it is necessary to ask what the incentives of the financial statements preparers are, and
how the existing corporate governance structures function in order to limit the
preparers’ incentives in the financial reporting process. Apart from the determinants of
accounting misstatements, this study also aims to assess the economic consequences
after the misstatements have been discovered. As discussed in the previous chapter, the
analysis of both the determinants and consequences should help contribute a
comprehensive understanding of a cost-benefit trade-off in financial reporting process.
4.2 The Case of Thailand
Thailand’s capital market is considered to be an emerging market (Boubakri and
Ghouma 2010; La Porta et al. 1998) and the ownership structure of Thai firms is based
on business groups and family-based firms (Claessens and Fan 2002). A pyramid
structure and cross-holdings are common and these characteristics generate a divergence
between cash flow rights and voting rights (Claessens and Fan 2002; Wiwattanakantang
2001). In addition, they increase the possibility that controlling shareholders can
expropriate the interests of outside investors (Claessens et al. 2002). Thailand’s
concentrated ownership system has meant that it has been the subject of several prior
cross-country studies (e.g. Boonlert-U-Thai et al. 2006; Fan and Wong 2002; Leuz et al.
2003; Rahman et al. 2010).
Another reason that has made Thailand a popular focus of research is the 1997 Asian
Financial Crisis. The Asian Financial Crisis began with the flotation of the Thai
currency (Thai baht-THB) in July 1997. The crisis quickly spread to Indonesia, Korea
and other countries in South-East Asia and East Asia. This crisis represented an
exogenous shock that significantly lowered the available return on investment
opportunities of firms in these countries (Johnson et al. 2000). The sudden shock
65
provides an opportunity to assess the legal systems and corporate governance that
existed at that time. Empirical research finds that legal protections and the national
governance policy in East Asian countries were poor (Johnson et al. 2000). Firms with
weak corporate governance (i.e. low disclosure quality and large shareholders involve in
management) have been shown to suffer more severe decreases in stock prices during
the crisis (Mitton 2002). Ownership concentration has generally had a positive effect on
share price, but the share price declined when there was a great divergence between
cash-flow and voting rights (Lemmon and Lins 2003). All of the South-Asian
economies that experienced a crisis in 1997 have subsequently improved their corporate
governance structures (e.g. in Talha et al. 2009). Many improvements have been made
in Thailand’s monitoring bodies, such as full adoption of International Accounting
Standards, stricter regulations for listed companies, and corporate governance reforms.
However, the efficiency and effectiveness of such reforms has not yet been confirmed.
The following sections will address this issue in detail, and will further continue
reviewing the effect of the corporate governance reforms on financial reporting quality.
4.2.1 Thailand’s Accounting and Financial Institutions
This section provides the background of Thai regulatory systems. Thailand’s law and
legal systems are emphasised in this section, as are its accounting and auditing
professions.
a) Legal Systems
It has been found that Thailand’s legal systems to protect investors are weak. In
particular, its protection of minority shareholders is lacking. Thailand’s laws are based
on common law, but they have been significantly influenced by French civil laws (La
Porta et al. 1998, p. 1119). La Porta et al. (1998) also showed that Thailand has a
below-average score on liability standards (which minority shareholders can use to sue
directors and majority shareholders for damages), and a below-average score of creditor
rights. The efficiency of the Thai judicial system was ranked 48th
out of 49 countries
(La Porta et al. 1998). The presence of civil lawsuits by minority shareholders is absent
in Thailand and large penalties for offenders in cases where listed companies have
66
violated the law are also rare (Ananchotikul et al. 2010). As for the criminal cases,
Viverito (1998) argues that these often do not end in convictions.
All listed companies and market regulators are governed under the Securities and
Exchange Act B.E. 2535 (A.D. 1992). It is noteworthy that although the Thai stock
exchange was created in 1975, the Act was only released in 1992. Although the Thai
government intended to develop the regulatory framework since 1987, the project took
five years until it was completed because of the frequent changes in government and the
lack of competent human resources and expertise. At present, there are two projects to
amend the Securities and Exchange Act and the Public Company Act, and to enact a
Class Action Act, in order to increase the protection of minority shareholders. However,
once again they are progressing slowly and it is uncertain if these legislative
amendments will be ultimately adopted (SECT 2005a).
b) Accounting and Auditing Profession
The body of the accounting and auditing profession in Thailand is deemed to be
improved. In particular, since the crisis of 1997 their independence has been
strengthened. Accounting and auditing professionals in Thailand are under the control
of the Institute of Certified Accountants and Auditors of Thailand (ICAAT), which is
now named the Federation of Accounting Professions (FAP). The ICAAT started to
adopt International Accounting Standards (IASs) for guidance in its accounting standard
setting in 1987. However, because the ICAAT was under the supervision of Ministry of
Commerce at that time, all accounting standards had to be approved by the Ministry of
Commerce. The independence of the standard setting and financial reporting practices
in Thailand is consequently criticised because it is highly related to political factors
(Ball et al. 2003). After the 1997 Financial Crisis, the World Bank encouraged the
establishment of the Thailand Financial Accounting Standards Board, which would
have the sole authority to issue accounting standards and regulations. The project was
achieved in 2004 when the FAP was formally established. It now has full power to
regulate accounting and auditing standards.
67
The FAP fully adopted International Financial Reporting Standards (IFRS) as Thai
GAAP for the SET50 in 2011 and plans to expand it to all of the listed companies in
2015. Nonetheless, the effective date for each standard usually provides the benefit of a
transition period. Therefore, it is currently unknown when the full IFRS/IAS will
become mandatory in Thailand. In addition, during this evolution period it is impossible
to be sure that the financial reports in Thailand have met the global standard level. In
addition, since IAS/IFRS emphasises a principles-based approach, the implementation
depends on the manager’s and the auditor’s judgement (Ball 2006). Since markets,
political forces, and economic influences are still local (White 2004), it is still
impossible to conclude that the financial reporting quality in Thailand has met the
standard.
Auditors in Thailand are authorised by the FAP under the Accounting Professions Act
B.E. 2547 (A.D. 2004).11
The auditors who certify the financial reports of listed
companies are also under the Securities and Exchange Act B.E. 2535 (A.D.1992).
Auditors’ practices are regulated by Thai Standards on Auditing, which are adopted
from the International Standards on Auditing. Audit firms in Thailand fall into two
categories: Big 4 and non-Big 4 firms. The Big 4 are PricewaterhouseCoopers, Ernst &
Young, KPMG and Deloitte. Non-Big 4 firms encompass international firms (e.g. Grant
Thornton and BDO Richfield) and local Thai audit firms. Foreign audit firms are not
allowed to practise in Thailand without local audit partners. Therefore, the
establishment of a global audit firm in Thailand is in reality a form of incorporation
with a local audit firm.
Thailand has a shortage of well-qualified accountants and auditors. Alba et al. (2003)
comment that the country has unnecessary statutory requirements; for example,
partnerships and inactive limited enterprises (about 300,000 firms in the survey) have to
be audited every year. By statutory requirement, each CPA can provide a service to up
to 300 corporations a year. This regulation thus limits the availability of audit partners.
11
Before the Accounting Professions Act B.E. 2547 (A.D. 2004), auditors were under the Auditor Act
B.E. 2505 (A.D. 1962). The new Act draws more attention on the qualification of auditors, such as
auditors are required to attend a training course at least 12 hours a year.
68
As of 2002 there were 4,700 CPAs, but only 2,700 were active and qualified for
700,000 registered companies in total (White 2004). Therefore, there was an average of
260 clients per auditor, which almost reaches the maximum level. In the capital markets,
auditors who want to provide a service for listed companies must register and get
approval from the Securities and Exchange Commission, Thailand. At the end of 2009,
there were 140 certified auditors for 560 companies, 77 of whom work for Big 4
auditors (SECT 2011). The next subsection will separately review the regulatory body
of the capital markets in Thailand, including their regulations for financial reporting of
listed companies.
4.2.2 Thailand’s Capital Market
The Stock Exchange of Thailand (SET) was first started as a limited partnership in
1962, but it ceased operations in the early 1970s due to poor performance and a lack of
official government support. The capital market was resurrected in 1975, and it has
remained in business ever since. In 1999, the SET constructed a new Market for
Alternative Investment (MAI) to provide an opportunity for small and medium-sized
companies. Large companies with more than THB 300 million (£5.77 million) in paid-
up capital after IPO can trade in SET, while small and medium-sized enterprises having
over THB 200 million (£3.8 million) can trade in MAI. However, the MAI market does
not operate separately; it is considered to be a sector of the SET market. Therefore,
firms listed in either market are similarly required for reporting, disclosure
requirements, and corporate governance rules and they all are under the supervision of
the Securities and Exchange Commission, Thailand (SECT). The size of Thailand’s
capital market is relatively small when compared with neighbours (BOT 2011).12
The
number of listed companies has grown slightly, from 518 companies in 2006 to 525
companies in 2008.
According to the SET (2009) report, more than 50% of investors are local individual
investors while about 7% are local institutions. The number of foreign investors has
12
Based on the market capitalisation of THB 449.96 million (£8 million) at the end of 2008. It was 1/25 of
Hang Seng (Hong Kong), 1/33 of Nikkei (Japan), 1/3 of Straits Times (Singapore) and 3/4 of Kuala
Lumpur Stock Exchange (Malaysia).
69
decreased from 33.7% in 2006 to 19.4% in 2009 (SET 2009). A report to World Bank
by the SECT (2005a) documents that foreign institutional investors are quite active in
Thailand and often drive the market. Firms that are controlled by a group of foreign
investors have higher performance of return on assets than firms with no controlling
shareholders; however, no significant relationship has been found between foreign
ownership and a firm’s value (i.e. Tobin’s Q) (Wiwattanakantang 2001). The influence
of foreign investors in disciplining listed firms might be limited and exist in only some
groups of firms because the Foreign Business Act, B.E. 2542 (A.D.1999) restricts
foreign share ownership in companies (including listed companies) and the investment
from foreigners is usually directed into the largest firms.
The ownership of listed companies is not dispersed even when listed. The average of
ownership concentration is about 44% of all outstanding shares (Alba et al. 2003).
Families are major shareholders. A survey of 270 Thai listed companies in 1996 shows
that 70% of the sample is owned by a single family, and 83% of all have controlling
shareholders involving in management as officers or directors (Wiwattanakantang
2001). The structure of business groups is also found to be linked through stock
pyramids and cross-ownership; however, at 13.5% the number of firms having a
structure of stock pyramids and cross-shareholdings is relatively smaller in the region
(Claessens et al. 2000).13
Even so, some Western firms (e.g. in the U.S., Ireland and
Finland), or even Japanese firms, do not have ultimate owners who control the company
through either a pyramid or through cross-holdings (La Porta et al. 1999, p. 499).
Wealthy families play a major part in the national economy of Thailand: just twenty-six
wealthy families controlled approximately 66 percent of the market capitalisation in
2004, and 75 percent for the same number of families in 2001 (SECT 2005a). This high
ownership concentration and the prevalence of controlling shareholders tend to be a
major obstacle that weakens corporate governance in Thai firms (Alba et al. 2003;
Kouwenberg 2010; SECT 2005a).
13
The region includes nine countries in the study by Claessens et al. (2000): Hong Kong, Indonesia,
Japan, Korea, Malaysia, The Philippines, Singapore, Taiwan and Thailand.
70
a) Corporate Governance Policies
Corporate governance has been of major concern to the government and regulators of
Thailand since the 1997 Asian Financial Crisis. Since 1998, all listed companies are
required to have an audit committee, and the audit committee members must be
composed of at least three independent directors (SET 2000b). Companies also need to
have a code of best practice for board members. The year 2002 was officially
designated as the Year of Corporate Governance, and the SET introduced a corporate
governance code for listed companies in this year. The code consists of fifteen
principles of good governance, similar to existing codes in developed markets (e.g. the
U.K.). The current fifteen principles of corporate governance are in compliance with the
2004 Principles of Corporate Governance by the Organisation for Economic Co-
operation and Development. Most of them are voluntary principles on a “comply or
explain” basis. If a listed firm does not adopt a particular policy recommended by the
code, it is expected to provide an explanation in an annual report. A study by
Ananchotikul et al.(2010) suggests that an adoption of the fifteen principles is likely to
be given attention by large firms. To date there have only been a few compulsory
policies, such as facilitating voting through proxy, having an audit committee, and
having at least three independent directors.
As for banks and financial institutions, they are also under the supervision of the Bank
of Thailand (BOT). After the collapse of fifty six financial institutions during the crisis,
the BOT has more strictly enforced good corporate governance; including the guidelines
of good practices for directors and notifications to spell out the requirements of an
external auditor’s qualifications (Montreevat 2007). The financial sector is consequently
excluded in this research project because of the specific regulatory systems and
accounting for finance companies.
With regard to boards of directors, a listed company is required to have a board of
directors, which must be composed of at least five directors and the board must meet
once every three months (Public Company Act of B.E. 2535 (A.D.1992) section 67, 79
and 80). Since 2006, one-third of the directors (at least three members) must be
independent directors. The average number of independent directors in Thai listed firms
71
has seldom changed: three in 2002 and four in 2008 (Kouwenberg 2010) and it does not
differ from the requirement. A possible reason for this may be that the controlling
shareholders do not desire to see their influence reduced by outside directors. In
addition, prior research has argued that the governance systems in Thai firms are
established due to obligations/compliance with regulation, and are not due to an
appreciation of their benefits (Dhnadirek and Tang 2003; White 2004).
The involvement of controlling shareholders on management and corporate governance
usually appears and weakens the independence of monitoring systems. Since most Thai
firms are family-run business, it is frequently found that the board is dominated by
family members (Nikomborirak 2001). In addition, eighty-eight percent of listed
companies have a chairman of the board who is also the chief executive officer (CEO)
(Kouwenberg 2010). Generally, CEOs are monitored by boards of directors. The
monitoring system is, thus, weakened if the chairman and CEO is the same individual.
The prevalence of audit committees has been done in a ‘passive’ way (they are often
established only because they are compulsory) and it is hard to be assured that the audit
committees are not affiliated with controlling shareholders and management
(Tengamnuay and Stapleton 2009). Since an audit committee is appointed by boards of
directors, and because the boards of Thai firms are often composed of family members,
the boards may appoint affiliated members to serve on the audit committees.
Accordingly, the appearance of controlling shareholders is likely to reduce the
independence and effectiveness of the corporate governance systems.
In addition, a cost-benefit trade-off is an inevitable factor in the decision-making for a
corporate governance policy. Less developed countries, including Thailand, seem to
have less incentive to improve firm-level governance and one reason involves the
financing activity choice (Doidge et al. 2007). The incidence of good corporate
governance is more likely to appear when Thai companies issue equity (Nikomborirak
2001; White 2004). Kouwenberg (2010) finds that an increase in the implementation of
voluntary corporate governance practices in Thai firms appears only in some aspects
(e.g. a disclosure of individual directors’ fees and written ethics code and corporate
governance policy) and exists only in large firms.
72
Another interesting point of the trade-off in the decision-making for corporate
governance policy is given by Ananchotikul et al. (2010); that is, firms may prefer
implementing only costless policies (e.g. a code of ethics and a statement for business
conduct) to more costly polities (e.g. reforming boards of directors and increasing
independence in the controlling systems). Ananchotikul et al. (2010) call this group of
firms a ‘talk-only’ group. They measure the talk-only group by using a dummy variable
for the firms having a high score (top 33%) for written statement policies but a low
score (bottom 33%) for either shareholder rights or board structure. Twelve percent of
the sample in Thailand is found to be in this ‘talk-only’ segment. The results indicate
that, overall, the voluntary implementation of corporate governance practice reduces the
likelihood of a firm to violate listing rules, laws and accounting standards; however, the
talk-only policy increases the likelihood of violations. Accordingly, the findings remind
us of that the significance of the quality is more essential than its appearance. In a
similar vein, Chuanrommanee and Swierczek (2007) examined the relationship between
corporate governance reforms and firms’ operating performance (as measured by ROA)
after the crisis, basing their study in three countries: Malaysia, Singapore and Thailand.
Chuanrommanee and Swierczek (2007) did not find a significant relationship between
corporate governance reforms and operating performance. They argue that the
prevalence of corporate governance policies in these countries in the post-crisis era is
more illusion than fact.
In brief, corporate governance in Thailand has been the subject of considerable reform
after the 1997 crisis. However, because the management and behaviour of Thai firms
have not changed (White 2004), and because legal enforcement is weak
(Chuanrommanee and Swierczek 2007), the reforms do not seem to function effectively.
The SECT (2005a) comments that a majority of the listed companies are family firms
and they have near absolute control in the corporations. They can effectively control the
company’s annual general meetings through voting rights. The SECT (2005a) also
addresses a drawback of the structure of pyramids and cross-holdings.14
Therefore, the
14
A pyramidal ownership structure is defined as an entity whose ownership structure displays a top-down
chain of control (La Porta et al. 1999). The ultimate owner is located at the apex and below are
successive layers of firms, which all are affiliated. For example, outstanding shares of a public company
73
ownership structure of Thai firms tends to threaten the effectiveness of internal
corporate governance mechanisms (e.g. boards of directors and audit committees). So
much so, that it can eventually lower the financial reporting quality of the firms.
Since the prevalence of audit committees in Thailand is in an early stage (Tengamnuay
and Stapleton 2009) and there is no variation in the number of independent directors for
listed firms between 2002-2008 (Kouwenberg 2010), these mechanisms are unlikely to
vary an incidence of accounting misstatements in Thailand. On the other hand, the
ownership structure is likely to influence the financial reporting and corporate
governance policies. Due to the constraint of time and data availability, this research
excludes an examination into the boards of directors and audit committees. Instead,
following the suggestions by Bebchuk and Hamdani (2009) this research will determine
relationships between ownership structure and accounting misstatements.
There is a group of external monitors who might be able to moderate the agency
conflicts in the contracting process and to protect the interests of minority shareholders
and creditors. This group includes external auditors and market regulators.
As is the case in most countries, auditors play an important role in East Asia (Fan and
Wong 2005). Big 4 auditors can increase detection of earnings management in Thai
firms, while neither board size nor the proportion of independent directors on boards is
associated with restraint (Pornupatham 2006). The Securities and Exchange
Commission, Thailand, who regulate the Thai markets, also play a role in monitoring
financial reporting of listed firms. Their regulations and monitoring process are
discussed in the following section.
A are held by family X, 10%, and by private companies Y and Z, 10% each. It seems that there is no
ultimate owner in company A. However, in detail family X is the owner of companies Y and Z and
holds half of shares in both private companies. Ultimately family X has control rights over public
company A for 30%. Regarding cross-holding structure, if public company A also holds shares of
company Y, company A has cross-holdings. More examples can be seen in La Porta et al. (1999) and
Wiwattanakantang (2001).
74
b) Regulations for Financial Reporting
The Securities and Exchange Commission, Thailand (SECT) is the securities regulator
in Thailand and it regulates every activity of securities business (e.g. listed companies,
broker/dealer companies, investment advisory companies, registrars and credit rating
agencies). In terms of corporate financial reporting, CEOs and CFOs of listed
companies are fully responsible for financial reporting. Annual financial statements
must be approved by shareholders in the annual general meeting. They should then be
submitted to the Stock Exchange of Thailand within one month of the annual general
meeting, and then made available for public access. The annual general meeting must be
prepared within four months after the end date of fiscal year.
According to Securities and Exchange Act B.E. 2535 (A.D. 1992), section 56, listed
companies must submit:
i. Quarterly financial reports;
ii. Annual financial reports;
iii. Annual reports; and,
iv. Any other reports specifically required by the SECT.
Quarterly and annual financial reports must be reviewed and audited by an auditor who
has been approved by the SECT, respectively. Auditors have to state their findings and
disclosure the facts material to the financial statements incorrectly prepared by the
company (section 62). The SECT can suspend or withdraw its authorisation from
auditors who fail to report such circumstance, and they can be withdrawn or suspended
of certification. The financial reports of government-owned enterprises are required to
be audited by auditors of Office of the General Auditor of Thailand.
Regarding penal provisions, any company who fails to submit financial reports shall be
liable to a daily fine not exceeding THB 100,000 (£2,058), and a further daily fine not
exceeding THB 3,000 (£62) (section 274). Any director and manager who acts or omits
to act in order to obtain unlawful gains for himself and causes damage to others (e.g.
asset misappropriation) shall be liable to imprisonment for a term of five to ten years
and a fine of THB 500,000 to THB 1,000,000 (£10,290-£20,580) (section 311). The
75
penalty for any director or manager who commits fraudulent financial reporting and
keeps incomplete inaccurate accounts (section 312) does not differ from the penalty for
the asset misappropriation case.
The monetary penalty tends not to be costly for the firms and perpetrators. Roughly
calculated, if a director commits a fraud then he or she is liable to a fine of THB 2
million (£41,160) (sections 311 and 312). An average value of the accounting
misstatements that have been found by the SECT is THB 417.6 million (£8.84
million).15
With this amount of misstatement, a fraudulent director may be able to gain a
certain amount of private benefits, which are considerably higher than the fine of THB 2
million. Even in the U.S., where legal enforcement is stronger, on average the
proportion of litigation cost is less than 10% of the total cost imposed on the misstating
firms (Karpoff et al. 2008).
The process of investigations on accounting allegations by the SECT does not
substantially differ from that of the U.S. Securities and Exchange Commission (U.S.
SEC). The SECT was itself modelled on the U.S. SEC. Investigations by the SECT
include company and securities fraud, and management malpractice. Examples include
embezzlement by company officials and securities firms, expropriation of assets that
hurt minority shareholders, false and inadequate financial disclosures, and stock market
manipulation. The SECT has a practice of regular reviews, as well as random
inspections, of companies and securities firms. The financial statement review has a
division that observes companies’ operation and financial reporting. The SECT has two
main sources where it looks for unusual items and behaviour. The first source includes
the Stock Exchange of Thailand (SET) and newspapers, which it uses to gather
abnormal trading volumes and insider trading information. Another source is company
financial reports. Analytical reviews are normally done to uncover accounting
irregularities. The SECT publishes information on its investigations if wrongdoing is
found. However, if the infraction is deemed minor, or if the company accepts that it
must correct the misstatement shortly after the SECT detects and informs them
15
There has never been a document published showing the value of accounting misstatements in Thailand.
This amount is based on the sample of this research, which is detailed in Chapter 6 and Appendix B.
76
informally, this detection will not be made public. However, the restated financial
reports must be sent to the SET and released to investors.16
Part of the sample in this research is accounting misstatements that were filed in the
SECT’s enforcement actions. They comprise requirements for accounting corrections
and announcements of fraud allegations (a violation of the Securities and Exchange Act
section 312). The remainder comprises accounting misstatements that were detected by
the companies themselves, or there might be a case where a firm agrees to correct the
misstatement since an informal contact from the SECT is made. These cases are also
considered accounting misstatement cases. The researcher collected these cases from
the restated financial reports, available in Thomson One Banker database. (More details
of the sample are presented in Chapters 5 and 6.)
The next section discusses previous studies into financial reporting quality in Thai
firms. The effects of ownership structure, corporate governance, debt orientation are a
subject of particular focus.
4.3 Evidence on Financial Reporting in Thailand
As discussed earlier in the thesis, financial reporting quality is a multi-dimensional
construct (Cohen et al. 2004). Many attributes of accounting quality in Thailand have
been examined by previous studies and they range from the informativeness of earnings,
earnings management, to accounting allegations.
4.3.1 Informativeness of Reported Earnings
Informativeness of reported earnings is one attribute of financial reporting quality that
has been tested since before the Asian Financial Crisis of 1997.17
Based on the data
16
Details into the review process of the SECT in this paragraph were gathered from the conversation with
an authority of the SECT, Mr.Thawatchai Kiatkwankul, Head of the Audit Department, on 28 August
2010. The questions had been approved by the Research Ethics Committee Cardiff Business School. In
addition, the contents of the process were agreed by Mr. Kiatkwankul.
77
before the crisis, Ball et al. (2003) contend that informativeness of reported earnings in
East Asian firms, including Thai firms, differs from that of other common-law
countries; it is even lower than that of code-law countries. Their regression analysis
shows that accounting income does not significantly respond to negative returns and the
timeliness of loss recognition is lower than that of other firms in other common law
countries and code law countries. Vichitsarawong et al. (2010) retested the
informativeness of earnings in the four East Asian firms across the crisis period. Their
findings are consistent with Ball et al. (2003) in that the informativeness of reported
earnings was low both before and during the crisis (i.e. 1995-1998) and the
informativeness improved after the crisis (i.e. 1999-2004). However, when considered
by country, the improvement is clearly seen in Malaysia and Singapore, but only
partially confirmed in Hong Kong and Thailand. The relationship between the reported
earnings and returns in Hong Kong and Thailand is significant only in the period of
2003-2004, while it has been significant in Malaysian and Singaporean groups since
2001. In addition, when scrutinising the corporate governance disclosure scores for each
country provided by Standard & Poor’s in 2004, they find that the disclosure scores are
widely distributed, from the best to lowest score they are: Singapore (median score =
92), Malaysia (64), Hong Kong (38) and Thailand (35). The score of Singapore and
Malaysia are thus of the order of two-three times that of Hong Kong and Thailand.
Consequently, a premise that the improvement in earnings informativeness after the
crisis is an effect of corporate governance reforms is weak in the Hong Kong and
Thailand samples. The average corporate governance disclosure in Thailand is behind
that of all of its neighbours.
17
The informativeness of earnings in this content comprises accounting conservatism and timeliness of
loss recognition (Fan and Wong 2002; Vichitsarawong et al. 2010). To measure accounting
conservatism, many prior studies (i.e. Ball et al. 2003; Boonlert-U-Thai and Kuntisook 2009; Herrmann
et al. 2008; Vichitsarawong et al. 2010) have used Basu’s (1997) reverse regression model. The model
observes the relationship between returns (an independent variable) and accounting income (the
dependent variable). A positive relationship is expected (it indicates the sensitivity of accounting
income to returns). Under accounting conservatism the relationship is expected to be greater when a
firm’s return has negative balance (a proxy of bad news). A dummy variable of 1 is thus added into the
model and interacted with the return when firms have negative returns (the coefficient of this interaction
is anticipated to be positive in order to indicate the sensitivity of accounting income to bad news). The
timeliness of loss recognition is measured by the adjust R2 of this regression model. If the association
between accounting income and bad news (i.e. negative returns) is strong, the adjust R2 will be higher
and as such accounting income contains timely information of loss.
78
The research into the effects of ownership structures on accounting conservatism in
Thai samples is available. Boonlert-U-Thai and Kuntisook (2009) found that a higher
ownership concentration and family ownership have a positive effect on accounting
conservatism. They also find a significant relationship between corporate governance
mechanisms (i.e. board size, the number of audit committee and number of independent
directors) and accounting conservatism, but Thai firms are less conservative in reporting
earnings when firms have a high leverage ratio and a high share value. The latter finding
is similar to the two incentives of accounts manipulation; i.e., firms with high leverage
ratio and high share value are more likely to misstate financial reports (Dechow et al.
2011; Dechow et al. 1996). Therefore, the negative effects of the debt level and the
share value may lead to a decision to misstate financial reports later.
The evidence of the role of auditors in accounting conservatism is varied, particularly
when the samples were considered in the period around the Asian Financial Crisis of
1997. Before the crisis (i.e. 1990-1996), Khurana and Raman (2004) did not find a
variation in accounting conservatism between Big 4 and non-Big 4 clients; yet, during
the crisis (i.e.1997-1998) Big 4 clients reported more conservative earnings (Herrmann
et al. 2008). After the crisis (i.e. 1999-2003), Herrmann et al.(2008) argue that both Big
4 and non-Big 4 clients reported conservative earnings (i.e. firms responded to timely
loss recognition), but non-Big 4 auditors advanced their work until the quality of their
clients’ reports did not differ from that of Big 4 clients. However, Boonlert-U-Thai and
Kuntisook (2009) found an increase in the level of accounting conservatism in Big 4
clients in a longer period of study (i.e. 2000-2006). A bias in the research results due to
the crisis should not be an issue for this research because the observations collected
range from 2001 to 2009. Meanwhile, this research provides evidence on the role of Big
4 auditors in financial reporting process when measured by an incidence of GAAP
violation.
In summary, for the attribute of earnings informativeness, it is likely that Thai firms
generally have an incentive to provide high quality of financial reports and provide
good corporate governance (such as a use of Big 4 auditors) because by so doing they
79
can maintain their reputation and minimise their costs of capital. Yet, such an intention
can often be reduced by certain financial pressures (i.e. high debt and high share value).
4.3.2 Earnings Management
Prior evidence reveals some evidence of earnings manipulation (within GAAP) in Thai
firms, consistent with incentives revealed in extant research. Charoenwong and Jiraporn
(2009) examine whether or not Thai firms have an incentive to avoid reporting losses
and negative earnings growth, both before and after the 1997 crisis. Their work was
conducted with reference to Degeorge et al.’s (1999) threshold; however, their results
showed that earnings management reduces in non-financial firms after the crisis. This
result is somehow surprising because the financial sector is generally more regulated by
authorities (both by the Bank of Thailand and by the stock exchange) and the
monitoring is found elsewhere to be more intense after the crisis (Montreevat 2007).
Nonetheless, since the measure indicates more of a kind of income smoothness than
aggressive accounting, it can be possible that the financial firms, which have a higher
proportion of outside investors than non-financial firms, want to maintain their
performance and not surprise their investors and, therefore, the change of earnings
number falls within the threshold.
Pornupatham (2006) reveals more on the incentives of earnings management in Thai
firms by surveying auditors’ perceptions. The first three incentives of earnings
management in the auditors’ opinion are to increase share prices, to avoid loss, and to
avoid a decline in earnings growth. The last two of the top three incentives are
consistent with the findings of Charoenwong and Jiraporn (2009). The pressures
concerning debt covenants and analysts’ forecasts are not important in the auditors’
opinion. Regarding monitors’ roles, the responses agree that Big 4 auditors are more
capable of detecting earnings management than non-Big 4 auditors. Respondents
explain that non-Big 4 auditors are less resistant to the management’s discretion,
particularly when firms are highly concentrated. One limitation of this study is that the
incentives of earnings management are analysed in the survey, but they were excluded
80
in secondary data analysis. This research project will develop this previous research by
examining whether these incentives exist if observed in accounting items.
Both this research and that by Pornupatham (2006) have a similar objective to reveal
incentives of Thai firms in manipulating earnings; however, there are important
differences between the two studies. The first difference is the dependent variable.
Pornupatham (2006) focuses on the manipulation within GAAP and measures it by
discretionary accruals, but this thesis is interested in the cases of GAAP violations.
Because the question of whether or not earnings manipulation benefits or harms
shareholders (Bowen et al. 2008; Guay 2008) is still inconclusive, the difficulty here is
that the earnings management measure may not be strong enough to show a conflict of
interests among the parties in contracting processes. Additionally, to examine the
opportunistic accrual management hypothesis by assessing discretionary accruals (e.g.
from Jones’ (1991) model) is controversial. A number of previous studies have found a
number of flaws in the models that are used for the assessment of discretionary accruals,
particularly for the opportunistic accrual management hypothesis (e.g. Guay et al. 1996;
Young 1999).18
Since this research aims to shed light on the principal-principal conflict, the researcher
needs a reliable measure that can indicate the occurrence of the conflict of interests.
Since an accounts manipulation signals a wealth transfer (Stolowy and Breton 2004),
the researcher proposes that GAAP violation can indicate that certain financial
statements users are being misled by the misstated financial reports (e.g. minority
shareholders are deceived by fake firm value or debt covenant violations are hidden
from creditors). Using the GAAP violation as a measure should, therefore, enable the
researcher to examine how the interests of minority shareholders and creditors are
18
There are two main types of error that can occur due to the use of regression residuals in the
measurement of discretionary accruals (Guay 2006). First, the residuals can contain non-discretionary
accruals. Suppose a firm suddenly experiences a negative operating cash flow. This shock affects the
amount of working capital deviating from the usual and, therefore, the prediction of discretionary
accruals in that year contaminates this performance-driven shock. Ball and Shivakumar (2006), for
example, has evidence to support this view. The second type of error occurs due to the estimates of non-
discretionary accruals. For example, Young (1999) finds that the parameters that are employed to
estimate non-discretionary accruals (e.g. operating cash flow, sales growth and fixed asset structure) are
significantly associated with the discretionary accruals generated from the frequently-used models (e.g.
Jones’ 1991 model).
81
expropriated by the firms and controlling shareholders. It also allows the research to
show what the reactions of capital providers are after they find that they have been
fooled by the counterfeit financial reports. A GAAP violation is thus likely to be a
superior measure. The other difference is on the variable of ownership concentration.
Pornupatham (2006) computed the percentage of the ownership concentration from the
top ten shareholders. Meanwhile, this research considers all the shareholders who own
more than 0.5%, it also investigates the shareholders who are private companies with
the aim of knowing who the ultimate owners are and the levels of their aggregated
control rights. This further investigation is important because more than a half of Thai
firms are family-based and their shareholding structure is often in the form of pyramids
and cross-holdings. Consequently, the aggregated control rights of ultimate owners are
greater than those that the investors see in the shareholder list.
When ownership structure is taken into account, the incidence of earnings management
increases in firms with high ownership concentration; however, this result is valid only
in non-Big 4 clients (Pornupatham 2006). A question is then raised: whether such
appearance occurs because of the poor quality of non-Big 4 firms. It may be that the
non-Big 4 auditors are competent but they cannot resist the dominant shareholders’
intention (as the interviewees in Pornupatham (2006) suggest), or the controlling
shareholders may create certain settings which obstruct the auditors from detecting the
manipulation (Cohen et al. 2002). An occurrence of audit firm change is one of these
settings. It is possible that the controlling shareholders want to hide their expropriation,
so they change an audit firm to reduce the possibility of detection. A higher proportion
of audit firm change for fraud firms than non-fraud firms has been found elsewhere
(Summers and Sweeney 1998). However, it is also possible that the newly appointed
auditors are extra vigilant about accounting irregularities. For example, Loebbecke et al.
(1989) found that more than one third of the frauds were detected in the first two years
of an auditor’s tenure. If this is the case, then fraud cases can be more easily identified
and there will be a positive relationship between audit firm change and the occurrence
of fraud cases in the ex post fraud sample. The relationship between auditor changes and
the likelihood of accounting misstatements, including the relationship by type of audit
82
switch (suggested by Lennox and Pittman 2010), will be examined further in this
research.
4.3.3 Accounting Allegations in Thailand
The two previous subsections yielded two important points for financial reporting in
Thai firms. Firstly, although high ownership concentration has a positive effect on the
informativeness of earnings, the quality of earnings reduces when firms have higher
debt and higher share value (Boonlert-U-Thai and Kuntisook 2009). Secondly, earnings
management (within GAAP) is also found in Thailand and the Thai managers’
incentives are in line with those in other countries (i.e. to avoid reporting loss and
negative earnings growth and to increase share prices) (Charoenwong and Jiraporn
2009; Pornupatham 2006). However, it is still inconclusive if earnings management
costs shareholders (Bowen et al. 2008; Guay 2008), particularly when the manipulation
is measured by discretionary accruals (Guay 2006). Since this research aims to shed
light on financial reporting that can be opportunistically used by controlling
shareholders to extract private benefits, the attribute of financial reports that are in
violation of GAAP will be focused upon. This section will review the prior studies
involving accounting misstatements and a particular focus is given to the misstatements
found by capital market regulators.
Tummanon (2005b) explores the characteristics of Thai firms that were required by the
Securities and Exchange Commission Thailand (SECT) to correct accounting errors,
and/or provide a special audit, during 2003-2005. A special audit required by the SECT
generally occurs due to two situations. Firstly, when the SECT suspects a firm’s
transactions, a further investigation by an independent auditor is required. Secondly,
when an auditor has a qualified opinion on the submitted financial reports due to the
limitation of evidence, the firm is required to provide the auditor with adequate
evidence. In many cases, the investigation starts from a requirement for special audits,
after which a requirement for accounting correction or an announcement of
management fraud is initiated. The firms subject to such enforcement appear the most
frequently in rehabilitation sector (30.8%). Seventy-seven percent of them are audited
83
by non-Big 4 auditors (compared with an average proportion of 43% across the
market19
). The primary reasons for the requirements involve understated allowance for
bad debt (18.7%), revenue recognition (15.25%) and managers’ misconduct (15.25%).
The share price of the alleged firm reduces after the news of the SECT’s enforcement
actions is released. An average cumulative abnormal return is -9.78% (Tummanon
2005a). Since the objective of Tummanon’s (2005b) study is to explore the
characteristics of the firms and the transactions only, it does not contain any hypothesis
testing and control group. Hypothesis testing can help to analyse whether there is
significant evidence to support the predicted determinants of accounting misstatements
in Thailand, while the prior research could show only the number of the occurrence. In
addition, an inclusion of a control group in the test can explain why, under the same
condition, some firms misstate financial reports but some do not. This thesis will
develop this previous work significantly and contain a control group in order to
investigate the causes of the accounting allegations in Thai firms.
Ananchotikul et al. (2010) examined whether the corporate governance adoptions assist
the firm to avoid violating capital market rules and accounting standards. Their study
gathered a sample of the announcements of the SECT under the news section during
2003-2006. The violations include management’s expropriation, falsification of
financial statements, insider trading and market manipulation. These violations are rated
from 1 to 3, depending on the severity (subject to researchers’ opinions). For instance, a
failure to submit financial statements on time is scored as 3, financial statements with
disclaimer of opinion and qualified opinions are scored as 2, while financial statements
with an adverse opinion are rated as 1. The corporate governance adoptions cover nine
principles introduced in the SET best practices (SET 2003). A Tobit regression is used
in the data analysis. After certain variables of the agency conflicts are controlled for, the
model shows that corporate governance adoption can reduce the likelihood of
violations. Ownership concentration has no significant impact on the violations in this
study. Phunnarungsi (2010) further investigates the cost imposed on the sample which
was used by Ananchotikul et al. (2010). Phunnarungsi (2010) finds that the firms were
19
This proportion is based on the data in this research. It is a ratio of non-Big 4 clients to the total number
of listed firms during 2003-2005.
84
facing an average abnormal return of -3.55% for day +1, and -4.57% for day 0 to +1.
There is no difference in this study between the abnormal return of high-governed firms
and the abnormal return of low-governed firms. The negative abnormal return in
Phunnarungsi (2010) and Tummanon (2005a) confirms that the participants in the
Thailand capital market negatively respond to the firm after they know that the firms
have violated the regulations.
Although there are some overlaps on the data and sample between this thesis and the
study of Ananchotikul et al. (2010), the research objectives and research designs are
different. Firstly, Ananchotikul et al. (2010) assessed the effect of voluntary adoption of
corporate governance in 2002 on the likelihood of subsequent violations in the years
2003-2006. Their corporate governance variables are nine out of the fifteen governance
principles suggested by the Stock Exchange of Thailand. On the other hand, this thesis
desires to discover the causes of accounting misstatements in Thailand. In the extent of
corporate governance practices, this research specifically focuses on the effectiveness of
external auditing and the weaknesses in the monitoring system when the chairman of
the board and the executive officer is the same individual. The potential determinants
are firm-level characteristics occurring to a firm in an individual year and driving the
firm to release misstated financial reports at the end of year. Secondly, the dependent
variable in Ananchotikul et al. (2010) covers a wide range of violations, while this
thesis focuses only on accounting violation. Ananchotikul et al. (2010) used a two-stage
Tobit estimation with instrumental variables to serve two research objectives, orderly:
to predict governance policy adoption by using firm-level characteristics, and to
examine an impact of the adoption on a likelihood of violations. Ananchotikul et al.
(2010) contribute to the literature on the determinants of corporate governance adoption
(Doidge et al. 2007) and show an effect of the adoption on a probability of subsequent
violations. This thesis uses logistic regression models to discover the determinants of
accounting misstatements in Thai firms. The thesis expects to contribute the significant
causes of GAAP violation in order to answer why accounting misstatements appear in
some firms and do not in other firms.
85
To summarise, there is evidence of an improvement of the quality of financial reporting
in Thailand after the Asian Financial Crisis of 1997. However, whether the
improvement is caused by corporate governance reforms is an ambiguous point of
debate. Controlling shareholders tend to be a key factor of both financial reporting and
corporate governance implementation. Under certain circumstances (e.g. high
ownership concentration, financial constraints and high expectation from capital
markets), the quality of financial reports tends to reduce. Even so, these circumstances
have rarely been tested, particularly when the quality of financial reports is measured by
an incidence of GAAP violation. This research will examine the determinants of
accounting misstatements in Thai listed firms. The consequences imposed on the
misstating firms are also of interest, yet these have not been investigated in prior
studies. The next subsection contains the contributions that the research expects to make
to the literature.
4.4 Expected Contributions from the Case of Thailand
The determinants of accounting misstatements have been previously been explored in
the literature, but most of the studies have been conducted in cases where the managers
are originators of the agency conflict. This thesis will shed light on the principal-
principal conflict. Thailand is selected to serve as a sample for two important reasons.
Firstly, Thailand is one of the East Asian countries where previous research has found
an expropriation of controlling shareholders (such as through poor firm performance).
Secondly, there have been some previous studies that have drawn attention to the cases
of accounting irregularities found by the SECT (Tummanon 2005a, b) and the effect of
corporate governance on the likelihood of violations (Ananchotikul et al. 2010). This
research project can further the prior work and contribute some insights to the literature.
The following areas are expected to benefit from the study into public companies in
Thailand:
1. Based on agency theory (Jensen and Meckling 1976; Watts and Zimmerman
1986) and a proper conceptual framework (Coffee 2006; Jiambalvo 1996;
86
Wahlen 2004), this thesis creates a systematic research design for the
determinants of accounting misstatements, which contain both incentives and
corporate governance mechanisms into one model. Prior research involving
Thailand has missed this (e.g. Pornupatham 2006). Although some studies (e.g.
Ananchotikul et al. 2010) have included both groups of factors, since the
incentives are not their research focus this means that the incentives of financial
statements preparers in Thailand (raised by Ball et al. 2003) have not been
thoroughly revealed.
2. A study into both the determinants and consequences of accounting
misstatements should provide a comprehensive understanding on the cost-
benefit trade-off for financial misreporting decision. The research into both
dimensions is limited in the literature (Dechow et al. 2010).
3. The evidence on how the ownership relates to the likelihood of accounting
misstatements is lacking in the literature. High ownership concentration presents
a high potential for agency conflict between controlling shareholders and outside
investors. The study into the ex post accounting misstatements will reveal the
incentives of the controlling shareholders in accounts manipulation. Moreover,
the study into the ownership of Thai firms will enlarge the firm-level database
for ownership in emerging market economies. The ownership information in
Thailand is normally restricted because they are available only in the Thai
language and often required supplemental documents in respect of shareholders
of private companies (Wiwattanakantang 2001). This thesis will gather the data
of the ownership and further track down to the shareholders of the private
companies in the pyramids structure. Extensive manual work will increase the
data for the interested researchers.
4. The financial structure that is primarily based on debt for Thai firms is a well-
qualified setting to verify the debt hypothesis and contribute to the literature on
how accounting quality plays a role in debt contracting, suggested by Armstrong
et al. (2010).
5. Previous studies have found that Big 4 auditors serve a corporate governance
role in safeguarding accounting information in East Asia (Fan and Wong 2005)
and Thailand (Boonlert-U-Thai and Kuntisook 2009; Pornupatham 2006). This
87
research will shed further light on the roles of Big 4 auditors in detecting
accounting misstatements. This thesis will also examine whether an audit firm
change signals a likelihood of an accounting misstatement in Thai firms.
6. In the Stock Exchange of Thailand, firms under rehabilitation are separately
categorised into the REHABCO sector. It is interesting to examine whether or
not the profitability requirement and the financial distress of these firms has an
impact on the financial reporting quality of these firms. The result will be of
potential interest to both investors and regulators.
4.5 Summary
The principal-principal conflict replaces the shareholder-agent conflict in the
environment of high ownership concentration. The principal-principal relationship is
argued to be firmly embedded in ultimate ownership structures of South-East Asian
firms, including Thailand (Claessens et al. 2000; Fan and Wong 2002; Young et al.
2008). The event of the Asian Financial Crisis in 1997 led to the revelation of weak
corporate governance and the opacity of financial reporting in the region, and the
ownership structure has been considered to be a primary cause of these problems.
Although corporate governance has been very much improved after the crisis, previous
research has not yet confirmed its outcome on a firm’s performance and financial
reporting quality. The reason for this engages two possible factors that remain
unchanged: the country’s legal enforcement and Thailand’s corporate ownership
structures that are still dominated by controlling shareholders.
In general, there is evidence showing that the family ownership in Thai firms has a
positive effect on a firm’s performance and informativeness of reported earnings
(Boonlert-U-Thai and Kuntisook 2009; Wiwattanakantang 2001). However, when there
is a divergence between cash flow and voting rights, then the possibility of taking
private benefits of control by controlling shareholders increases. The incentives of the
financial statement preparers (i.e. controlling shareholders) are more significant than
accounting standards in Thailand. Therefore, the incentives of controlling shareholders
88
in the financial reporting process are interesting to be explored. With regard to the
corporate governance, the involvement of the controlling shareholders in the
management and monitoring systems weakens the effectiveness and independency of
the corporate governance mechanisms. The roles of external monitors, such as auditors,
become more outstanding in the monitoring systems, but since the controlling
shareholders have a high proportion of voting rights, they might enable to govern the
monitoring role of the auditing, such as change an audit firm. Therefore, in the
prevalence of controlling shareholders it likely appears that the controlling shareholders
have an impact on both corporate governance mechanisms and financing reporting
process. It is thus interesting to examine how ownership, controlling managers’
incentives and corporate governance are associated with the occurrence of accounting
misstatements.
This thesis contains studies of the determinants and consequences of accounting
misstatements in Thailand. The first objective of this research is to continue exploring
the determinants of accounting misstatements in the context of the principal-principal
conflict. These insights will benefit outside investors so that they can be aware of, and
have more confidence in using, financial reports of Thai firms. In addition, regulators
will be able to apprehend the underlying causes of financial misreporting in Thai firms,
and with this knowledge, they will enable to solve the problems effectively. The second
objective of this research is to assess the economic consequences imposed to the
misstating firms after accounting misstatements are revealed, with particular focus on
subsequent external financing capability. The capital structure of debt orientation in
Thai firms provides fruitful institutional setting for determining the creditors’ and
minority shareholders’ responses to the low quality of financial reports. The results can
contribute significantly to the literature on how accounting quality plays a role in debt
contracting and outside investors’ decision-making in an emerging market.
Taking together with the literature on the causes and consequences of accounting
misstatements and on the characteristics of Thai firms, this research has established a set
of empirical predictions for the determinants and economic consequences of accounting
misstatements in Thailand. These are presented in the next chapter.
89
CHAPTER FIVE
HYPOTHESIS DEVELOPMENT AND RESEARCH
METHODOLOGY
5.1 Introduction
In previous chapters, this thesis reviewed the theoretical background and the empirical
evidence on the causes and consequences of accounting misstatements (Chapters 2 and
3) as well as the institutional settings and evidence on financial reporting quality in
Thailand (Chapter 4). Based on this evidence, it can be seen that there is a limitation in
the literature on the causes and consequences of accounting misstatements in
concentrated ownership systems. This research project aims to address this issue. In so
doing, Thai firms are sampled because their characteristics are in accordance with firms
in a concentrated ownership system and there is evidence showing a conflict of interests
between controlling shareholders and outside investors in the country. Based on
theoretical justifications drawn from previous studies and the rationale of this study, a
conceptual framework showing relationships of the relevant factors and empirical
predictions for the case of Thailand are developed and presented in this chapter. A
rigorous research design is then constructed and discussed in this chapter. The data and
analysis will be presented in the following two chapters.
The next section presents the study’s conceptual framework. Then, Section Three
details empirical predictions. Section Four discusses how the research methodology was
prepared. Section Five demonstrates the sample and data collection and Section Six
considers the statistical tools for data analysis.
5.2 Conceptual Framework
The timeline of an occurrence of accounting misstatements and the relevant factors of
the occurrence (Bowen et al. 2008; Jiambalvo 1996; Wahlen 2004) that were previously
90
reviewed in the preceding chapters are integrated into a conceptual framework
employed by this research (see Figure 5.1).
Figure 5.1: Conceptual Framework of Accounting Misstatements
Entire Framework
Part I: Determinants of Causes
Accounting misstatement=f(ownership, incentives, monitoring, control variables)
Independent Variable Dependent Variable
Part II: Consequences
Financing ability = f(accounting misstatement, control variables)
Independent Variable Dependent Variable
Overall, the timeline shows a set of antecedent circumstances that, in combination,
create a fertile ground for accounting misstatements (Wahlen 2004, p. 183). Then after
the accounting misstatements are revealed the company may be penalised by lenders
and minority shareholders. The subsequent financing activities of misstating firms are
External Financing
Ability Incentives
Accounting
Misstatements
Ownership
tructure
Monitoring
CAUSES CONSEQUENCES
External Financing
Ability
Incentives Accounting
Misstatements
Ownership
structure
Monitoring
Accounting
Misstatements
91
therefore focused on in this thesis. The research project thus has two main parts of the
analysis.
The first part is an examination in the determinants of accounting misstatements in
Thailand. The body of literature suggests the important influences of firms/managers’
incentives and corporate governance mechanisms on the likelihood of accounting
misstatements (e.g. Bowen et al. 2008; Jiambalvo 1996). In addition, the influence of
ownership structure is also of interest because the ownership structure is an origin of the
agency conflicts (Jensen and Meckling 1976; Young et al. 2008) and it is correlated
with the corporate governance policies (Bebchuk and Hamdani 2009). Leuz et al.
(2003) also raised the question that there might be a relationship between ownership and
accounts manipulation at firm-level. As a result, the ownership structure, controlling
shareholders’ incentives, and corporate governance mechanisms are proposed to be
significant determinants of accounting misstatements in Thailand. The incidence of
accounting misstatements is the dependent variable in this stage.
The second part of the study will assess the economic consequences that have occurred
to the misstating firms after the misstatements are revealed. In this stage, the occurrence
of accounting misstatements is one independent variable affecting the subsequent
financing activities of the misstating firms. This study considers the consequence of this
after the end of the year of the announcement date.
Linked from the relationships of the variables that have been described in this section, a
set of hypotheses is developed and discussed in the next section.
5.3 Empirical Predictions
Based on the research questions (Chapter 1, Section 1.2) and the body of literature that
has been reviewed in Chapters 2 to 4, the researcher has developed a set of hypotheses
for the determinants and economic consequences of an accounting misstatement for the
Thai sample. They are presented as part of the group of determinants as follows.
92
5.3.1 Ownership
There are three attributes of ownership that prior studies have tested to determine
whether or not they have an impact on the quality of financial reporting, they are
ownership concentration, owner identity, and the divergence between voting rights and
cash-flow rights (i.e. the existence of pyramids and cross-holdings).
Gaining effective control of a corporation enables controlling shareholders to control
the corporate operations, including the financial reporting policies. There are two
perspectives of the influences of controlling shareholders on the quality of financial
reports, which are: entrenchment effects and alignment effects (Fan and Wong 2002;
Morck et al. 2005). On one hand, the controlling shareholders are less inclined to
provide high quality of financial reports and there are three possibilities for this scenario
that the prior studies discussed. Firstly, controlling shareholders distort accounting
numbers to bury the wealth effects of their expropriation activities. Secondly, their
expropriation can be anticipated by outside investors who already discount the stock
prices or charge high interest rates, so the benefit that the firms can earn if the firms
invest more is deemed to be only slight. Thirdly, the number of transactions with
outside parties is likely to be smaller than that of dispersed ownership firms, so that a
cost-benefit trade-off limits the information disclosures. Empirical evidence by Fan and
Wong (2002) supports this scenario: there is a negative relationship between the
pyramidal structure and the informativeness of earnings in East Asian firms including
Thai firms. On the other hand, since the expropriation is predictable, controlling
shareholders want to assure outside investors that they have an incentive to align their
interests with that of outsiders and, therefore, an alignment effect occurs. Controlling
shareholders commit to provide high quality financial reports. Boonlert-U-Thai and
Kuntisook (2009) support this alignment viewpoint. They find a positive relationship
between the ownership concentration and informativeness of earnings. Whether the
controlling shareholders use financial reporting as a commitment mechanism or if they
use it to facilitate greater extraction of private benefits is still an open question
(Armstrong et al. 2010) and the evidence on the association between ownership
93
structure and the quality of financial reports in Thailand is also inconclusive. When
assessed by discretionary accruals, no significant relationship has been found between
the ownership concentration and earnings management (Pornupatham 2006). There has
never been a study into the relationship between the ownership and accounting
misstatements in Thailand case. In China, the likelihood of fraud increases when the
ownership is concentrated in the government’s hands (Firth et al. 2011). Since accounts
manipulation may signal a wealth transfer (Stolowy and Breton 2004), the group that
earns the benefit of an accounts manipulation in concentrated ownership systems is
more likely to be controlling shareholders. The interviewees in Pornupatham (2006)
stated that local audit firms are less resistant to the management’s discretion,
particularly when firms are highly concentrated. Therefore, this research predicts that
when a firm misleads financial statement users, high ownership concentration is more
likely to be more accommodating of the opportunism of controlling shareholders.
Therefore, the first empirical prediction of this research is that:
Hypothesis 1.1: There is a positive relationship between ownership
concentration and accounting misstatements.20
In addition, the ownership arrangement of pyramids and cross-holdings in East Asian
and Thai firms creates divergence in the voting rights and cash-flow rights, and it
increases the possibility of expropriation by controlling shareholders (Morck et al.
2005). Family ownership also lowers the quality of financial reporting, which can be
measured by a higher cost of debt (Boubakri and Ghouma 2010). In Thailand 70% of
listed companies are owned by a single family (Wiwattanakantang 2001) and
approximately 13.5%-17.4% of listed companies have pyramidal and cross-holdings
ownership structures (Claessens et al. 2000; Wiwattanakantang 2001). Although the
proportion of firms having a complex structure in Thailand is smaller than that of other
firms in the same region (Claessens et al. 2000), this structure rarely exists in Western
firms (La Porta et al. 1999). Therefore, it is interesting to examine whether the complex
ownership structure as well as the family ownership are associated with accounting
misstatements. As accounting misstatements signal a wealth transfer (Stolowy and
20
Accounting misstatements here mean the occurrence and not the magnitude.
94
Breton 2004), so the existences of group affiliation and family ownership are likely to
be positively associated with the likelihood of accounting misstatements. Consequently,
two hypotheses are:
Hypothesis 1.2: There is a positive relationship between family ownership and
accounting misstatements.
Hypothesis 1.3: There is a positive relationship between the existence of a
pyramid structure and accounting misstatements.
5.3.2 Incentives
In the context of the principal-principal conflict, financial motives are expected to be an
important factor for a decision to misstate financial reports (the arguments were
developed in Chapter 2). Prior studies in other countries (i.e. the U.S., the U.K., Malaysia
and China) have found that firms are more likely to misstate financial reports because
they wish to minimise their cost of capital (e.g. Dechow et al. 2011; Dechow et al. 1996;
Efendi et al. 2007; Skousen et al. 2008), they are highly constrained by debt covenants
(Firth et al. 2011), and they are distressed and face the possibility of bankruptcy (e.g.
Hasnan et al. 2008). In Thailand firms are financed by debt more than equity (Alba et al.
2003); consequently, Thai firms are likely to be constrained by debt covenants. A debt
covenant violation is costly (Roberts and Sufi 2009), and so the likelihood that a firm
will misstate financial reports increases when they are close to a debt covenant
violation.21
Therefore, an alternative hypothesis for the debt hypothesis is that:
Hypothesis 2.1: There is a positive relationship between the leverage ratio and
accounting misstatements.
21
As discussed in Chapter 2, this research acknowledges a limitation of the leverage ratio to proxy a
violation of debt covenants (Dichev and Skinner 2002). The assessment of debt hypothesis refers to the
closeness to debt covenant violation rather than technical defaults because the data on debt defaults are
unavailable for the Thai sample.
95
In terms of the incentive to minimise the cost of capital, the likelihood of accounting
misstatements increases in the year when firms issue shares, this is an ex post measure of
financing need (e.g. Dechow et al. 2011; Efendi et al. 2007). It also increases when firms
have negative free cash flow, which is an ex ante measure of financing need (e.g.
Dechow et al. 1996; Skousen et al. 2008). There is no record of either situation being
influential over earnings manipulation in Thailand. Nonetheless, since the sample of this
research is listed firms, it is possible for both incentives to occur in the Thai sample and
the direction of the relationship is expected to be similar to that found in the previous
studies. Therefore, the two empirical predictions for the Thai sample are:
Hypothesis 2.2: There is a positive relationship between share issuances and
accounting misstatements.
Hypothesis 2.3: There is a positive relationship between negative free cash
flow and accounting misstatements.
A survey by Pornupatham (2006) suggests that Thai firms are more likely to manipulate
earnings in order to maintain market expectations. Empirical results from prior studies
(e.g. Dechow et al. 2011; Ettredge et al. 2010) also show that firms are more likely to
misstate financial reports when their shares have a high market-to-book ratio. This may
be because the high value of a firm indicates that the capital market participants have
high expectations for the firm’s growth and incoming cash flow. When the firm’s real
financial status is less than their investor’s expectations, then it is more likely that the
firms will misstate financial reports because the cost of not reaching the benchmark
seems too high (Graham et al. 2005). Consequently, there is also likely to be a positive
relationship between capital market pressures and the likelihood of accounting
misstatements in Thailand.22
22
This research recognises that the capital market pressure can be assessed by such measures as analyst
forecasts (e.g. Perols 2011; Perols and Lougee 2011). However, the data on analyst forecasts are
missing more than a half of the sampled firms (i.e. the researcher found 142 firm-years are available on
the I/B/E/S), while prior studies (e.g. Ciccone and Etebari 2004) found in the same source for 192 firms
out of 520 firms listed on the Stock Exchange of Thailand. Therefore, the research uses the market-to-
book ratio for this hypothesis.
96
Hypothesis 2.4: There is a positive relationship between capital market
pressure and accounting misstatements.
The significance of the regulation driver, such as the profitability regulation in Chen et
al. (2001), is also important in the Thai sample. Thailand has the regulation of
rehabilitation (as detailed in Chapters 2 and 4), and the firms that were subject to the
accounting enforcement actions by the Securities and Exchange Commission, Thailand
(SECT) were most often found to be in the REHABCO sector (Tummanon 2005b).
Therefore, there may be a positive relationship between the rehabilitation status and the
likelihood of accounting misstatements. However, firms in rehabilitation can be
specially scrutinised by creditors because of their incapability of making repayments. In
addition, these firms’ financial reports face more scrutiny by the SECT, particularly in
the year when the firms are permitted to resume a normal status. On the other hand,
extra monitoring might discipline firms in rehabilitation, meaning the likelihood of the
decision to misstate financial reports can be mitigated. Therefore, the prediction is
formed as a two-way hypothesis:
Hypothesis 2.5: There is a relationship between rehabilitation status and
accounting misstatements.
5.3.3 Corporate Governance Mechanisms
As set out in Chapter 2 above, monitoring activities are an important factor (besides the
relationship between incentives and accounting misstatements) constraining the
likelihood of accounting misstatements. External auditors are fully responsible for
monitoring the quality of financial reports and audit quality should influence the
occurrence of accounting misstatements. Empirical research has tested many
dimensions of audit quality (i.e. audit firm, audit firm change, auditor change, and
audit opinion), though empirically, many are not statistically associated with the
occurrence of accounting misstatements, particularly in the U.S. samples (e.g. Skousen
et al. 2008; Skousen and Wright 2006). Nonetheless, Big 4 auditors have been shown
to reduce the likelihood defective accounting items in the U.K. (Peasnell et al. 2001)
97
and Canadian (Smaili and Labelle 2009) samples. In Asia, auditors play an important
role in the monitoring process (Fan and Wong 2005). In Thailand, the quality of
financial reports is higher for Big 4 clients than non-Big 4 clients when measured by
discretionary accruals (Pornupatham 2006) and accounting conservatism (Boonlert-U-
Thai and Kuntisook 2009). Three-fourths of accounting allegations found by the SECT
were audited by local audit firms (Tummanon 2005b). Therefore, the Big 4 auditors
may be able to protect against and detect accounting misstatements before financial
reports are released. Accordingly, a negative relationship between the use of a Big 4
auditor and the occurrence of accounting misstatements in Thai firms is expected.
Hypothesis 3.1: There is a negative relationship between the use of a Big 4
auditor and accounting misstatements.
Additionally, in concentrated ownership systems it is likely that the controlling
shareholders dominate the monitoring mechanisms (Salacuse 2006). They can also set
the environment of the monitoring process, either to govern the monitors or to be
governed by the monitors (Cohen et al. 2002). The influence of management in making
an auditor change appears to increase when the CEO is dominant on the board (Cohen
et al. 2010). In Thailand, 88% of 546 listed companies have CEOs serving as chairmen
of the board (Kouwenberg 2010) and it is possible that controlling shareholders change
their audit firm in misstatement years because they want to avoid being detected. It is
consequently interesting to investigate whether there is a relation between an audit firm
change and the likelihood of an accounting misstatement. Elsewhere, a higher
proportion of audit firm change has been found in fraudulent firms than in non-
fraudulent firms (Summers and Sweeney 1998). In addition, the newly appointed
auditor is new to the firm. He or she has a higher risk of failing to detect the accounting
misstatements and, therefore, a positive relationship between the likelihood of
accounting misstatement and short audit tenure has been found (e.g. Carcello and Nagy
2004; Stanley and Todd DeZoort 2007). In contrast, a newly appointed auditor may not
be aligned with the controlling shareholders; he or she may perceive this as a risk and
be more aware of the accounting misstatements. In this case, the auditor is more likely
98
to detect accounting irregularities during the audit process and the appearance of
accounting misstatements (i.e. when financial reports go public) consequently
decreases. For instance, more than one third of frauds have been found to be detected in
the first two years of an auditor’s tenure (Loebbecke et al. 1989). This second
perspective will result in a negative relationship between an auditor change and the
likelihood of accounting misstatements and will be in line with, for example, a negative
association between audit tenure and earnings management in Taiwanese firms (Chen et
al. 2008; Chi and Huang 2005). On the other hand, in the U.S. sample of Myers et al.
(2005), there is no significant relationship found between the length of audit tenure and
restatement cases. Because the effect of an auditor change on the likelihood of
accounting misstatements has been found in both directions, the prediction is set as a
two-way hypothesis.
Hypothesis 3.2: There is a relationship between an audit firm change and
accounting misstatements.
Additionally, because the point of an audit firm change is still an open issue in the
literature (as explained above), this thesis will further examine how the relationship
occurs (i.e. whether the controlling shareholders govern, or are governed by, the
auditor). This research will test the relationship between the likelihood of accounting
misstatements and the sorts of audit firm change (i.e. lateral switch (e.g. from Big 4 to
Big 4), downgrade (from Big 4 to non-Big 4), and upgrade (from non-Big 4 to Big 4)).
The types of the audit switch used here follow the categorisation of Lennox and Pittman
(2010). The empirical predictions for the types of audit switch are detailed later in
Chapter 6.
In addition to the effect of the external monitors, prior studies have found an effect of
internal monitoring activities on the likelihood of accounting misstatements. One
measure of internal monitoring activities which has been found to be significant in
monitoring financial reporting quality is the duality position (Larcker et al. 2007); i.e.,
where a CEO is also chairman of the board. Even in dispersed ownership firms, this
99
duality position exists and it increases the likelihood of accounting misstatements (e.g.
Dechow et al. 1996; Efendi et al. 2007; Peasnell et al. 2001; Skousen et al. 2008;
Skousen and Wright 2006). In Thailand, this duality position appears in almost 90% of
listed companies (Kouwenberg 2010) and, therefore, it is also expected that the duality
position will be a significant determinant of the likelihood of accounting misstatements
in Thailand.
Hypothesis 3.3: There is a positive relationship between duality position and
accounting misstatements.
5.3.4 Economic Consequences of Accounting Misstatements
Since an occurrence of accounting misstatements may signal a wealth transfer and the
low quality of the firm’s financial reporting process (Stolowy and Breton 2004), an
announcement of an accounting misstatement is hypothesised to negatively affect
financing activities of misstating firms. Like the empirical function of the post-stage in
the study of Bowen et al. (2008), if an accounting misstatement is a manifestation of the
opportunism that is stronger than the capability of monitoring then there should be a
consequent loss in stakeholder wealth which can be used as evidence of the abuse. As
far as external financing activities are concerned, previous studies have found that the
announcement of accounting misstatements has an adverse effect on bank loan
contracting (Graham et al. 2008) and financing capability (Chen et al. 2009) for
misstating firms. Accordingly, an ability of misstating firms to get new loans tends to be
restricted in the post-announcement period. Similarly, the announcement of accounting
misstatements reduces the credibility of the firms and the equity holders react
negatively, share prices fall (e.g. Dechow et al. 1996; Palmrose et al. 2004) and equity
investors require a higher rate of return (Hribar and Jenkins 2004). In Thailand the share
prices of misstating firms also fall significantly after the revelation of accounting errors
(Tummanon 2005a). Therefore, if misstating firms in Thailand issue new shares after
the announcement of accounting misstatements then the proceeds from the stock
issuance are inclined to be lower. Collectively, an announcement of accounting
misstatements is likely to affect both the share and debt choices. Therefore, when
100
measured by the flow of capital, the external financing ability of misstating firms is
likely to be affected by the announcement of accounting misstatements in the post-
announcement period. The hypothesis is that:
Hypothesis 4: There is a negative relationship between an announcement of
accounting misstatements and subsequent external financing activities.
This research project follows the methodology of the study by Roberts and Sufi (2009),
who examined the amount of funds that the firms earn after firms violated debt
covenants (which is one example of the incentive conflict between firms and creditors).
This thesis determines the dynamics of the amount of funds shown in the cash flow
statements during the first two fiscal years (i.e. year t+1 and t+2) after the revelation of
misreporting. The focused period for the event of accounting misstatements is shown in
Figure 5.2 below.
Figure 5.2: Timeline for the Period of Misstatements
Pre-misstatement period Misstatement
Year(s)
Announcement
Post-misstatement period
year t-2 year t-1 year t year t+1 year t+2
The misstatement year (year t) ranges from the misstatement fiscal years to the year
when accounting misstatements are revealed. The research interest of an economic
consequence is drawn upon the post-announcement period (year t+1 and t+2). Prior
studies have also investigated the consequence of misstatements in the first two-year
period after they are revealed (e.g. Chen et al. 2009). One possible reason for this
involves the disclosure of the restated items in comparative financial statements. The
restated items in year t will last appear as the beginning balance of fiscal year t+1, when
compared with the financial statements of year t+2.
101
This section has illustrated the empirical predictions for the determinants and economic
consequences of accounting misstatements in Thai firms. The next section will discuss
the research methodology that will be used to test the empirical predictions.
5.4 The Research Methodology
To achieve the research objectives and address the hypotheses above, a detailed
research process was planned. The research process can be viewed as a series of linked
stages in a linear manner (Saunders et al. 2007). After identifying the research questions
(as presented in Chapter 1) and critically reviewing the literature (Chapters 2 to 4), the
research hypotheses were developed (as shown in the previous section). The following
step is to construct a rigorous and appropriate research design for the testing of the
hypotheses, which will be described in this section.
A comprehensive understanding of the ‘research onion’ (Saunders et al. 2007) (see
Figure 5.3) helped clarify the researcher’s position in the development of knowledge for
this research project.
Figure 5.3: The Research Onion
Positivism
Survey
Case Study
Grounded
Theory
Ethnography
Archival
Experiment
Cross-sectional
Longitudinal
Data collection
and data analysis
Mono method
Mixed-method
Multi-method
Interpretivism
Pragmatism
Realism
Philosophies
Approaches
Strategies
Choices
Time horizon
Techniques and
procedures
Inductive
Deductive
Source: Saunders et al. (2007, p. 132).
102
The principles of positivism and deductive approach were applied in this research. The
research technique which is used is an archival research strategy, which uses
administrative records (i.e. enforcement actions by the SECT) and documents (i.e.
financial reports) as the principal source of data. This research used a single data
collection technique from secondary data sources (which is called mono method) and
the data were observed for a particular phenomenon (i.e. accounting misstatements) at a
particular time (i.e. 2001 to 2009), which is considered to be a cross-sectional study
(Wooldridge 2006). The justification for these attributes is detailed as follows.
5.4.1 Research Philosophy
“Mainstream accounting research is dominated by a belief in physical realism-the claim
that there is a world of objective reality that exists independently of human beings and
that has a determinate nature or essence that is knowable” (Chua 1986, p. 606). Jensen
(1993) asserts that economists and management scholars in the 1990s were developing
positive theories of the world to understand how the firm, capital providers, and control
systems work and how they interact with the other control forces (e.g. product markets,
legal and regulatory systems, and the capital markets). The positive theories of cause
and effect relationships allow an understanding of the subject’s existence. The principal-
agent theory by Jensen and Meckling (1976) is one of the positive theories attempting to
discover a knowable, objective reality of a firm (Chua 1986). Accounting research that
is based on agency theory has stimulated an understanding into the role of financial
accounting in contractual relationships between managers and shareholders (Ryan et al.
2002, p. 107).
The principles of positivism, mainly guided by Chua (1986) and Guba and Lincoln
(1994), can be summarised as follows.
1. The ontological assumption, which involves the belief of reality. The objects
already exist and they are independent of the researchers’ perception. There are
general laws or theories that govern the world, and these need to be tested so
that we can understand the world (Creswell, 2009).
103
2. The epistemological assumption, which concerns the relationship between the
researchers and what is being researched. Positivists observe the event
independently and gather data, evidence, and rational considerations to shape
knowledge.
3. The methodological assumption, which entails how researchers discover and
validate reality. Researchers use observations to verify the theory as
representative of general laws. A deductive approach can be used here which
derives the hypotheses from theories and then formally tests these via the
collected observations.
Researchers in the area of the principal-agent literature believe that the reality of
accounting misstatements exists (as theoretically claimed by the agency theory and
empirically supported by prior empirical evidence) and waits for researchers to discover
‘the truth’ about them. The discoveries of the determinants and economic consequences
of accounting misstatements in concentrated ownership systems (the research objectives
of this thesis) will enable the researcher to generalise the truth of the agency theory in
concentrated ownership systems. Based on the literature review, previous principal-
agent studies were primarily conducted under the positivist paradigm and used a
deductive approach, which is in accordance with the approach of the positivist paradigm
(as stated in the methodology assumption above). This study maintains the deductive
approach and its details are presented in the next subsection.
5.4.2 Research Approach
This research project implements a deductive approach. The process of deduction (as
explained in Bryman and Bell 2007, pp. 7-14) is that a researcher deduces hypotheses
on the basis of what is known about a particular domain (i.e. the agency theory and
opportunistic financial reporting in the context of this research) and then translate them
into operational terms. This translation process can be referred to as operationalisation
(Bryman and Bell 2007); in other words, to devise measures of the concept that the
researcher is interested in. Data are then collected and analysed in order to test the
hypotheses. The researcher’s findings are finally fed back into the stock of the
knowledge (or theory in the domain). All of these procedures are similar to what
104
Bryman (1988) explained for the quantitative research process and the structure of these
manners (see Figure 5.4).
Source: Bryman (1988, p. 20).
The research process of this thesis is in accordance with the structure suggested by
Bryman (1988) and the relevant chapter(s) and section(s) for each step are presented in
the blankets in Figure 5.4. Out of the five phrases, the first two stages have already
performed and described in the preceding chapters. The literature was reviewed in
Theory and Empirical
Evidence
(Chapters 2 to 4)
Hypothesis
(Chapter 5, Section 5.3)
Deduction
Data Processing
Operationalisation
Observations/
Data Collection
(Chapter 5, Section 5.5)
Data Analysis
(Chapters 6 and 7)
Findings
(Chapter 8, Section 8.2)
Interpretation
Main Phases Intervening Processes
(Chapter 8, Section 8.3)
Induction
Figure 5.4: The Logical Structure of the Quantitative Research Process
105
Chapters 2 to 4 that pioneering research has applied the agency theory (Jensen and
Meckling 1976) in explaining an occurrence of accounting misstatements.23
Many
rational insights of the determinants of financial misreporting have been introduced
from these positive theories (e.g. Dechow et al. 1996; Efendi et al. 2007). The research
is consistent with prior studies in considering that the agency theory can be used to
explain an occurrence of accounting misstatements in concentrated ownership systems.
A taxonomy of theory of the firm and agency theory (Jensen and Meckling 1976) is thus
maintained and it led the research in developing the hypotheses (as previously shown in
Section 5.3). Similar to the previous quantitative studies, the research knowledge will be
derived in a form of hypothetico-deductive account (Chua 1986).
The next three phrases of the research process (shown in Figure 5.4) will be performed
as follows. Firstly, the research will translate the research’s interests into operational
terms; it is the operationalisation process in Figure 5.4. This process will be explained
in the next paragraph and it also includes the research method for data collection
(Section 5.4.3) and the specification of the data (Section 5.5). Then, the analyses into
the data are performed. They are reported in Chapters 6 and 7. After that, the research
findings are concluded in Section 8.2, Chapter 8. Lastly the research findings will be
related back to the theories (Section 8.3) in order to validate and/or extend the agency
theory in the setting of concentrated ownership systems, referred as the term ‘induction’
in Figure 5.4. The next paragraph discusses the process of operationalisation.
According to the theory of a firm and agency theory (Jensen and Meckling 1976) a set
of operational terms (interests of the research) was devised as follows. It is assumed in
agency theory that all units are profit maximisers (the utility-maximisation assumption
of neoclassical economic theory). In concentrated ownership firms, controlling
shareholders hold a majority of control rights, and so they are rational profit maximisers
by maximising their property rights (such as by reducing monitoring costs or
expropriating others’ interests). Reduced monitoring costs (e.g. having only compulsory
corporate governance, hiring affiliations rather than professional managers) can lead to
23
The discussion of the determinants of the causes are emphasised in Chapter 2, while the discussion on
the consequences are in Chapter 3. Chapter 4 engages the institutional settings for the Thai sample.
106
ineffective governance mechanisms, and this eventually lowers the quality of financial
reports. As a result, the likelihood of an accounting misstatement increases. On the
other hand, controlling shareholders may extract private benefits, which cost minority
shareholders and creditors; for example, controlling shareholders manipulate accounts
to maintain share performance, minimise the cost of incoming capital, and avoid debt
covenant violations. Observations on the ex post accounting misstatements could help
us to understand the causes of accounting misstatements in these concentrated
ownership firms. Therefore, the ex post accounting misstatement cases form the
research sample and the controlling shareholders’ incentives and corporate governance
mechanisms are two of the three groups of the prospective determinants of accounting
misstatements in concentrated ownership firms. These entities are included in the
analysis of the determinants of accounting misstatements (see the conceptual
framework, Figure 5.1, Part I).
In addition, the utility-maximisation assumption for capital providers is also tested.
Firms are contracted with capital providers (i.e. minority shareholders and lenders), and
the capital providers are also assumed to be profit maximisers. In the contracting
process, the investors assess the integrity of the firms’ financial reporting process (e.g.
corporate inherent risks and corporate governance policies) and then they require a
certain rate of return that maximises their investment returns. Financial reports are one
traditional monitoring mechanism used by the capital providers to observe firms’
performance and economic status. When they perceive that the financial reports are
misstated, the capital providers rationally revise the existing contracts and circumspect
their future investments. Consequently, the amount of funds provided by the capital
providers after the announcement of accounting misstatements may be reduced. An
investigation into the dynamics of the capital of misstating firms, particularly in the
post-announcement period, is thus another aspect of interest to the present research (see
Figure 5.1, Part II).
Nevertheless, it could be argued that since all units are profit maximisers then there is
no reason why the other group of firms that do not misstate financial reports (including
their controlling shareholders) pursues the interests of stakeholders instead of
107
maximising their own returns. This group is, therefore, taken into account as a control
group in the analysis so that an insight on the firms with accounting misstatements will
reliably appear.
A conclusion for this subsection is that this research project is conducted as quantitative
research under a deductive approach. The hypotheses and operational terms have
already been specified. The next subsection will discuss the research method for data
collection.
5.4.3 Research Method
Because financial misreporting is a form of ethical issue, some of which is illegal, to
observe its occurrence through disclosures in secondary data sources (i.e. financial
reports and the documents filed to stock exchanges and governmental agencies) is
inclined to be feasible and less biased than to collect primary data (such as from
interview and questionnaire methods). In sensitive topics, the informant may either
transmit the information in a biased manner or withhold it entirely and that an interview
barely provides real answers (Christensen 1992). Some previous studies in the Thai
context (e.g. Pornupatham 2006) used an interview approach; however, their
interviewees were auditors and securities regulators, not the perpetrators. Access to
fieldwork is also an unlikely method for observing the financial misreporting process.
Questionnaires may be a possible choice, but the respondents in developing countries
(including Thailand) pay less attention to research and do not consider it a worthwhile
endeavour (Sjorberg 1967). In addition, since the interest is in Thailand while this
research is written in English, many rounds of translating between Thai and English
languages may distort the data. To trade-off between the costs and benefits (including
the reliability of data), use of data from secondary sources is preferred.
In terms of the data analysis, quantitative methods (i.e. statistical techniques) are
deemed most suitable for use in this research project. As shown by the conceptual
framework (Section 5.2), this research will examine the cause-effect relationships of the
variables. Creswell (2009) suggests that quantitative approaches suits problems which
108
call for identification factors that influence an outcome. In addition, the discovered
cause-effect linkage can lead to a prediction of corporate financial reporting in
subsequent periods. Quantitative methods allow generalisability (Chua 1986), and so
the research findings from the Thai sample can be of benefit to our understanding of the
phenomenon of accounting misstatements in other countries that have similar
institutional settings.
Finally, as Firth et al. (2011) point out, several studies use data which is drawn from
U.S. firms and, consequently, this means that it can be difficult to generalise the
findings from the previous research because there are different historical, legal, and
institutional backgrounds between countries. According to Beneish (1997), a possibility
of GAAP violation is a function of three factors: an incentive to do (i.e. managers’
incentives), an ability to do (i.e. exploitation of principal-based accounting standards),
and a probability of detecting GAAP violation (i.e. the effectiveness of monitoring
systems). Presently, many countries, particularly developing economies, adopt or
modify the governance practices from the developed economies (Young et al. 2008). In
addition, European and Asian countries are now using the International Financing
Reporting Standards (Ball 2006). Accordingly, the principles of accounting standards
and corporate governance practices are currently more similar. Therefore, the likelihood
of GAAP violation now is more likely to depend on the financial statements preparers’
incentives and the environment they set for the misrepresentation, which is in line with
Jiambalvo’s (1996) framework. These two features are firm-level characteristics and as
such the methodology of the firm-level research in the U.S. and the U.K. can be used as
a point of reference for a study in the developing economy sample, but the agency
theory is applied and focused in the type of principal-principal conflict (Firth et al.
2011). The research findings are considered to be the discovery (or an application) of
the truth of the positive agency theory in the developing economies.
In summary, this research is based on the positivist paradigm and it applies a deductive
approach and quantitative strategy. Data will be independently collected from secondary
sources. The next section presents the procedures for the sample and data collection,
and the last section discusses the statistical tools for data analysis.
109
5.5 Sample and Data Collection
After the research approach and research method were specified (as detailed in the
previous section), this section sets out the data collection procedures.
5.5.1 Sample Selection
The initial sample used in this research project is misstated financial reports of firms
listed on the Stock Exchange of Thailand. The sample was gathered from two sources.
The first source is the announcements of the Securities and Exchange Commission,
Thailand (SECT) on its website. These announcements are close to the Accounting and
Auditing Enforcement Releases that have been used in previous U.S. studies (e.g.
Dechow et al. 1996; Feroz et al. 1991). However, in addition to accounting issues the
SECT announcements cover all ranges of topics. The SECT announcements are
presented on its website for the last ten years. This research project initially selected
2000 as the start year for the sample construction; however, the data for ownership,
which were provided in an electronics database of Ministry of Commerce, Thailand, are
only available since 2001; therefore the start date is 2001 and the end date is 2009.
The second source for companies with accounting misstatements used in this research
project is the financial restatements published in the Thomson One Banker database. All
restated financial reports of non-financial firms during the year of 2001 to 2009 were
searched in the database and only the restatements due to prior period errors are of
interest (e.g. an error due to mathematical problem, or misapplication of GAAP).24
Some of the restatements shown in the database were initiated by the SECT, so they are
overlapped with those in the first source.
24
It is possible that the misstatements may be detected during the following year, such as during the
auditor’s review on quarterly financial reports, but the study takes it as occurring at the end of such
year.
110
This research then compares the sampled financial reports with a control group. The
control group comprises the financial reports of the non-financial companies listed on
the Stock Exchange of Thailand. They are subject neither to the SECT enforcement
actions, nor restated due to a prior period accounting error. The firms that restate their
financial reports due to other reasons (such as retroactive restatements because of an
accounting policy change or in a compliance with a new Thai Accounting Standard) are
included in the control group. The finance sector is excluded from this study because
financial institutions are subject to a more stringent regulatory framework required by
Bank of Thailand (Chuanrommanee and Swierczek 2007; Montreevat 2007) and have
different accounting items which limit comparability. Additionally, as the accounting
items engage economical substances, which may vary across time, the research limits
the control firms only to the firms having fiscal years ending on 31 December in order
to improve the comparability between the sample and control group.25
For a number of reasons, the control group in this thesis covers all non-financial listed
firms rather than a matched control group (which has been used in many previous
studies). Firstly, a matched sample causes a choice-based matched-sample bias, which
results in a bias of coefficient (Cram et al. 2009; Zmijewski 1984). Secondly, the Stock
Exchange of Thailand lists only 520 companies in seven industries. To find a qualified
matched sample can be difficult and this might affect the research results. On the other
hand, the small size of the capital market made the alternative of non-matched sample
design more possible. Thirdly, because the data of Thai firms are still limited, the data
collection on all listed firms can increase the data availability (which is of benefit to
further research). After trading-off the costs and benefits, a choice-based non-matched
sample is preferable: the treatment group is selected on the basis of outcome (i.e. having
an accounting misstatement) and the control group is selected from firms not having the
same outcome (i.e. not having an accounting misstatement).26
This alternative is also
25
No misstatement observations were lost due to this. 26
The term ‘choice-based’ refers to a sample selection process in which the outcomes to be explained in
the analysis affect whether observations are selected. The outcome (i.e. choice) is the dependent
variable (i.e. the incidence of accounting misstatements). The term ‘non-matched’ refers to a selection
for comparison sample, or control group. This research used a non-matched sample, which comprises
all non-financial listed companies, of which data are not missing. Some prior studies use the matched
sample approach, such as Firth et al. (2011) matched a misstating firm with a non-misstating firm that is
111
used in a number of previous studies (e.g. Beneish 1997; Burns and Kedia 2006;
Dechow et al. 2011). Logistic regression, which will be used for the data analysis, can
be applied for a choice-based non-matched sample (Cram et al. 2009).
The research excludes those observations with incomplete data and, therefore, a sample
selection bias exists (Cram et al. 2009; Zmijewski 1984). The coefficients of a probit
model (Zmijewski 1984) and logit model (Dietrich 1984) can also be biased. However,
based on the examples in Zmijewski (1984, pp. 76-79) the significance level of the
coefficients is similar when compared to that of the sample with complete data. Since
the research main objective is to examine the relationship between the variables in order
to understand what the causes of accounting misstatements are (i.e. hypothesis testing),
rather than to create a model to predict the likelihood of accounting misstatements, the
limitation of the incomplete data availability can be accepted in this project.
This research assumes that the firms that are not in the group of misstating firms did not
experience accounting misstatements. It is acknowledged that the possibility of
undetected or unreported misstatements may exist, and that these can work against the
finding a distinction between misstating and non-misstating firms.
5.5.2 Data Collection
Data were collected according to the research objectives and proposed hypotheses.
There are two primary types of data used in this thesis: financial and non-financial.
The financial data were collected from the Thomson One Banker database, ranging
from 1996 to 2009. The non-financial data were gathered from a variety of sources. The
data involving external auditors and their opinions were collected manually from audit
reports, available on the website of the SECT. The names of audit partner and audit
firms were collected back as far as 2001. The data governing rehabilitation periods,
firms’ chief executive officers and chairmen of the boards were mainly collected from
traded in the same stock exchange, has the nearest firm size, and has the same age of trading in the
stock exchange.
112
the annual registration statements (Form 56-1)27
and supplemented where necessary by
annual reports. The Form 56-1 and annual reports were gathered through a commercial
web-based database of the Stock Exchange of Thailand, named SETSMART. Some
annual reports were also available on the Thomson One Banker database and
companies’ websites. Collecting data from many sources minimised the numbers of
missing observations.
Data on the major shareholders were manually collected from several sources. The first
source is the SETSMART database, which shows the names of major shareholders
holding shares above 0.5%. In the SETSMART, there are many types of shareholder
lists, such as a list for dividend payout and a list for annual meetings. In this study, the
list for annual meetings was selected because firms must report their financial
statements and appoint an auditor in the annual general meeting. The atmosphere of the
monitoring should at least occur at this point. After gathering the major shareholders’
names, the researcher then identified the firms’ ultimate owner; the definition of the
ultimate owner which was used in this study is consistent with La Porta et al. (1999)
and Wiwattanakantang (2001).28
In cases where the major shareholders are private
companies, the researcher tracked down the shareholders of those private companies in
order to identify exactly who was the ultimate owner. Those shareholders who share the
same family name were grouped together as one group, like prior research studying into
the ownership of Thai firms29
(e.g. Boonlert-U-Thai and Kuntisook 2009;
Wiwattanakantang 2001). The number of shares held by the ultimate owner was
recorded and then used for the ownership concentration. These shares indicate the
voting rights, or control rights, of the ultimate owner. A further investigation through
the shareholders of the private companies allowed this study to account for the effect of
27
Form 56-1, or the annual registration statement, is a type of report required by the Stock Exchange (the
regulation no. Bor.Jor./Por.01-00). The report covers events occurring in the last period, such as:
significant changes in the company, or its business operations, board of directors, shareholder structure,
summary financial status and operational results, industrial conditions or business risks. Since
December 2002, companies have had to disclose how they comply with the fifteen principles of
corporate governance practices under the comply-or-explain basis, and the directors’ and management
profiles (e.g. name, education, percentage of share holding and remuneration).
28The method which was used to collect the ownership data is presented in Appendix A.
29In Thailand it is very uncommon that two families have the same surname. The family name is unique.
When a family wants to change its surname, the new one must differ from existing surnames.
113
pyramids and cross-holdings structure. The ownership arrangement is measured in using
a dummy variable rather than a continuous measure of cash-flow rights. This approach
is used in numerous prior studies (e.g. Filatotchev et al. 2011; Wiwattanakantang 2001).
The information on shareholders of private companies was gathered from the updated
shareholder lists (Form Bor.Or.Jor 5).30
These copies are made available by request
from the Department of Business Development, Ministry of Commerce Thailand.
5.6 Data Analysis Tools
This section discusses statistics issues and the treatments for the data and analyses.
5.6.1 Treatment of Outliers
An important issue in using financial data is that of outliers, which might distort the
research results and interpretation of research findings. Therefore, a winsorisation
method is applied to values of extreme outliers at the 1st and 99
th percentiles, which is
similar to prior studies (e.g. Chen et al. 2009; Roberts and Sufi 2009).31
5.6.2 Inferential Statistics
The data analysis, which will be presented in Chapters 6 and 7, started with the
exploration of the distribution of the data and comparisons in means/medians between
two groups of the sample. Then a correlation matrix was created to investigate the
relationships among variables. Multiple regression models were then employed to test
the hypotheses described in Section 5.3. Logistic regression models were employed for
30
Form Bor.Or.Jor 5 is an updated list of the company’s shareholders, which needs to be prepared for the
annual general meeting and submitted together with the annual financial reports and income tax filing
form to the Revenue Department and the Department of Business Development, Ministry of Commerce
within 14 days of the annual general meeting. The contents in this form comprise shareholders’ names,
the amount of shares held, numbers of the shares, and the beginning and ending dates of holding.
31The main research results for the causes and consequences of accounting misstatements are not sensitive
to the winsorisation at the cut-off points of 5th
and 95th
percentiles, but are sensitive to the case where
the winsorisation procedure is not used. Results of the latter case are reported after the data analysis has
been performed in Chapters 6 and 7.
114
analysing the determinants of accounting misstatements. Although model creation is not
a purpose of this study, McFadden’s pseudo R2 was also considered for a measure of fit
in modelling. An ordinary least squares linear regression was used in the examination of
economic consequences. The adjusted coefficient of determination (adjusted R2) was
analysed for the power of explanation by models. Heteroscedasticity and
multicollinearity were tested for and rectified if such statistical problems existed. The
hypotheses were generally tested at the conventional significance level of 5%; however,
a 10% significance level was also considered and presented in the analysis.
5.6.3 Rare Events Logit Models
Since the research uses a non-matched approach for the sample groups, the research
may confront the issue of a small proportion of the sample (i.e. the misstatement firm-
years) to the control group (i.e. the non-misstatement firm years) of these studies, such
as: 2.4% in Beneish (1997), 3.32% in Burns and Kedia (2006) and 0.31% in Dechow et
al. (2011). The researcher adopts a rare events logit model of King and Zeng (2001c)32
to test the robustness of the results. King and Zeng (2001a, c) show that the application
of traditional logit models in samples where the binary dependent variable has much
fewer ones than zeros might lead to biased results due to the underestimation of the
parameter estimates. The constant term of a traditional logit model for rare events is
underestimated while the coefficient of explanatory variables is overestimated (King
and Zeng 2001c, pp. 153-154). The rare events logit models can correct the parameters
in the presence of rare events or small samples. This method was first used in political
science (e.g. King and Zeng 2001b). Although this has recently been applied in the
management literature (e.g. Lafuente et al. 2010), it has not yet been applied by
accounting scholars. Consequently, introducing the rare events logit models to
accounting literature is one of the contributions of this research.
32
A rare events logistic regression model can be run in Stata by a command of ‘relogit’ (Tomz et al.
2003). The zip file of the command is available in Tomz et al. (2003) (http://www.jstatsoft.org/v08/i02) and the instalment procedure is available at http://userwww.service.emory.edu/~jhamner/readme.txt.
5. Incorrectly recording cost of goods sold 5 8.33
6. Understated operating expenses 5 8.33
7. Capitalisation of repair and maintenance
costs 1 1.67
8. Overstating assets:
8.1 Goodwill 3
8.2 Failure to test impairment of assets 5
8.3 Counterfeiting documents 3 11 18.33
9. Incorrectly classifying types of leasing 2 3.33
10. Failing to prepare consolidated financial
statements 9 15.00
11. Managements’ embezzlement affecting
financial reports 4 6.67
60 100.00
Table 6.2 reports the distribution of the 51 misstatement firm-years. Since some fiscal years contain
more than one type of misstatements, there are 60 cases of the misstatements in Panel C.
The data in Panel B of Table 6.2 (industry/sector) indicates that, of the 51 cases,
accounting misstatements most frequently occur in the automotive sector (17.6%). They
are also common among firms in the food production sector (13.7%), packaging
(11.8%), and electronic components (11.8%). When compared with other firms in the
same sector, accounting misstatements most frequently appear in the automotive sector
(8.3%) and electronic components sector (7.5%). There are seven sectors in Thailand
that have not released financial reports. In an aggregate point of view for the industries,
accounting misstatements have appeared in all industries during 2001-2009, but only
one case occurred in the consumer products industry.
125
Panel C in Table 6.2 indicates the types of accounting misstatements. The total number
of 60 is larger than the number of 51 misstatement observations because some fiscal
years contained more than one accounting misstatement. The most common accounting
misstatements involve overstated revenues (21.67%), overstated assets (18.33%), and a
failure to prepare consolidated financial statements (15%). Revenue overstatement is
amongst the most common reason for misstatements in other counties, such as the U.S.
(e.g. Dechow et al. 2011). One distinction in the Thai sample is an accounting mistake
that happens in preparing consolidated financial reports. This can happen because Thai
firms (and also other Asian firms) have a characteristic of business group where
ownership is arranged in forms of pyramids and cross-holdings (Claessens et al. 2000).
These complex ownership structures can cause the firms to incorrectly prepare financial
reports because parent companies often misinterpret the term ‘control’. The Securities
and Exchange Commission, Thailand (SECT 2004, 2008) points out that the parent
companies usually interpret the ‘control’ term (Thai Accounting Standard 44, an
adoption of IAS 27 (IASB 2008) by considering the proportion of shareholdings (i.e.
above 50%) in a subsidiary only; they disregard the control in other circumstances (e.g.
the parent company has a power to govern the financial and operating policies of the
subsidiary, or the parent disposes of an investment in a subsidiary but still retains
control).
Considering the magnitude of accounting misstatements in Thailand, the average
amount of the impact of restatements on earnings numbers in Thai firms is
approximately 49.62 million THB (£1.05 million) per year.40
This is approximately
11% of the average firm’s market capitalisation a year.41
Specifically, the average
absolute value of the impact of accounting restatements on earnings number is 417.6
million THB (£8.84 million) for the restatement required by the SECT, and 29 million
THB (£0.6 million) for the voluntarily restated financial reports (details are in Appendix
40
This is computed by dividing an average magnitude of restatements of 446.6 (417.6+29) million THB
by nine years period (2001-2009). See Appendix B for more details.
41This is computed by dividing the average of 49.62 million THB a year by the market capitalisation (at
the end of 2008) of 449.96 million THB.
126
B). When considering the impact of accounting misstatements by type (fraud and
errors), an average absolute value of the impact is approximately 684.98 million THB
(£14.13 million) for fraud cases and 72.88 million THB (£1.5 million) for accounting
error cases. Dividing each impact by total assets in the year prior to the misstatement
year (following Hennes et al. 2008), on average the impact is 28.34 % for the fraud
group and 5.76% for the accounting error group and they are statistically different at the
0.01 level, with a p-value of 0.0062 (one-tailed). The accounting misstatements due to
fraud, therefore, have a greater impact on accounting items (and eventually the financial
statement users) than do accounting errors. This finding is consistent with the U.S.
sample in Hennes et al. (2008). Unfortunately, the SECT announcements do not provide
consistent information on the magnitude of the misstatements, so this analysis is limited
to only the cases where data are available (44 out of the 51 observations). The details on
fraud and error cases were provided to increase the evidence on the Thailand country.
These observations are examined in the aggregate in data analyses.
6.3 Determinants of the Causes of Accounting Misstatements
This section details the measures of the research interests for the causes of accounting
misstatements in Thailand. It also includes discussion of the number of observations
that is reduced due to a modelling constraint.
6.3.1 Multiple Logistic Regression Model
According to the conceptual framework (Chapter 5, Section 5.2) the dependent variable
for the analysis of the determinants of accounting misstatements is a dichotomous
variable of the incidence of accounting misstatements. Independent variables comprise
three groups: ownership structure, large shareholders’ incentives and corporate
governance mechanisms. A number of control variables (i.e. firm size, age, and
industry-effects) is also included into the analysis because, for example, Wang (2006)
find a relation between firm age and earnings quality and accounting misstatements are
found to most frequently occur in the computer, and the property and construction
127
industries in the U.S. and China, respectively (Chen et al. 2006; Dechow et al. 2011).
Prior research has also found an influence of a firm itself on financial reporting
(Lawrence et al. 2011; Lennox and Pittman 2010) and a variation in shareholder
responses to auditing service after the 2001 Enron year, such as in the U.K. (Holland
and Lane 2008). Consequently, there may be an unobserved firm effect and time effects
in the Thai sample during 2001-2009. Standard errors are, therefore, clustered by firm
and year dummies are included in the regression model (Petersen 2009).
Logistic regression model:
ti,t
t
tt
Κ
ΚiΚti,
ti,ti,ti,ti,
ti,ti,ti,ti,
ti,ti,ti,ti,ti,
εβββ
ββββ
ββββ
ββββα
+YEAR+,IND+AGE+
LNSIZE+DUAL+AUDCHG+BIG+
REHAB+MB+NFCF+ISSUE+
LEV+CROSS+FAM+OWN+=AM
∑∑8
1=
7
1=
∈13
1211109
87165
43210
-
where:
t: The current fiscal year for firm i.
AM: The occurrence of accounting misstatements, measured by a dichotomous
variable of 1 if the firm’s financial reports for the current fiscal year contain
at least one misstated accounting item; 0 otherwise.
OWN: A measure of ownership concentration, measured by a percentage of the
shares held by the ultimate owner.
FAM: A measure of owner identity, measured by a dummy variable of family
ownership, which equals 1 if the ultimate owner is a family; 0 otherwise.
CROSS: A measure of ownership arrangement, measured by a dummy variable of 1 if
the firm’s ownership is arranged in a form of pyramids, or cross-holdings or
both; 0 otherwise.
LEV: An incentive to avoid debt covenant violation, measured by the ratio of total
debt to total assets.
ISSUE: An incentive to minimise cost of capital, measured by a dummy variable of 1
if the firm issued securities during the fiscal year; 0 otherwise.
128
NFCF: An incentive to minimise cost of capital, measured by a dummy variable for
negative free cash flow, which equals 1 if FCF < -0.5 [FCF t = (OCF t –
Average Cap Exp t-3 to t-1)/CA t-1]; 0 otherwise.
where: OCF = The balance of cash flow from operations in cash flow
statements.
Average Cap Exp = An average of capital expenditures from cash
flow statements from year t-3 to t-1.
CA= The balance of current assets in balance sheet.
MB: An incentive to maintain capital market expectation, measured by a ratio of
market value to book value of equity.
REHAB: An indication of financial distress and profitability regulation, measured by a
dummy variable of 1 if the firm is under the rehabilitation plan; 0 otherwise.
BIG: A measure of audit quality, measured by types of audit firms, where equals 1
if the firm uses an audit service from a Big 4 audit firm; 0 otherwise.
AUDCHG: A measure of audit quality, measured by a change in an auditor, where
equals 1 if the firm changes an audit firm during the current fiscal year; 0
otherwise.
DUAL: A measure of weak corporate governance, particularly in concentrated
ownership firms, measured by a dummy variable of 1 if the chief executive
officer also serves as chairman of the board; 0 otherwise.
LNSIZE: A control variable for size of the firm, measured by the natural logarithm of
total assets.
AGE: A control variable for age of the firm, measured by the number of years since
the firm was established.
IND: An array of seven industry dummies, where each firm falls into one of the
seven categorises according to the categorisation of Stock Exchange of
Thailand (Agro and Food, Consumer Products, Industrials, Property and
Construction, Resources, Services, and Technology; Agro and Food industry
dummy being arbitrarily omitted to avoid perfect multicollinearity).
YEAR: An array of eight fiscal year dummies 2002 to 2009; year 2002 dummy being
arbitrarily omitted to avoid perfect multicollinearity.
: The regression residual.
129
6.3.2 Description of Variables
A description of the variables illustrated in the previous section is presented in Table
6.3. In addition, the expected signs of coefficients (directions of the alternative
hypotheses from Chapter 5, Section 5.3) are included in this table.
Table 6.3: Variables for the Determinants of Accounting Misstatements
Proxy Measure Abbre-
viation in
Model
Calculation Expected
Sign
Dependent variable
The incidence of accounting
misstatements
AM 1 if financial reports
contain at least one
accounting misstatement; 0
otherwise
Independent variables
1. Ownership:
1.1 Ownership
concentration
Ownership of the
ultimate owner
OWN Percentage of shares held
by the ultimate owner
+
D_OWN 1 if ownership
concentration > 25%;
0 otherwise
+
1.2 Owner
identity
Family ownership FAM 1 if the ultimate owner is a
family; 0 otherwise
+
1.3 Ownership
arrangement
The appearance of the
an arrangement of
pyramids and/or cross-
holdings
CROSS 1 if the firm’s ownership is
arranged in a form of
pyramids, or cross-holdings
or both; 0 otherwise
+
2. Incentives:
2.1 Debt
covenant
constraints
Leverage LEV Total debt to total assets +
2.2 Ex post
financing need
Securities issuance ISSUE 1 if securities issued during
the fiscal year; 0 otherwise
+
2.3 Ex ante
financing need
Negative free cash
flow
NFCF 1 if NFCF < -0.5
[NFCF = (cash flow from
operations – average capital
expenditure from year t-3
to t-1)/current assets in year
t-1]; 0 otherwise
+
130
Proxy Measure Abbre-
viation in
Model
Calculation Expected
Sign
2.4 Capital
market pressure
Market to book ratio MB Market value a to book
value of common equity
+
2.5 Regulation
effect
Rehabilitation period REHAB 1 if a firm is under
rehabilitation status;
0 otherwise
+/-
3. Monitoring:
3.1 External
monitor
The use of a Big 4
auditor
BIG 1 if a firm uses a Big 4
auditor; 0 otherwise
-
3.2 Possibility
of detection
An audit firm change AUDCHG 1 if there is an audit firm
change in the current year;
0 otherwise
+/-
3.3 Internal
monitor
CEO=COB DUAL 1 if the chief executive
officer (CEO) also serves
as chairman of the board
(COB); 0 otherwise
+
Control variables:
1.Firm size Size LNSIZE Natural logarithm of total
assets
+/-
2.Firm age Age AGE Years after establishment +/-
3.Industry
effect
Industry dummies IND Dummy variable
4.Year effect Fiscal year dummies YEAR Dummy variable a There were some firms whose securities were suspended from trading during rehabilitation periods,
and as such none of these firms’ market values are available. The market value of these cases was
computed by using the latest firms’ market value before the securities were suspended in order to
maintain the observations of the treatment group. However, the research results for the antecedents of
accounting misstatements are unchanged if the models exclude these observations.
It is noteworthy that there are two measures for the ownership concentration in Table
6.3: a continuous variable (OWN) and a dummy variable (D_OWN). The dummy
variable of the ownership concentration (D_OWN) takes a value of 1 if the control
rights of the ultimate owner exceed 25%. The 25% level is employed following the
definition of the Stock Exchange of Thailand for controlling shareholders and under the
Public Limited Companies Act B.E. 2535 (A.D. 1992), which states that a shareholder
at this level of shareholdings has sufficient voting power to a call for an extraordinary
general meeting (section 100) and perform certain legal activities, such as dismissing
external auditors (section 164). It was also used in prior studies of Thai firms (e.g.
Ananchotikul et al. 2010; Wiwattanakantang 2001). Therefore, the dummy variable of
131
D_OWN will also be tested in the analysis and a positive association between the
variable and the likelihood of accounting misstatements is predicted.
6.3.3 The Final Sample for the Analysis of the Determinants of Accounting
Misstatements
According to the multiple regression models shown in Section 6.3.1, the logistic
regression model includes a set of year dummies. However, since there were no
accounting misstatement cases in 2001 (see Table 6.2 Panel A), the analysis excludes
the observations for 2001 (152 firm-years) to avoid the problem of perfect failure
determination. Consequently, the final number of the observations for the study into the
determinants of accounting misstatements (Section 6.4) is reduced from 2,503 firm-
years (as shown in Table 6.1 Panel C) to 2,351 firm-years in the next section (51
misstatement firm-years and 2,300 non-misstatement firm-years).
6.4 Empirical Results
6.4.1 Descriptive Statistics
This section provides descriptive statistics (Table 6.4) for misstatement firm-years and
non-misstatement firm-years from 2002 to 2009. Continuous and discrete variables are
presented separately in Panel A and B, respectively. As described in Chapter 5, to
reduce the effects of extreme outliers in statistical tests, continuous variables (i.e. LEV,
MB and AGE) were winsorised at the 1st and 99
th percentiles (one might notice that the
maximum value of the LEV and MB variables for two groups are identical; this results
from the winsorisation process). As for firm size (total assets), the data were
transformed by taking the natural logarithm of total assets (LNSIZE). Except for the
data on ownership concentration (OWN), those of other continuous variables appear not
to be normally distributed (the tests for normality42
rejected the null hypothesis that the
42
Including the Skewness-Kurtosis, based on D'Agostino et al. (1990), Shapiro-Wilks, and the Shapiro-
Francia tests. Graphical methods (e.g. box plot and histogram) were also employed to visually examine
the distribution of the data.
132
data are normally distributed at the p-value < 0.05). Nevertheless, logistic regression
does not assume normality and equal variance for the error term, whereas these
assumptions are required for linear regression (Hair et al. 1998, pp. 239-325; Hosmer
and Lemeshow 2000, pp. 6-7). In addition, the inaccuracy of this statistical inference is
less problematic in large samples and the distribution of the error which follows a
binomial distribution approximates a normal distribution for large samples (Menard
1995, pp. 72-73).
Table 6.4: Descriptive Statistics of Misstated Financial Reports and Non-Misstated
LNSIZE AGE DUAL AM OWN CROSS NFCF REHAB AUDCHG FAM LEV ISSUE MB BIG
Table 6.5 reports the correlation coefficients for Pearson (below the diagonal) and Spearman (above the diagonal). All variables are defined in Table 6.3.
***, **, and * denote significance at the 1%, 5%, and 10% levels, respectively (a two-tailed test of whether the correlation coefficient is equal to zero).
138
Within the first column the appearance of accounting misstatements (AM) is positively
correlated with rehabilitation stage (REHAB), leverage ratio (LEV) and demand for
external financing (NFCF) at the correlation coefficients of 14%, 12% and 10%,
respectively. The incidence of accounting misstatements is also significantly correlated
with the corporate governance variables. The existence of accounting misstatements
(AM) is positively correlated with duality position (DUAL) and audit firm change
(AUDCHG), and is negatively correlated with the use of Big 4 auditors (BIG). Their
coefficients differ from zero at the 1% level. Although there is a negative correlation
between the pyramidal and cross-holding arrangement (CROSS) and the occurrence of
accounting misstatements, the coefficient correlation is low (4%). Neither ownership
concentration (OWN) nor family ownership (FAM) is significantly correlated with the
appearance of accounting misstatements.
Significant correlations among the independent variables are as follows. The ownership
concentration (OWN) is positively correlated with firm age (AGE), consistent with the
findings of Claessens et al. (2000). OWN is positively correlated with the pyramidal
and cross-holding arrangement (CROSS) at the correlation coefficient of 18.5%, which
is in accordance with the literature noting that the ultimate owners of Asian firms have a
controlling power over the firm through the business group and the pyramidal and
cross-holding chains (e.g. Claessens and Fan 2002; Morck et al. 2005).
As far as the financial characteristics are concerned, concentrated ownership firms
(OWN) seem to have a healthier financial position (REHAB), a lower leverage ratio
(LEV) and less demand for external funds (NFCF and ISSUE). Family firms (FAM) are
less likely to use Big 4 auditors (correlation coefficient of -14% with BIG) and they are
smaller (the coefficient of -13% with LNSIZE). LEV has a positive correlation
coefficient of 43.5% with REHAB and a negative correlation coefficient of 9.2% with
market to book ratio (MB). These correlations are persuasive because the highly levered
firms are more likely to face liquidity problems and the financial constraint may
ultimately lead them to rehabilitation status and because of the poor current financial
market position, participants can heavily discount these firms’ shares. The rehabilitation
firms show more demand for external funding (with a positive correlation of 15.2%
139
between NFCF and REHAB). Firm size (LNSIZE) has a positive correlation coefficient
of 20.4% with stock issuance (ISSUE), and 11.4% with the market to book ratio (MB),
consistent with prior literature (e.g. Rajan and Zingales 1995) suggesting that larger
firms release more information to the public than smaller firms do and that an
information asymmetry cost is lower in large firms; consequently, larger firms are
positively correlated with stock issuances.
With regard to corporate governance factors, firm size has a positive correlation
coefficient of 32% with the use Big 4 auditors (BIG), consistent with prior research (e.g.
Chi and Huang 2005; Fan and Wong 2005). Stock issuances (ISSUE) are positively
correlated with the use of a Big 4 auditor (BIG), similar to previous studies (e.g. Fan
and Wong 2005). A surprising result is the negative correlation (-17.4%) between
family ownership (FAM) and the pyramidal and cross-holding arrangement (CROSS).
Further investigation indicated that 56% of the firms with pyramids or cross-holdings
are those firms whose ultimate owner is not a single family but multiple shareholders.
Although the results above may be indicative, they do not allow for potential
conclusions for the determinants of accounting misstatements in Thai firms. The next
subsection, therefore, reports a multivariate logistic regression analysis for the
determinants of accounting misstatements in Thailand.
6.4.3 Multivariate Results
The analysis for the determinants of accounting misstatements employed the following
logistic regression model (repeated for ease of reference below).
ti,t
t
tt
Κ
ΚiΚti,
ti,ti,ti,ti,
ti,ti,ti,ti,
ti,ti,ti,ti,ti,
εβββ
ββββ
ββββ
ββββα
+YEAR+,IND+AGE+
LNSIZE+DUAL+AUDCHG+BIG+
REHAB+MB+NFCF+ISSUE+
LEV+CROSS+FAM+OWN+=AM
∑∑8
1=
7
1=
∈13
1211109
87165
43210
-
where t is the current fiscal year of firm i. All variables are defined in Table 6.3.
140
Table 6.6: Logistic Regressions Examining the Determinants of Accounting
Misstatements in Thailand during 2002-2009
VARIABLES Hypo- Predicted Model 1 Model 2
thesis Sign Coefficient Odds Coefficient Odds
(H) (z-statistic) Ratio (z-statistic) Ratio
OWN 1.1 + 0.0040 1.0040
(0.621)
D_OWN + 0.5931* 1.8096
(1.660)
FAM 1.2 + -0.2395 0.7870 -0.1985 0.8199
(-0.566) (-0.466)
CROSS 1.3 + -0.1674 0.8459 -0.1888 0.8280
(-0.268) (-0.302)
LEV a
2.1 + 1.4587** 4.3005 1.5492** 4.7078
(2.320) (2.366)
ISSUE 2.2 + 0.5057 1.6581 0.5399 1.7158
(1.403) (1.494)
NFCF 2.3 + 1.2328** 3.4307 1.1974** 3.3114
(2.575) (2.569)
MB 2.4 + 0.1060 1.1119 0.0932 1.0977
(1.039) (0.938)
REHAB 2.5 +/- -0.1415 0.8680 -0.0962 0.9082
(-0.211) (-0.146)
BIG 3.1 - -1.1128** 0.3286 -1.0841** 0.3382
(-2.285) (-2.214)
AUDCHG 3.2 +/- 0.8658** 2.3769 0.8738** 2.3960
(2.331) (2.335)
DUAL 3.3 + 1.1317*** 3.1008 1.1853*** 3.2715
(2.974) (2.948)
LNSIZE +/- -0.2211 0.8016 -0.2417 0.7853
(-1.196) (-1.317)
AGE +/- 0.0041 1.0041 0.0038 1.0038
(0.235) (0.216)
Constant -3.5303** 0.0293 -3.8969** 0.0203
(-2.224) (-2.395)
Industry dummies Included Included
Year dummies Included Included
Observations 2351 2351
McFadden's pseudo R2 0.2960 0.3000
Model chi-square 269.5 273.2
Degrees of freedom 26 26
p-value <0.0001 <0.0001
Number of clusters (firms) 387 387
141
Table 6.6 presents logistic regression results for the determinants of accounting misstatements in the
Thai sample. The dependent variable is a dichotomous variable of an occurrence of an accounting
misstatement. All explanatory variables are defined in Table 6.3. Standard errors are robust by firm-
level clustering. ***, **, and * denote significance at the 1%, 5%, and 10% levels, respectively (a two-
tailed test of whether the coefficient is equal to zero). a If the data are not winsorised, the leverage ratio (LEV) becomes insignificant at the 5% level (p-
value=0.956).
Table 6.6 presents the regression results for the determinants of accounting
misstatements in Thailand. The first column refers back to the alternative hypotheses for
the determinants of accounting misstatements in Thailand (see Section 5.3). The
goodness of fit statistics is shown at the bottom of the table. Model 1 has a model Chi2
of 269.5 and is statistically significant (p-value < 0.0001). Therefore, there is evidence
to reject the null hypothesis that coefficients of the independent variables are equal to
zero (Ho: β1= β2=.... β26=0) and conclude that information about the independent
variables allow the model to make better predictions of P(Y=1).45
The model Chi2 of the
other model in the same table is also statistically significant at the p-value < 0.0001.
In Model 1, the coefficients for LEV, NFCF, BIG, AUDCHG and DUAL, differ from
zero at the 5% level and the signs of these coefficients are consistent with the
expectations of this study. They indicate that an accounting misstatement is more likely
to occur when a firm is close to the debt covenant violation (LEV), needs external
financing (NFCF), changes auditor (AUDCHG) and has a duality position of the chief
executive officer and chairman of the board (DUAL), but the likelihood of accounting
misstatements reduces when the firm uses a Big 4 auditor (BIG).46
The coefficients of
OWN, FAM and CROSS do not statistically differ from zero at the 0.05 level.
45
The diagnostic tests for this model are presented in Appendix C. The model meets all logistic regression
assumptions except for the appearance of influential cases, which are all misstatement observations.
Four extreme cases appear and result in large residuals. Excluding these four observations, however,
does not change the significance of research results. In order to have the sample as close as the real
population, these observations were maintained in the analysis.
46Since 1 January 2006 listed companies in the Stock Exchange of Thailand are required to rotate their
audit partner every five years (section 5 (6) SECT 2005b) without the possibility of renewal before two
years have passed from the previous engagement. The observations of auditor change in Thai listed
firms since after 2006 may be caused by this regulation (although the regulation requires only the audit
partner rotation). To ensure the robustness of the research results, the study reran the logistic regression
on the observations during 2002-2005 (957 observations). The result of the audit firm change
(AUDCHG) is still significant at the 0.05 level (t-statistic of 2.24). Other significant research results
(i.e. LEV, NFCF, BIG and DUAL) remain unchanged, except for a slight change in coefficients.
142
Therefore, there are no significant relationships between the ownership proxies (i.e.
OWN, FAM and CROSS) and the likelihood of accounting misstatements. The
coefficients of growth opportunities (MB), rehabilitation status (REHAB), firm size
(LNSIZE) and firm age (AGE) are not significantly associated with the likelihood of
accounting misstatements. Consequently, the pressure from outside parties (i.e. the
capital market pressure, MB, and profitability regulation, REHAB) are not as important
as expected in the sample. In the descriptive statistics (Table 6.4), means of LNSIZE,
CROSS, ISSUE and REHAB are statistically different between the two groups, but they
are not significant antecedents in this multiple logistic regression analysis.47
The
significant result in the descriptive statistics for the rehabilitation status (REHAB) and
the insignificant result of its coefficient in the multiple regression analysis may indicate
that accounting misstatements are more likely to occur when firms are in this status,
which is consistent with Tummanon (2005b), but being in such a status is not an
important antecedent of the likelihood of accounting misstatements when other factors
are controlled for. In regard to the MB variable, it is often not a significant determinant
of financial misreporting in samples with more dispersed ownership (e.g. Burns and
Kedia 2006; Burns et al. 2010). According to the odds ratio, the top three important
antecedents of accounting misstatements in Thailand are the incentive to avoid debt
covenant violation (LEV, odds ratio of 4.3), an ex ante financing need (NFCF, odds
ratio of 3.43) and duality position (DUAL, odds ratio of 3.1). These determinants are
also found in prior research into U.S. firms (Dechow et al. 1996).
In Model 2, the continuous variable of OWN is replaced by a discrete variable of
ownership concentration (D_OWN). D_OWN is positively associated with accounting
misstatements - the coefficient differs from zero at the 10% level. The sign and
significance levels of other variables remain unchanged (only the coefficients have
47
Regarding the REHAB measure, the proportion of REHAB is higher for the misstatement group in the
descriptive statistics, but in this multiple regression analysis, the coefficient of REHAB has a negative
sign (although the coefficient does not statistically differ from zero). This contradictory result concerns
the researcher about a multicollinearity problem because REHAB is highly correlated with LEV (the
correlation coefficient of 43.5% in Table 6.5). The researcher, therefore, reran the logistic regression
analysis by excluding the LEV measure. With or without the LEV measure the coefficient of REHAB
does not differ from zero at the 5% level in the multiple regression analyses. A diagnostic test in
Appendix C neither signals the multicollinearity problem of the REHAB variable. Therefore, it is
certain that there is no evidence to reject the null hypothesis that there is no association between
rehabilitation status and the likelihood of accounting misstatements.
143
slightly changed). Therefore, the likelihood of accounting misstatement increases when
the ultimate owner has control rights over 25%. This is in accordance with a warning by
the Securities and Exchange Commission, Thailand (SECT 2005a) stating that investors
must be aware of expropriation if a firm’s ultimate owners hold more than 25% of the
total shares. The odds ratio of 1.8 indicates that the odds of a likelihood of accounting
misstatements are 80% higher that a firm with high ownership concentration (i.e. >25%)
engages in financial misreporting when compared to a firm with low ownership
concentration. This finding supports the hypothesis of an entrenchment effect and points
to a non-linear relationship (which will be further examined in Section 6.5.2).
With regard to the industry and year dummy sets, none of the industry dummies are
statistically associated with accounting misstatements (see details in Appendix C).
Meanwhile, the dummy for 2004 is positively associated with the likelihood of
accounting misstatements at the 1% level. This result is in line with Table 6.2 Panel A
showing that the accounting misstatement cases most frequently appeared in 2004 and
one possible reason involves a new audit team of market regulators.
Accordingly, a conclusion for the hypothesis testing is that there is evidence to reject
five null hypotheses in the sample at the conventional 5% level. In other words, the
alternative hypotheses for the debt covenant hypothesis (H2.1), an ex ante financing
need (H2.3), a usage of a Big 4 auditor (H3.1), an audit firm change (H3.2) and a
duality position (H3.3) are significant determinants of accounting misstatements in Thai
firms.48
48
A study by Ananchotikul et al.’s (2010) found that ROA and dividend payout ratio are significant and
negatively associated with the likelihood of regulatory violation in Thailand. The measure of ROA has
also found to be negatively associated with the likelihood of fraud in some prior studies (e.g. Brazel et
al. 2009; Erickson et al. 2006; Perols and Lougee 2011). Consistent with the prior studies, if ROA
(winsorised at the 1st and 99
th percentiles) is included in the empirical model of this research, it is
significantly associated with the likelihood of accounting misstatements (coefficient of -4.668; z-
statistic of -3.62; p-value < 0.001) and the pseudo R2 increases from 29.6% (Model 1 Table 6.6) to
32.04% ; however the coefficient of audit firm change (AUDCHG) becomes not significant (z-statistic
of 1.65) at the 5% level and the coefficient of leverage ratio (LEV) is significant at the 10% level (z-
statistic of 1.67). The ROA is highly correlated with LEV (coefficient of -29.65%) in the sample and
this may cause the change of the result on LEV measure, similar to the problem occurred to the ROA
and delisting pressure in Wang and Wu’s (2011) sample. Some studies, on the other hand, have found a
positive relationship between ROA and the likelihood of fraud (e.g. Summers and Sweeney 1998).
There is no theory suggesting the relationship of ROA and accounts manipulation. In addition, there are
particular studies (e.g. Thomsen and Pedersen 2000) examining the determinants of ROA including
144
This paragraph compares the research findings with the existing evidence in the
literature. The evidence to support the entrenchment effects of controlling shareholders
in this research is weak. None of the measures of ownership structures have a
significant relationship with the likelihood of accounting misstatements significantly at
the 5% level; only the coefficient of the dummy variable for ownership concentration
differs from zero at the 10% level. Previous studies of Thai firms neither find an
association of ownership concentration with the likelihood of regulatory violation
(Ananchotikul et al. 2010) or with discretionary accruals (Pornupatham 2006). With
regard to the incentives, accounting misstatements in Thailand are likely to occur if Thai
firms wish to avoid debt covenant violations and minimise the cost of capital. These
findings are consistent with those of prior research (e.g. Dechow et al. 1996; Firth et al.
2011). On the other hand, the incentive to maintain the capital market growth
opportunity is not statistically significant for Thai firms. Even though the auditors in
Thailand agree that the incentive to maintain the growth opportunity is the most
important reason for Thai firms to manage earnings (within GAAP) (Pornupatham
2006), when measured by GAAP violation it is not of importance. The incentive to meet
profitability regulation (as measured by a rehabilitation status) is not as significant as
expected, while it is of significance in Chinese listed firms (Chen et al. 2001).
Corporate governance mechanisms have an important impact on the likelihood of
accounting misstatements in Thai firms. The weakness of internal corporate governance
(i.e. firms whose chief executive officer and chairman of the board are the same
individual) increases the likelihood of accounting misstatements, consistent with the
finding in, for example, the U.S. firms (e.g. Dechow et al. 1996; Efendi et al. 2007). Big
4 auditors play an important role in reducing the likelihood of accounting
misstatements, consistent with the roles of Big 4 auditors in some U.S. samples (Lennox
and Pittman 2010) and the U.K. (Peasnell et al. 2001). An auditor change is strongly
associated with the incidence of accounting misstatements.
ownership structures and financial characteristics, which are the independent variables in this study.
Due to the lack of theoretical support, ROA was excluded in this research.
145
Since the variables of auditors (BIG) and audit firm change (AUDCHG) are related,
further investigation was conducted in order to understand and interpret how the audit
quality in the first year of auditing varied between Big 4 and non-Big 4 auditors.
Overall, in Table 6.6 Model 1 the odds ratio of BIG is 0.3286. This means that the
clients of Big 4 audit firms are 67.24% less likely to see an occurrence of accounting
misstatements. The odds ratio of 2.3769 for AUDCHG indicates that the probability that
financial reports are misstated is 2.37 times more likely to occur in the first year of
auditing when compared to non-first years. Further investigation embraces the
probability of accounting misstatements, which is varied among Big 4 and non-Big 4
auditors, first-year and non-first years, while other variables are computed at the mean
value.49
The examination shows that the odds of accounting misstatements occurring for
Big 4 auditors by the odds of a likelihood of accounting misstatements for the non-Big 4
auditors equals 0.3911 in the first year of audit engagement, while it equals 0.3386 in
the non-first years. The higher proportion of the first year indicates an adverse effect of
short-term audit tenure on financial reporting quality, consistent with Carcello and Nagy
(2004) and Johnson et al. (2002). The proportion of 0.3911 which is less than 1
confirms that the odds of a likelihood of accounting misstatements is less likely to occur
in Big 4 clients than non-Big 4 clients.
The thesis further tested whether the audit firm change is a part of the scheme of
controlling shareholders (such as controlling shareholders of a misstating firm change
their auditor in order to avoid being detected for their financial misreporting). Types of
audit switch, guided by Lennox and Pittman (2010), were employed in this examination.
During 2002-2009, 286 out of 2,351 firm-years (12.1%) were audited by new auditors
(17 in the misstatement group and 268 in the non-misstatement group). The previous
results in Table 6.4 Panel B show that the proportion of audit firm changes is
significantly higher for the misstatement group (33.3%) than the non-misstatement
group (11.7%) and there is a systematic variation in the auditor change between the
samples. Following Lennox and Pittman (2010), audit firm changes were classified the
into four groups: lateral switches (either one Big 4 firm to another or one non-Big 4
firm to another), upgrade (from a non-Big 4 firm to a Big 4 firm), and downgrade (from
49
The interpretation is guided by Chen et al. (2003a).
146
a Big 4 firm to a non-Big 4 firm).50
The lateral switch is higher in misstatement years
(71%) than non-misstatement years (45%) and the proportions are statistically different
(Chi2df=1 = 31.5713; p-value < 0.001). A similar examination was performed in the
upgrade and downgrade categories; however, there are no systematic variations between
the sample and the upgrade (Chi 2
df=1 = 1.855 p-value = 0.173) and between the sample
and the downgrade (Chi 2
df=1 = 1.6593; p-value = 0.198).
The study continued examining the relation between the audit switch and the likelihood
of accounting misstatements in a multivariate analysis. Further results are presented in
Table 6.7.
The first model in Table 6.7 is the Model 2 in Table 6.6 included for comparison.51
The
second model in Table 6.7 is an analysis of the relationship between types of audit
switch and the likelihood of accounting misstatement (the lateral switch from a Big 4
auditor to another Big 4 auditor is the baseline of the regression). An alternative
hypothesis is that the misstatement firms are more likely to switch from a Big 4 to non-
Big 4 (BIG_NON, downgrade), when compared with non-misstatement firm-years (e.g.
the controlling shareholders of misstating firms change auditors in order to reduce the
likelihood of detection of an accounting misstatement). A positive sign for the
coefficient of BIG_NON is thus expected. The regression result shows a positive sign of
the downgrade type (BIG_NON), but the coefficient does not statistically differ from
zero at the 0.05 level (p-value= 0.824). Therefore, the research fails to reject the null
50
As found in prior studies in Asia and Thailand, Big 4 audit firms play an important role in the
monitoring system (e.g. Fan and Wong 2005; Pornupatham 2006). Also in this research, the use of a Big
4 audit firm is negatively associated with the occurrence of accounting misstatements. It is thus deemed
that the Big 4 audit firms provide better audit quality and increase financial reporting quality (DeFond
et al. 2000; DeFond and Jiambalvo 1993; Teoh and Wong 1993). Accordingly, a change from a non-Big
4 firm to a Big 4 firm is considered an upgrade. In contrast, a change from a Big 4 firm to a non-Big 4
firm was regarded as a downgrade. The hypothesis is that the upgrade signals an incentive of controlling
shareholders to strengthen the monitoring system (i.e. they are governed by the auditors), while the
downgrade shows a lower intention of controlling shareholders to provide high standard of corporate
governance (i.e. they may govern the auditors).
51The dummy variable of ownership concentration exceeding 25% (D_OWN) is used here, rather than the
continuous variable of OWN. According to Thai laws, an extraordinary general meeting can be held if a
majority of shareholders (exceeding 25% of total outstanding shares) requests and such legal activities
as dismissing an auditor can be done in this meeting. The research is hypothesising that controlling
shareholders use their higher proportion of control rights to avoid the auditors’ monitoring by changing
the auditor. Therefore, a dummy variable of D_OWN is appropriate for use in this context.
147
hypothesis that there is no relationship between the downgrade and the appearance of
accounting misstatements. Prior studies (e.g. Lennox and Pittman 2010) do not find
evidence for this relationship.
Table 6.7: Logistic Regression Examining Types of Audit Firm Change
(1) (2) (3)
VARIABLES Table 6.6
Model 2
Audit Firm
Change
Audit Partner
Change
Coefficient Coefficient Coefficient
(z-statistic) (z-statistic) (z-statistic)
AUDCHG 0.8738** 0.9152**
(2.335) (2.349)
BIG_NON 0.1628
(0.222)
NON_NON 0.9959**
(2.102)
NON_BIG 2.1657***
(2.942)
PARTNER 0.2112
(0.554)
D_OWN a
0.5931* 0.5502 0.5997*
(1.660) (1.587) (1.677)
FAM -0.1985 -0.2616 -0.1952
(-0.466) (-0.619) (-0.459)
CROSS -0.1888 -0.201 -0.1846
(-0.302) (-0.310) (-0.295)
LEV 1.5492** 1.5155** 1.5299**
(2.366) (2.328) (2.389)
ISSUE 0.5399 0.5389 0.5475
(1.494) (1.461) (1.510)
NFCF 1.1974** 1.2048*** 1.2007**
(2.569) (2.672) (2.572)
MB 0.0932 0.0888 0.0923
(0.938) (0.898) (0.930)
REHAB -0.0962 -0.1154 -0.0854
(-0.146) (-0.175) (-0.131)
BIG -1.0841** -1.2238** -1.0873**
(-2.214) (-2.416) (-2.224)
DUAL 1.1853*** 1.1679*** 1.1856***
(2.948) (2.912) (2.955)
LNSIZE -0.2417 -0.2244 -0.2433
(-1.317) (-1.266) (-1.330)
148
(1) (2) (3)
VARIABLES Table 6.6
Model 2
Audit Firm
Change
Audit Partner
Change
Coefficient Coefficient Coefficient
(z-statistic) (z-statistic) (z-statistic)
AGE 0.0038 0.0027 0.0035
(0.216) (0.146) (0.203)
Constant -3.8969** -3.8687** -3.9217**
(-2.395) (-2.423) (-2.396)
Industry dummies Included Included Included
Year dummies Included Included Included
Observations 2,351 2,351 2,351
McFadden's pseudo R2 0.300 0.307 0.300
Model chi-square 273.2 265.5 279
Degrees of freedom 26 28 27
p-value <0.0001 <0.0001 <0.0001
Number of clusters (firms) 387 387 387 Table 6.7 presents logistic regression results for the examinations into types of audit firm change
(Model 2) and an audit partner change (Model 3). Model 1 is from Table 6.6, Model 2. The dependent
variable is a dichotomous variable of an occurrence of an accounting misstatement. BIG_NON is a
dummy variable of 1 if a firm changes its auditor from a Big 4 firm to a non-Big 4 firm (downgrade);
0 otherwise. NON_NON is a dummy variable of 1 if a firm changes its auditor from a non-Big 4 firm
to another (lateral switch); 0 otherwise. NON_BIG is a dummy variable of 1 if a firm changes its
auditor from a non-Big 4 firm to one Big 4 audit firm (upgrade); 0 otherwise. PARTNER is a change
in an audit partner from the current audit firm; 0 otherwise. All other variables are defined in Table
6.3. Standard errors are robust by firm-level clustering. ***, **, and * denote significance at the 1%,
5%, and 10% levels, respectively (a two-tailed test of whether the coefficient is equal to zero).
a The dummy variable of ownership concentration exceeding 25% (D_OWN) is used here, rather than
the continuous variable of OWN. An auditor change must be approved by stockholders in annual
meetings. According to Thai laws, an extraordinary general meeting can be held if a majority of
shareholders (exceeding 25% of total outstanding shares) requests and such legal activities as
dismissing an auditor can be done in this meeting. The research is hypothesising that controlling
shareholders use their higher proportion of control rights to avoid the auditors’ monitoring by
changing the auditor. Therefore, a dummy variable of D_OWN is appropriate for use in this context.
The second model also tests other types of audit switch. The statistically significant
results appear in the coefficients of lateral switch (NON_NON) and upgrade
(NON_BIG), which are different from zero at the 5% level. Both have a positive
coefficient. For those firms that have used a non Big 4 audit firm, the likelihood of
accounting misstatement increases when they change their auditor (no matter who is the
new auditor). Since the likelihood increases even in the upgrade switch, it might imply
an inherent risk that occurs in the first year of audit engagement, rather than an intention
of controlling shareholders in changing the auditor. A possible reason for this involves
the loss of important client-specific knowledge (e.g. Johnson et al. 2002; Livne and
149
Pettinicchio 2011; Stanley and Todd DeZoort 2007). If this is the case then a change in
an audit partner from the same audit firm should have a different result on the likelihood
of accounting misstatements.
The third model in Table 6.7 is then additionally presented to determine whether an
audit partner change and an audit firm change are associated with the likelihood of
accounting misstatements differently. If the audit risk occurs due to the loss of client-
specific knowledge, a new audit partner from the same audit firm should be less
concerned because the client-specific knowledge remains (e.g. prior working papers and
some members of the audit team who have experience of auditing similar clients).
Consequently, the coefficient of the relationship between an audit partner change
(PARTNER) and the likelihood of accounting misstatements should be smaller than that
of the audit firm change (AUDCHG) and the likelihood of accounting misstatement. In
Model 3, an audit partner change is positively associated with the likelihood of
accounting misstatement, and its effect on the likelihood (the coefficient of 0.2112) is
smaller than an audit firm change (the coefficient of 0.9152). Nonetheless, the
coefficient of PARTNER does not statistically differ from zero at the 0.05 level.
Therefore, the propensity of an accounting misstatement increases when new auditor
partners come from a new audit firm (which is consistent with the original result in the
first model), but the propensity is not affected if new audit partners come from the same
audit firm. Some previous studies (e.g. Bamber and Bamber 2009; Livne and
Pettinicchio 2011) suggest that a change in audit partner can bring “fresh eyes” which
helps to increase the auditor critical capacity. If that were so then a new audit partner
change would be negatively associated with the likelihood of accounting misstatements;
however, this is not found in the Thai sample.
To summarise, although an auditor change can signal an accounting misstatement, there
is no significant evidence to support the view that controlling shareholders change
auditors because they want to avoid being detected (i.e. the coefficient of downgrade is
not significant). On the other hand, an auditor change is deemed to increase an audit risk
to new auditors in their first year of audit. This result is consistent with prior studies
(e.g. Carcello and Nagy 2004; Johnson et al. 2002) showing a negative relationship
150
between short-term audit tenure and quality of financial reports. An audit firm change is
found to have a negative result on the quality of financial reports of Thai firms (i.e. the
likelihood of accounting misstatements increases) but a change in audit partner alone
does not.
One might question the relationship between audit opinion and the propensity for
accounting misstatements. This study has excluded this aspect in the analysis because
an audit opinion is an output from monitors, rather than a corporate governance
mechanism in the monitoring process. It can be incorrectly expressed if an auditor is
incompetent. Having investigated the audit reports for the 51 misstatement firm-years,
this study has found that only 15 observations (29%) were detected and reported by the
auditors in their audit reports. Six auditors were suspended by the Securities and
Exchange Commission, Thailand due to their audit failure. Therefore, audit opinions
tend not to be a reliable antecedent of accounting misstatements in Thailand. The
research, nonetheless, tested the effect of audit opinions. A dummy variable is used,
taking the value of 1 when the auditor has a modified audit opinion; 0 otherwise. The
proportion of firms obtaining an audit report with a modified audit opinion is 43% for
the misstatement group and 10.17% for the control group and they are statistically
different at the p-value < 0.01. A regression result shows a positive association between
the appearance of modified audit opinions and the occurrence of accounting
misstatements at the 0.05 level [the coefficient of 1.4532, robust standard error of 0.539,
and p-value of 0.007 (two-tailed)]. While this association importantly appears in Thai
samples, it is not statistically significant in the U.S. samples (e.g. Skousen et al. 2008;
Skousen and Wright 2006).
To summarise, this section has examined the determinants of accounting misstatements
in Thai firms. Types of audit firm changes have also been assessed. The next section
will present robustness tests for the research results.
151
6.5 Robustness Tests
6.5.1 Rare Events Logistic Regression
Since the proportion of the accounting misstatements cases (i.e. the event) to the non-
accounting misstatements observations in this study is low at 2.07% (51/2,452), which
is considered a rare event (King and Zeng 2001a, c), a rare events logistic regression
was estimated to assess the robustness of the results. Such analysis is necessary because
a traditional logit models underestimates the probability of an event, P(Y=1), and
overestimates coefficients of explanatory variables in the rare event situation. The
estimates from rare events logit models are less biased and have a smaller mean squared
error (King and Zeng 2001c). The possibility of a Type I error can, therefore, decrease
and the logistic regression analysis is robust. The results of rare events logit model are
presented in Table 6.8.
Table 6.8: Rare Events Logit Model versus Traditional Logit Model
Min -0.245 -0.052 -0.185 -0.245 0.245 -0.245 -0.245
Max 1.387 0.583 1.387 1.387 0.420 1.387 1.387
Table 7.3 reports descriptive statistics of the variables for the examination into the consequences of
accounting misstatements. Panel A comprises summary statistics of the external financing activity
measures, while Panel B illustrates those of the explanatory variables. All variables are defined in Table
7.2. The descriptive statistics are presented by relevant period of the misstatements. a Except for sales, all values are reported after being winsorised. Some maximum numbers across the
periods might therefore be identical, such as the maximum for LEVC because of the winsorisation. The
data for sales (the measure of firm size) were transformed using the natural logarithm function.
Panel B in Table 7.3 comprises the summary statistics for control variables. Regarding
internal wealth (i.e. OCF, CASH, and INV), misstating firms have a lower balance of an
average internal wealth along the five-period window. In contrast, they have a higher
average amount of tangible assets (PPE). On average, the market value of assets
(Tobin’s Q) is higher for misstating firms. The leverage ratios (LEVC) for the
misstatement periods’ firms are double that of the control group. However, after the
173
announcement, the leverage ratio of misstating firms has gradually reduced from 0.545
in year t to 0.473 in year t-2. This decline is consistent with that of the U.S. sample
when debt covenant violations are revealed (Roberts and Sufi 2009). The misstating
firms are smaller than the control group, when measured by sales (SALES).
The average interest rate (INT) is higher for the misstating firms in the pre-
announcement periods but it becomes the lowest in the misstatement year. This incident
appears to confirm the findings in Chapter 6 where one important incentive of Thai
firms is to minimise cost of capital (and misstating firms obtain this benefit in the
misstatement year). The investment demand (INVEST) of misstating firms fluctuates.
Before the misstatement year, the average investment is lower than that of the control
group, but it is increased and close to an average for the control group in the
misstatement year. However, soon after announcing accounting misstatements, the
investment demand for misstating firms suddenly reduces. This reduction is in line with
Kedia and Philippon (2009), who find a decline in growth rate of capital expenditures in
misstating firms after the announcement of restatements.
7.4.2 Correlations
Both Spearman’s (above the diagonal) and Pearson’s (below the diagonal) correlation
coefficients are presented in Table 7.4. The greatest correlation coefficient is the
correlation of INV and PPE (-61.4%, Pearson and -58.6%, Spearman). Most of the
results for significance levels from Pearson’s and Spearman’s tests are in line, except
for some cases (e.g. the correlations of PROCEED and CASH, STDEBT and INT, and
LTDEBT and PPE). A major difference in the two tests appears in a positive correlation
between INT and LEVC (3.2%, Pearson and 24.7%, Spearman) and a positive
correlation between LNSALES and Q (2.1%, Pearson and 17.9%, Spearman). This can
be caused by extreme outliers. A diagnostic test of multicollinearity assumption and
robust regression analysis will be conducted after the multivariate regression results
(Section 7.4.4) are reported. Since the variables are the ratio type of data, the analysis is
primarily restricted to the parametric test. The following description employs the
correlation coefficients from Pearson’s approach.
174
Table 7.4: Correlation Matrix for the Financial Characteristics of Misstating and Non-Misstating Firms
LTDEBT OCF CASH INT INV PPE LEVC Q INVESTPROCEED STDEBT
Table 7.4 reports the correlation coefficients for Pearson (below the diagonal) and Spearman (above the diagonal). All variables are defined in Table 7.2.
***, **, and * denote significance at the 1%, 5%, and 10% levels, respectively (a two-tailed test of whether the correlation coefficient is equal to zero).
175
According to the correlation coefficients in Table 7.4, all financing activities
(PROCEED, STDEBT and LTDEBT) are negatively correlated with the post-
announcement period (AFTER) and the correlation coefficient between LTDEBT and
AFTER differs from zero at the 10% significance level. This is in line with the
movements of funds across the periods in Table 7.3 Panel A. The post-announcement
(AFTER) is negatively correlated with operating cash flow (OCF) and positively
correlated with leverage ratio (LEVC). These correlations indicate that a financial
constraint has occurred to the misstating firms after the announcement, which is
consistent with prior studies (e.g. Chen et al. 2009). The post period is negatively
correlated with investment demand (INVEST), which is similar to prior research (i.e.
Kedia and Philippon 2009).
All financing activities (PROCEED, STDEBT, and LTDEBT) are negatively correlated
with cash flow from operations (OCF). The negative correlation between STDEBT and
OCF is the highest (41%) among the three types of funds. This result is consistent with
the pecking order theory (Myers and Majluf 1984) which recommends that there is a
negative relationship between profitability and external financing. On the other hand,
except for the positive correlation of 5.1% between LTDEBT and CASH, the
correlations between the three financing activities and the beginning balance of liquidity
assets (CASH and INV) are not statistically correlated.
The leverage ratio (LEVC) at the beginning of the year is positively correlated with
share issuance activity (PROCEED), but it is negatively correlated with borrowing
activities (STDEBT and LTDEBT). This can occur because highly levered firms have
already committed to the maintenance of high debt repayments and high covenants;
therefore, they are less likely to be able to borrow more and they shift instead to share
issuance. The leverage ratio is also negatively correlated with the beginning cash
balance (coefficient of -42.8%). This high coefficient may reveal a financial constraint
in highly-levered firms. Firms with high growth opportunities (Q) are highly correlated
with the net proceeds (coefficient of 17.5%), but they are not statistically correlated
with borrowing. On the other hand, the average interest rate (INT) is negatively
correlated with borrowing, but is not correlated with share issuance. These two
176
contrasting relationships can be possible. A firm with growth opportunities may prefer
to issue shares because the higher firm value results in greater amount of proceeds (e.g.
Rajan and Zingales 1995). Meanwhile, a firm charged a high cost of debt can decide to
not borrow, or they can borrow lower amounts of net funds.
Investment demand (INVEST) is positively correlated with all financing choices and the
highest correlation coefficient is tied with long-term borrowing (LTDEBT) (32.3%).
This result is consistent with prior research (e.g. Titman and Wessels 1988). It is
reasonable to suppose that the investment demand (INVEST) is positively correlated
with the amount of brought forward CASH (coefficient of 23.2% - the higher the cash
is, the higher investment demand can be). Investment demand falls when a company is
highly levered (LEVC) (correlation coefficient of -17%). Firm size (LNSALES) is
positively correlated with borrowing and this result is consistent with the previous
literature (e.g. Rajan and Zingales 1995; Wiwattanakantang 1999). However, firm size
is negatively correlated with the net proceeds (though it is positive in the Spearman’s
test). This finding is in contrast to the previous literature (i.e. Smith 1977). Overall,
therefore, with the exception of the negative correlation between firm size and equity
issuance, all correlations appear to be in the predicted direction.
7.4.3 Dynamics of the Flow of Capital
This section of the chapter will explore the dynamics of net capital from external
financing activities around the misstatement year, and it will then compare these with
the average regular periods (i.e. the observations of non-misstating firms and the
observations of the misstating firms not falling into the five periods of the misstatement
window).54
The analysis here comprises graphical analysis and comparisons of two
means.
54
If the observations of the misstating firms that fall outside the five period window are excluded from the
control group, the research results for this and the next subsections are unchanged. The average external
financing funds (EXFIN) for the regular periods slightly increased from 0.0131 to 0.0135. The
coefficient of the AFTER variable in Section 7.4.4 changed from -0.0231 to -0.0238 and it differs from
zero at the 5% level (p-value=0.03 for a two-tailed test).
177
a) Graphical analysis
The bar graph in Figure 7.1 helps understand the dynamics of financing activities for
misstating firms. The vertical axis is the average amount of net capital inflow from all
financing alternatives, scaled by total assets. The horizontal axis represents the event
periods.
Figure 7.1: Total External Funds of the Sample of Misstating Firms
Mean Regular Misstatement Periods Periods t-2 t-1 t t+1 t+2
(% of total assets) (n=2320) (n=22) (n=29) (n=66) (n=30) (n=28) EXFIN 1.31 2.26 3.18 5.22 -2.29 -0.34 The table shows an average EXFIN, a summation of funds from stock issuance and borrowing for a year
disclosed in cash flow statements divided by total assets, by period. The numbers are as same as those
numbers shown in Table 7.3, but the numbers were rounded off in Table 7.3.
In regular periods, control firm-years have an average annual net capital inflow about
1.31% of total assets. For misstating firms, an average net cash inflow gradually
increases from 2.26 % of the total assets in year t-2 to 5.22% in year t, which is higher
than the average regular periods. The highest net capital inflow for the misstating firms
is in year t. Misstating firms experience a sharp decrease in the net capital inflow
immediately following the announcement. The financing ability falls from a positive of
5.22 % of total assets to a negative of 2.29% in year t+1 and, therefore, the
178
announcement is associated with an approximate change in net capital flow of about
7.51% of corporate total assets in one year. The adverse effect lasts until year t+2. Even
though the adverse impact seems relieved in year t+2, the balance is still negative and is
lower than the average regular periods.
In summary, according to Figure 7.1 an ability of a misstating firm to get new finance
tends to be constrained after the revelation of accounting misstatements. At the very
least, the amount of capital inflow from share issuance and borrowing is less than the
amount of cash outflow (e.g. debt repayment and repurchase treasury stocks).
Figure 7.2: Total External Funds by Type and Period
Mean Regular Misstatement Periods
Periods t-2 t-1 t t+1 t+2
(% of total assets) (n=2320) (n=22) (n=29) (n=66) (n=30) (n=28)
PROCEED 1.21 3.01 3.34 3.93 0.40 1.39
STDEBT 0.37 0.45 0.67 2.01 -0.38 0.06
LTDEBT -0.39 -1.20 -1.79 -0.89 -2.19 -1.76
The table specifically shows means of external funds by alternative and by period. PROCEED is a ratio
of net proceeds from share issuance described in cash flow statements divided by total assets. STDEBT
is a ratio of net cash flow from short-term borrowing activity shown in cash flow statements divided by
total assets. LTDEBT is a ratio of net cash flow from long-term borrowing activity shown in cash flow
statements divided by total assets. The numbers are as same as those numbers in Table 7.3, but the
numbers were rounded off in Table 7.3.
179
Figure 7.2 shows more detail for the flow of capital by type of financing. In regular
periods the magnitude of net short-term borrowing (0.37%, STDEBT) nearly equals an
average of net long-term debt (0.39%, LTDEBT), but the balance of LTDEBT is
negative. Share issuance tends to be an important source of funds that increases
liquidity to a firm. On average, a firm receives net capital from share issuance of
approximately 1.21% of total assets per year. Particularly focusing on misstating firms
(Figure 7.2), there is an increase in the amount of net proceeds before the misstatement
year (years t-2 to t), as well as an increase in financing need for long-term debt
repayment. Although there is a large negative amount of long-term borrowing year t-1,
the misstating firms earn a larger amount of capital from share issuance. The financial
status of misstating firms appears to be the best in the misstatement year when they
have the highest amount of capital inflow from share issuance and short-term borrowing
and the lowest amount of cash outflow for long-term debt repayment.
Suddenly after the annoucement of accounting misstatement (year t+1), however, the
highest quickly become the lowest. There is a sharp drop in net proceeds from share
issuance, from 3.93% to 0.40% of total assets. Also both short-term and long-term
alternatives remain negative. The amount raised from borrowing is smaller than the
amount available for repayment. Year t+1 tends to be a difficult time for misstating
firms since the capital inflow from equity reduces and the borrowing capability is
constrained. Although in the following year the situation lessens in terms of share
issuance, the long-term debt repayment is still large. To sum up, the flow of capital
during the post-announcement period: the net capital outflow for external financing
activities is about 4.33 (0.38+2.19+1.76) percent of corporate total assets, while the net
cash inflow is 1.85 (0.04+1.39+0.06) percent of total assets. Unless they have enormous
internal wealth, misstating firms are inclined to be financially constrained after the
annoucement of accounting misstatements. This result is in line with those of previous
studies (e.g. Chen et al. 2009).
Although Figure 7.1 and Figure 7.2 show the differences in financing activities around
the event period as compared with regular periods, these differences may not be
180
statistically significant. Therefore, the next subsection tests whether these differences
differ from zero.
b) Mean difference between groups
Results of a stastistical t-test for a difference in means between regular periods and the
event period is reported in Table 7.5 below.
Table 7.5: Mean Differences in Financing Activities between Regular and
Misstatement Periods
Periods REGULAR BEFORE DURING AFTER
t-2 to t-1 t t+1 to t+2
Statistics Mean Mean Mean Mean
(t-statistic) (t-statistic) (t-statistic)
EXFIN 0.0131 0.0278 0.0522 -0.0135
(1.0342) (3.0967)*** (-2.4413)**
PROCEED 0.0121 0.0320 0.0393 0.0087
(1.6890)* (2.4709)** (0.5408)
STDEBT 0.0038 0.0058 0.0201 -0.0017
(0.2761) (1.9190)* (-1.02)
LTDEBT -0.0039 -0.0154 -0.0089 -0.0198
(-1.3716) (-0.4815) (-2.0249)**
Observations n=2,320 n=51 n=66 n=58 Table 7.5 compares means of financing activities for the misstatement periods (BEFORE, DURING
and AFTER) with those of regular periods. T-tests are used to evaluate differences in means. ***, **,
and * denote significance at the 1%, 5%, and 10% levels, respectively (a two-tail test of whether the
difference in means equals to zero). All variables are defined in Table 7.2.
In Table7.5, the observations during year t-1 and t-2 were combined into a group of the
observations before the misstatement year (BEFORE) and the observations during year
t+1 and t+2 were combined into a group of the observations after the misstatement year
(AFTER).55
The observations during the misstatement year were named DURING. The
alternative hypothesis for the t-tests in Table 7.5 is that the difference in means of net
capital for regular periods and a misstatement period differs from zero.
55
Besides being consistent with previous studies, the combination is beneficial to the statistical analysis
because the number of observations in year t-2 and t+2 is small (<30).
181
As presented in Table 7.5, results of the t-tests are as follows. Firstly, the total amount
of external funds (EXFIN) for the two years before the misstatement (0.0278) is higher
than that of the average regular periods (0.0131), but it is not statistically different at the
0.05 level. By type of financing activity, the average net proceeds (PROCEED) is
higher for misstating firms (0.0320) than regular periods (0.0121), but the difference is
significant at the 10% level (two-tailed). The net capital inflows from borrowing
(STDEBT and LTDEBT) between the two groups are not statistically different.
Therefore, before the misstatement year there is no significant difference in the flow of
capital of the misstating firms and the control group at the 5% level.
Secondly, during the misstatement year (the DURING column) an average amount of
total capital (EXFIN) for the misstating firms is 5.22% of total assets. This is higher
than that of the average regular periods by 3.91% (5.22-1.31%) and the difference is
statistically signficant at the 0.05 level. Specifically, the amounts of funds from share
issuance (PROCEED) and short-term borrowing (STDEBT) for the misstating firms are
significantly higher than those of the average regular periods at the 0.05 and 0.10 level,
resepectively. The long-term debt is not statistically significant, however. Consequently,
misstating firms receive a greater amount of capital inflow than the control group does
in the misstatement year and this amount comes from share issuance activity.
Thirdly, there seems to be a penalty from capital providers after the annoucement of
accounting misstatements. The total amount of capital inflow to total assets (EXFIN) is
lower for the misstating firms (-0.0135, AFTER versus +0.0131, REGULAR), and the
difference differs from zero at the 0.05 level (t-statistic of -2.4413). Specifically, the
significiant reduction of the capital is caused by a sharp decrease in long-term
borrowing (t-statistic of -2.0249).
A reason for the decrease in net long-term debt may be explained by the incentive
involved in debt covenant violations. An incentive to avoid debt covenants is one of the
causes of accounting misstatements in Thailand (see Chapter 6). When the misreporting
is revealed, the existing creditors tend to scrutinise the finanical reports. If they find that
182
the firms actually violate the covenants then they can use their acceleration rights,
demand immediate repayment, and refuse further credit. Meanwhile, the possibility to
obtain finance from a new creditor is unlikely because the firm has just restated their
financial reports. The existing evidence in the previous literature shows that borrowers
rarely switch lenders and are unable to obtain more favourable financing from
alternative sources after a covenant violation (Roberts and Sufi 2009). Consequently,
the amount of long-term borrowing in years t+1 and t+2 can become extremely
negative, as shown in the sample statistics above.
In summary, before the misstatement year there is no significant difference in the
financing activities between the misstating firms and other firms in the Thai capital
market. During the misstatement year the misstating firms have an exceptional ability to
get external financing (particularly from share issuance). After the revealation of
misstatements there is an ecomomic cost imposed on the misstating firms, which can be
measured by the flow of capital from external financing activities.
The analyses in this section, however, are based on the difference in means between two
periods; none of the other factors involving financing activities is considered. The next
section (i.e. Section 7.4.4) will assess the impact of an announcement on the flow of
capital for misstating firms in the first two years after the announcement in a form of
multivariate regression analysis. Section 7.5 will re-examine the economic benefits and
costs of accounting misstatements after controlling for other factors.
7.4.4 Multivariate Analysis
This section assesses the economic effect of an announcement of accounting
misstatement on external financing activity as measured by the flow of capital scaled by
total assets. A linear regression model for the analysis, which has previously presented
in Section 7.3.1, is repeated.
183
Linear regression model:
ti,t
t
tt
Κ
ΚiΚ
ti,ti,ti,ti,-ti,
-ti,-ti,-ti,ti,τtiτti,
εββ
βββββ
βββββα
+YEAR+,IND+
INVEST+INT+LNSALES+Q+LEVC+
PPE+INV+CASH+OCF+AFTER+=EXFIN
∑∑9
1=
7
1=
∈
1098716
15141322+)i(<<)(10
where τ (i) is the misstatement year for firm i and t is the current fiscal year for firm i.
All variables are defined in Table 7.2.
The coefficient of AFTER is of interest. Creditors and equity holders are concerned
about firms’ credibility and the reliability of their financial reporting process after an
announcement of accounting misstatements and, therefore, the cost of capital required is
higher (Graham et al. 2008; Hribar and Jenkins 2004). Consequently, this study predicts
that the flow of capital that the misstating firms receive after the announcement is likely
to be smaller than that of the other years (Hypothesis 4, Chapter 5). A dummy variable
is thus employed to measure the effect of the announcement, which equals 1 for the first
two fiscal years after the announcement (AFTER) and its coefficient is expected to be
negative. The control variables are: firstly, seven determinants of the magnitude of
external funds examined by Almeida and Campello (2010); secondly, two extra
empirical factors added by the research (i.e. an average interest rate and investment
demand); and thirdly, seven industry dummies and nine year dummies. The standard
errors are adjusted for firm-level clustering.
Table 7.6 shows the regression results for the impact of misstatement announcements on
external financing activities.
184
Table 7.6: Linear Regression Analysis for the Effect of an Announcement of
Industry dummies Included Included Included Included
Year dummies Included Included Included Included
Observations 2,495 2,495 2,495 2,495
Adjusted R2
0.489 0.489 0.119 0.404
F-test statistic 39.64 38.18 4.497 18.49
Model degrees of freedom 24 25 25 25
Residual degrees of freedom 384 384 384 384
p-value for F-test <0.0001 <0.0001 <0.0001 <0.0001
Number of clusters (firms) 385 385 385 385 Table 7.6 presents regression results for the analysis whether an announcement of an accounting
misstatement is negatively associated with external financing activities of misstating firms in years t+1
185
and t+2 (Hypothesis 4 set out in Chapter 5), after controlled for other factors. EXFIN is a summation of
net proceeds from stock issuance and net debt from borrowing for the year disclosed in cash flow
statements divided by total assets. PROCEED is a ratio of net proceeds from share issuance described
in cash flow statements divided by total assets. DEBT is a ratio of net cash flow from borrowing
activity shown in cash flow statements divided by total assets. AFTER is a dummy variable taking the
value of 1 for the two firm-years after the announcement year (t+1 and t+2); 0 otherwise. FIRST is a
dummy variable taking the value of 1 for the first firm-year after the announcement year (t+1); 0
otherwise. SECOND is a dummy variable taking the value of 1 for the second firm-year after the
announcement year (t+2); 0 otherwise. All other variables are defined in Table 7.2. Standard errors are
robust by firm-level clustering. ***, **, and * denote significance at the 1%, 5%, and 10% levels,
respectively (a two-tailed test of whether the coefficient is equal to zero). a If all the continuous variables are not winsorised, the significance level of an announcement of
accounting misstatements (the AFTER variable) changes from the 5% level to the 10% level (p-
value=0.063), and the control variables, except for the beginning of receivables and inventory (INV),
are not significant at the 5% level.
In Model 1, the coefficient of AFTER is as negative as expected and it differs from zero
at the 0.05 level. Diagnostic tests for regression assumptions and robust regression
analysis (presented in Appendix D) indicate the goodness of fit of the model.56
Therefore, the capital inflow that occurred to the misstating firms reduces for the first
two firm-years after the announcement than in the other firm-years. The next paragraph
presents an interpretation from the regression.
In a regular period, a firm has an average net capital outflow from external financing of
approximately 0.19% of total assets a year (e.g. the net capital outflow for debt
repayment is higher than the net capital inflow from share issuance and borrowing).
When a firm announces an accounting misstatement (or it is revealed), the average net
capital outflow increases to 2.5% (0.19+2.31) of total assets. Internal funds tend to be
used for this outflow of capital. Unfortunately, the existing internal funds of the
misstating firms are deemed to be poor. As reported in the summary statistics of Table
7.3, the internal wealth (i.e. OCF, CASH and INV) is lower for the misstating firms
than the average control firm-years along the misstatement periods (year t-2 to year
t+2). Therefore, the misstating firms seem to be financially constrained. This result is
56
As reported in Appendix D, since a diagnostic test of the normality of the residuals shows some extreme
outliers, robust regression models were employed to check the research results in the presence of
outliers. The coefficient of AFTER is -0.0213 in the M-estimator (Huber 1981) approach and is -0.0234
in the MM-estimator (Yohai 1987) approach. The original coefficient of – 0.0231 in the Model 1 of
Table 7.6 is close to the coefficient in the MM estimator, which is a recommended approach for robust
regression (Verardi and Croux 2009). The research result is, therefore, robust to outliers/non-normality.
186
consistent with the results which are to be found in the previous literature (e.g. Chen et
al. 2009).
Model 2 shows the results by year. The coefficient of the first year dummy (FIRST) is
statistically significant at the 0.05 level, but the coefficient of the second year dummy
(SECOND) is not. These indicate that there is a sharp decrease in capital inflow by
2.56% of total assets immediately after the announcement (year t+1). In year t+2,
although the decrease remains (a decrease of 2.05%), it does not result in a statistically
significant difference in means of the net capital for the misstating firms and the control
firms. The research also examined the effect on year t+3, but the coefficient of the third
year dummy is not significant at the 0.05 level (p-value of 0.138). Therefore, there is
unlikely to be a long term effect for an announcement of accountings misstatements.
Models 3 and 4 illustrate the effect on two choices of external financing. In Model 3 the
announcement has a significant impact on the net proceeds from share issuance,
particularly during the first year. The amount of net proceeds reduces by a magnitude of
1.18% of total assets for misstating firms. The net capital from borrowing activity also
reduces in Model 4 (1.11% in the first year and 1.12% in the second year); however, the
coefficients do not statistically differ from zero (t-statistic = -0.911 for FIRST and -
0.835 for SECOND). Referring to the determinants of accounting misstatements in
Thailand (Chapter 6), an antecedent of important incentive for Thai firms to misstate
financial reports is to avoid debt covenant violation. It implies that firms are afraid of
the cost of violation (e.g. the lenders’ demand for immediate repayment or a higher cost
of debt for future credit) and that they decide to mislead the lenders. However, in Model
4 the reaction from lenders, measured by the flow of incoming capital, seems unaffected
by the announcement of accounting misstatements.57
The antecedent and consequence
seem to be conflict (if the debt covenant violation is costly as the firms expect, creditors
should react negatively to the misstating firms and that the amount of incoming capital
should be significantly reduced) in the multiple regression analysis. One explanation for
57
In a simple regression analysis where AFTER, industry dummies, and year dummies are the explanatory
variables, the relationship between net debt (DEBT) and AFTER is statistically significant at the p-
value of 0.001 (the coefficient of -0.02389 and t-statistic of -3.38). However, the coefficient is not
significant when the analysis controls for other factors.
187
this is that the creditors take no action after perceiving the misstatements; for example,
in the U.S. sample (Roberts and Sufi 2009) 62.6% of creditors grant waivers to the
borrowers after the covenant violations. Alternatively, the misstating firms borrow from
other lenders. Further examination into the lender parties, details of debt contracts and
defaults is, however, difficult for this thesis because of data unavailability.
The results regarding the control variables are consistent with prior research. The
internal wealth (OCF and CASH) is significantly negatively associated with the external
financing; this result is consistent with the pecking order theory (Myers 1984; Myers
and Majluf 1984). However, the beginning balance of receivables and inventories (INV)
has no significant relationship with the external financing in the Thai sample at the 0.05
level. The high amount of existing tangible assets (PPE) allows firms to raise more
external financing, particularly a borrowing activity (Model 4). A pre-existing high
leverage ratio (LEVC) impedes a firm in borrowing (Model 4), but does not affect share
issuance (Model 3). A firm with a higher investment opportunity (Q) earns a higher
amount of external finance. Specifically, the market-to-book value of assets (Q) is
positively associated with both share issuance (Model 3) and borrowing activity (Model
4). This relationship is in contrast to the results that have been found in the previous
literature; for example, Myers (1977) and Rajan and Zingales (1995) both found that Q
is positively associated with equity choice but negatively associated with debt choice.
This contrast might arise because the financial system of Thai firms are bank-oriented
(Alba et al. 2003) and equity is issued only when firms have no more debt capacity
(Wiwattanakantang 1999). A firm may take the opportunity of having high market-to-
book value of assets (an implication of high expected future cash flows) to get a lower
cost of debt from banks and, therefore, the Q measure can be positively associated with
borrowing activity.
Firm size (LNSALES) is positively associated with the net amount of external financing
(Models 1 and 2) and borrowing activity (Model 4); however firm size is negatively
associated with share issuance (Model 3), which is in contrast with both the
expectations of this study and with the previous literature (e.g. Rajan and Zingales
1995). Because size is based on the level of sales, it may indicate the amount of
188
internally generated funds (i.e. the more the amount of sales is, the more generated cash
flow comes in, as in Table 7.4, firm size is +19% correlated with the operating cash
flows). Accordingly, larger Thai firms may find it unnecessary to issue shares and so
the negative relationship between size and external financing appears. Nevertheless, the
effect of firm size on financial policy is still ambiguous in previous empirical studies
(Rajan and Zingales 1995).
The average interest rate (INT) is negatively associated with the net capital that is raised
from borrowing. This is rational: the interest rate is the cost of debt, and so the higher an
interest rate is then the lower the amount of debt a firm can raise will be. In contrast,
although the interest rate is positively associated with the net proceeds from share
issuance, the coefficient is not significant. These results imply that when the cost of
debt is high a firm may shift from borrowing to equity issuance (e.g. the information
asymmetry costs which are charged by equity investors is lower than cost of debt
quoted by lenders), but the cost of debt does not directly affect the amount of proceeds
from share issuance. The investment demand (INVEST) is strongly associated with the
external financing, and this result is consistent with the previous literature (e.g. Titman
and Wessels 1988).58
In summary, the regression results support an alternative hypothesis (Hypothesis 4,
Chapter 5) that there is a negative relationship between an announcement of accounting
misstatements and external financing activity of misstating firms in years t+1 and t+2.
After the model has controlled for certain financial characteristics, the announcement of
58
This thesis accepts that the cost of debt is somehow integrated in the amount of net capital (EXFIN)
because the underlying assumption presumes that the higher cost of capital results in a lower net capital
when the demand of funds is fixed. However, when considered separately, the interest rate is a
significant determinant of borrowing activities (Model 4) but not of stock issuance activities (Model 3).
This should allow this research to assure that this interest rate can be used to control the decision on the
external financing activity choices. Having the interest rate included increases the power of the
regression model and, therefore, it allows the research to assure the research result on the AFTER
variable. Without adding the interest rate in the regression model, the coefficient of AFTER is still
significant (the coefficient changes from -0.02314 to -0.02311 and the p-value changes from 0.024 to
0.027). In the same vein, if the model contains only the empirical variables that were suggested by
Almeida and Campello (2010) (i.e. the interest rate and investment demand measures are excluded), the
coefficient of AFTER is significant at the p-value of 0.006 but the adjust R2 reduces from 48.9%
(Model 1, Table 7.6) to 37.19%.
189
accounting misstatement has an impact on a decrease in capital inflow for the misstating
firms in the first two years after the announcement. The decrease is about 2.13% of total
assets below the mean of regular periods. The reduction is seen most emphatically in the
proceeds from share issuance and the reduction is greater in the first year than in the
second year after the announcement.59
This section has assessed an economic cost of an announcement of accounting
misstatements on the flow of capital. The next section is an empirical study into both
the economic cost and benefit of an accounting misstatement.
7.5 Economic Costs and Benefits of Accounting Misstatements
This section aims to include both an economic benefit and cost of an accounting
misstatement into one model. As discussed in Chapter 3, positive accounting
researchers (e.g. Dechow et al. 1996; Rezaee 2005) believe that there is a cost-benefit
trade-off in financial reporting decision but the empirical evidence is limited (Dechow
et al. 2010; Wahlen 2004). The research extends the literature in terms of the net capital
from external financing activities. The amount of capital occurred in misstating firms
around the misstatement periods was observed.
According to the analysis in the dynamics of capital of misstating firms in Section 7.4.3,
the average capital flow (EXFIN) of misstating firms is significantly higher than that of
the control group in the misstatement year (year t). This may signal a benefit of
59
One might argue that the smaller amount of capital in year t+1 may occur because misstating firms have
had a great amount of cash from “stockpiling” at a lower cost of capital during the misstatement year
(year t) and that they do not need funds in year t+1. This situation can happen; however, after observing
the internal wealth and investing activities of the misstating firms, the researcher does not see so.
Assuming that the misstating firms use incoming cash flow for investing in property, the amount of
capital (EXFIN, net capital to total assets) and the investing activity (capital expenditure minus
disposal, divided by total assets) in year t and t+1 are observed. On average (see Table 7.3), the
misstating firms earned the capital (EXFIN) 5.2% of total assets in year t and used it almost in the same
amount (5.15% of total assets) for investment (untabulated). The beginning balance of internal wealth
(CASH and INV) in year t+1 (35.2% of total assets) is lower than that of year t (38.6% of total assets)
(See Table 7.3 Panel B). Therefore, it does not seem that the internal wealth of the misstating firms is
high enough that they do not need external funding in year t+1. Consequently, the research finding on
the adverse effect of the misstatement announcement is reliable.
190
financial misreporting in the misstatement year. A dummy variable (DURING) is then
added into the multivariate regression model in the previous section to assess whether
the flow of capital in the misstatement year is higher than that of the other years, ceteris
paribus. It is a proxy for an economic benefit from financial misreporting.
With regard to economic costs, the dummy of AFTER is still retained to measure the
effect of announcement on external financing in the first two years after the
announcement. Having both the benefit and the cost of an accounting misstatement in
one model may enable us to understand a cost-benefit trade-off in financial misreporting
decision. The model is as follows.
Linear regression model:
ti,t
t
tt
Κ
ΚiΚti,ti,
ti,ti,-ti,-ti,-ti,
-ti,ti,τtiττtti,
εββββ
βββββ
βββλα
+YEAR+,IND+INVEST+INT+
LNSALES+Q+LEVC+PPE+INV+
CASH+OCF+AFTER+DURING+=EXFIN
∑∑9
1=
7
1=
∈109
8716514
1322+)i(<<)(1)i(∈10
where τ (i) is the misstatement year for firm i and t is the current fiscal year. All
variables are defined in Table 7.2. This model is similar to the multivariate linear
regression model in the previous section, but it has the dummy variable of DURING
added. The coefficient of DURING is expected to be positive, while the coefficient of
AFTER is expected to be negative.
It is worth noting that the inclusion of the two dummies (DURING and AFTER) does
not differ from the model used in the study by Roberts and Sufi (2009). However, their
interpretation in the model does not examine trading-off costs and benefits; they aim
instead to show the change in the magnitude of net debt issuance in the quarter of
violation and eight quarters afterwards.
191
Table 7.7: Linear Regression Analysis for Economic Benefits and Costs of an
Accounting Misstatement, Measured by the Flow of Net Capital
Vichitsarawong, T., Eng, L. L. and Meek, G. K. 2010. The Impact of the Asian
Financial Crisis on Conservatism and Timeliness of Earnings: Evidence from Hong
Kong, Malaysia, Singapore, and Thailand. Journal of International Financial
Management & Accounting 21(1), pp. 32-61.
Viverito, J. 1998. Corporate Governance in the Kingdom of Thailand. Malaysian
Journal of Economic Studies 35(1-2), pp. 231-245.
228
Wahlen, J. M. 2004. Discussion of "the Circumstances and Legal Consequences of
Non-GAAP Reporting: Evidence from Restatements". Contemporary Accounting
Research 21(1), pp. 181-190.
Wang, D. 2006. Founding Family Ownership and Earnings Quality. Journal of
Accounting Research 44(3), pp. 619-656.
Wang, X. and Wu, M. 2011. The Quality of Financial Reporting in China: An
Examination from an Accounting Restatement Perspective. China Journal of
Accounting Research 4(4), pp. 167-196.
Watts, R. L. and Zimmerman, J. L. 1986. Positive Accounting Theory. New Jersey:
Prentice-Hall.
Weisbach, M. S. 1988. Outside Directors and CEO Turnover. Journal of Financial
Economics 20, pp. 431-460.
White, S. 2004. Stakeholders, Structure and the Failure of Corporate Governance
Reform Initiatives in Post-Crisis Thailand. Asia Pacific Journal of Management 21(1),
pp. 103-122.
Whited, T. M. and Wu, G. 2006. Financial Constraints Risk. Review of Financial
Studies 19(2), pp. 531-559.
Wilson, W. M. 2008. An Empirical Analysis of the Decline in the Information Content
of Earnings Following Restatements. Accounting Review 83(2), pp. 519-548.
Wiwattanakantang, Y. 1999. An Empirical Study on the Determinants of the Capital
Structure of Thai Firms. Pacific-Basin Finance Journal 7(3-4), pp. 371-403.
Wiwattanakantang, Y. 2001. Controlling Shareholders and Corporate Value: Evidence
from Thailand. Pacific-Basin Finance Journal 9(4), pp. 323-362.
Wooldridge, J. M. 2006. Introductory Econometrics: A Modern Approach. 3rd ed.
Ohio: Thomson Higher Education.
Yohai, V. J. 1987. High Breakdown-Point and High Efficiency Robust Estimates for
Regression. The Annals of Statistics 15(2), pp. 642-656.
Young, M. N., Peng, M. W., Ahlstrom, D., Bruton, G. D. and Jiang, Y. 2008. Corporate
Governance in Emerging Economies: A Review of the Principal–Principal Perspective.
Journal of Management Studies 45(1), pp. 196-220.
Young, S. 1999. Systematic Measurement Error in the Estimation of Discretionary
Accruals: An Evaluation of Alternative Modelling Procedures. Journal of Business
Finance & Accounting 26(7-8), pp. 833-862.
229
Zhang, Y. and Wiersema, M. F. 2009. Stock Market Reaction to CEO Certification: The
Signaling Role of CEO Background. Strategic Management Journal 30(7), pp. 693-710.
Zmijewski, M. E. 1984. Methodological Issues Related to the Estimation of Financial
Distress Prediction Models. Journal of Accounting Research 22(Supplement), pp. 59-
82.
230
APPENDICES
231
Appendix A: Collection Approach for Ownership Data
The method to gather the data for the ownership proxy is similar to that used by the
prior studies (e.g. Dhnadirek and Tang 2003; Wiwattanakantang 2001), and is as
follows:
1. SETSMART database provides the information on shareholders with
shareholdings of at least 0.5%.
2. The ultimate owner of each firm was identified and categorised into one of four
groups.
The researcher followed Wiwattanakantang (2001) in categorising the owner
identity as:
2.1 Individual or family;
2.2 Foreign investors;
2.3 Thai government; and,
2.4 More than one ultimate owner (such as two founder families).
3. Identifying the ultimate owner was not difficult because most Thai firms are
family-run firms, and the family members are usually both the management and
the shareholders. The last names of controlling shareholders were compared
with the last name of directors and/or the management. The potential ultimate
owner was then checked by a summation of his/her shareholdings. The
shareholders who have the same last name were grouped together as a family.
4. If a shareholder is a private company, a further investigation was performed into
the list of shareholders of this private company. The list of shareholders was
shown in Bor.Or.Jor.5 form, which was requested by the Department of
Business Development, Ministry of Commerce. Further investigation was
performed until the researcher could identify the ultimate owner.
5. Annual reports or company websites were used, where necessary, as
supplementary sources of the ownership information.
6. The percentage of shares owned by the ultimate owner was identified. All the
shares owned by members of the same family were included as one unit of
owner. The research could include all the shares held by relatives of in-laws of
232
the family if this information was disclosed in Form 56-1. If not, then the
percentage of shareholdings could be underestimated.
7. The percentage of shareholdings in this study is voting rights and not cash-flow
rights. This research project could not gather the data until it had satisfactorily
received the number of cash-flow rights because of a time limit and the large
sample size (388 firms with nine fiscal years). Instead, the research used a
dummy variable of 1 if the firm has an ownership arrangement of pyramids
and/or cross-holdings; 0 otherwise. Some prior studies also employed this
dummy measure (e.g. Filatotchev et al. 2005; Wiwattanakantang 2001).
233
Appendix B: Research Sample
This appendix illustrates details of the sample and an approximate amount of the impact of accounting misstatements on accounting items.
Part A: The Accounting Misstatements That Have Been Found By the Securities and Exchange Commission, Thailand (SECT)
An allegation that is later announced as a violation of the Securities and Exchange Act section 312 is considered fraud; otherwise, it is assumed to be an accounting error.
There are 18 misstating firms with 34 misstated firm-years for the determinant part, and 15 misstating firms for the consequence part (DAIDO, SECC, and ROYNET missing).
Firm Company Name (Symbol) Type Year Impact Amount
(million
THB)
% of
Total
Assets in
year t-1
Details of Accounting Misstatements
1 Roynet Plc (ROYNET) Fraud 2002 -earnings 9.217 % 16.60 Personal expenses of the board of director of 2.58 and 8.38
million THB in 2003 and 2002, respectively.
Fraud 2003 -earnings 7.05 12.70 Missing fixed assets of 4.47 million THB in 2003.
Fraud 2006 -earnings 102.41 86.91 Counterfeiting documents to overstate assets and failed to test
impairment of assets.
235
Firm Company Name (Symbol) Type Year Impact Amount
(million
THB)
% of
Total
Assets in
year t-1
Details of Accounting Misstatements
14 Nippon Pack (Thailand) Plc
(NIPPON)
Error 2004
2005
+earnings 1.36(2004)
1.17(2005)
0.26
0.22
Reclassified good returns for the sales in 2004 and 2005, which
the company has later recorded in the 2nd
quarter of 2009.
Error 2005 -earnings 66.59 12.51 Failed to prepare the consolidated statements of the two
companies. Although the percentages of holdings is less than
50% (18.18% and 0.00%) but the company has a control power
over those companies.
The company also corrected the errors of inventory evaluation
and impairment of assets in this year.
Fraud 2008
2009
179.6 26.03 The ex-CEO colluded in misappropriating 179.6 million THB.
15 ABICO Holding Plc (ABICO) Error 2004
2005
2006
-earnings 19(2004)
277(2005)
384.4(2006)
1.83
26.64
36.96
Failed to prepare the consolidated statements of the two
companies. Although the percentage of holdings is less than
50% (49%) but the company has a control power over such
company.
16 Tongkah Habour Plc (THL) Error 2006 -earnings 4.027 0.29 1.Underrecorded expense for production sharing to the
Government, in violation of the agreement.
2.Failed to disclose loan prepayment 11.6 million THB as a
subsequent event.
17 Yarnapund Plc (YNP) Error 2008 -earnings 61.88 0.52 Incorrectly recorded land filling and compaction payments into
cost of building and infrastructure and that had been depreciated
during 2006-2008. Until the detection of error, the company
recorded the expense back to revenue amounting of 34.97
million THB. The restatement included impairment costs of
such assets for 34.22 million THB and reduced depreciation
expense of 7.31 million THB.
18 S.E.C. Auto Sales and Services
Plc (SECC)
Fraud 2006
2007
2008
Assets Not
specified
- Forfeited documents of inventory purchasing. Overstating many
items of assets and no documents support.
236
Part B: The Accounting Misstatements Found By the Companies
There are 15 misstating firms with 17 misstated firm-years for the determinant part; 15 firms for the consequence part. Firm Company Name (Symbol) Type Year Impact Amount
13 Thai Nam Plastic Plc (TNPC) Error 2006 + equity 42.44 2.84 Adjusted gain on assets sold to related parties.
237
Firm Company Name (Symbol) Type Year Impact Amount
(million
THB)
% of Total
Assets in
year t-1
Details of Accounting Misstatements
14 Universal Starch Public
Company Limited (USC)
Error 2006 - earnings 25.71 0.68 1. Did not test an impairment of long term investment for
previous periods.
2. Did not record sales of land help for development in the
prior year.
15 United Flour Mill Public
Company Limited (UFM)
Error
2005
+
unrealised
gain on
investment
11.857 0.40 Did not adjust revaluation surplus on investments (equity).
A Summary Table for the Average Impact Value of Accounting Misstatements By source of data Amount (million THB) % of total assets in year t-1
1. Initiated by the SECT (Panel A) 417.6
(£8.84 million)
20.33
2. Initiated by the company (Panel B) 29.0
(£0.60 million)
1.21
Total 446.6
(£9.44 million)
By type of accounting misstatements
(The third column of the Table)
Amount (million THB)
% of total assets in year t-1
1. Fraud (n=14 firms) 684.98
(£14.13 million)
28.34
2. Error (n=30 firms) 72.88
(£1.50 million)
5.76
T-test for a difference in means (unequal variance), p-value (one-tailed)= 0.0062 Note: Follow Hennes et al. (2008), magnitudes of misstatements were computed as a proportion of total assets in year t-1.
238
Appendix C: Logistic Regression Diagnostics
The following tests of the diagnostics are guided by Hosmer and Lemeshow (2000, pp.
143-186) and the web book of UCLA Academic Technology Services (Chen et al.
2003a). The tests were run on Stata software. All variables are defined in Table 6.3.
The main model of the research is Model 1 in Table 6.6, which is as follows.
Table 6.6 Model 1
coefficient
VARIABLES (z-statistic)
OWN 0.0040
(0.621)
FAM -0.2395
(-0.566)
CROSS -0.1674
(-0.268)
LEV 1.4587**
(2.320)
ISSUE 0.5057
(1.403)
NFCF 1.2328***
(2.575)
MB 0.1060
(1.039)
REHAB -0.1415
(-0.211)
BIG -1.1128**
(-2.285)
AUDCHG 0.8658**
(2.331)
DUAL 1.1317***
(2.974)
LNSIZE -0.2211
(-1.196)
AGE 0.0041
(0.235)
Consumer products -1.6824
(-1.269)
Industrials 0.6984
(1.258)
Property & construction -0.3055
(-0.513)
239
Table 6.6 Model 1
coefficient
VARIABLES (z-statistic)
Resources 0.1838
(0.188)
Service -1.0386
(-1.527)
Technology 0.7006
(1.229)
2003 -0.1717
(-0.292)
2004 1.6523***
(2.783)
2005 0.7846
(1.279)
2006 0.3657
(0.557)
2007 -2.0169*
(-1.736)
2008 -0.8158
(-1.115)
2009 -2.0175*
(-1.771)
Constant -3.5303**
(-2.224)
Observations 2,351
McFadden's pseudo R2 0.296
Model chi-square 269.5
Degree of freedom 26
Significance level of the model <0.0001
Log-likelihood -173
Restricted (Slopes=0) Log-likelihood -246
Number of clusters (firms) 387 i) The model has robust standard errors clustered by firm (i.e. accounts for the possible correlation
between observations of the same firm in different years).
ii) Agro & Food industry is the base for industry dummies and year 2002 is the base for year dummies.
iii) Robust z-statistics in parentheses (firm-level clustering).