107
Determinants of Effective Corporate Governance in States with Varying Ownership Structures: An International Comparison of Emerging and Western-like Markets FINAL REPORT December 2007

Determinants of Effective Corporate Governance in States
with Varying Ownership Structures: An International
Comparison of Emerging and Western-like Markets
FINAL REPORT
December 2007

2
Table of Contents
Table of Contents ........................................................................... 2
List of Tables .................................................................................. 4
List of Figures ................................................................................. 5
Abstract ....................................................................................... 6
Acknowledgements ........................................................................ 7
Scientific Committee ...................................................................... 7
Project Staff .................................................................................... 7
1. Introduction ................................................................................ 8
2. Overall Plan of the Project ......................................................... 9
2.1 In-depth Planning and Literature Review .................................. 9
2.2. Test sample data collection: Oman, UAE & Singapore ........... 10 2.3. Test sample data analysis: Oman & UAE vs. Singapore ......... 11
2.4. Hypotheses and model development ....................................... 11
2.5. Presentation of preliminary results (conference) .................... 11
2.6. Review/restructure of hypothesis and model (if required) ..... 12
2.7 Full sample data collection: Oman, the UAE & Singapore ...... 12
2.8 Full sample data analysis: Oman & UAE vs. Singapore.......... 12
2.9 Presentation of project results (conferences & seminars) ..... 12
2.10 Write-up of project results and reports ................................... 12
3
3. Literature Review .................................................................... 13
4. Institutional Framework .......................................................... 34
5. Data Analysis and Discussion of Results ................................ 50
6. Summary and Conclusions ........................................................ 97
References .................................................................................. 100
Appendices ................................................................................. 106
4
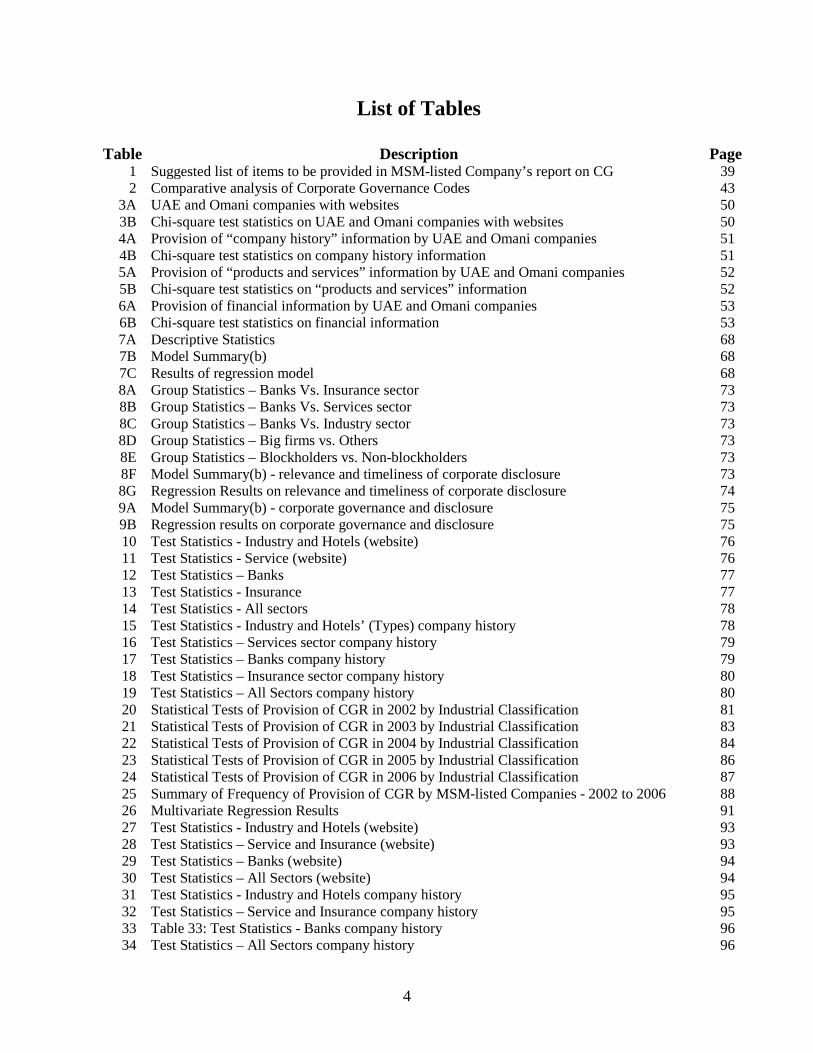
List of Tables
Table Description Page 1 Suggested list of items to be provided in MSM-listed Company’s report on CG 39 2 Comparative analysis of Corporate Governance Codes 43
3A UAE and Omani companies with websites 50 3B Chi-square test statistics on UAE and Omani companies with websites 50 4A Provision of “company history” information by UAE and Omani companies 51 4B Chi-square test statistics on company history information 51 5A Provision of “products and services” information by UAE and Omani companies 52 5B Chi-square test statistics on “products and services” information 52 6A Provision of financial information by UAE and Omani companies 53 6B Chi-square test statistics on financial information 53 7A Descriptive Statistics 68 7B Model Summary(b) 68 7C Results of regression model 68 8A Group Statistics – Banks Vs. Insurance sector 73 8B Group Statistics – Banks Vs. Services sector 73 8C Group Statistics – Banks Vs. Industry sector 73 8D Group Statistics – Big firms vs. Others 73 8E Group Statistics – Blockholders vs. Non-blockholders 73 8F Model Summary(b) - relevance and timeliness of corporate disclosure 73 8G Regression Results on relevance and timeliness of corporate disclosure 74 9A Model Summary(b) - corporate governance and disclosure 75 9B Regression results on corporate governance and disclosure 75 10 Test Statistics - Industry and Hotels (website) 76 11 Test Statistics - Service (website) 76 12 Test Statistics – Banks 77 13 Test Statistics - Insurance 77 14 Test Statistics - All sectors 78 15 Test Statistics - Industry and Hotels’ (Types) company history 78 16 Test Statistics – Services sector company history 79 17 Test Statistics – Banks company history 79 18 Test Statistics – Insurance sector company history 80 19 Test Statistics – All Sectors company history 80 20 Statistical Tests of Provision of CGR in 2002 by Industrial Classification 81 21 Statistical Tests of Provision of CGR in 2003 by Industrial Classification 83 22 Statistical Tests of Provision of CGR in 2004 by Industrial Classification 84 23 Statistical Tests of Provision of CGR in 2005 by Industrial Classification 86 24 Statistical Tests of Provision of CGR in 2006 by Industrial Classification 87 25 Summary of Frequency of Provision of CGR by MSM-listed Companies - 2002 to 2006 88 26 Multivariate Regression Results 91 27 Test Statistics - Industry and Hotels (website) 93 28 Test Statistics – Service and Insurance (website) 93 29 Test Statistics – Banks (website) 94 30 Test Statistics – All Sectors (website) 94 31 Test Statistics - Industry and Hotels company history 95 32 Test Statistics – Service and Insurance company history 95 33 Table 33: Test Statistics - Banks company history 96 34 Test Statistics – All Sectors company history 96
5
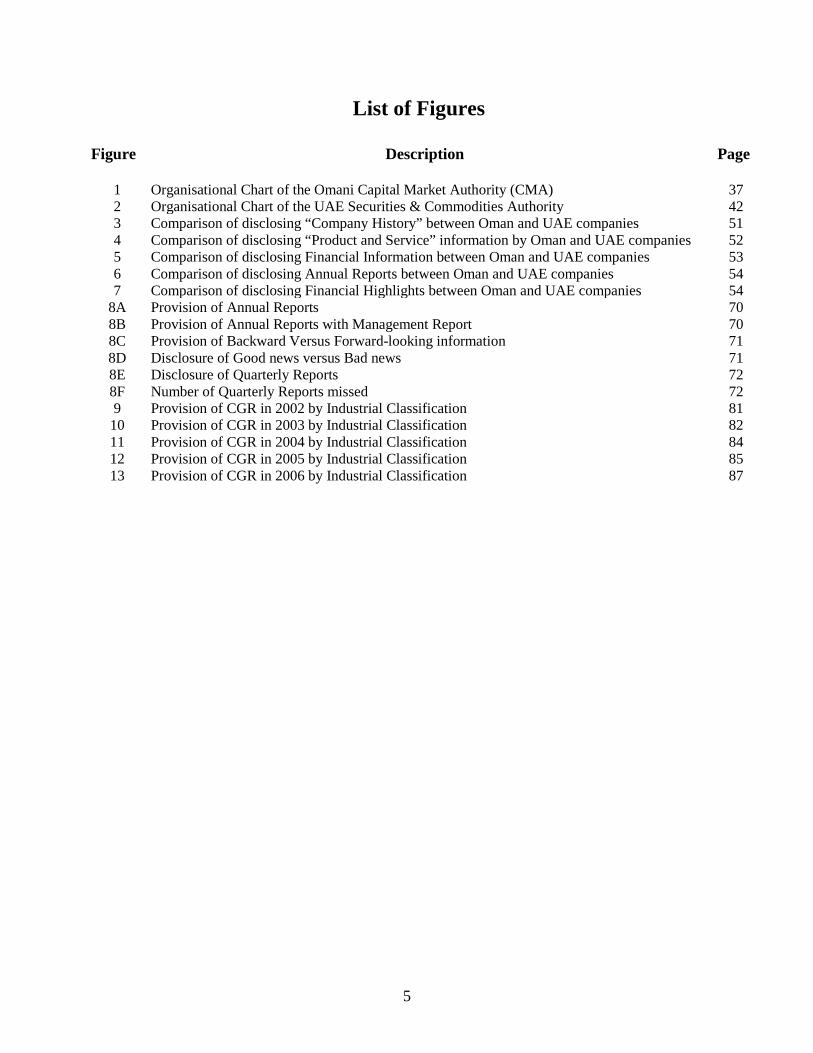
List of Figures
Figure Description
Page
1 Organisational Chart of the Omani Capital Market Authority (CMA) 37 2 Organisational Chart of the UAE Securities & Commodities Authority 42 3 Comparison of disclosing “Company History” between Oman and UAE companies 51 4 Comparison of disclosing “Product and Service” information by Oman and UAE companies 52 5 Comparison of disclosing Financial Information between Oman and UAE companies 53 6 Comparison of disclosing Annual Reports between Oman and UAE companies 54 7 Comparison of disclosing Financial Highlights between Oman and UAE companies 54
8A Provision of Annual Reports 70 8B Provision of Annual Reports with Management Report 70 8C Provision of Backward Versus Forward-looking information 71 8D Disclosure of Good news versus Bad news 71 8E Disclosure of Quarterly Reports 72 8F Number of Quarterly Reports missed 72 9 Provision of CGR in 2002 by Industrial Classification 81
10 Provision of CGR in 2003 by Industrial Classification 82 11 Provision of CGR in 2004 by Industrial Classification 84 12 Provision of CGR in 2005 by Industrial Classification 85 13 Provision of CGR in 2006 by Industrial Classification 87

6
Abstract
Corporate governance has become one of the most topical issues in the modern business world today. The recent spectacular corporate failures, such as those of Enron and WorldCom in the USA and Parmalat in Italy, have made it a central issue, with various governments and regulatory authorities making efforts to install stringent governance regimes to ensure the smooth running of corporate organizations, and prevent such failures. A corporate governance system is defined as a more-or-less country-specific framework of legal, institutional and cultural factors shaping the patterns of influence that shareholders (or stakeholders) exert on managerial decision-making. Corporate governance mechanisms are the methods employed, at the firm level, to solve corporate governance problems. Our project examined the key determinants of effective corporate governance practices in Oman, the UAE and Singapore. The main objective was to undertake an in-depth comparative examination of the effect of various factors on governance practices and disclosure across established Western-like and emerging economies. We explored and compared corporate ownership structures and corporate governance forms and mechanisms in Oman, the UAE, and Singapore. Data collection for the project proceeded in two main stages. In the first stage, relevant data on corporate governance disclosure and practices of listed companies and their corporate attributes for the years 2002 and 2004 were collected on a test sample basis. This was followed by a substantive full sample data collection process in the second stage. The results of data analysis for the project indicate that there are differences in some of the factors that influence corporate governance in Oman, the UAE and Singapore. In the UAE, we found that three of the corporate governance mechanisms appear to be strong enough to affect the firm’s performance. The null hypotheses of no significant relationship between the firm’s performance and the three variables (the governmental ownership, the dividends payout ratio, and debt equity ratio) were rejected. The other null hypotheses could not be rejected. In Oman, we found that rather surprisingly, ownership structure is not an important determinant when it comes to corporate governance matters. Traditional determinants such as firm size, performance and auditor status appear to be the more important. This tallies with findings in other countries, particularly western developed nations. We did not find a lot of evidence in support of other factors such as diffuseness of ownership and industrial sector. In Singapore, we found that ownership structure is not of great significance in governance matters. Rather, factors such as firm size and profitability appear to be the most important determinants. Sound corporate governance practices appear to support and contribute to superior corporate performance by SGX-listed companies. Our findings represent a confirmation that some corporate governance mechanisms in one system could have different effect on the firm performance in another system.

7
Acknowledgement We would like to acknowledge the support of the Research Affairs Offices of Sultan Qaboos
University and United Arab Emirates University. We greatly appreciate the excellent
research leadership and full support of Dr. Maitha S. Al-Shamsi, the Assistant Provost for
Research and Director of eFORS of UAEU, and Professor Amer Ali Al-Rawas, the Deputy
Vice Chancellor for Postgraduate Studies and Research, SQU (and his predecessor, Professor
Ali Bemani). We appreciate the financial support provided for this project by the two
universities. We would also like to express our special thanks to all members of the Scientific
Committee, past and present, for their excellent guidance and valuable comments. They
devoted a great deal of their time, and without their thoughtful advice and tireless
perseverance and supportive enthusiasm over the duration of this project, it may not have
been possible to achieve this successful completion.
Scientific Advisory Council SQU (Oman) UAEU (UAE)
Professor Ali Awad Yousif Professor Abdel-Mohsen Onsy Mohamed
Mrs Shekha N. Al-Akhzami Professor Reyadh Al Mehiadeb
Mr Fahad S. Hosni
Project Staff
Personnel-SQU (Oman) Personnel-UAEU (UAE)
Dr. Peter B. Oyelere (PI - SQU) Dr. Khaled Al-Jifri (PI - UAEU)
Dr Ehab Mohammed Dr Mohamed Moustafa*
Dr Divesh Sharma (Consultant)**
Research Assistants
* Replaced Dr Kalu Ojah, the initial co-investigator, who left UAEU at the beginning of the project. Dr Mohamed Moustafa left UAEU in 2006.
**Left Singapore to take up new appointment overseas.
8
1. INTRODUCTION
Corporate governance has become one of the most topical issues in the modern business world
today. The recent spectacular corporate failures, such as those of Enron and WorldCom in the USA
and Parmalat in Italy, have made it a central issue, with various governments and regulatory
authorities making efforts to install stringent governance regimes to ensure the smooth running of
corporate organizations, and prevent such failures. The extent of success garnered by these regimes,
relative to their costs, is a major issue currently being debated and researched in various countries of
the world. One issue, on which there is consensual agreement amongst almost all stakeholders across
the world, is that proper and adequate corporate governance procedures are necessary to secure and
retain investor confidence in the global marketplace.
Following on developments around the world, regulatory authorities in different countries have been
responding to the need for greater transparency and accountability with regards to corporate
governance disclosure. The Capital Markets Authority in Oman, for example, instituted requirements
for corporate governance disclosure on companies listed on the Muscat Securities Market from 2002,
while the authorities in Singapore instituted the second edition of their Code of Corporate
Governance in 2005. The UAE's regulatory authorities recently solicited for comments on its draft
Corporate Governance Code. The aim of this research project is to undertake a comprehensive
documentation of corporate governance developments in Oman and the UAE, and compare these
with developments in Singapore. Particular attention will be paid to various important elements,
including the level and quality of corporate governance disclosure by listed companies, current
corporate governance practices, transparency and accountability in the communication of corporate

9
governance practices, and the impact of corporate attributes such as ownership structure, size,
profitability, etc. on corporate governance practices and disclosure.
2. OVERALL PLAN OF THE PROJECT
As stated above, the original plan of this project is to undertake an in-depth comparative examination
of the effect of ownership structure and practices on corporate governance across established
Western-like and emerging economies. It was aimed at exploring and comparing corporate
ownership structures and corporate governance forms, practices and mechanisms in Oman, the UAE,
and Singapore.
The overall plan of the project involves the following broadly-defined stages:
• In-depth planning and literature review • Test sample data collection: Oman, UAE & Singapore • Test sample data analysis: Oman & UAE vs. Singapore • Hypotheses and model development • Presentation of preliminary results (conference) • Review/restructure of hypothesis and model (if required) • Full sample data collection: Oman, the UAE & Singapore • Full sample data analysis: Oman & UAE vs. Singapore • Presentation of project results (conferences & seminars) • Write-up of project results and reports
2-1 In-depth Planning and Literature Review
This stage, which was carried out between February and April 2004, involved a series of in-depth
planning meetings and consultation between members of the research team on the subject matter of
the research and their planned involvement. It also involved a research visit to the Abu Dhabi
Securities Market (ADSM) and its regulatory agency, the Securities and Commodities Authority

10
(SCA). During this stage, a detailed scope-outline for the review of relevant extant literature was
also agreed as follows:
Initial literature review enabled the team to conceptualise and identify key issues to focus on during
the research project. These were identified to include:
a. Accountability and transparency of corporate governance disclosure by listed companies: Particular attention to be paid to corporate awareness of their responsibility and willingness to disclose financial and corporate governance information to members of the public. Possible corporate attribute differentials in accountability and disclosure levels will also be investigated.
b. The level and quality of corporate governance disclosures by listed companies, including a longitudinal study of differentials/improvements between intervening years. Particular considerations will be given to possible differentials based on organizational attributes including ownership structure.
c. Salient corporate governance practices amongst listed companies including best and worst disclosure practices.
d. Development of a corporate governance disclosure index of listed companies. e. Comparison of these issues across the three regulatory jurisdictions covered by the project.
2-2 Test sample data collection: Oman, UAE & Singapore
Data collection for the project was planned to be in two main stages:
a. Test sample data collection: This is aimed at collecting relevant data on corporate governance disclosure and practices of listed companies and their corporate attributes for the years 2002 and 2003. The test nature of this process enables us to determine the level of response to our request for information from the companies.
b. Full sample data collection: This will entail collecting the substantive research data on corporate governance practices and disclosure as well as the corporate attributes of MSM-listed companies for 2004 and 2005.
For both stages, data were sourced through the annual reports of the companies, the database of the appropriate regulatory authority and, as necessary, a questionnaire administered on the companies to solicit additional corporate governance information. The first stage of the data collection process was concluded during Summer 2004.

11
2-3 Test sample data analysis: Oman & UAE vs. Singapore
Similar to the data collection process, data analysis was planned to progress in two main stages as
follows:
a. Test sample preliminary data analysis: The test sample data collected are analysed in the light of the corporate governance issues earlier conceptualized and identified. As part of the analytical process, the volume and quality of data availability for the research process are determined.
b. Substantive data analysis: Data collected on the listed company’s corporate governance practices and disclosures, as well as corporate attributes for the 2004 and 2005 accounting periods are analysed vis-à-vis the research’s main goals.
In both stages of data analysis, various statistical tools including exploratory data analysis, univariate
and multivariate techniques are employed as necessary.
2-4 Hypotheses and model development
Based on the outcome of the literature review, test sample data collection and analysis, it was
planned to develop and set-up relevant hypotheses and models for the research project. Given the
different stages of development of the three securities markets and their corporate governance
regulatory frameworks, it is anticipated that the nature of hypotheses and models developed for the
three jurisdictions will differ.
2-5 Presentation of preliminary results (conference)
Some of the preliminary results of the project, including conceptual and exploratory papers, were
submitted for presentation at relevant international conferences. The comments and feedback
received at such events were useful for further development of the project.

12
2-6 Review/restructure of hypothesis and model (if required)
Based on comments and feedback received, the research hypotheses and models were reviewed and
restructured as necessary. The aim of this process was to improve upon the original models and
allow for possible non-availability of data in any of the three research jurisdictions.
2-7 Full sample data collection: Oman, the UAE & Singapore
This is the second stage of the data collection process. Based on the experience gained from the test
sample data collection process, the full sample data collection for companies listed on the stock
exchanges of the three countries was undertaken. The full sample data collection process took non-
availability of data variables, as ascertained during the test sample data collection process, into
consideration.
2-8 Full sample data analysis: Oman & UAE vs. Singapore
In this second stage of the data analysis process, the research team proceeded to carry out the full
sample data analysis for the three research jurisdictions based on the full sample data collected so
far.
2-9 Presentation of project results (conferences & seminars)
The results of the project were presented at a number of international conferences and seminars.
Further presentations are planned for 2008
2-10 Write-ups of project results and reports
Finally, the project results and reports were written up by the research team. It is envisaged that a
number of research publications will emanate from this research project including conference
proceedings, journal articles and a book on corporate governance.

13
3. LITERATURE REVIEW
The advent of limited liability incorporation in the nineteenth century could be said to be the starting
point for corporate governance issues (Vinten, 1998). However, the subject has received little
attention in the last three decades, with the subject being brought from obscurity to the center of
attention of many academic and professional studies. This interest appears more appropriate at this
time, when business executives and auditors are continually being held to higher standards of
accountability and responsibility. Corporate governance has assumed a central place in the continued
effort to sanitize corporate reporting and shore up public confidence in financial markets around the
world. The issue seems to revolve around putting the right rules, regulations and incentives in place
to ensure transparency and accountability in the management of the affairs of corporate entities
(Cadbury Report, 1992). Corporate governance is receiving a lot of attention both in the
professional and academic literature (Brown 1999; Levitt 1998; Beasley et al. 1999; DeZoort and
Salterio 2001). It is viewed as an indispensable element of market discipline (Levitt 2000) and this
is fuelling demands for strong corporate governance mechanisms by investors and other financial
market participants (Blue Ribbon Committee 1999; Ramsay 2001). Arguably, emerging economies,
such as member nations of the GCC are likely to require more effective and stronger governance
mechanisms than their western developed counterparts if they are to become equal, full and active
participants in the global financial marketplace.
The term corporate governance describes the system by which companies are directed and
controlled. The overall objective of good governance is to ensure sustained growth or survival of
companies and the attainment of multiple goals of corporate stakeholders, that is, investors,
14
employees, and society in general (Charkham, 1994). It is defined as the system by which companies
are controlled, directed and made accountable to shareholders and other stakeholders; control being
understood as including indirect influences of financial markets (Demirag, 1998). Hence control is a
major element of corporate governance, both in terms of environment and organizational activities
(Committee of Sponsoring Organizations of the Treadway Commission (COSO), 1992; Public
Oversight Board (POB), 1993; Cohen and Hanno, 2000).
Organisational and financial control appears to be a major problem for a number of corporate
organizations in recent times and concerns are being expressed about the standards of accountability
and financial reporting of public companies. A number of big-name corporate collapses such as
Enron, Worldcom, Barlow Clows and Levitt, the Bank of Credit and Commerce International
(BCCI), Polly Peck International and Baring Bank, have made investors wary of corporate
governance systems. Major criticisms of the systems include the generous responsibilities given to
company directors with little accountability, the opportunity for the use of creative accounting
methods to manage accounting numbers, the lack of independence of auditing in some of the cases,
and short-terministic approach to setting the company’s strategy and future plans (Demirag, 1998).
Some extant literature documents corporate governance practices in various countries, including
Canada (Elloumi and Gueyie, 2001), Italy (Brunetti and Cecon, 1998), Japan (Doi, 1998), The
Netherlands (Groot, 1998), Poland (Dockery and Herbert, 2000), Turkey (Arat and Ugur, 2003), and
the UK (Demirag, 1998; Ezzamel and Willmot, 1993; Writer, 2001; Vinten, 2001; Weir and Laing,
2001). Others provide evidence of regional or multi-country practices including Dockery, Herbert
and Taylor (2000) – Europe, Walker and Fox (2002) – East Asia, Demirag (1998) – the UK and

15
International Comparison, and Vinten (2000) – UK and US. These studies examine different aspects
of the structure and practice of corporate governance. While a lot of research attention is being
focused on the subject, relatively few studies providing evidence of the practice in GCC countries
are currently in the public domain. Given the emerging nature of the economies of these nations, the
installation of effective corporate governance mechanisms is arguably more pertinent for them, if
they are to become full and active participants in the global financial marketplace. It is therefore
important that relevant and vigorous academic enquiries be pursued on the subject in these countries.
Comparative studies of corporate governance, performance pressures, and accountability of
management reveal significant variations among countries (Charkham, 1994). Some of these
differences may be traced to cultural differences (Hostede, 2001), institutional differences (North,
1990), political structures, and ownership forms (Thomsen and Pedersen, 1995), as well as board
composition and characteristics (Finkelsrein and Hambrick, 1996). Cultural differences between
countries, industries, and companies can explain a great deal of the diversities in corporate
governance structures and processes in different countries (Kuada and Gullestrup, 1998). For
example, the extent to which corporate governance is legally regulated will depend on the degree of
uncertainty avoidance in a society. To avoid uncertainty, societies may institute formal and/or
informal rules, which are used as regulatory mechanism to ensure that deliberate steps are taken to
guard against unacceptable future conditions. Hence, in societies where a viable coalition of
stakeholders is the primary objective of corporate governance, regulations encourage long-term
orientation of management decisions and professionalism in their implementation.
16
Despite the impact of cultural differences on corporate governance, there is evidence suggesting that
most of the issues and challenges of corporate governance in a rapidly changing global business
environment are similar, irrespective of geographical locations. Byrne (1996; 1997), for example,
found that too few people were constantly appearing on the same boards, and consequently,
attending too few board meetings, and that many board members had vested interest in the
companies and hence could not devote their full attention to management and control issues that
require objectivity and independence. Despite cultural differences, this is common in many other
countries, and notably so in GCC countries.
The literature on corporate governance has been primarily concerned with the principle-agent
relationship, with investors (the principals) employing managers (the agents) to run firms on their
behalf (Demirag, 1998). This concern has led to three distinct flows of thoughts on corporate
governance systems. The first is centered on issues regarding the principal (financial investors), the
second on the agent (board of directors and management in general), and the third on the
remuneration of principals and managers. Recently, the debate has extended beyond shareholders to
include other corporate stakeholders such as suppliers, purchasers and employees. Under this view,
agents are assumed to act in their own self-interests, irrespective of possible detriments to the
principal (Jensen and Meckling, 1976; Fama and Jensen 1983; Baysinger and Hoskisson 1990;
Bathala and Rao 1995). Effective corporate governance is an important cornerstone in the variety of
contractual mechanisms designed to monitor agents’ behaviour. Those performing the monitoring
function should be independent of those being monitored (Cohen et al, 2002).

17
Despite the existence of different corporate governance structures, the basic building blocks of the
structures are similar. They include the existence of a company, directors, accountability and audit,
directors’ remuneration, shareholders and the annual general meeting (AGM). Cadbury (1992),
Greenbury (1995) and Hampel (1998) called for greater transparency and accountability in areas
such as board structure and operation, directors’ contracts and the establishment of board monitoring
committees. In addition, they all stressed the importance of the non-executive directors’ monitoring
role. Cleghorn (1997) argues that there is no one system of corporate governance that is suitable for
all organizations, or even the same organization at all times. Given the three principal roles of boards
of directors of: (1) safeguarding the interests of stakeholders; (2) overseeing long-term strategic
development and performance; and (3) selecting, evaluating and compensating top management,
there are bound to be differences in how this is approached in different settings. Perhaps of even
greater importance is how the level of accountability achieved as a result of effective corporate
governance strategies is transparently communicated to all stakeholders.
This research project examines various corporate governance issues in Oman and the UAE, and
compares these to developments in Singapore. Particular attention is paid to various corporate
governance mechanisms, and the key organizational attributes contributing to good corporate
governance practices.
In April 2002, the Capital Markets Authority (CMA) in Oman published a Corporate Governance
Code, which requires all companies listed on the MSM to disclose their corporate governance
practices. This was amended and re-issued in April 2003. In the UAE, the Abu Dhabi Securities
Market (ADSM) has published a three-stage listing rule, which deals with corporate governance
18
matters, as well as a draft Corporate Governance Code: Guidelines for Best Practice. In Singapore,
the Corporate Governance Committee issued a report which formed the basis of the Code of
Corporate Governance in March 2001. This was subsequently upgraded and re-issued in 2005. The
next section details the institutional framework for the current research project in each of these three
different jurisdictions, including descriptions of their key financial and capital market institutions.
As mentioned previously corporate governance is a multi-disciplinary research field and has a range
of meanings and definitions depending on how one uses it and which discipline and which country
one is considering. Traditional finance literature has indicated several mechanisms that help solve
corporate governance problems, however the use of these mechanisms depends on the corporate
governance system prevalent in the country. So we will shed the light on the governance systems,
which deal with the corporate governance at the level of the countries, before discussing in details
the governance mechanisms, which deal with the corporate governance at the level of the firms.
A system of corporate governance is defined as a more-or-less country-specific framework of legal,
institutional and cultural factors shaping the patterns of influence that stakeholders (e.g. managers,
employees, shareholders, creditors, customers, suppliers and the government) exert on managerial
decision-making. Among others, Scott (1985), De Jong (1989), and Moerland (1995a,b) propose
four groups of relatively rich, industrialized countries for which more or less resembling so-called
corporate systems can be identified: (1) Anglo-Saxon countries (the USA, the UK, Canada and
Australia), (2) Germanic countries (Germany, the Netherlands, Switzerland, Sweden, Austria,
Denmark, Norway and Finland), (3) Latin countries (France, Italy, Spain and Belgium) and (4) Japan
(which is considered an isolate).

19
Arguing that the debate on corporate governance in an international context is hampered by the lack
of a coherent framework and based on the previous classification, Weimer and Pape (1999) proposed
a taxonomy of systems of corporate governance based on the following eight characteristics which
All have legal, institutional and cultural dimensions:
a. The prevailing concept of the firm; b. The board system; c. The salient stakeholders able to exert influence on managerial decision-making; d. The importance of stock markets in the national economy; e. The presence or absence of an external market for corporate control; f. The ownership structure; g. The extent to which executive compensation is dependent on corporate performance; h. The time horizon of economic relationships.
Weimer and Pape assayed these characteristics for the different country groups and distinguished
between "market-oriented" and "network-oriented" systems of corporate governance. The paramount
characteristic of the market-oriented systems is an active external market for corporate control,
which serves as a mechanism for independent shareholders to influence managerial decision-making.
Such markets include: stock market, labour market and hostile takeover market.
By contrast, in the network-oriented systems "oligarchic" groups substantially control managerial
decision-making via networks of relatively stable relationships (same terminology used by Moerland
(1995a, b)). The most common forms of networks are cross-shareholdings and inter- locking
directorships. The market-oriented systems prevail in the Anglo-Saxon countries. Largely based on
the identity of oligarchic groups, different classes of network-oriented systems can be recognized for
Germanic countries (e.g. Germany, where banks and employees are influential), Latin countries (e.g.
France and Italy, where family control is relatively important), and Japan (where banks serve as the
nucleus of mutually related, vertically and horizontally integrated groups of firms).

20
Franks and Mayer (1997) and Shleifer and Vishny (1997) provide a similar classification of
governance systems with two kinds of systems as follows: (1) Market-oriented systems, such as
those in US and UK, that tend to rely more on managerial compensation and the market for
corporate control to solve corporate governance problems and (2) Large shareholders oriented
systems, such as those in Germany, France or Spin, which tend to use control by large incumbent
shareholders to align the behaviour of managers and owners. Some researchers , such as Cuervo
(2002) among others, term the shareholders control systems in German, France and Spain" the
Continental European systems", and the market control systems in US and UK "Anglo-Saxon
systems".
The large shareholder control or Continental European system is characterised by the following
features:(1) ownership is concentrated; banks, companies, and families are large shareholders; (2)
control is assumed to be exercised by large shareholders; (3) the board of directors is controlled by
internal directors or external directors linked to large shareholders; (4) capital markets are relatively
illiquid and have limited control ability; (5) there exist implicit contracting and close personal trust
relationships among managers; (6) long-term lender-borrower relationships and bank ownership of
equity are maintained; (7) there is no active market for control; that is, management does not face
hostile takeover bids; and (8) banks play major role in corporate governance, trough equity stakes,
proxies given to them by small investors and bankers' position on the boards of firms (Baums
(1993); Kester (1997) and Cuervo (2002)).
The market control or Anglo-Saxon system is characterised by the following features: (1) ownership
is diffuse except for institutional investors; (2) control is vested in the board of directors, with
external directors playing an important role; (3) capital markets are very liquid and there is a
developed market for corporate control and takeover market; and (4) there is more defence of the
21
ownership rights of shareholders over the rights of debtholders than in the Continental European
model; that is, legal protection acts as a substitute for ownership structure La Porta et al., (1997).
Neither system is perfect. In the market control system, the reduction in the operation of the market
for corporate control gave rise to activism by large institutional investors Useem (1993). In the large-
shareholder control system, abuses by managers and large shareholders led to the establishment of
codes of good corporate governance (Cadbury Commission, 1992). So, the more recent years have
been witnessed a new line of research describes, analyzes and tries to reach "the best" or practically
speaking the "good" code of corporate governance mechanisms within specific system, namely for
each country or for each several countries share almost same features.
Traditional finance literature has indicated several mechanisms that help solve corporate governance
problems (Jensen and Meckling (1976); Fama (1980); Fama and Jensen (1983b); Jensen (1986);
Jensen (1993); and Turnbull (1997). There is a consensus on the classification of corporate
governance mechanisms to two categories: internal and external mechanisms. However, there is a
dissension on the contents of each category and the effectiveness of each mechanism. In addition,
the topic of corporate governance mechanisms is too vast and rich research area to the extent that no
single paper can survey all the corporate governance mechanisms developed in the literature and
instead the papers try to focus on some particular governance mechanisms.
Jensen (1993) criticises the existing governance mechanisms in USA, UK, Japan and Germany and
outlines four basic categories of individual corporate governance mechanisms: (1) legal and
regulatory mechanisms; (2) internal control mechanisms; (3) External control mechanisms; and (4)
product market competition. In their survey of corporate governance, Shlifer and Vishny (1997)
22
concentrate on: incentive contracts, legal protection for the investors against the managerial self-
dealing, and the ownership by large investors. Shlifer and Vishny point out the costs and benefits of
each governance mechanism.
Denies (2001) provides the following four mechanisms: (1) legal and regulatory mechanisms exist
outside the firm; (2) internal control mechanisms within a firm, (which include; the board of
directors; executive compensation and ownership; non executive owners; and debt); (3) external
control mechanisms such as the corporate takeover market; and (4) product market competition.
Then Denis and McConnell (2003) survey the international corporate governance concentrating on
countries other than United States and using a dual classification of corporate governance
mechanisms (They use systems as synonym to mechanisms) as follows: (1) internal governance
mechanisms including: boards of directors and ownership structure and (2) external ones including:
the takeover market and the legal regulatory system.
Farinha (2003) surveys two categories of governance (or disciplining) mechanisms, the first one is
the external disciplining mechanisms including: takeovers threat; product market competition;
managerial labour market and mutual monitoring by managers; security analysts; the legal
environment; and the role of reputation. The other category is the internal disciplining mechanisms
which include: large and institutional shareholders; board of directors; insider ownership;
compensation packages; debt policy; and dividend policy.
Large shareholders and institutional investors (Demsetz (1983); Demsetz and Lehn (1985); and
Shleifer and Vishny (1986)) can be seen as potential controllers of equity agency problems as their
increased shareholdings can give them a stronger incentive to monitor firm performance and

23
managerial behaviour. This potentially helps to circumvent the free rider-problem associated with
ownership dispersion. Another potential benefit relates to the potential challenge that large
shareholders offer to outside raiders, thus increasing the takeover premium Burkart (1995).
Consistent with these benefits, Mikkelson and Ruback (1985) and Holderness and Sheehan (1985)
report positive abnormal returns around the announcement of outsiders' acquisition of large equity
positions. In the UK, Sudarsanam (1996) looks at the relation between block acquisitions and
subsequent takeover attempts for the target companies and reports that large block acquisitions
(between 5% and 30% of the target's shares) not just lead to significant abnormal returns
surrounding its announcement but also influence the likelihood of takeover bids, hostile bids and the
success of bids.
One rather intuitive way by which equity agency costs can be reduced is by increasing the level of
managers' stock ownership, which may permit a better alignment of their interests with those of
shareholders. In fact, in the extreme case where the manager's share ownership is 100%, equity
agency costs are reduced to zero (Jensen and Meckling, 1976). As managerial ownership increases,
managers bear a large fraction of the costs of shirking, perquisite consumption and other value-
destroying actions. Further, larger share ownership by managers reduces the problem of different
horizons between shareholders and managers if share prices adjust rapidly to changes in firm’s
intrinsic value.
A limitation, however, of this mechanism as a tool for reducing agency costs is that managers may
not be willing to increase their ownership of the firm because of constraints on their personal wealth.

24
Additionally, personal risk aversion also limits the extension of this monitoring device as the
allocation of a large portion of the manager's wealth to a single firm is likely to translate into a badly
diversified portfolio (Beck and Zorn, 1982). Management buyouts, whereby insiders increase
dramatically their shareholdings in the firm, provide a natural field study for the effects of insider
ownership in the reduction of conflicts between owners and managers.
In accordance with the proposition that larger managerial ownership reduce agency costs, Kaplan
(1989) finds that following large management buyouts, firms experience significant improvements in
operating performance. He interprets this evidence as suggesting that operating changes were due to
improved management incentives instead of layoffs or managerial exploitation of shareholders
through inside information. Smith (1990) reports similar results and notes that the amelioration
observed in operating performance is not due to reductions in discretionary expenditures such as
research and development, advertising, maintenance or property, plant and equipment.
In a study of the effects of changes in ownership structure on performance for a sample of thrift
institutions that converted from mutual to stock ownership, Cole and Mehran (1998) find that
changes in performance are significantly associated with changes in insider ownership. They
document that the greater the increase in insider ownership, the greater the performance
improvement, which is consistent with the alignment of interests hypothesis arising from a larger
insider ownership. Also consistent with that hypothesis of Subrahmanyam, Rangan and Rosenstein
(1997) who find evidence, in a sample of successful bidders in bank acquisitions, of a positive
association between bidder returns and the level of insider ownership when the latter exceeds 6%.
Research by Morck, Shleifer and Vishny (1988), McConnell and Servaes (1990) and Hermalin and
Weisbach (1991) is also consistent with the view that insider ownership can be an effective tool in

25
reducing agency costs, although they report a non- monotonic relation. This functional form has been
related to the observation that, within a certain ownership range, managers may use their equity
position to entrench themselves against any disciplining attempts from other monitoring mechanisms.
However, some other studies find no evidence of a positive relationship between insider ownership
and performance (see, for instance, Demsetz and Lehn, 1985; Loderer and Sheehan, 1989;
Holderness and Sheehan, 1988; Denis and Denis, 1994; and Loderer and Martin, 1997). Moreover,
the studies that find a positive relationship typically present results that have very low explanatory
power (R2s usually between 2% and 6%).
A possible explanation for these mixed results is that many of the studies do not properly distinguish
the possibility of alignment of interests across a certain range of ownership values and of
entrenchment over another range. Furthermore, these analyses usually do not take into account the
possibility that several different mechanisms for alignment of interests can be used simultaneously,
with substitution effects with insider ownership. It is quite conceivable that different firms may use
different mixes of corporate governance devices (Rediker and Seth, 1995).
These different mixes can, however, all be optimal as a result of varying marginal costs and benefits
of the several monitoring instruments available for each firm. If so, then one would not be able to
observe a relationship between performance and any of these particular mechanisms.
A different type of monitoring vehicle is related to the potential links between managerial
compensation and firm performance. In theory, a strong relation between compensation and firm
performance would enable a better alignment of interests between shareholders and managers
(Jensen and Murphy, 1990). Relevant elements of the compensation package typically include stock

26
related rewards, deferred cash compensation and dividend policy-dependent compensation.
Evidence of such a significant link is, however, not strong. Lewellen, Loderer and Martin (1987), for
example, find evidence in support of the hypothesis that compensation packages are designed to
reduce agency costs. However, a comprehensive analysis of CEO pay in the US by Jensen and
Murphy (1990) concludes that most compensation contracts are characterised by a general absence
of real management incentives and that observed compensation patterns are inconsistent with the
implications of formal agency models of optimal contracting. Similarly, Yermack (1995) reports that
observed stock options performance incentives have no significant association with explanatory
variables related to agency costs reduction. In the UK, Gregg, Machin and Szymansky (1993) reach
similar conclusions as they find a very weak relation between pay and performance for the period
1983-88 and no relation after that. They observe however, a strong association between pay and
asset growth.
Jensen and Murphy (1990) and Shleifer and Vishny (1997) argue that the empirically observed lack
of sensitivity of pay to performance is caused by legal and political external factors common to
many countries. In addition, Haubrich (1994) shows that it may not be optimal to include a large
sensitivity of pay to performance in managers' compensation contracts as this would require a large
risk tolerance from the part of managers, which is not an efficient incentive system for more risk-
averse managers. Furthermore, Yermack (1997) documents that managers can time stock options to
their advantage as he finds that stock options are granted just before the announcement of good news
and tend to be delayed until after bad announcements. Shleifer and Vishny (1997) view the overall
evidence on the relationship between pay and performance as suggesting that it is "problematic to
argue that incentive contracts completely solve the agency problem (p. 745)".

27
The theoretical background of this mechanism has been dated back to the ideas of Manne (1965) and
recently was developed by Jensen and Meckling (1976), Grossman and Hart (1980) and Fama and
Jensen (1983) given that there is an active market for corporate control. Due to the free rider
problem, small shareholders have little incentive to monitor management but this problem can
potentially be avoided by the use of the takeover mechanism. According to this view, if management
is inefficient or not acting in shareholders' interests, a "raider" could make a takeover bid, buying the
firm at a low price, managing it better and eventually selling it back with a profit. A feature of the
takeover mechanism is that it potentially applies in an indiscriminate way to all firms, in this sense
one may call it a general disciplining mechanism. In support of this perspective, Easterbrook and
Fishel (1991) and Jensen (1993) regard takeovers in the US as an essential corporate governance
mechanism to control managers' discretionary actions.
The empirical evidence showing that takeovers lead to significant positive price impacts on the
takeover target is consistent with this perspective (although also with alternative views, e.g.
synergistic gains). However, the takeover mechanism is not without problems. Grossman and Hart
(1980) point out that this mechanism can be undermined if shareholders can free ride on the raider's
improvement of the corporation (by refusing to sell their shares) unless the corporate charter or law
includes exclusionary devices able to deal with this free riding problem. In addition, takeovers
involve not just the costs needed to induce reluctant shareholders but also search costs, bidding costs
and other transaction costs (Williamson, 1970) that make takeovers in practice a very expensive
solution.
Therefore, in the presence of this monitoring mechanism alone, managers are free to deviate from an
optimal performance as long as they don't cause the firm price to decline more than the costs of a

28
takeover. Moreover, in recent years the adoption of defensive tactics, corporate charter amendments
or even anti-takeover legislation have further increased the costs and risks of takeovers, notably in
the US.
Also, takeover corrections of managerial failure have the disadvantage that they are ex-post
corrections, whereas other mechanisms may be ex-ante or "deterring" disciplining devices. As such,
when disciplining takeovers occur, it is usually too late to avoid the huge direct and indirect costs
associated with the effects of past sub-optimal managerial actions. Thus, in this sense one can argue
that the takeover threat is a more efficient mechanism than the takeover itself, although the
credibility of that threat may require the observation of some hostile takeover activity in the market.
Consistent with the view that takeovers are a source of managerial discipline, Martin and McConnell
(1991) find evidence of increased management turnover after successful takeovers, and more
frequent turnover when acquired companies previously underperformed their industry. Shivdasani
(1993) shows results consistent with the view that hostile takeovers provide discipline when internal
governance mechanisms such as the board of directors fail to control management's non value
maximising behaviour.
Also, Mikkelson and Partch (1997) document that the decrease in takeover activity in the US from
1984-88 to 1989-93 was accompanied by a reduction in disciplinary pressure on managers. They
show that the relation between management turnover and performance is significant only during the
period where the takeover market was more active.
In most of Continental Europe, with the exception of the UK, hostile takeovers are, however, rare.
Franks and Mayer (1994) attribute this fact to the particular structure of most European capital

29
markets, characterised by a small number of listed companies and a relatively high concentration of
ownership as compared to the US and UK.
In their analysis of UK takeovers, Franks and Harris (1989) report shareholder wealth impacts of
takeovers similar to those observed in the US. Kennedy and Limmack (1996) analyse the
performance of takeover targets in the pre-takeover period and its relationship with subsequent CEO
turnover and find evidence consistent with takeovers acting in the UK as disciplinary mechanisms on
managers. They observe that CEO turnover tends to increase following takeovers, and that target
firms that do replace CEOs after takeovers ("disciplinary takeovers") experience lower returns
before takeover than other targets. In contrast, Franks and Mayer (1996) reject the hypothesis that in
the UK hostile takeovers perform a disciplining function. They assert that the apparent rejection of
hostile bids by target management seems to be derived not from managerial entrenchment but from
opposition to post-takeover redeployment of assets or renegotiation over bid terms.
In another UK study, Sudarsanam, Holl and Salami (1996) present the result that a better previous
relative performance of bidder over target (measured by their relative market-to-book ratio) is a
significantly positive influence on target's abnormal returns surrounding a takeover bid
announcement but a negative one bidder's returns. This result is not strictly in accordance with a
disciplinary perspective of takeovers where value enhancements would be expected to occur for both
targets and bidders. Sudarsanam, Holl and Salami (1996) interpret their evidence, instead, as
consistent with Roll's (1986) hypothesis that bidder managers may suffer from "hubris" that leads
them to overestimate the benefits of a takeover and pay excessive takeover premia. The UK evidence
on the disciplinary role of takeovers thus appears to be, in contrast to US studies, inconclusive.
C.2 Managerial Labour Market and Mutual Monitoring by Managers

30
Fama (1980) argues that "each manager has a stake in the performance of the managers above and
below him and, as a consequence, undertakes some amount of monitoring in both directions (p.
293)". This is related to the view that the managerial labour market may use the performance of the
firm to determine each manager's opportunity wage. Additionally, each manager may sense that his
marginal product is likely to be a positive function of the efficiency of managers not just below but
also above him. Managers are then reckoned to perceive a gain in stepping over inefficient managers
located above. Fama (1980) thus reckons that the existence of a managerial labour market is a key
factor influencing the level of mutual monitoring by managers. Alongside this indirect influence,
Fama (1980) sees this market as exercising a direct pressure on the firm to sort and compensate
managers according to their performance in order to prevent the best managers from leaving and
keep the firm's attractiveness to potentially highly performing managers.
Consistent with the monitoring role of the board of directors, Coughlan and Schmidt (1985) present
evidence that poor performance increases the likelihood of top management turnover and that
corporate boards managerial compensation decisions are related to the firm's performance. In
accordance with Fama's (1980) assertion that the managerial labour market uses information on past
performance to set wages and define alternative job opportunities for executives, Gilson (1989)
analyses the subsequent careers of executives resigning from firms that experienced financial
distress. He finds that these executives hold around one-third fewer seats on the boards of other
companies. Also, Kaplan and Reishus (1990) report evidence consistent with top executives of
dividend-reducing firms being 50% less likely to receive additional directorships than executives of
on dividend-reducing companies. Cannella, Fraser and Lee (1995) report similar results in their
study of the careers of executives of failing Texan banks. In addition, they find that the labour
market distinguishes between managers who lose their prior positions for reasons beyond their
31
control and those that were directly involved in the institution's failure. They report that managers
associated with banks that fail for reasons arguably beyond the managers' control are twice more
likely to regain comparable banking posts than managers at other failed banks.
However, the effectiveness of mutual monitoring by managers has been questioned. As Hansen and
Torregrosa (1992) observe, "imprecise measurement of manager efforts (due to bad judgment, moral
hazard or poor information) and managerial entrenchment limit the effectiveness of the internal
assessment mechanism (p. 1539)". Fama (1980) concedes that, at board level, top management may
engage in collusive arrangements, which might result in the expropriation of security holders'
wealth. Consistent with these assertions, Warner, Watts and Wruck (1988) present evidence of
inefficient internal assessment mechanisms over top management. They report that only when
unfavourable firm performance is extreme do internal mechanisms seem to lead to management
changes and, even so, the response to bad performance doesn't seem to come without a considerable
time lag. Also, Mace (1986) and Lorsh and MacIver (1989) find that CEOs tend to dominate the
nomination process of new board members.
Another external factor that can influence corporate governance is the legal environment. This may
manifest itself in several ways. One is in the form of legislation that directly affects the efficiency, or
the cost, of one or more monitoring devices. For instance, in the US many States have passed
legislation designed to avoid or increase the costs of hostile takeovers. This causes a severe impact
on the existence of the takeover device as a general mechanism to control managerial actions within
these States. Another example is the existence of legal rules giving a particular importance to
dividend policy as a potential instrument for dealing with potential equity agency problems. This is
the case with Brazil, Chile, Colombia, Greece and Venezuela, countries where companies face
32
mandatory dividend rules.
In other nations, the role of the legal environment can be somewhat more subtle. In the UK, this has
taken the form of a number of committees that set up recommendations destined to improve
corporate governance practices at the board of directors' level. These have been materialised in the
Cadbury (1992), Greenbury (1995) and Hampel (1998) Reports. Recommendations emanating from
these reports have been adopted by the London Stock Exchange in the form of an official
requirement for listed companies to state the extent of their compliance with these recommendations,
although the rules formulated by these committees have not been made directly compulsory.
An important insight on the consequences of this kind of state-originated recommendations has been
given by Dahya, McConnel and Travlos (2002), who analyse the relationship between CEO turnover
and corporate performance before and after the publication of the Cadbury (1992) Code in the UK.
They find that after the issuance of the Code, the negative relationship between CEO turnover and
performance becomes much stronger, with the increase in sensitivity between these two variables
being concentrated among adopters of Cadbury's (1992) recommendations.
Another important area of the legal environment, which also may influence corporate governance
devices, is that concerned with the protection of minority shareholders. Laporta, Lopez-de-Silanes,
Shleifer and Vishny (1997) find that the existence and efficiency of legal rules protecting investors
are a major determinant of the development of local capital markets. If the extent of the corporate
governance problem is conceivably a deterrent to external capital raising, this can be interpreted as
suggesting that the quality of the legal system of investor protection is a major determinant on the
ability of firms and investors to set up appropriate corporate governance structures Some other
aspects of the general legal environment may also lead to consequences for corporate governance.
33
For instance, the UK Company Law defines a mandatory rights issue requirement (pre-emptive
rights) for equity issues that can be waived in general terms by means of a special resolution
approved annually by shareholders.
As Franks, Mayer and Renneboog (1998) observe, this requirement affects the relative costs of
alternative forms of corporate control, providing investors in the UK with the power to impose
control changes as part of the condition of the provision of new finance. In the US, although similar
rights issues requirements are allowed to be included in companies' articles of association, they are
not compulsory and seldom exist in practice. This in effect may be in part responsible for the
different governance structures observable in these countries. Also consistent with the perspective
that the legal environment has a significant impact on the structure of corporate governance is Black
and Coffee's (1994) comparative study of the legal structures in the US and the UK surrounding
institutional investors' behaviour. They observe that the regulation of each type of institutional
investor is a partial determinant of institutional investors' willingness to be involved in monitoring
managerial actions.
They also point out that another potentially important factor influencing institutional shareholders'
activism is the existence of legal barriers to institutional coalition formation. Similarly, Black (1998)
suggests that some legal rules, namely the 13D filing requirement with the SEC for groups of
shareholders acting together on a voting issue, are a plausible partial explanation for the general lack
of shareholder activism by American institutional investors.

34
4. INSTITUTIONAL FRAMEWORK
This report presents initial findings of a comprehensive investigation of corporate governance
developments and practices in Oman and the UAE, as compared to developments in Singapore. The
project examined various facets of corporate governance as an issue for companies listed on the
MSM in Oman, the ADSM and DFM in the UAE, and the SGX in Singapore. The environment and
institutional framework of the location of the research project are discussed in this section.
4.1 Oman - Muscat Securities Market
The government of the Sultanate of Oman realized sometime ago that in order to keep pace with
international developments and enable the vision of a solid economy that will be recognised
internationally, it was necessary to have a strong financial sector based on well-established financial
companies. This is expected to provide a suitable enabling environment for successful companies
and projects that will add value to the country’s economic cycle. To realise these objectives, it was
decided to set up a Stock Exchange, the Muscat Securities Market (MSM), set up by Royal Decree
53/88 of 21 June 1988. The decree set the legal framework for the establishment of the market as an
independent organisation to regulate and control the Omani securities market and to participate with
other organisations in setting up the infrastructure of the Sultanate’s financial sector. After ten years
of continuous growth of the national economy in general and the market in particular, and to cope
with new developments in the local and international financial sector, particularly in the securities
industry, it was decided that there was a need for better control and regulation of market activities,
so as to provide better protection to investors. To achieve this, it was decided to split the functions of
regulation and market activities, both of which were until then functions of the MSM. Existing laws
and regulations were amended to bring the market closer to international standards of practice,

35
where the norm is to have an independent regulator, with regulatory authority over the Exchange and
market participants.
The MSM was restructured by the issue of two Royal Decrees 80/98 and 82/98. Royal Decree 80/98
of 9 November 1998 provided for the establishment of two separate entities:
• a regulator, to be named the Capital Market Authority (CMA), which will be a governmental
authority responsible for organizing and overseeing the issue and trading of securities in the
Sultanate; and
• an exchange, to be named the Muscat Securities Market (MSM), where all listed securities
shall be traded. The exchange shall also be a governmental entity, financially and
administratively independent from the authority but subject to its supervision. The board of
directors shall be elected from among members of public (governmental commercially
oriented) corporations, listed companies, intermediaries, and the Central Bank of Oman.
Royal Decree 82/98 of 25 November 1998 established the Muscat Depository and Securities
Registration Company, a closed joint stock company, as the sole provider, of the services of
registration and transfer of ownership of securities and safe keeping of ownership documents
(depository) in the Sultanate. This company is linked through an electronic system to the MSM for
easy data transfer.
The CMA was established as a public authority in accordance with Royal Decree No.80/98 issued on
9 November 1999, and effective from 15 January 2000. The major responsibilities of the Authority
are to organise, licence, and monitor the issue and trading of securities, to supervise the operation of

36
the Muscat Securities Market, and to supervise all companies operating in the field of securities
(Source: www.cma-oman.gov.om). The Authority, with a mission to “maintain fair, efficient
and transparent" market activities, has the following objectives:
the advancement of the competence of the market and protection of investors from unfair and
unsound commercial practices;
the provision of opportunities for the investment of savings and funds in securities in the
interest of the national economy;
the regulation and control of the issue of securities in the Primary Market and the definition of
the requirements of prospectuses on securities offering for public subscription;
the facilitation and expedition of the mobilization of funds invested in securities and to
guarantee response to the supply and demand factors with the aim of determining the prices of
such securities and protecting small investors by establishing the bases of sound and fair
dealing among the different categories of investors;
the undertaking of studies and making recommendations to different official bodies on the laws
in force and their amendment to be in line with the requirements of the securities market;
contacting and engaging financial markets overseas in a continuous process of acquiring and
exchanging information and experiences in order to keep pace with advanced dealing methods
in the global markets and to accelerate the development of the Omani financial market; and
the establishment of principles of professional conduct, self-supervision and good behavior
among intermediaries and dealers, and the encouragement and qualification of the
intermediaries and other employees of the market in order to raise their academic and practical
competence.

37
Figure 1: Organisational Chart of the Omani Capital Market Authority (CMA)
Source: The CMA website
Figure 1 depicts the organizational chart of the CMA. Since 2000, the CMA has implemented a
number of measures aimed at strengthening its regulatory role and improving the performance
MSM-listed companies. These include: the introduction of controls on related party transactions in
the public joint-stock companies, introduction of new requirements for the appointment of board
directors, the measures taken with regard to the falling companies, etc. Perhaps the most important
measure implemented to date was the introduction of a Code of Corporate Governance for
companies listed on the MSM in June 2002 as amended in April 2003. As this Code is central to the
objective of this research project, it is discussed further in Section 3.12 of this report.

38
4.2 The Omani Corporate Governance Code – June 2002 and April 2003
In a timely response to developments across the world of capital markets regulation, the CMA, in
June 2002, published its Corporate Governance Code (Circular No. 11/2002), which was later
amended and replaced by Circular No. 1/2003 of April 2003. The Code, which was slated to apply to
financial statements published by MSM-listed companies from June 3, 2002, required all listed
companies to publish a section on corporate governance in their financial statements. A copy of the
Corporate Governance Code is attached as Appendix 1 to this study.
The Code contains 28 articles requiring companies to disclose corporate governance issues such as
the composition of their board of directors (BOD), number of meetings and functions of the BOD,
audit committee composition, expertise and terms of reference, audit and internal control matters,
appointment and terms of appointment of executive management, disclosure of related party
transactions, certification of CG report by company auditor and disclosure of areas of non-
compliance with CG Code requirements. While it is not as elaborate as other Corporate Governance
codes such as the Combined Corporate Governance Code in the UK and the Code of CG in
Singapore, the Omani CMA Code can be said to provide adequate coverage of the key disclosure
issues of relevance in a market with a nascent disclosure culture.
MSM-listed companies are required to disclose key corporate governance issues in a separate section
of their annual report. A list of suggested items to be included in their report on CG is presented in
Table 1 below.

39
Table 1: Suggested list of items to be provided in MSM-listed Company’s report on CG
1 Company’s philosophy on code of governance and a descriptive report on how the company has applied the principles of corporate governance as stated in annexure 1.
2 Board of Directors: 2.1 Composition and category of directors for example executive, non-executive, independent and
nominee director (with institution represented as lender or as equity investor). 2.2 Attendance of each director at the board meetings and the last AGM. 2.3 Number of other boards or board committees he/she is a member or chairperson. 2.4 Number of board meetings held and dates of the meetings.
3 Audit Committee and other committees: 3.1 Brief description of terms of reference 3.2 Composition, name of members and Chairperson 3.3 Meetings and attendance during the year
4 Process of nomination of the directors
5 Remuneration matters: 5.1 Details of remuneration to all directors and top 5 officers individually including salary, benefits,
perquisites, bonuses, stock options, gratuity and pensions etc 5.2 Details of fixed component and performance linked incentives along with the performance
criteria 5.3 Service contracts, notice period and severance fees
6 Details of non-compliance by the company 6.1 Penalties, strictures imposed on the company by MSM/CMA or any statutory authority, on any
matter related to capital markets, during the last three years
7 Means of communications with the shareholders and investors: 7.1 Whether half-yearly results were sent to each shareholder 7.2 Name of the web-site where these were posted 7.3 Whether the web-site of the company displays official news releases 7.4 Presentations made to institutional investors or to the analysts 7.5 Whether MD&A is part of annual report or not 8 Market price data: 8.1 High/low during each month in the last financial year 8.2 Performance in comparison to board based index of MSM (relevant sector) 8.3 Distribution of shareholding 8.4 Outstanding GDRs/ADRs/Warrants or any Convertible instruments, conversion date and likely
impact on equity
9 Specific areas of non-compliance with the provisions of corporate governance and reasons 10 Professional profile of the statutory auditor 11 Any other important aspect
40
The disclosure of these important pieces of corporate governance information should go a long way
in promoting transparency and accountability, thereby bolstering investor confidence. For this to be
achieved, MSM-listed companies would need to respond in a positive and timely manner to the
CMA's requirements. In the current study, we document the corporate governance reporting
practices of MSM-listed companies between 2002 and 2006.
4.3 The State of Corporate Governance in the UAE
The UAE has an open economy with a high per capita income and sizable annual trade surplus. Its
wealth is based on oil and gas output, and the fortunes of the economy fluctuate with the prices of
those commodities. Since the UAE discovered the oil 30 years ago, the country has undergone a
profound transformation from an impoverished region of small desert principalities to a modern state
with a high standard of living (the World Factbook, 2006).
The UAE corporate sector began to develop in the middle of the seventies, which witnessed the
creation of many companies due to the rise in oil prices and the strong interest of the federal
government to build a strong national economy. All companies operate under Federal Commercial
Law No 8/1984 and its amendments.
Over the past five years, the UAE corporate sector has grown rapidly due to the inception of the
country’s official stock market and the federal tendency toward privatizing some large infrastructure
companies. The main regulatory bodies in the UAE corporate sector are the Ministry of Economy,
the Central Bank, and the Emirates Securities & Commodities Authority (ESCA). In addition, the

41
State of Audit (i.e., Federal Auditing Organization) has the right to monitor any company that is
financed with federal funds.
The UAE stock market was inaugurated in 2000 and is represented by two governmental security
exchanges, Dubai and Abu Dhabi, under the supervision of the ESCA. Compared to other stock
markets in the region, the UAE stock market is a relatively new and small one. However, from 2004
to today, it has enlarged, gained strength, and became more active in terms of the number of IPOs
and the listed companies, market capitalization, and the range of market participants such as
brokerage firms and investment funds.
Due to the diffusion of corporate governance themes all over the world and to the continued merging
between the country’s economy and the global economy, the UAE has recently given more attention
to the application of international standards of corporate governance to all listed companies on the
local securities markets. The ESCA issued in April 2007 “Corporate Governance Regulations for
Joint-Stock Companies and Criteria for Institutional Discipline”. This document is designed to
improve the corporate governance system for the listed firms, and it focuses mainly on independence
within the board, the qualities and responsibilities of the board, and the requirements for both of
executives and disclosure. This would greatly strengthen the internal control system and improve
the integrity of financial reporting, competition, and market trust. The corporate governance practice
is still in its early stages and needs to be developed and regulated. There is speculation that the
UAE will fully implement a code of corporate governance in 2010.

42
The organizational chart of the ESCA is presented in Figure 1 below. Table 2 provides a
comparative analysis of the CG Codes of Oman, UAE and Singapore.
Figure 2: Organisational Chart of the UAE Securities & Commodities Authority
Supervision Department
Licensing Section
Inspection Section
Trading Surveillance Section
Issues & Disclosure Department
Company Registration & Data Analysis Section
Issues Section
Disclosure & Corporate Governance Section
Human Resources & Financial Affairs Department
Personnel Affairs Section
Training & Development Section
Financial Affairs Section
Administrative Services Section
Research & Technical Support Department
Research & Financial Analysis Section
International Relations Section
Media & Awareness Section
Information Technology Section
Commodities Department
Licensing Section
Disclosure Section
Enforcement Department

43
Table 2: Comparative Analysis of Corporate Governance Codes
Description Oman Singapore UAE Regulatory authority Capital Markets Authority Singapore Exchange Limited The Emirates
Securities & Commodities Authority (ESCA)
Corporate Governance code
The Code of Corporate Governance for MSM-listed companies (second edition, April 2003)
Code of Corporate Governance 2005 Corporate Governance Regulations for Joint-Stock Companies and Criteria for Institutional Discipline (April, 2007)
Effective date June 3, 2002 January 1, 2003 2010 Previous edition/version
The Code of Corporate Governance for MSM-listed companies (Issued by Circular No. 11/2002 of June 3, 2002)
Code of Corporate Governance Corporate Governance Regulations for Joint-Stock Companies and Criteria for Institutional Discipline
Number of pages 28 22 22 Number of articles/sections
28 15 16
Number of annexure/appendices
4 1 (on Disclosure of CG arrangements) None

44
Contents: Article 1: General definition Divided into four parts:
1. Board Matters (Sections 1 - 6) 2. Remuneration Matters (Sections 7 - 9) 3. Accountability and Audit (Sections 10 - 13) 4. Communication with Shareholders (Sections 14
and 15)
Article 1: Definitions
Article 2: Applicability of the Code (to publicly listed companies and to
mutual funds organized as public companies only) 1. Board Matters Section 1: Board’s conduct of affairs Principle – The need for an effective BOD to lead and control the company, working with Management towards its success. The BOD’s collective responsibility towards company success. Guidelines – The Board’s role, disclosure of delegation of authority, meetings, matters that require board approval, appropriate training and orientation program for new directors, and formal letters of appointment of directors.
Article 2: Scope of Application
Article 3: Composition of the BOD – a majority of non-exec. directors
– role of CEO/GM and chairman shall NOT be combined - minimum one-third of Board members must be independent directors (subject to minimum of 2) - non-exec. and independent directors must be identified in ARs.
Section 2: Composition & guidance Principle – Board strength and independence from management. Domination of BOD decision-making by an individual or small group of individuals. Guidelines – Independent directors to make up at least one-third of the Board; appropriate size of the Board for effective decision-making; core competence of directors; role of non-executive directors.
Article 3: Board of Directors
Article 4: Number of BOD meetings Section 3: Chairman & CEO
Principle – Clear division of responsibilities between the Board and executive to ensure balance of power
Article 4 – Chairman of the Board of Directors

45
and authority. Guidelines – In principle, the Chairman and CEO should be separate persons, with clear division of responsibilities between them set out in writing; disclosure of relationship should be made where the two are related; role of the chairman.
Article 5: Functions of the BOD Section 4: Board membership
Principle – Formal and transparent process for the appointment of new members to the Board. Guidelines – Procedures for the appointment of new board members, including disclosure requirements.
Article 5: Responsibilities and Tasks of Directors
Article 6: BOD meetings & the role of the secretary – appointment and
function Section 5: Board performance Principle – Formal evaluation of the collective and individual performance of members of the Board. Guidelines: Procedure for the evaluation of Board performance by the nominating committee (NC).
Article 6: Board of Directors’ Committees and their Independence
Article 7: Audit committee – composition, chairmanship, expertise, number
of meetings, terms of reference, venue and quorum of meetings, relationship with the BOD, external and internal auditors
Section 6: Access to Information Principle –
Article 7 – Remunerations of Directors
Article 8: Reference to the role of the audit committee (as documented in
annexure No. 3) 2. Remuneration Matters Section 7: Procedures for developing remuneration policies Principle – Formal and transparent procedure for executive and director remuneration. Individual directors should not be involved in fixing their own remuneration. Guidelines – Set up remuneration committee (RC) made up entirely of non-executive directors; majority
Article 8: Internal Control

46
of members of the RC should be independent. RC to recommend framework of remuneration and specific remuneration packages for the CEO and each director to the Board for endorsement.
Article 9: Audit & internal control matters Section 8: Level and mix of remuneration
Principle – Remuneration should be competitive but not exorbitant. Executive directors’ remuneration should be structured and linked with corporate and individual performance. Guidelines – Performance-related elements of remuneration to align interests of executive directors with those of shareholders and link rewards to corporate and individual performance; remuneration of non-executive directors should be appropriate to their level of contribution – they should not be over-compensated to the extent that their independence may be compromised; conditions and remuneration for service contracts; encouragement of, and conditions for, long-term incentive schemes.
Article 9: Audit Committee
Article 10: Review and disclosure on the effectiveness of internal control
system Section 9: Disclosure of remuneration Principle – provision for clear disclosure of remuneration policy, level and mix of remuneration, and the procedure for setting remuneration in the company’s annual report. Guidelines – Report to shareholders annually on remuneration of directors and at least the top 5 key executives (who are not also directors) of the company. Report should include the names of directors and at least the top 5 key executives (who are not also directors) earning remuneration which falls within bands of S$250,000 and a breakdown (in
Article 10: Authorization granted by the Board of Directors
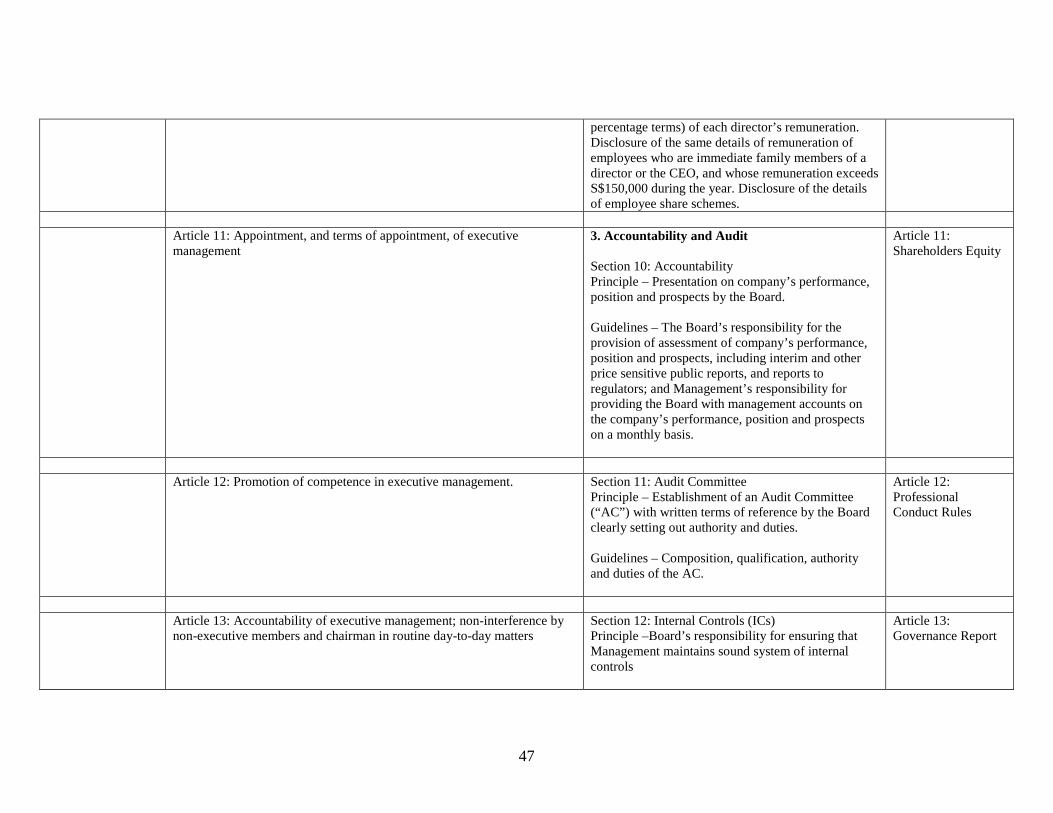
47
percentage terms) of each director’s remuneration. Disclosure of the same details of remuneration of employees who are immediate family members of a director or the CEO, and whose remuneration exceeds S$150,000 during the year. Disclosure of the details of employee share schemes.
Article 11: Appointment, and terms of appointment, of executive
management 3. Accountability and Audit Section 10: Accountability Principle – Presentation on company’s performance, position and prospects by the Board. Guidelines – The Board’s responsibility for the provision of assessment of company’s performance, position and prospects, including interim and other price sensitive public reports, and reports to regulators; and Management’s responsibility for providing the Board with management accounts on the company’s performance, position and prospects on a monthly basis.
Article 11: Shareholders Equity
Article 12: Promotion of competence in executive management. Section 11: Audit Committee
Principle – Establishment of an Audit Committee (“AC”) with written terms of reference by the Board clearly setting out authority and duties. Guidelines – Composition, qualification, authority and duties of the AC.
Article 12: Professional Conduct Rules
Article 13: Accountability of executive management; non-interference by
non-executive members and chairman in routine day-to-day matters Section 12: Internal Controls (ICs) Principle –Board’s responsibility for ensuring that Management maintains sound system of internal controls
Article 13: Governance Report

48
Guidelines – Review of adequacy of (ICs) by the AC and also ensuring independent review of the adequacy of ICs; Board comment on the adequacy of ICs.
Article 14: Functions of executive management and formal delegation of
power Section 13: Internal Audit Principle – Establishment of an independent internal audit function. Guidelines – Internal auditor’s line of reporting and professional qualification; resources for, and adequacy of, the internal audit function.
Article 14: Notifying the Authority with Violations
Article 15: Executive management and BOD’s instructions and policies 4. Communication with shareholders
Section 14: Communication with shareholders Principle – Regular, effective and fair communication with shareholders. Guidelines – Regular disclosure of pertinent information in as descriptive and detailed format as possible; Timely public disclosure of information using all available channels including modern technology such as Internet websites.
Article 15 – Violations and Penalties
Article 16: Inclusion of management discussion and analysis (MD&A) in
the company annual report Section 15: Shareholders’ Participation Principle – Encourage greater shareholder participation at AGMs; Allow shareholders the opportunity to communicate their views on various matters affecting the company. Guidelines – Shareholders’ effective participation and voting in AGMs; separate resolutions at general meetings on each substantially separate issue; Presence of chairpersons of the Audit, Nomination and Remuneration committees and the external auditor at general meetings.
Article 16- Implementation of This Decision
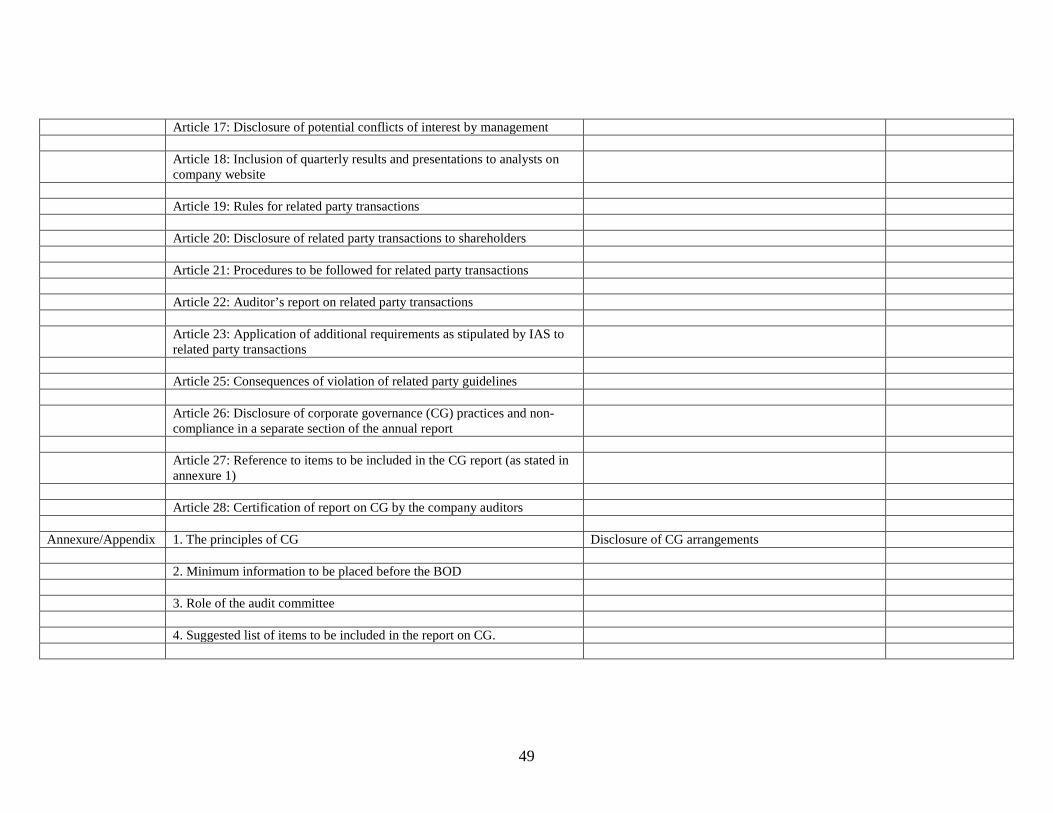
49
Article 17: Disclosure of potential conflicts of interest by management Article 18: Inclusion of quarterly results and presentations to analysts on
company website
Article 19: Rules for related party transactions Article 20: Disclosure of related party transactions to shareholders Article 21: Procedures to be followed for related party transactions Article 22: Auditor’s report on related party transactions Article 23: Application of additional requirements as stipulated by IAS to
related party transactions
Article 25: Consequences of violation of related party guidelines Article 26: Disclosure of corporate governance (CG) practices and non-
compliance in a separate section of the annual report
Article 27: Reference to items to be included in the CG report (as stated in
annexure 1)
Article 28: Certification of report on CG by the company auditors Annexure/Appendix 1. The principles of CG Disclosure of CG arrangements 2. Minimum information to be placed before the BOD 3. Role of the audit committee 4. Suggested list of items to be included in the report on CG.

50
5. DATA ANALYSIS AND DISCUSSION OF RESULTS
5.1 Data Analysis - Comparison between UAE and Oman (Internet Disclosure)
Table 3B shows that the chi-square value is insignificant (p > .05). Therefore, it can be concluded
that there is no significant difference in the proportion of companies that have websites in UAE and
Oman.
Table 3A: Website Observed N All sectors with websites (UAE) 101
All sectors websites (Oman) 84
Table 3B: Test Statistics All sectors-
website
Chi-Square(a) 1.089 Df 1 Asymp. Sig. .297 Exact Sig. .333 Point Probability .069
a 0 cells (.0%) have expected frequencies less than 5. The minimum expected cell frequency is 90.0. Table 4B reveals that the chi-square value is significant (p < .05). Therefore, it can be concluded
that there is a significant difference between the UAE and Oman in the proportion of companies
that have “Company History” information on their website. The result suggests that companies in
Oman are better than in those in UAE in disclosing “Company History” information on their
website.
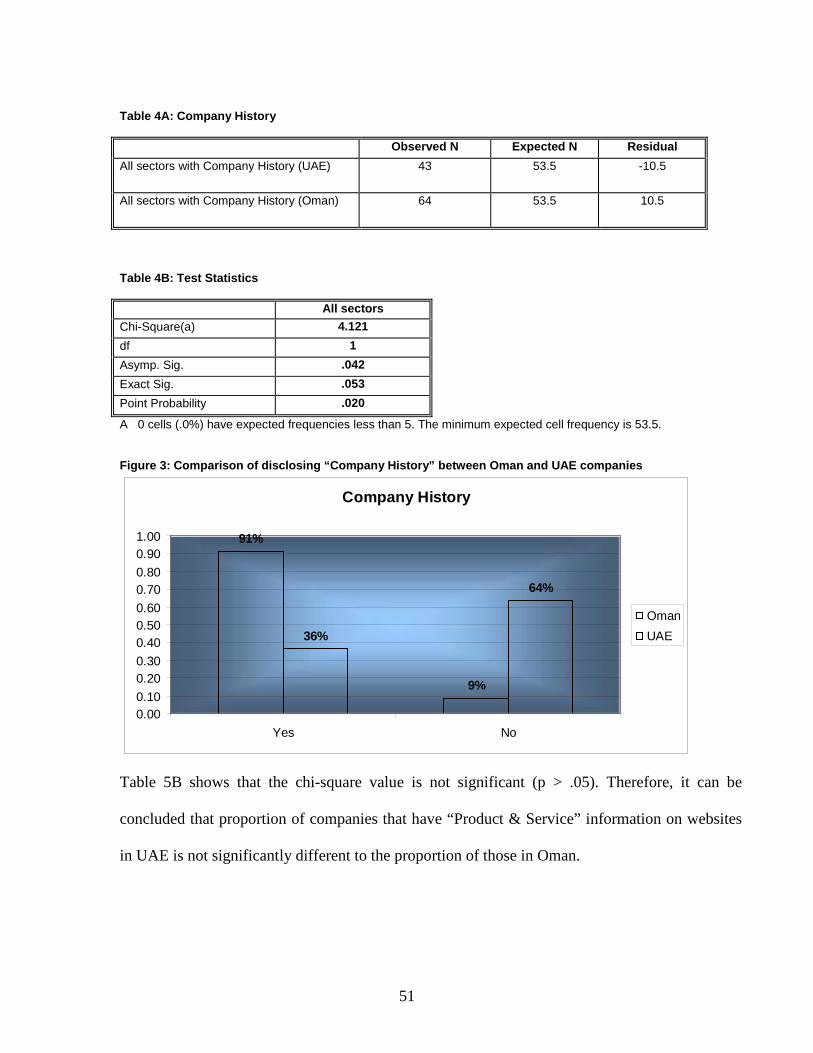
51
Table 4A: Company History Observed N Expected N Residual All sectors with Company History (UAE) 43 53.5 -10.5
All sectors with Company History (Oman) 64 53.5 10.5
Table 4B: Test Statistics All sectors Chi-Square(a) 4.121 df 1 Asymp. Sig. .042 Exact Sig. .053 Point Probability .020
A 0 cells (.0%) have expected frequencies less than 5. The minimum expected cell frequency is 53.5. Figure 3: Comparison of disclosing “Company History” between Oman and UAE companies
Company History
91%
9%
36%
64%
0.000.100.200.300.400.500.600.700.800.901.00
Yes No
OmanUAE
Table 5B shows that the chi-square value is not significant (p > .05). Therefore, it can be
concluded that proportion of companies that have “Product & Service” information on websites
in UAE is not significantly different to the proportion of those in Oman.

52
Table 5A: Product & Service Observed N Expected N Residual All sectors with Product & Service (UAE)
85 76.5 8.5
All sectors with Product & Service (Oman)
68 76.5 -8.5
Total 153
Table 5B: Test Statistics All sectors
Chi-Square(a) 1.889 df 1 Asymp. Sig. .169 Exact Sig. .196 Point Probability .050
a 0 cells (.0%) have expected frequencies less than 5. The minimum expected cell frequency is 76.5.
Figure 4: Comparison of disclosing “Product and Service Information” between Oman and UAE companies
product or service information
96%
4%
69%
31%
0.00
0.20
0.40
0.60
0.80
1.00
1.20
Yes No
OmanUAE
Table 6B reveals that the chi-square value is significant (p < .05). Therefore, it can be concluded
that there is a significant difference between the proportion of companies in UAE that have
“Financial Information” on their website and the proportion of those in Oman. The result

53
suggests that companies in UAE are better than those in Oman in disclosing “Financial
Information” on their website.
Table 6A: Financial Information Observed N Expected N Residual All sectors with Financial Information (UAE)
71 51.0 20.0
All sectors with Financial Information (Oman)
31 51.0 -20.0
Total 102
Table 6B: Test Statistics All sectors Chi-Square(a) 15.686 df 1 Asymp. Sig. .000 Exact Sig. .000 Point Probability .000
a 0 cells (.0%) have expected frequencies less than 5. The minimum expected cell frequency is 51.0. Figure 5: Comparison of disclosing “Financial Information” between Oman and UAE
Financial Information
44%
56%
36%
64%
0
0.1
0.2
0.3
0.4
0.5
0.6
0.7
Yes No
OmanUAE
Figure 5 shows that 100% of the UAE companies provided their financial information (annual
reports) in PDF format while only 67% of the Omani companies provided their financial
information in PDF format. Out of the remaining number of the Omani companies, 25%
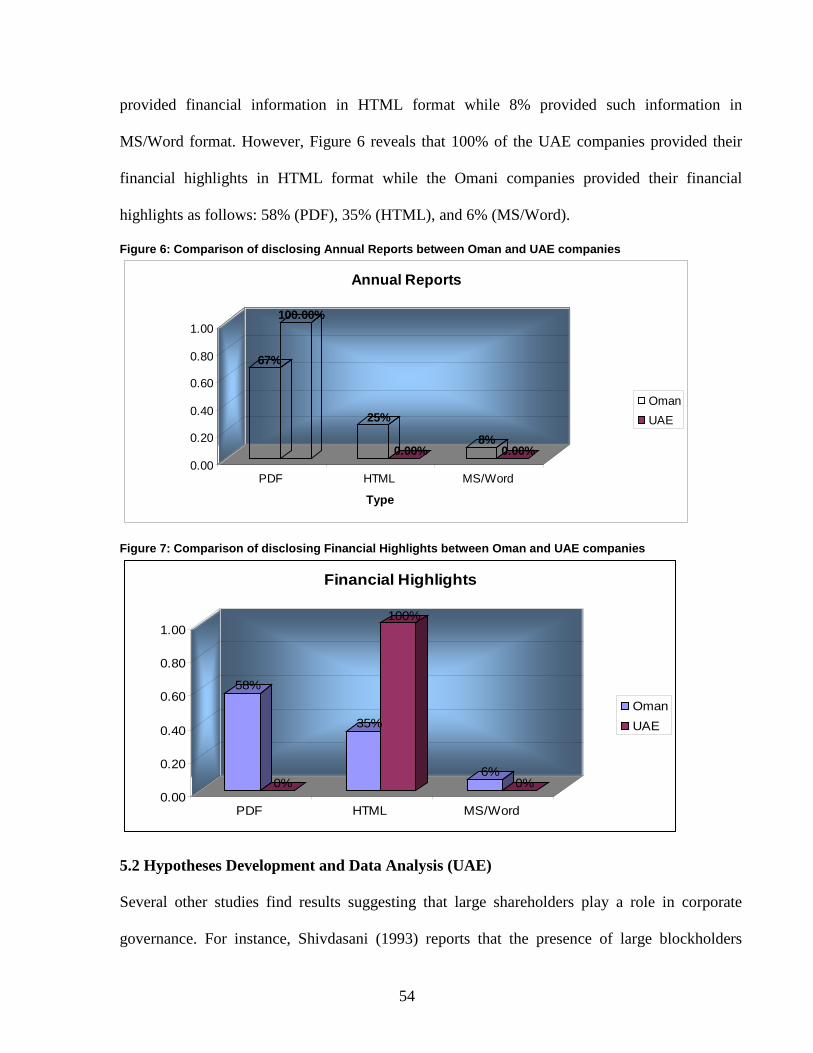
54
provided financial information in HTML format while 8% provided such information in
MS/Word format. However, Figure 6 reveals that 100% of the UAE companies provided their
financial highlights in HTML format while the Omani companies provided their financial
highlights as follows: 58% (PDF), 35% (HTML), and 6% (MS/Word).
Figure 6: Comparison of disclosing Annual Reports between Oman and UAE companies
67%
100.00%
25%
0.00%8%
0.00%0.00
0.20
0.40
0.60
0.80
1.00
PDF HTML MS/Word
Type
Annual Reports
OmanUAE
Figure 7: Comparison of disclosing Financial Highlights between Oman and UAE companies
58%
0%
35%
100%
6%0%
0.00
0.20
0.40
0.60
0.80
1.00
PDF HTML MS/Word
Financial Highlights
OmanUAE
5.2 Hypotheses Development and Data Analysis (UAE) Several other studies find results suggesting that large shareholders play a role in corporate
governance. For instance, Shivdasani (1993) reports that the presence of large blockholders
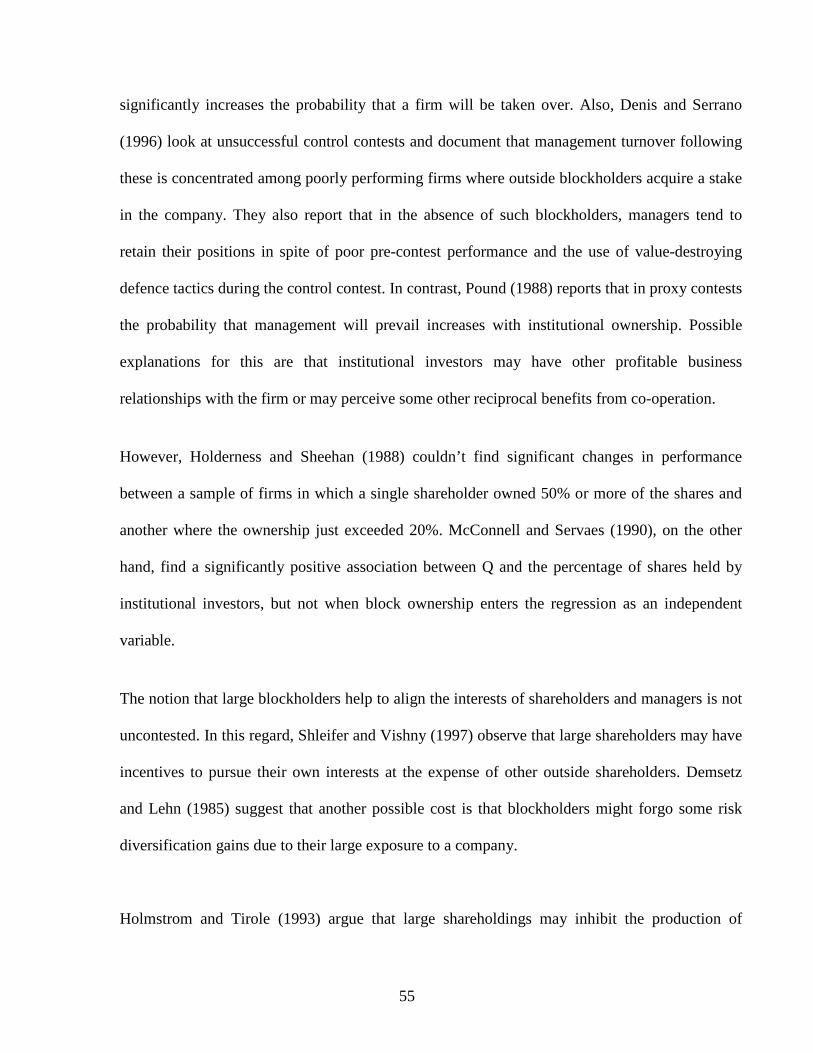
55
significantly increases the probability that a firm will be taken over. Also, Denis and Serrano
(1996) look at unsuccessful control contests and document that management turnover following
these is concentrated among poorly performing firms where outside blockholders acquire a stake
in the company. They also report that in the absence of such blockholders, managers tend to
retain their positions in spite of poor pre-contest performance and the use of value-destroying
defence tactics during the control contest. In contrast, Pound (1988) reports that in proxy contests
the probability that management will prevail increases with institutional ownership. Possible
explanations for this are that institutional investors may have other profitable business
relationships with the firm or may perceive some other reciprocal benefits from co-operation.
However, Holderness and Sheehan (1988) couldn’t find significant changes in performance
between a sample of firms in which a single shareholder owned 50% or more of the shares and
another where the ownership just exceeded 20%. McConnell and Servaes (1990), on the other
hand, find a significantly positive association between Q and the percentage of shares held by
institutional investors, but not when block ownership enters the regression as an independent
variable.
The notion that large blockholders help to align the interests of shareholders and managers is not
uncontested. In this regard, Shleifer and Vishny (1997) observe that large shareholders may have
incentives to pursue their own interests at the expense of other outside shareholders. Demsetz
and Lehn (1985) suggest that another possible cost is that blockholders might forgo some risk
diversification gains due to their large exposure to a company.
Holmstrom and Tirole (1993) argue that large shareholdings may inhibit the production of
56
information in the market. Burkart (1995) suggests that aggressive counter-bidding by incumbent
blockholders may actually reduce the likelihood of takeover attempts. Burkart, Gromb and
Panunzi (1997) present a model where there is a trade-off between the benefits and costs of the
presence of large shareholders. The costs involved are associated with an ex-ante expropriation
threat that reduces managerial initiative. The level of ownership concentration is then an
outcome of a trade-off between these factors.
But even if large blockholders are a priori willing to perform a monitoring role, several
institutional and other constraints may act as inhibiting forces to their activism. Black (1998)
points out that legal rules, agency costs within the institutions, information costs, competition
(e.g., between mutual funds), collective action problems and limited institutional competence are
some of the partial explanations for the alleged lack of activism by American institutional
investors. Consistent with this view, Wahal (1996) finds no evidence that pension fund activism
can compensate for an active market for corporate control.
Mallin (1997) presents evidence that UK institutions are less active than their US counterparts as
they report that their voting levels are markedly below those observed in the US. Black and
Coffee (1994) provide a general description of the legal and institutional environment facing
most large shareholders in the UK. They suggest that institutional activism is mostly crisis-
driven, institutions are usually reluctant to be involved in proxy fights, and usually prefer
informal, behind-the-scenes interventions to formal coalitions. However, they note that the
existence of pre-emptive rights for new issues embedded in UK's Company Law provides
institutional shareholders with an important source of leverage over managers. In contrast with
Mallin (1997), Black and Coffee (1994) conclude that UK institutions are more involved in

57
corporate governance than their US counterparts (partly due to fewer regulatory controls). They
note, however, that UK institutional activism still faces several constraints. These include the
costs related to the formation and maintenance of coalitions, little incentives for money managers
to invest in monitoring, conflicts of interest within the same institutional entity (e.g. between its
pension fund and merchant banking activities) and insider-trading or control-person liability
worries.
In spite of the constraints facing blockholders (especially institutional investors), Carleton,
Nelson and Weisbach (1998) argue that the increasing size of financial institutions (usually the
most important blockholders) in the most recent decades is an important factor encouraging large
investors' greater activism. They argue that a larger stake in a company can encourage potential
institutional monitors to deviate from the more traditional "Wall-Street" or "vote-with-the-feet"
rules, whereby institutions prefer to sell their stock than to engage in active monitoring.
Consistent with this, they find evidence of significant influence of a large institution on corporate
governance issues through private negotiations. Similarly, Smith (1996) also finds evidence of
relevant monitoring activism by a large institutional investor. Finally, Brickley, Lease and Smith
(1994) document increasing institutional activism in proxy fights and point out that recent
changes in SEC rules facilitate the formation of coalitions among investors.
Mallin (1997) observes significant activism by some of the largest UK institutional investors and
reports significantly larger voting levels by UK's twenty largest institutional investors than by all
institutional investors. She also finds that the largest voting levels can be found in insurance
companies, pension funds and unit trusts. Brickley, Lease and Smith (1988) find that opposition
by institutional shareholders to anti-takeover amendments is greatest when proposals reduce

58
stockholders' wealth. McConnell and Servaes (1990) find evidence that the fraction of shares
owned by institutions is positively associated with performance (measured by Tobin Q) and that
institutional ownership reinforces the positive impact of insider ownership on performance. In
the UK, Short and Keasey (1997) observe no independent effect of institutional ownership on
performance, but find evidence of a positive interaction between insider and institutional
ownership in the determination of firm performance. All these studies interpret the above
evidence as consistent with the assertion that institutions exert a monitoring role over managers.
The hypothesis to be tested is as follows:
H1: There is a negative association between the blockholders and the firm’s performance.
Institutional Investors (Instit)
Institutional investors are considered as a major governance mechanism that improves firm
performance. Demsetz (1983) and Shleifer and Vishny (1986)1
With regard to managerial discretion, Chung et al. (2002) examine the relationship between
institutional monitoring and opportunistic earning management. They state that high institutional
investors could mitigate the opportunistic behavior of managers and control their discretion on
, among others, argue that
institutional investors are well-informed and practicing their voting rights systematically to
monitor the managers. They conclude the so-called ‘active monitoring hypothesis’ which expects
a positive relationship between institutional ownership and firm performance. However, Pound
(1988), for example, expects a negative relationship due to the strategic alignment between the
institutional investors and the managers of the firm.
1The literature of corporate governance treats institutional investors as part of the large shareholders who have both the motive and capability of monitoring and disciplining bad managers (see for example Shleifer and Vishny, 1997).
59
accruals. Following the same line of research, Koh (2003) reveals that there is a negative
association between institutional investors and managerial discretion which means that such
investors can play a significant role in monitoring managers and reducing agency costs. This
variable is used widely in empirical research regarding the relationship between ownership
structure and performance; however, the results are mixed. Some studies support the active
monitoring hypothesis (e.g. McConnell and Servaes, 1990) while others do not (e.g. Jones et al.,
1997).
The variable of institutional investors is included in our model as an internal corporate
governance mechanism as was done by Larcker et al. (2004), Jong et al. (2005) and Joh (2003).
It is computed as the proportion of the ordinary shares held by the institutional investors. The
expected sign for the effect of institutional investors on performance is positive. The hypothesis
to be tested is as follows:
H2: There is a positive association between the institutional investors and the firm performance.
Governmental Ownership (Gov)
Theoretically, the property rights theory expects that the private firms will outperform the state-
owned ones as far as the firms work within a competitive economy and the public enterprises do
not get externalities (e.g., Alchian and Demsetz, 1972). The empirical results are mixed.
Boardman and Vining (1989) show that the private-owned companies outperform the state-
owned ones, whereas Sun et al. (2002) find that partial government ownership has a positive
impact on the performance. Recently, the latter argument had been examined in several
countries using the performance data of the privatized firms; the results also are mixed (e.g.
Dyck, 2001).
60
The governmental ownership variable is considered in this study because governmental
investments may have some social and economical goals above and beyond that of profitability,
and hence they have governance systems different from those of other ownership patterns.
Governmental investors may not consider improving shareholders’ value as their primary
objective. In other words, they may focus more on objectives related to non-profitable activities,
which could be in conflict with other shareholders’ commercial objectives (Mak and Li, 2001).
However, the UAE government has significant ownership in some of the listed firms. As a
result, these firms are more likely to have greater ease with which to secure financing from
different sources compared to other firms. In addition, these firms may have less pressure to
comply with the financial reporting requirements which could give their managers some rooms
to select those accounting choices that improve the firm performance measurement (Tobin's q).
The governmental ownership variable is measured by the proportion of ordinary shares owned
by the government and it is used as an internal corporate governance mechanism. The expected
sign for the effect of that variable on firm performance is positive. The hypothesis to be tested is
as follows:
H3: There is a positive association between governmental ownership and the firm performance.
Board Size (Bos)
Board of directors is one of the most important corporate governance mechanisms (Jensen, 1993;
Yermack, 1996; Huther, 1997; Eisenberg et al., 1998). This mechanism should, in theory, reduce
the agency problems inherent in public companies. The academic literature has focused on
specific characteristics such as board composition and Chair/CEO duality which are ignored in
61
this study. This is because of the similarities in the board composition and the separation of the
roles of CEOs and chairs across the sample used in this study. Since there has been relatively
little work on the association between board size and firm performance, the board size variable is
used in this study to see whether it has an effect on firm performance.
Lipton and Lorsch (1992) and Jenson (1993), among others, state that the board size is a good
monitoring mechanism. Haniffa and Hudaib (2006) examine the relationship between corporate
governance structure and firm performance. They use a sample of 347 companies listed on the
Kuala Lumpur Stock Exchange. Their results show that board size and top five substantial
shareholdings have significant relationship with market and accounting performance measures.
Anthony and Nicholas (2006) study the effect of selected corporate governance indicators such
as board size and CEO duality on firms’ financing decisions. They use 47 listed firms on the
Nairobi Stock Exchange and find that larger board sizes use more debts regardless of their
maturity period. This indicates that board size has impact on firms’ financing choices and hence
on firm performance.
In a similar line of research, Kamran et al. (2006) test the association between earnings contents
and two corporate governance variables (i.e. board size and proportion of outside directors),
using New Zealand firms. They find a negative relationship between earnings contents and board
size, however, no relation is found with the proportion of outside directors. Ben-Amar and Andre
(2006) test the association between ownership structure and acquiring firm performance. They
use other corporate governance variables (i.e., unrelated directors, and board size). The results
reveal that outside block holders, unrelated directors, and small board size have a positive impact
62
on acquiring firm performance. Rose (2005) use a sample of Danish listed firms to examine the
relationship between firm performance and the composition of semi-two-tier boards. The results
show that board size, proportion of insiders, and positions held by board members have
insignificant influence on firm performance. The empirical results support the previous argument
that large boards may destroy corporate value. Basu et al. (2007) analyze 174 large Japanese
corporations and use, among other variables, board size as monitoring mechanisms to measure
corporate governance mechanisms. They find a negative relationship between board size and
subsequent accounting performance. Bozec and Dia (2007) examine the board performance
relationship for a group of 14 Canadian state-owned enterprises (SOEs). Their results show that
the role of board size and board independence can be effective if SEOs are exposed to market
discipline. The results of the effect of board size on corporate performance are mixed; however,
it could be argued that this effect is generally negative. Therefore, the expected sign for the effect
of board size variable on firm performance is negative. The hypothesis to be tested is as follows:
H4: There is a negative association between board size and the firm performance.
Audit Type (Audtyp)
The presence of a large international audit firm (i.e., Big 4) has been considered as a significant
factor in the possibility of having a good corporate governance mechanism. These firms are
expected, on average, to provide a relatively high quality of auditing service (Kane & Velury,
2004). Yi Meng et al. (2005) examine empirically the relationship between audit quality
(measured by industry specialization) and the number of audit committee meetings in a year (as a
signal of good corporate governance practice). They find that an association exists between the
presence of an audit committee and an industry specialist audit firm. To sum up, it is possible

63
for big audit firms to control opportunistic management behaviors, reduce agency costs, and
increase the firm’s value. This variable which is used as an external mechanism represents a
dummy variable and takes one if the audit firm is one of the Big 4 and zero otherwise. The
expected sign for the effect of audit type variable on firm performance is positive. The
hypothesis to be tested is as follows:
H5: The performance of firms engaging by one of the Big 4 is significantly better than that of firms engaging with other auditing firms.
Payout Ratio (Divi)
It is argued that paying out more dividends forces the firm into the new issue market more
frequently and exposes it to more monitoring (Easterbrook, 1984). Moreover, higher payout can
limit management discretion over free cash flow (Jensen, 1986). Therefore, a positive impact is
expected for the payout ratio on firm performance. Payout ratio is calculated by the dividends per
share as a percentage of the earnings per share as by Bohren and Odegaard (2003).2
H6: There is a positive association between the firm payout and the firm performance.
The
hypothesis to be tested is as follows:
Debt Ratio (DA)
Debt ratio is employed by several studies such as Larcker et al. (2004); Bohren and Odegaard
(2003) and Weir et al. (2002). The ratio is calculated by dividing total debt by total assets. It is
argued that debt ratio has a mixed effect on firm performance. On one hand, a positive effect
may stem from reducing the free cash flows, exposing the firm more to monitoring by the
2 Both of debt and payout ratios were used widely in finance and accounting literatures as control variables. However, we have adopted the view of Agrawal and Knoeber (1996), Farinha (2003), and Bohren and Odegaard (2003) who treat them as internal corporate governance (or disciplining) mechanisms.
64
market.3
H7: There is a negative association between the debt ratio and the firm performance.
In addition, the threat caused by failure to pay debts serves as an effective motivating
force that make firms more efficient (Bhandari and Weiss, 1996). On the other hand, a negative
effect of debt may be caused by either the bankruptcy cost or the debt agency cost (Ross et al.
2002, p. 390–452). These costs can spiral into more significant problem as the cash crunch
intensifies. Therefore, a negative impact of debt ratio is expected on firm performance. The
hypothesis to be tested is as follows:
Control Variable (Firm Size)
The firm size variable is a control variable which is proved to have an effect on firm
performance and is used widely in the empirical literature of corporate governance because it has
a direct effect on firm performance. However, firm size could have an ambiguous effect on firm
performance. For example, larger firms can be less efficient than smaller ones because they may
encounter more government bureaucracy, more redundancy and bigger agency problems (Sun et
al., 2002). But, large firms may turn out to be more efficient as they are likely to exploit
economies of scale, employ more skilled managers and market power (Kumar, 2004). Since
governmental ownership is high and there is no corporate income tax, firm size is expected to
have a positive sign for its impact on the performance of UAE firms. The firm size is measured
by the natural logarithm of the sales in line with Weir et al. (2002) and Klapper and Love
(2003)4
H8: There is a positive association between the firm size and the firm performance.
. The hypothesis to be tested is as follows:
3The interest tax savings is an additional source of the positive effect of the debt ratio, but it is not applicable to UAE firms since there is no corporate income tax. 4 Some other studies have used the total assets instead of the revenues as a proxy for the firm size. However, we use sales because the dependent variable, Tobin's q, has already incorporated the value of total assets.
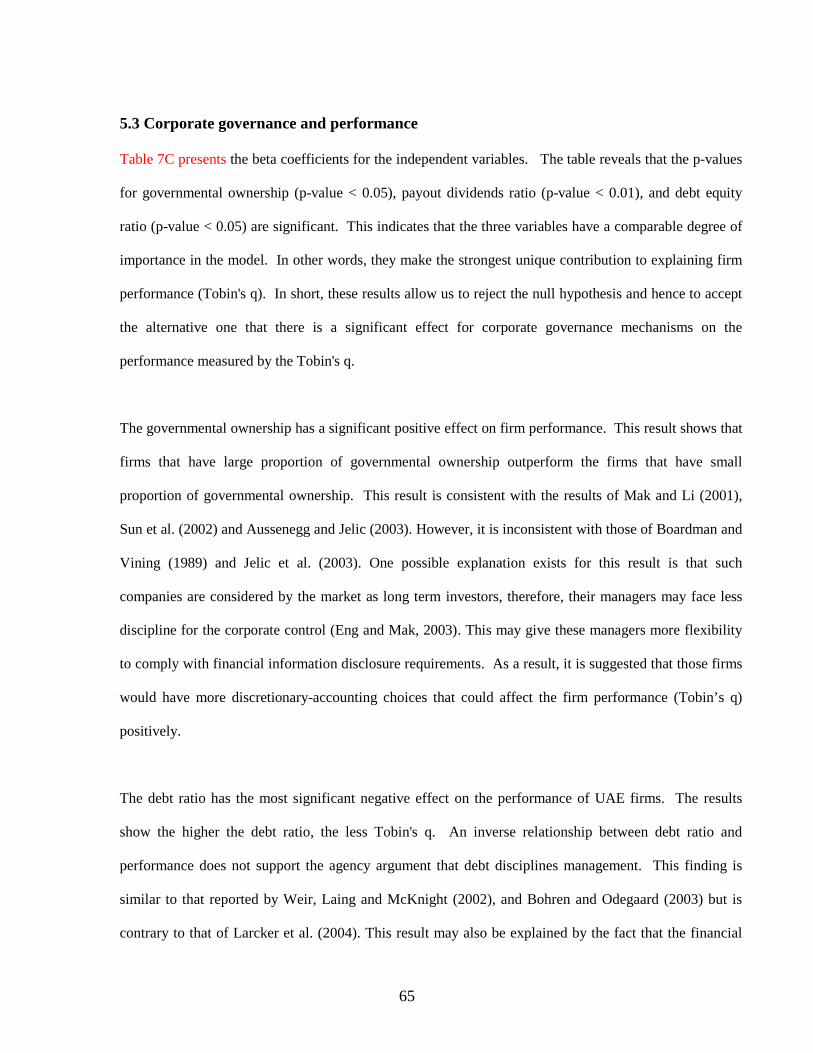
65
5.3 Corporate governance and performance Table 7C presents the beta coefficients for the independent variables. The table reveals that the p-values
for governmental ownership (p-value < 0.05), payout dividends ratio (p-value < 0.01), and debt equity
ratio (p-value < 0.05) are significant. This indicates that the three variables have a comparable degree of
importance in the model. In other words, they make the strongest unique contribution to explaining firm
performance (Tobin's q). In short, these results allow us to reject the null hypothesis and hence to accept
the alternative one that there is a significant effect for corporate governance mechanisms on the
performance measured by the Tobin's q.
The governmental ownership has a significant positive effect on firm performance. This result shows that
firms that have large proportion of governmental ownership outperform the firms that have small
proportion of governmental ownership. This result is consistent with the results of Mak and Li (2001),
Sun et al. (2002) and Aussenegg and Jelic (2003). However, it is inconsistent with those of Boardman and
Vining (1989) and Jelic et al. (2003). One possible explanation exists for this result is that such
companies are considered by the market as long term investors, therefore, their managers may face less
discipline for the corporate control (Eng and Mak, 2003). This may give these managers more flexibility
to comply with financial information disclosure requirements. As a result, it is suggested that those firms
would have more discretionary-accounting choices that could affect the firm performance (Tobin’s q)
positively.
The debt ratio has the most significant negative effect on the performance of UAE firms. The results
show the higher the debt ratio, the less Tobin's q. An inverse relationship between debt ratio and
performance does not support the agency argument that debt disciplines management. This finding is
similar to that reported by Weir, Laing and McKnight (2002), and Bohren and Odegaard (2003) but is
contrary to that of Larcker et al. (2004). This result may also be explained by the fact that the financial

66
market in the UAE till the time of our data, 2004, is still less efficient and can not discipline the
incumbent managers according to the free cash flow hypothesis. On the other hand, most of the debts in
the UAE firms come from bank loans and the negative effect of debt ratio may be explained by the
increase in the debt agency cost such as the costs of monitoring and bonding the firm by banks. Another
possible explanation is that the firms with high debt ratio face an increasing cost of operating as they try
to meet their obligations of paying higher interest rates. These higher interest payments can cause serious
cash problems and reduce significantly the firms’ earnings which would have a negative impact on their
performance (Tobin’s q).
The model shows that the payout ratio has a significant negative impact on Tobin's q. This result is
similar to that of Bohren and Odegaard (2003) and does not support the theoretical expectation regarding
the disciplining role of it. However, this result can be interpreted in different scenarios. It is argued that
firms that have high payout ratio are more likely to use up their opportunities to reinvest for future
growth. In other words, the higher the payout ratio, the less the retained earnings, and hence the less the
growth rate which was captured here by the Tobin's q. Another argument is that the significant negative
effect of the payout ratio may be due to, as previously mentioned regarding the effect of the debt ratio, the
fact that the financial market in the UAE till the time of our data, 2004 is still less efficient and can not
discipline the incumbent managers according to the free cash flow hypothesis. Table 1 displays that one
of the firms paid cash dividends which were more than its net earnings. This may arise a critical question
of what is better serves the investor and the firms: paying immediate cash dividends or reinvesting
earnings for long-term growth.
At the same time, the corporate governance variables: institutional investors, audit type,
company’s size, blockholders, and board size have an insignificant impact on UAE firm
performance. This result may be interpreted by the absence of a real application for the

67
appropriate principles and standards of corporate governance to the listed firms in the UAE.
However, the institutional investors have a negative, although insignificant, impact on Tobin's q.
This result doesn’t supports the "active monitoring hypothesis" by Demsetz (1983) and Shleifer
and Vishny (1986) among others and is not consistent with the results of Larcker et al. (2004),
but consistent with the results of Jong et al. (2005). The audit type variable has insignificant
effect on firm performance and that probably because of the good quality of the non-big audit
firms. The results shows the blockholders have insignificant negative impact on firm
performance. This is consistent with the study of Demsetz and Lehn (1985) who suggest that
blockholders might forgo some risk diversification gains due to their large exposure to a
company. The results reveal that board size has negative impact, although insignificant, on firm
performance. This suggests that the UAE firms, on average, do not select their board members
optimally which may lead to lack of coordination, communication, and cause decision making
problems.
Finally, the firm size is found to have positive impact, although insignificant, on performance as found
also by Klapper and Love (2003), Bohren and Odegaard (2003), and Larker et al. (2004). This result may
reflect an independent source of value creation, possibly due to market power and economies of scale and
scope (Bohren & Odegaard, 2003). In addition, the UAE large firms have more resources (e.g., more
skilled managers) compared to medium and small firms which may help them to be more efficient to
attract more investors and increase their firms' values.

68
Table 7A: Descriptive Statistics
Variables N Mean Std. Deviation
Institutional Investors 51 .2698 .22697 Governmental agencies 51 .1796 .22782 revenue 51 19.7059 1.30068 Tobin Q 51 1.9684 .82161 Payout dividends ratio 51 .2843 .25611 Debt/equity 51 2.2439 2.89269 No. of boards members 51 8.0784 2.02823 Tobin Q- Audit type- Others
10 2.042 .79808
Tobin Q- Audit type- Big firm
41 1.9505 .83595
Tobin Q- Blockholders 40 2.0352 .82036 Tobin Q-No blockholders 11 1.7255 .81717
Table 7B: Model Summary(b)
Model R R Square Adjusted R Square F Sig.
1 .700(a) .490 .347 3.412 .002 a Predictors: (Constant), Blockholders investors, Debt/equity, Payout dividends ratio, Audit Type, Governmental agencies, No. of boards members, Insurance vs banks, Institutional Investors, revenue, Industry vs banks, Service vs banks b Dependent Variable: Tobin Q Table 7C: Results of regression model
Variables B Std. Error t Sig. Tolerance VIF
(Constant) .109 2.073 .053 .958 Institutional Investors -.269 .521 -.517 .608 .630 1.586 Governmental agencies 1.161 .564 2.058 .046 .534 1.873 Size (Revenues) .131 .104 1.259 .216 .484 2.066 Audit Type -.082 .293 -.278 .782 .639 1.564 Payout dividends ratio -1.236 .439 -2.816 .008 .699 1.431 Debt/equity -.159 .066 -2.407 .021 .242 4.139 No. of boards members -.002 .054 -.042 .967 .736 1.359 Blockholders investors -.326 .256 -1.276 .210 .783 1.277
5.4 Relevance and Timeliness results A number of studies investigate the usefulness of forward-looking information for anticipating
future corporate performance. One such study is Clarkson et al. (1994) which finds that the
inclusion of forward-looking information in corporate annual reports is informative with respect
to corporate future performance. Another study that links corporate disclosure with corporate
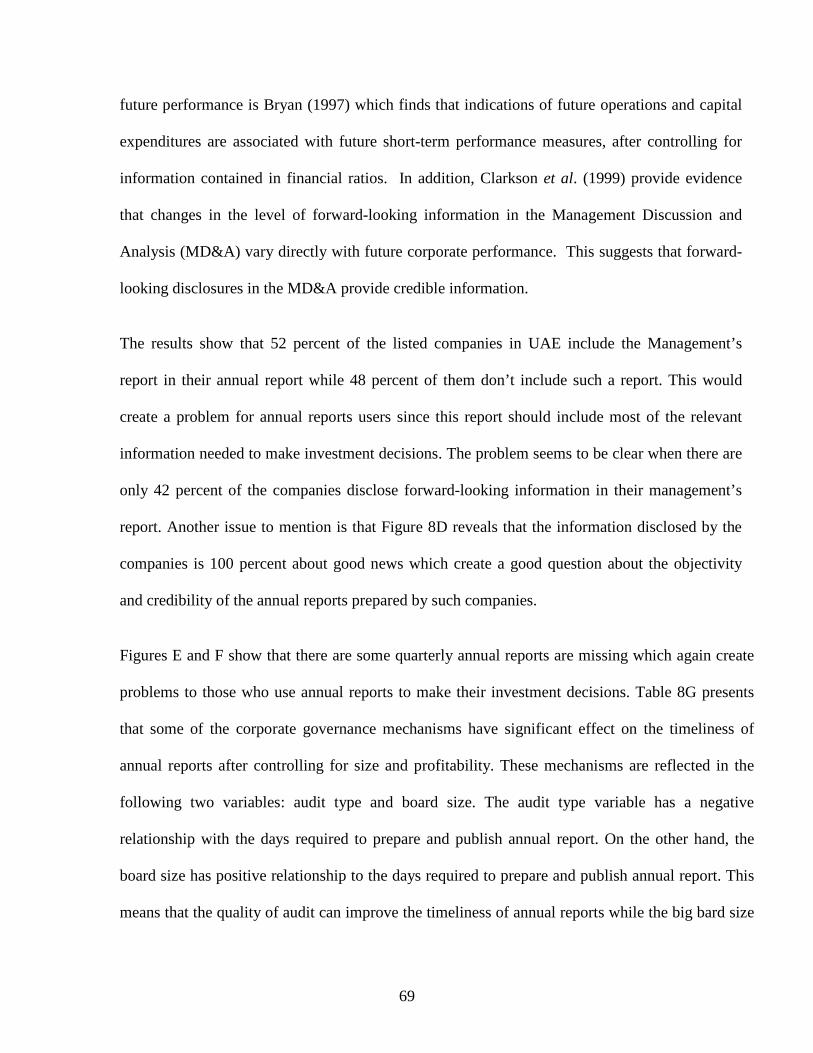
69
future performance is Bryan (1997) which finds that indications of future operations and capital
expenditures are associated with future short-term performance measures, after controlling for
information contained in financial ratios. In addition, Clarkson et al. (1999) provide evidence
that changes in the level of forward-looking information in the Management Discussion and
Analysis (MD&A) vary directly with future corporate performance. This suggests that forward-
looking disclosures in the MD&A provide credible information.
The results show that 52 percent of the listed companies in UAE include the Management’s
report in their annual report while 48 percent of them don’t include such a report. This would
create a problem for annual reports users since this report should include most of the relevant
information needed to make investment decisions. The problem seems to be clear when there are
only 42 percent of the companies disclose forward-looking information in their management’s
report. Another issue to mention is that Figure 8D reveals that the information disclosed by the
companies is 100 percent about good news which create a good question about the objectivity
and credibility of the annual reports prepared by such companies.
Figures E and F show that there are some quarterly annual reports are missing which again create
problems to those who use annual reports to make their investment decisions. Table 8G presents
that some of the corporate governance mechanisms have significant effect on the timeliness of
annual reports after controlling for size and profitability. These mechanisms are reflected in the
following two variables: audit type and board size. The audit type variable has a negative
relationship with the days required to prepare and publish annual report. On the other hand, the
board size has positive relationship to the days required to prepare and publish annual report. This
means that the quality of audit can improve the timeliness of annual reports while the big bard size
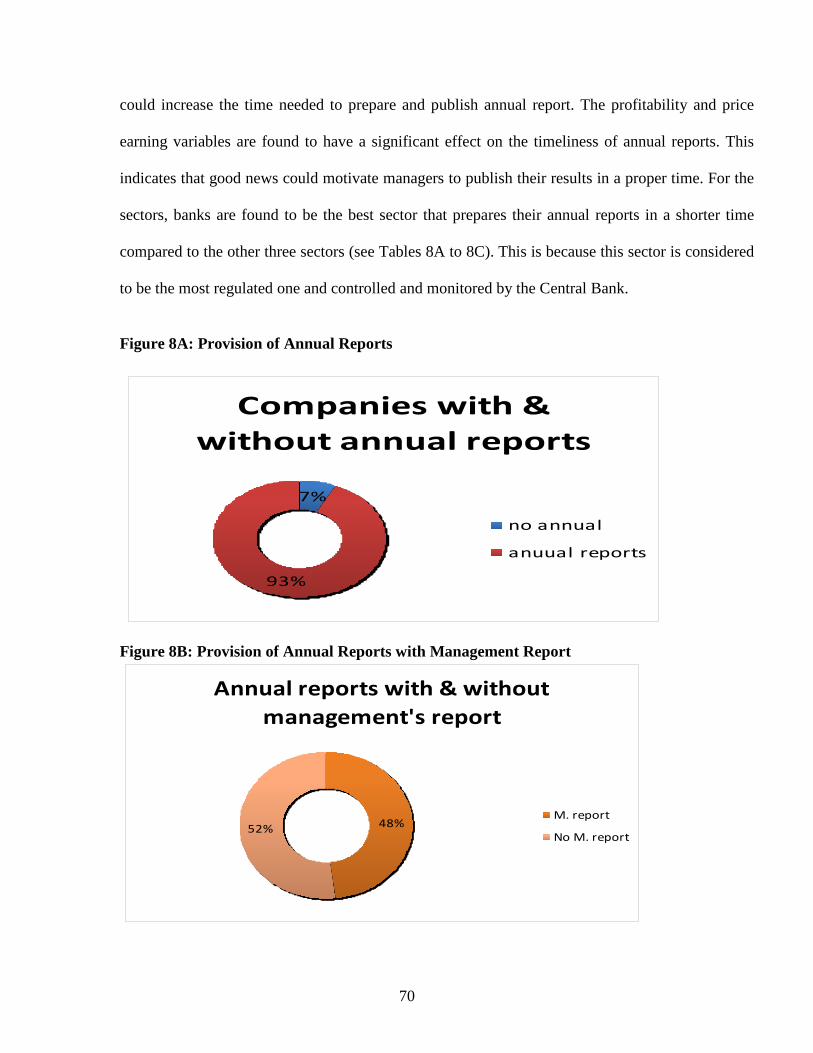
70
could increase the time needed to prepare and publish annual report. The profitability and price
earning variables are found to have a significant effect on the timeliness of annual reports. This
indicates that good news could motivate managers to publish their results in a proper time. For the
sectors, banks are found to be the best sector that prepares their annual reports in a shorter time
compared to the other three sectors (see Tables 8A to 8C). This is because this sector is considered
to be the most regulated one and controlled and monitored by the Central Bank.
Figure 8A: Provision of Annual Reports
Companies with & without annual reports
7%
93%
no annual
anuual reports
Figure 8B: Provision of Annual Reports with Management Report
Annual reports with & without management's report
48%52%M. report
No M. report

71
Figure 8C: Provision of Backward Versus Forward-looking information
57.50%
42.50%
0.00%
20.00%
40.00%
60.00%
Back-wardlooking info.
Only
Forwardlooking Info.
Figure 8D: Disclosure of Good news versus Bad news
100%
0%
0%
20%
40%
60%
80%
100%
Good News Bad News
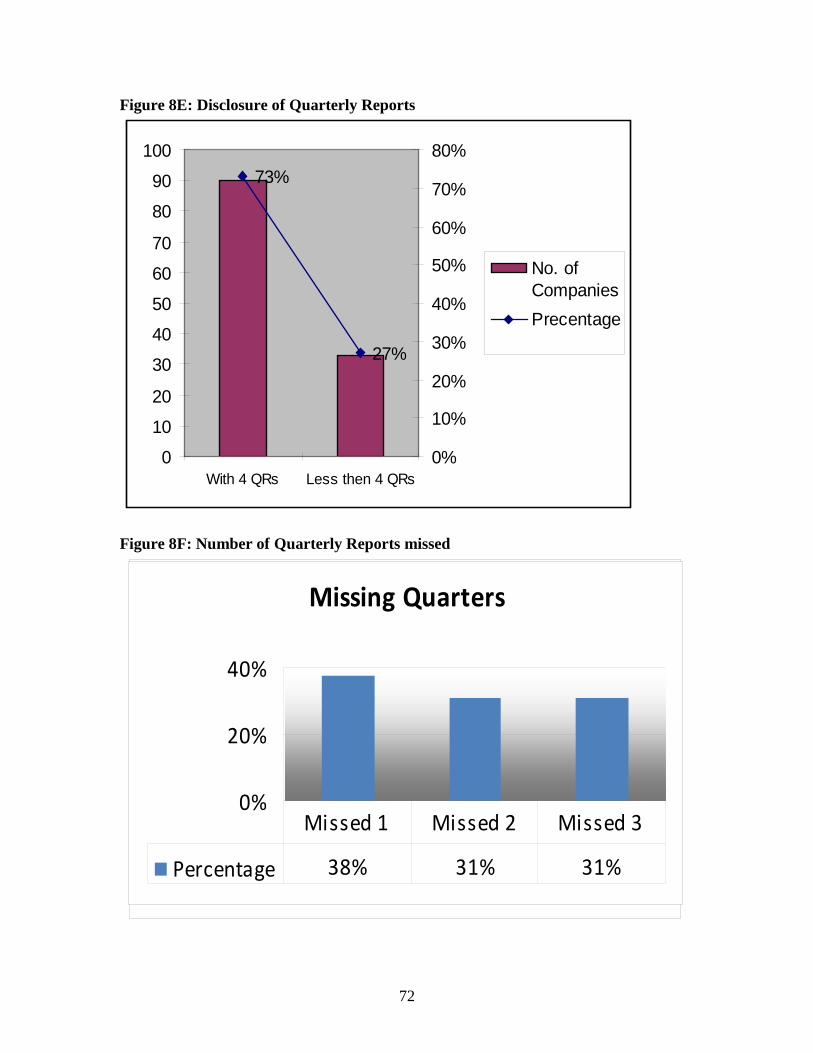
72
Figure 8E: Disclosure of Quarterly Reports
73%
27%
0
10
20
30
40
50
60
70
80
90
100
With 4 QRs Less then 4 QRs0%
10%
20%
30%
40%
50%
60%
70%
80%
No. ofCompaniesPrecentage
Figure 8F: Number of Quarterly Reports missed
0%
10%
20%
30%
40%
50%
60%
70%
80%
Series1 73% 27%
With 4 QRs Less then 4 QRs
Missing Quarters
0%
20%
40%
Percentage 38% 31% 31%
Missed 1 Missed 2 Missed 3

73
Table 8A: Group Statistics – Banks Vs. Insurance sector All
sectors Mean(a) Std.
Deviation Std. Error
Mean
Days Banks 26.6154 21.52339 5.96951 Insurance 43.8750 19.12372 4.78093 (a)T-test shows that there is a significant difference (P-values < .05). Table 8B: Group Statistics – Banks Vs. Services sector All
sectors Mean(a) Std.
Deviation Std. Error
Mean
Days Banks 26.6154 21.52339 5.96951 Service 39.9000 25.31776 8.00618 (a)T-test shows that there is no significant difference (P-values > .05). Table 8C: Group Statistics – Banks Vs. Industry sector All
sectors Mean(a) Std.
Deviation Std. Error
Mean
Days Banks 26.6154 21.52339 5.96951 Industry 58.1000 25.37475 8.02420 (a)T-test shows that there is a significant difference (P-values < .01). Table 8D Group Statistics – Big firms vs. Others Audit
Type Mean(a) Std.
Deviation Std. Error
Mean
Days Big firm 39.4000 22.53066 3.56241 Others 59.9000 24.51961 7.75378 (a)T-test shows that there is a significant difference (P-values < .05). Table 8E: Group Statistics – Blockholders vs. Non-blockholders Blockholders
investors Mean(a) Std. Deviation Std. Error
Mean
Days Firms with one investor owns more than 5%
45.3636 26.59802 8.01960
Firms with no blockholders
41.9000 24.41500 3.86035
(a)T-test shows that there is no significant difference (P-values > .05). Table 8F: Model Summary(b) Model R R Square Adjusted R
Square F Sig.
1 .706(a) .499 .358 3.529 .002 a Predictors: (Constant), Return on Equity, revenue, Industry vs banks, Blockholders investors, No. of boards members, Service vs banks, Payout dividends ratio, Audit Type, Debt/equity, Price earnings , Insurance vs banks b Dependent Variable: Days

74
Table 8G: Regression Results on relevance and timeliness of corporate disclosure
B Std. Error t Sig. Tolerance VIF
(Constant) 69.219 62.146 1.114 .272 Size (Revenues) -2.462 3.072 -.801 .428 .490 2.042 Audit Type -23.584 9.003 -2.619 .012 .600 1.667 Payout dividends ratio -17.318 13.549 -1.278 .209 .649 1.540 Debt/equity 1.235 1.988 .621 .538 .236 4.230 No. of boards members 5.276 1.631 3.236 .002 .715 1.399 Insurance vs banks 21.874 13.698 1.597 .118 .190 5.270 Service vs banks 20.039 15.191 1.319 .195 .211 4.745 Industry vs banks 35.035 13.292 2.636 .012 .241 4.147 Blockholders investors 11.702 7.680 1.524 .136 .768 1.302 Price earnings -.459 .189 -2.425 .020 .497 2.011 Return on Equity -53.611 25.215 -2.126 .040 .616 1.624
a Dependent Variable: Days 5.5 Corporate Governance and Disclosure Table 9B presents the multiple regression coefficients (β), their standard errors, the t-statistics,
and the associated p-values. The table shows that the coefficients of payout dividends ratio and
number of board size are significant. This means that the two variables have significant effect on
disclosure. In addition, banks tend to disclose more than the other three sectors, while insurance
firms tend to disclose less than others.
On the other hand, the size, debt equity ratio, profitability, institutional investors, governmental
ownership, and audit type have an insignificant impact on the level of disclosure. These results
are consistent with a number of studies which found an insignificant relationship between these
variables and the level of disclosure. Stanga (1976) and Spero (1979) found an insignificant
relationship between the company size and the level of disclosure. Other studies such as Wallace
and Naser (1995) and Inchausti (1997) who examined the relationship between the debt equity
ratio and the level of disclosure, their results showed insignificant association between the two
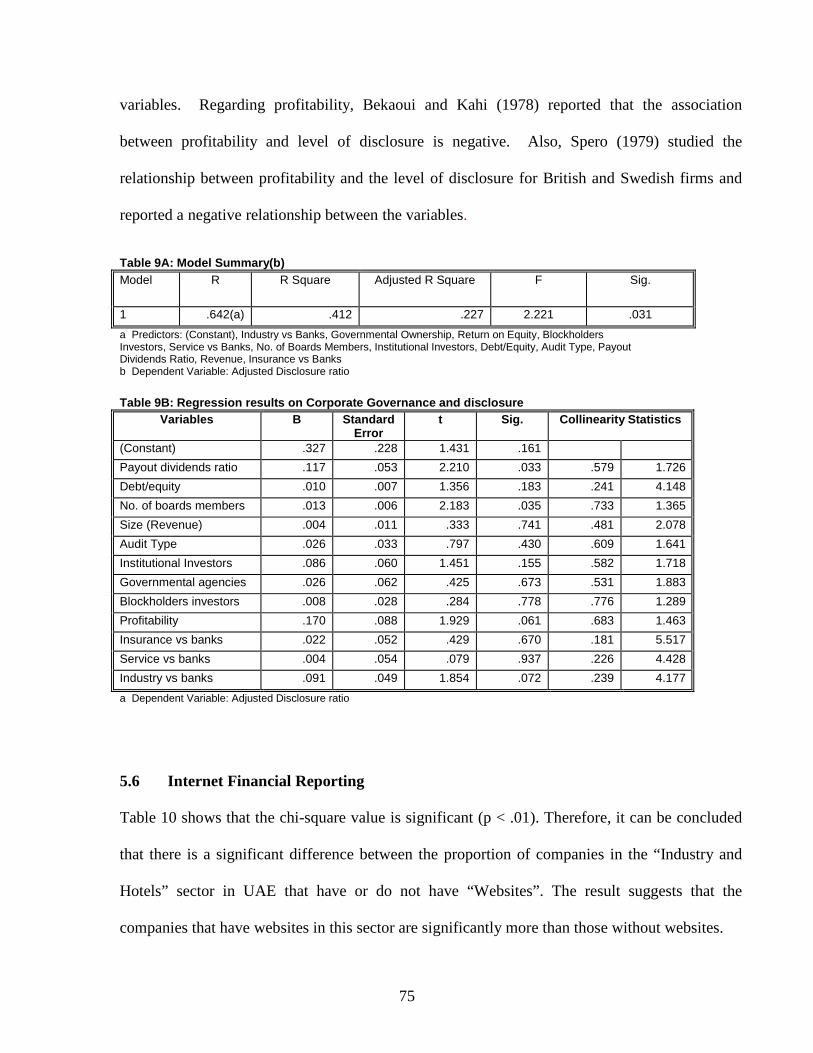
75
variables. Regarding profitability, Bekaoui and Kahi (1978) reported that the association
between profitability and level of disclosure is negative. Also, Spero (1979) studied the
relationship between profitability and the level of disclosure for British and Swedish firms and
reported a negative relationship between the variables.
Table 9A: Model Summary(b) Model R R Square Adjusted R Square F Sig.
1 .642(a) .412 .227 2.221 .031 a Predictors: (Constant), Industry vs Banks, Governmental Ownership, Return on Equity, Blockholders Investors, Service vs Banks, No. of Boards Members, Institutional Investors, Debt/Equity, Audit Type, Payout Dividends Ratio, Revenue, Insurance vs Banks b Dependent Variable: Adjusted Disclosure ratio Table 9B: Regression results on Corporate Governance and disclosure
Variables B Standard Error
t Sig. Collinearity Statistics
(Constant) .327 .228 1.431 .161 Payout dividends ratio .117 .053 2.210 .033 .579 1.726 Debt/equity .010 .007 1.356 .183 .241 4.148 No. of boards members .013 .006 2.183 .035 .733 1.365 Size (Revenue) .004 .011 .333 .741 .481 2.078 Audit Type .026 .033 .797 .430 .609 1.641 Institutional Investors .086 .060 1.451 .155 .582 1.718 Governmental agencies .026 .062 .425 .673 .531 1.883 Blockholders investors .008 .028 .284 .778 .776 1.289 Profitability .170 .088 1.929 .061 .683 1.463 Insurance vs banks .022 .052 .429 .670 .181 5.517 Service vs banks .004 .054 .079 .937 .226 4.428 Industry vs banks .091 .049 1.854 .072 .239 4.177 a Dependent Variable: Adjusted Disclosure ratio 5.6 Internet Financial Reporting Table 10 shows that the chi-square value is significant (p < .01). Therefore, it can be concluded
that there is a significant difference between the proportion of companies in the “Industry and
Hotels” sector in UAE that have or do not have “Websites”. The result suggests that the
companies that have websites in this sector are significantly more than those without websites.
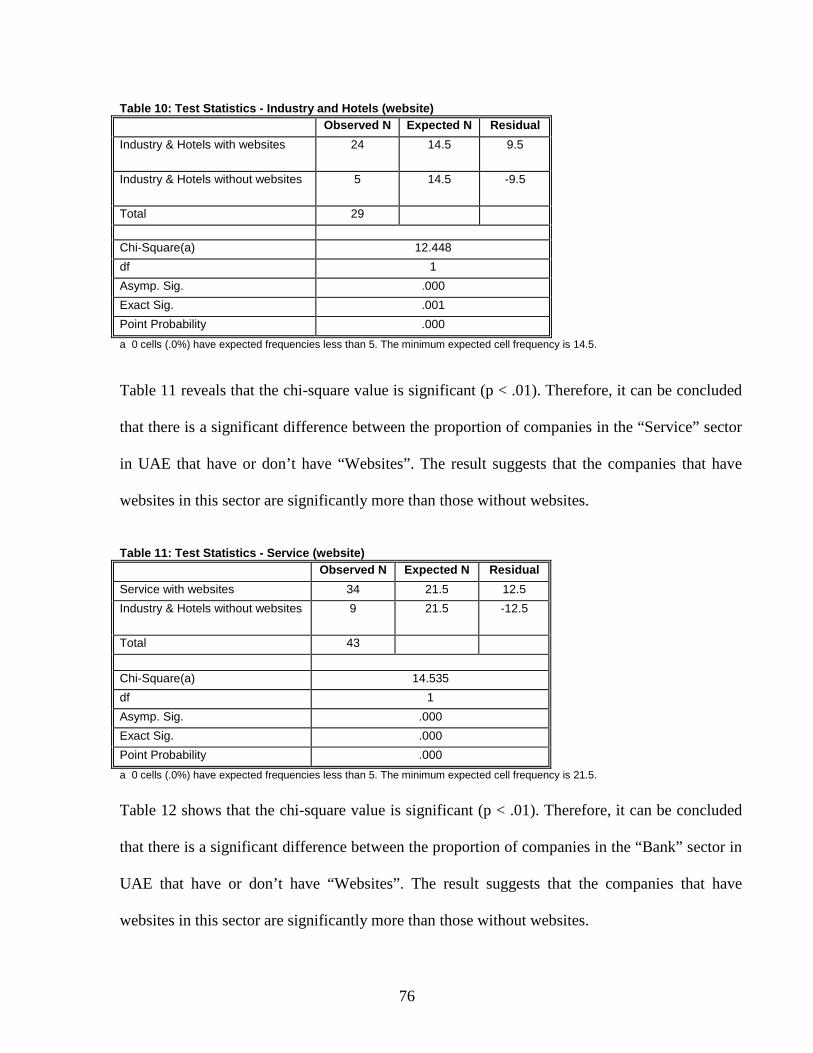
76
Table 10: Test Statistics - Industry and Hotels (website) Observed N Expected N Residual Industry & Hotels with websites 24 14.5 9.5
Industry & Hotels without websites 5 14.5 -9.5
Total 29 Chi-Square(a) 12.448 df 1 Asymp. Sig. .000 Exact Sig. .001 Point Probability .000 a 0 cells (.0%) have expected frequencies less than 5. The minimum expected cell frequency is 14.5.
Table 11 reveals that the chi-square value is significant (p < .01). Therefore, it can be concluded
that there is a significant difference between the proportion of companies in the “Service” sector
in UAE that have or don’t have “Websites”. The result suggests that the companies that have
websites in this sector are significantly more than those without websites.
Table 11: Test Statistics - Service (website) Observed N Expected N Residual Service with websites 34 21.5 12.5 Industry & Hotels without websites 9 21.5 -12.5
Total 43 Chi-Square(a) 14.535 df 1 Asymp. Sig. .000 Exact Sig. .000 Point Probability .000 a 0 cells (.0%) have expected frequencies less than 5. The minimum expected cell frequency is 21.5.
Table 12 shows that the chi-square value is significant (p < .01). Therefore, it can be concluded
that there is a significant difference between the proportion of companies in the “Bank” sector in
UAE that have or don’t have “Websites”. The result suggests that the companies that have
websites in this sector are significantly more than those without websites.
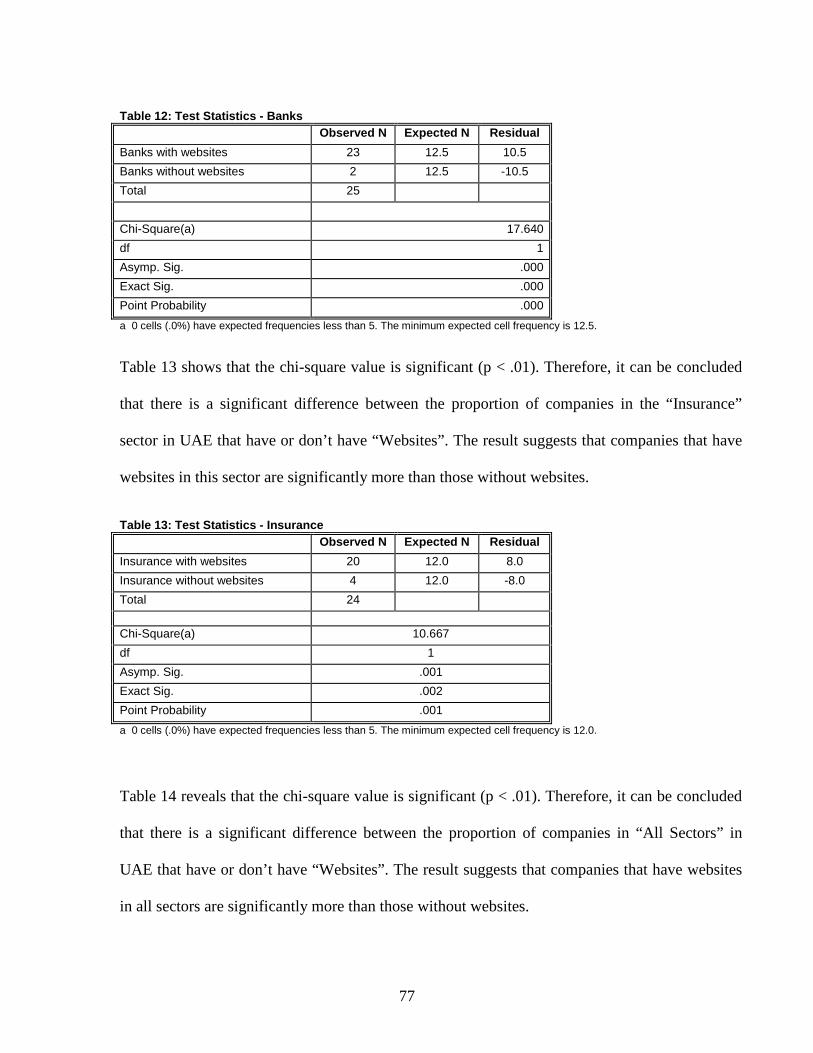
77
Table 12: Test Statistics - Banks Observed N Expected N Residual Banks with websites 23 12.5 10.5 Banks without websites 2 12.5 -10.5 Total 25 Chi-Square(a) 17.640 df 1 Asymp. Sig. .000 Exact Sig. .000 Point Probability .000 a 0 cells (.0%) have expected frequencies less than 5. The minimum expected cell frequency is 12.5.
Table 13 shows that the chi-square value is significant (p < .01). Therefore, it can be concluded
that there is a significant difference between the proportion of companies in the “Insurance”
sector in UAE that have or don’t have “Websites”. The result suggests that companies that have
websites in this sector are significantly more than those without websites.
Table 13: Test Statistics - Insurance Observed N Expected N Residual Insurance with websites 20 12.0 8.0 Insurance without websites 4 12.0 -8.0 Total 24 Chi-Square(a) 10.667 df 1 Asymp. Sig. .001 Exact Sig. .002 Point Probability .001 a 0 cells (.0%) have expected frequencies less than 5. The minimum expected cell frequency is 12.0.
Table 14 reveals that the chi-square value is significant (p < .01). Therefore, it can be concluded
that there is a significant difference between the proportion of companies in “All Sectors” in
UAE that have or don’t have “Websites”. The result suggests that companies that have websites
in all sectors are significantly more than those without websites.

78
Table 14: Test Statistics - All sectors Observed N Expected N Residual All sectors with websites 101 60.5 40.5 All sectors without websites 20 60.5 -40.5 Total 121 Chi-Square(a) 54.223 df 1 Asymp. Sig. .000 Exact Sig. .000 Point Probability .000
a 0 cells (.0%) have expected frequencies less than 5. The minimum expected cell frequency is 60.5. Table 15 reveals that the chi-square value is significant (p < .01). Therefore, it can be concluded
that there is a significant difference between the proportion of companies in the “Industry and
Hotels” sector in UAE that have or don’t have “Company History” information on their
websites. The result suggests that the companies that have “Company History” in this sector
information are significantly less than those without such information.
Table 15: Test Statistics - Industry and Hotels’ (Types) company history Observed N Expected N Residual Industry & Hotels with Company History
5 14.5 -9.5
Industry & Hotels without Company History
24 14.5 9.5
Total 29 Chi-Square(a) 12.448 df 1 Asymp. Sig. .000 Exact Sig. .001 Point Probability .000 a 0 cells (.0%) have expected frequencies less than 5. The minimum expected cell frequency is 14.5. Table 16 reveals that the chi-square value is significant (p < .05). Therefore, it can be concluded
that there is a significant difference between the proportion of companies in the “Service” sector
in UAE that have or don’t have “Company History” information on their websites. The result
suggests that the companies that have “Company History” information in this sector are
significantly less than those without such information.

79
Table 16: Test Statistics – Services sector company history Observed N Expected N Residual Service with Company History 13 21.5 -8.5
Service without Company History 30 21.5 8.5
Total 43 Chi-Square(a) 6.721 df 1 Asymp. Sig. .010 Exact Sig. .014 Point Probability .008 a 0 cells (.0%) have expected frequencies less than 5. The minimum expected cell frequency is 21.5. Table 17 reveals that the chi-square value is significant (p < .01). Therefore, it can be concluded
that there is a significant difference between the proportion of companies in the “Banks” sector
in UAE that have or don’t have “Company History” information on their websites. The result
suggests that the companies that have “Company History” information in this sector are
significantly more than those without such information.
Table 17: Test Statistics – Banks company history Observed N Expected N Residual Banks with Company History 19 12.5 6.5
Banks without Company History 6 12.5 -6.5
Total 25 Chi-Square(a) 6.760 df 1 Asymp. Sig. .009 Exact Sig. .015 Point Probability .011 a 0 cells (.0%) have expected frequencies less than 5. The minimum expected cell frequency is 12.5. Table 18 reveals that the chi-square value is significant (p < .05). Therefore, it can be concluded
that there is a significant difference between the proportion of companies in the “Insurance”
sector in UAE that have or don’t have “Company History” information on their websites. The

80
result suggests that the companies that have “Company History” information in this sector are
significantly less than those without such information.
Table 18: Test Statistics – Insurance sector company history Observed N Expected N Residual Insurance with Company History 7 12.0 -5.0
Insurance without Company History
17 12.0 5.0
Total 24 Chi-Square(a) 4.167 df 1 Asymp. Sig. .041 Exact Sig. .064 Point Probability .041 a 0 cells (.0%) have expected frequencies less than 5. The minimum expected cell frequency is 12.0.
Table 19 reveals that the chi-square value is significant (p < .01). Therefore, it can be concluded
that there is a significant difference between the proportion of companies in “All Sectors” in
UAE that have or don’t have “Company History” information on their websites. The result
suggests that the companies that have “Company History” information in this sector are
significantly less than those without such information.
Table 19: Test Statistics – All Sectors company history Observed N Expected N Residual All sectors with Company History 44 60.5 -16.5
All sectors without Company History
77 60.5 16.5
Total 121 All sectors
Chi-Square(a) 9.000 df 1 Asymp. Sig. .003 Exact Sig. .003 Point Probability .002 a 0 cells (.0%) have expected frequencies less than 5. The minimum expected cell frequency is 60.5.
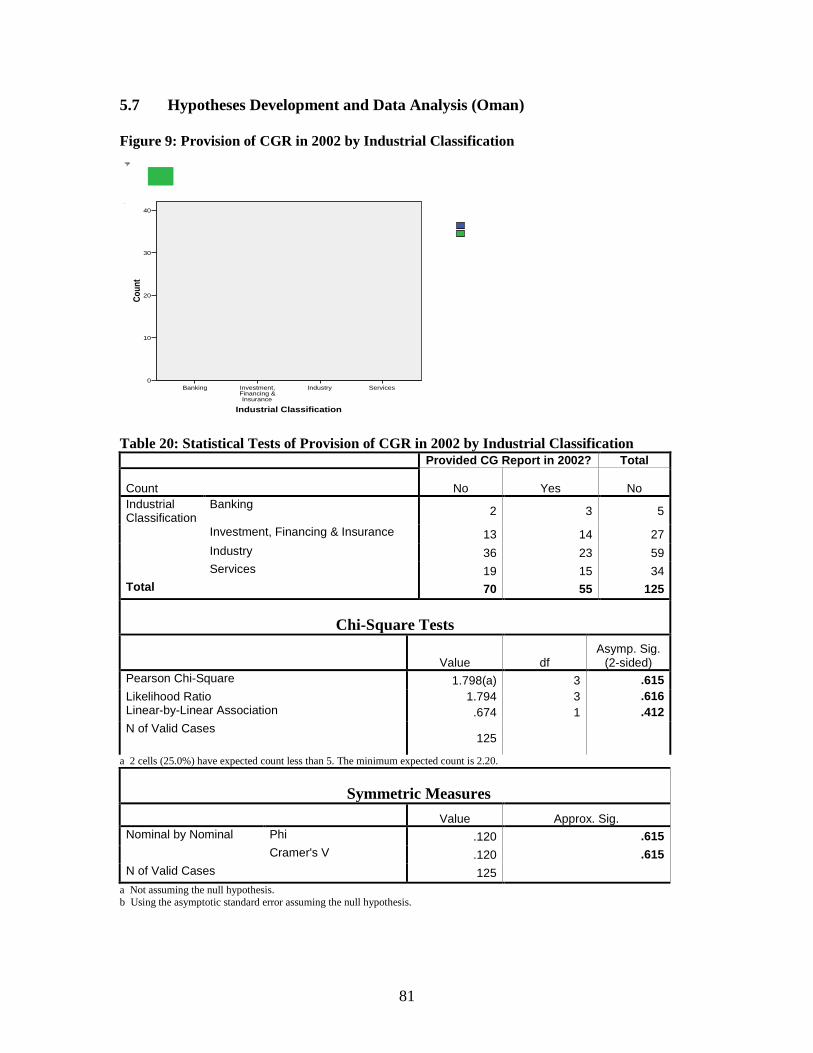
81
5.7 Hypotheses Development and Data Analysis (Oman) Figure 9: Provision of CGR in 2002 by Industrial Classification
Industrial Classification
ServicesIndustryInvestment, Financing & Insurance
Banking
Coun
t
40
30
20
10
0
Bar Chart
YesNo
Provided CG Report in 2002?
Table 20: Statistical Tests of Provision of CGR in 2002 by Industrial Classification Provided CG Report in 2002? Total
Count No Yes No Industrial Classification
Banking 2 3 5
Investment, Financing & Insurance 13 14 27 Industry 36 23 59 Services 19 15 34 Total 70 55 125
Chi-Square Tests
Value df Asymp. Sig.
(2-sided) Pearson Chi-Square 1.798(a) 3 .615 Likelihood Ratio 1.794 3 .616 Linear-by-Linear Association .674 1 .412 N of Valid Cases
125
a 2 cells (25.0%) have expected count less than 5. The minimum expected count is 2.20.
Symmetric Measures Value Approx. Sig. Nominal by Nominal Phi .120 .615 Cramer's V .120 .615 N of Valid Cases 125
a Not assuming the null hypothesis. b Using the asymptotic standard error assuming the null hypothesis.

82
Only 44% of MSM-listed SAOGs (55 out of 125 companies) provided CGRs through publicly available
sources in 2002. A breakdown by industrial classification shows that the Banking sector has the highest
proportion of compliance with the CMA requirement for the provision of CGRs. Sixty percent (3 out of
5) of SAOGs in this sector provided CGRs in the financial year ended 2002, as compared to about 52%
(14 out of 27) in the Investment, Financing and Insurance sector, and 44% (15 out of 34) in the Services
sector. The Industry sector had the least level of compliance, with only about 39% (23 out of 59)
appending their CGRs to their financial statements for that year. Various Chi-square tests of differences
and both the Phi and Cramer’s tests of symmetric measures however revealed no statistically significant
differences in the levels of provision of CGRs by companies in different industries at the 10% level or
higher.
Figure 10: Provision of CGR in 2003 by Industrial Classification
Industrial Classification
ServicesIndustryInvestment, Financing & Insurance
Banking
Cou
nt
40
30
20
10
0
Bar Chart
YesNo
Provided CG Report in 2003?
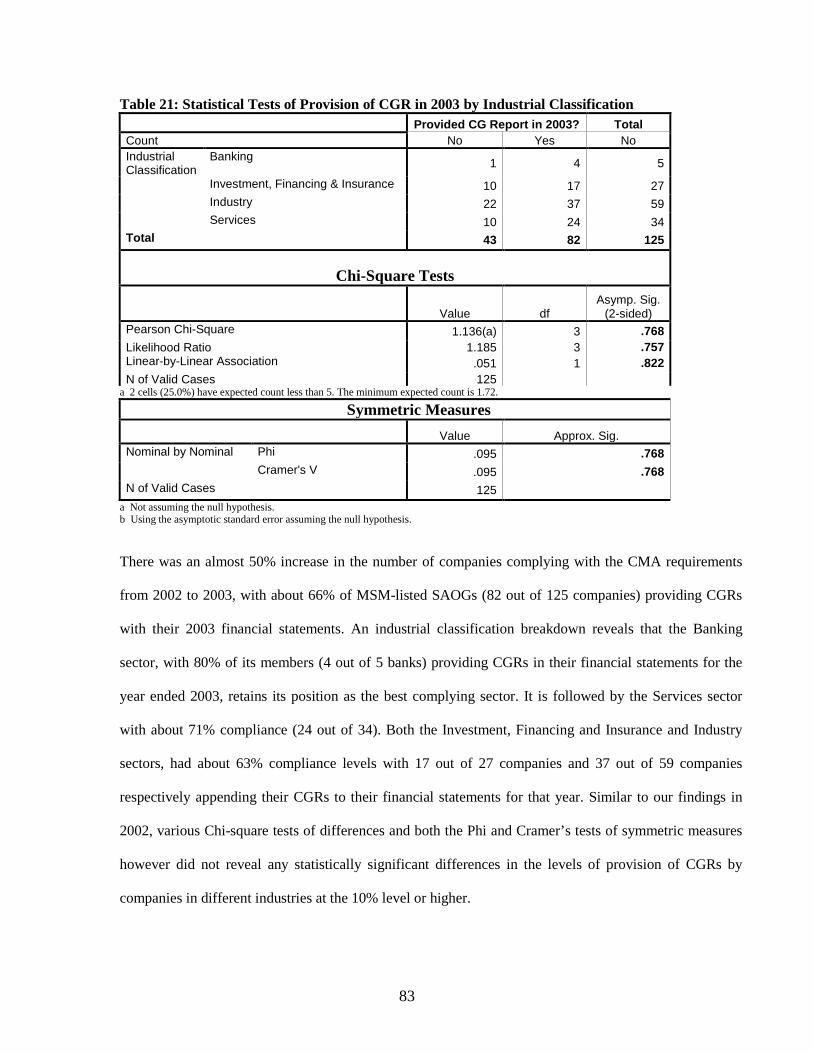
83
Table 21: Statistical Tests of Provision of CGR in 2003 by Industrial Classification Provided CG Report in 2003? Total Count No Yes No Industrial Classification
Banking 1 4 5
Investment, Financing & Insurance 10 17 27 Industry 22 37 59 Services 10 24 34 Total 43 82 125
Chi-Square Tests
Value df Asymp. Sig.
(2-sided) Pearson Chi-Square 1.136(a) 3 .768 Likelihood Ratio 1.185 3 .757 Linear-by-Linear Association .051 1 .822 N of Valid Cases 125
a 2 cells (25.0%) have expected count less than 5. The minimum expected count is 1.72.
Symmetric Measures Value Approx. Sig. Nominal by Nominal Phi .095 .768 Cramer's V .095 .768 N of Valid Cases 125
a Not assuming the null hypothesis. b Using the asymptotic standard error assuming the null hypothesis. There was an almost 50% increase in the number of companies complying with the CMA requirements
from 2002 to 2003, with about 66% of MSM-listed SAOGs (82 out of 125 companies) providing CGRs
with their 2003 financial statements. An industrial classification breakdown reveals that the Banking
sector, with 80% of its members (4 out of 5 banks) providing CGRs in their financial statements for the
year ended 2003, retains its position as the best complying sector. It is followed by the Services sector
with about 71% compliance (24 out of 34). Both the Investment, Financing and Insurance and Industry
sectors, had about 63% compliance levels with 17 out of 27 companies and 37 out of 59 companies
respectively appending their CGRs to their financial statements for that year. Similar to our findings in
2002, various Chi-square tests of differences and both the Phi and Cramer’s tests of symmetric measures
however did not reveal any statistically significant differences in the levels of provision of CGRs by
companies in different industries at the 10% level or higher.

84
Figure 11: Provision of CGR in 2004 by Industrial Classification
Industrial Classification
ServicesIndustryInvestment, Financing & Insurance
Banking
Cou
nt
50
40
30
20
10
0
Bar Chart
YesNo
Provided CG Report in 2004?
Table 22: Statistical Tests of Provision of CGR in 2004 by Industrial Classification
Provided CG Report in 2004? Total Count No Yes No Industrial Classification
Banking 1 4 5
Investment, Financing & Insurance 8 19 27 Industry 18 41 59 Services 5 29 34 Total 32 93 125
Chi-Square Tests
Value df Asymp. Sig.
(2-sided) Pearson Chi-Square 3.177(a) 3 .365 Likelihood Ratio 3.410 3 .333 Linear-by-Linear Association 1.153 1 .283 N of Valid Cases
125
a 2 cells (25.0%) have expected count less than 5. The minimum expected count is 1.28.
Symmetric Measures
Value Approx. Sig. Nominal by Nominal Phi .159 .365 Cramer's V .159 .365 N of Valid Cases 125
a Not assuming the null hypothesis. b Using the asymptotic standard error assuming the null hypothesis.

85
Further improvement in compliance levels was noted in 2004 with about 74% of MSM-listed SAOGs (93
out of 125 companies) providing CGRs with their 2004 financial statements. Sector-wise, compliance
levels in the Services sector improved significantly from 71% in 2003 to 85% (29 out of 34 companies) in
2004, making it the best complying sector this year. The Banking sector, with the same level of
compliance (80% - 4 out of 5 banks) dropped to the second position in terms of compliance level in 2004.
Again, both the Investment, Financing and Insurance and Industry sectors, had similar compliance levels
of about 70% with 19 out of 27 companies and 41 out of 59 companies respectively appending their
CGRs to their financial statements in 2004. Similar to our findings in 2002 and 2003, various Chi-square
tests of differences and both the Phi and Cramer’s tests of symmetric measures however did not reveal
any statistically significant differences in the levels of provision of CGRs by companies in different
industries at the 10% level or higher.
Figure 12: Provision of CGR in 2005 by Industrial Classification
Industrial Classification
ServicesIndustryInvestment, Financing & Insurance
Banking
Cou
nt
50
40
30
20
10
0
Bar Chart
YesNo
Provided CG Report in 2005?

86
Table 23: Statistical Tests of Provision of CGR in 2005 by Industrial Classification Provided CG Report in 2005? Total Count No Yes No Industrial Classification
Banking 0 5 5
Investment, Financing & Insurance 8 19 27
Industry 13 46 59 Services 3 31 34 Total 24 101 125
Chi-Square Tests
Value df Asymp. Sig.
(2-sided) Pearson Chi-Square 5.746(a) 3 .125 Likelihood Ratio 6.943 3 .074 Linear-by-Linear Association 1.546 1 .214 N of Valid Cases
125
a 2 cells (25.0%) have expected count less than 5. The minimum expected count is .96.
Symmetric Measures
Value Approx. Sig. Nominal by Nominal Phi .214 .125 Cramer's V .214 .125 N of Valid Cases 125
a Not assuming the null hypothesis. b Using the asymptotic standard error assuming the null hypothesis. Compliance levels improved to about 81% in 2005 with 101 out of 125 MSM-listed SAOGs providing
CGRs with their 2005 financial statements. The Banking sector returned to the top of the level of
compliance table with 100% (5 out of 5) of its members complying with the CMA requirement for the
provision of CGRs. The Services sector dropped to second place, but with an improved compliance level
of 91% (up from 85% in 2004). The Industry sector improved from 70% in 2004 to 78% in 2005 (46 out
of 59), while the Investment, Financing and Insurance sector, whose compliance level remained stagnant
at 70% in 2004 dropped to the last position on the level of compliance table. For the most part, the results
of our various Chi-square tests of differences and both the Phi and Cramer’s tests of symmetric measures
did not reveal statistically significant differences in the levels of provision of CGRs by companies across
industries.

87
Figure 13: Provision of CGR in 2006 by Industrial Classification
Industrial Classification
ServicesIndustryInvestment, Financing & Insurance
Banking
Cou
nt
50
40
30
20
10
0
Bar Chart
YesNo
Provided CG Report in 2006?
Table 24: Statistical Tests of Provision of CGR in 2006 by Industrial Classification Provided CG Report in 2006? Total Count No Yes No Industrial Classification
Banking 0 5 5
Investment, Financing & Insurance 7 20 27
Industry 12 47 59 Services 2 32 34 Total 21 104 125
Chi-Square Tests
Value df Asymp. Sig.
(2-sided) Pearson Chi-Square 6.046(a) 3 .109 Likelihood Ratio 7.461 3 .059 Linear-by-Linear Association 1.773 1 .183 N of Valid Cases
125
a 3 cells (37.5%) have expected count less than 5. The minimum expected count is .84.
Symmetric Measures
Value Approx. Sig. Nominal by Nominal Phi .220 .109 Cramer's V .220 .109 N of Valid Cases 125
a Not assuming the null hypothesis. b Using the asymptotic standard error assuming the null hypothesis.
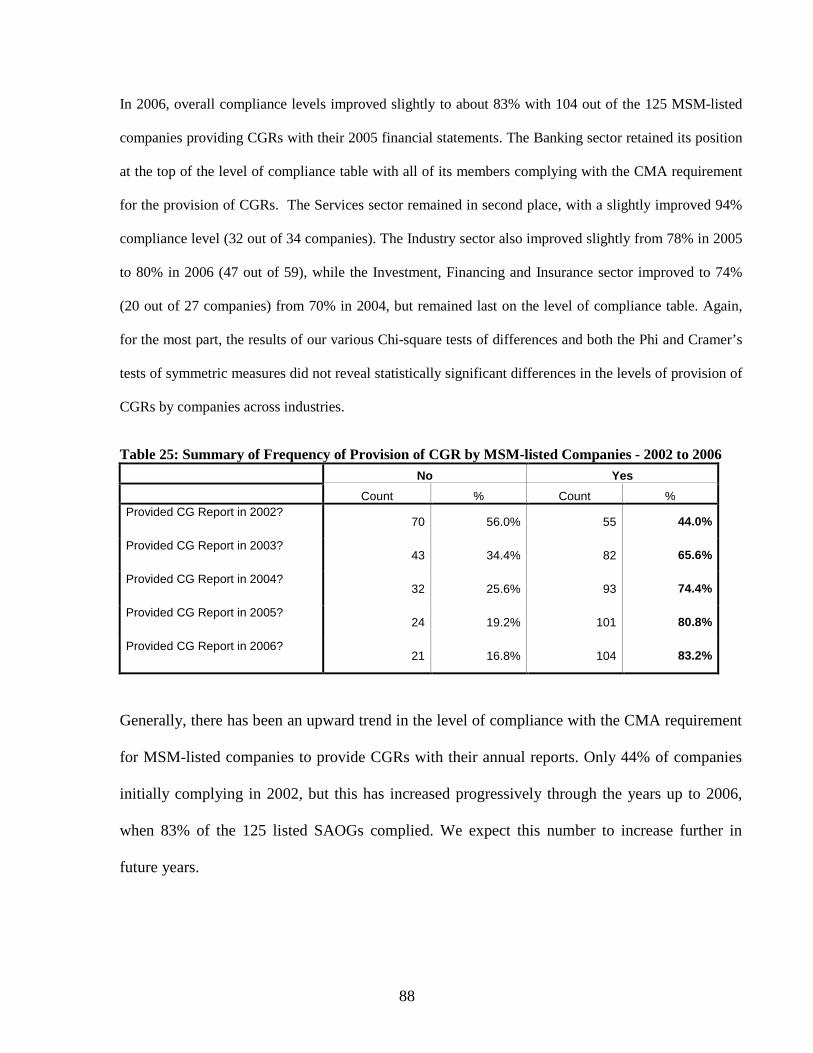
88
In 2006, overall compliance levels improved slightly to about 83% with 104 out of the 125 MSM-listed
companies providing CGRs with their 2005 financial statements. The Banking sector retained its position
at the top of the level of compliance table with all of its members complying with the CMA requirement
for the provision of CGRs. The Services sector remained in second place, with a slightly improved 94%
compliance level (32 out of 34 companies). The Industry sector also improved slightly from 78% in 2005
to 80% in 2006 (47 out of 59), while the Investment, Financing and Insurance sector improved to 74%
(20 out of 27 companies) from 70% in 2004, but remained last on the level of compliance table. Again,
for the most part, the results of our various Chi-square tests of differences and both the Phi and Cramer’s
tests of symmetric measures did not reveal statistically significant differences in the levels of provision of
CGRs by companies across industries.
Table 25: Summary of Frequency of Provision of CGR by MSM-listed Companies - 2002 to 2006 No Yes Count % Count % Provided CG Report in 2002?
70 56.0% 55 44.0%
Provided CG Report in 2003? 43 34.4% 82 65.6%
Provided CG Report in 2004? 32 25.6% 93 74.4%
Provided CG Report in 2005? 24 19.2% 101 80.8%
Provided CG Report in 2006? 21 16.8% 104 83.2%
Generally, there has been an upward trend in the level of compliance with the CMA requirement
for MSM-listed companies to provide CGRs with their annual reports. Only 44% of companies
initially complying in 2002, but this has increased progressively through the years up to 2006,
when 83% of the 125 listed SAOGs complied. We expect this number to increase further in
future years.

89
Results of Test of Logistic Multivariate Statistics
HYPOTHESES (MSM-listed Companies) Three sets of hypotheses were developed and tested on MSM-listed companies. They cover:
a. CGR vs. Non-CGR companies (for 2002 to 2004) b. Levels and Quality of CGR c. Value Relevance of CGR
SET 1: CGR vs. Non-CGR companies H1a: There is a positive association between firm size and CGR Agency costs increase with firm size Cost of CGR should be largely unrelated to firm size Benefits of CGR likely to be increasing with size
H1b: There is a positive (negative) association between firm performance & CGR Management often more forthcoming with good news than bad Signal to raise shareholder confidence and support management compensation contracts
(Singhvi and Desai, 1971; Malone et al., 1993) Poorer firms may try to avoid CGR and restrict information access to more determined users
H1c: There is an association between auditor status and CGR Larger audit firms (the Big 4) are likely to be “ahead of the game” and influence their
auditee’s response to regulatory requirements Contracting with a Big 4 firm could be viewed as an expression of management’s
confidence in firm’s disclosure quality and governance status H1d: There is a positive association between listing category and CGR H1e: There is a positive association between ownership status (relatively high foreign-held equity versus virtually locally owned) and CGR The need to raise capital internationally often increases as firms expand operations into
foreign localities Capital costs may be lowered through CGR CGR can provide potential international investors with immediate access to relevant
information at relatively little cost to firm or investor H1f: There is a positive association between diffuseness of ownership and the voluntary use of CGR disclosure. Diffuse ownership increases agency costs CGR provides shareholders with relevant information about the governance of the firm,
and in a manner which may reduce users’ information-seeking costs H1g: There is an association between industry type and CGR Firms in politically vulnerable industries may use mandatory disclosures, such as CGR,
to avoid political costs Failure to follow industry standard disclosure practices, including CGR, may signal “bad news”
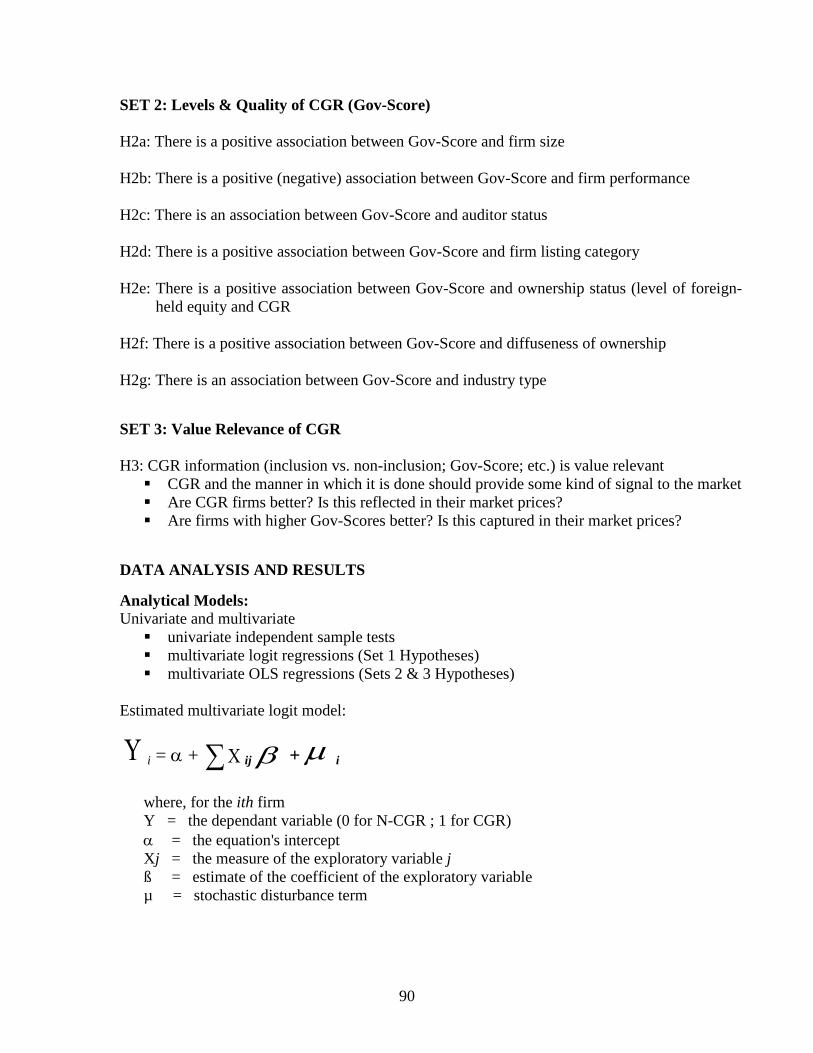
90
SET 2: Levels & Quality of CGR (Gov-Score) H2a: There is a positive association between Gov-Score and firm size H2b: There is a positive (negative) association between Gov-Score and firm performance H2c: There is an association between Gov-Score and auditor status H2d: There is a positive association between Gov-Score and firm listing category H2e: There is a positive association between Gov-Score and ownership status (level of foreign-
held equity and CGR H2f: There is a positive association between Gov-Score and diffuseness of ownership H2g: There is an association between Gov-Score and industry type SET 3: Value Relevance of CGR H3: CGR information (inclusion vs. non-inclusion; Gov-Score; etc.) is value relevant CGR and the manner in which it is done should provide some kind of signal to the market Are CGR firms better? Is this reflected in their market prices? Are firms with higher Gov-Scores better? Is this captured in their market prices?
DATA ANALYSIS AND RESULTS Analytical Models: Univariate and multivariate univariate independent sample tests multivariate logit regressions (Set 1 Hypotheses) multivariate OLS regressions (Sets 2 & 3 Hypotheses)
Estimated multivariate logit model:
where, for the ith firm Y = the dependant variable (0 for N-CGR ; 1 for CGR) α = the equation's intercept Xj = the measure of the exploratory variable j ß = estimate of the coefficient of the exploratory variable µ = stochastic disturbance term
Υ i = α + Χ∑ ijβ +µ i

91
Table 26: Multivariate Regression Results Logit Analysis CGRi = α + β1Sizei + β2Performancei + β3Auditori + β4Listingi + β5Foreign Ownershipi + β6Ownership
Diffusioni + β7Industrial Sectori + µ i
Variable Expected
sign Model coefficients (Std. error)
2002 2003 2004 Size + .000** (.000) .000* (.000) .000* (.000) Performance + .000* (.000) .000* (.000) .000* (.000) Auditor status + .645 (.503) 1.157** (.491) .764 (.532) Listing category + 1.229** (.533) 1.196* (.635) .444 (.646) Foreign Ownership + -.016 (.013) .000 (.013) -.003 (.014) Ownership Diffusion + -.310 (.442) -.386 (.472) -.131 (.514) Industrial Sector ? -1.618 (1.631) -1.651 (2.022) -2.136 (2.192) Constant - -.754 (.642) -.448 (.657) 1.257 (.792) Log likelihood 130.793 117.943 101.700 Nagelkerke R2 .209 .230 .170 Chi2 statistic 18.334** 19.544** 12.716 Degrees of freedom 9 9 9 Number of observations 108 108 108 Correctly predicted: N-CGR 82.8 44.4 12.5 CGR 44.0 83.3 Overall
97.6 64.8 70.4
78.7
** and * denote significance at the 5 and 10 percent levels, respectively. Table 26 presents the results of the multivariate analysis where the dependent variable is a
dichotomous variable indicating whether a company did or did not provide CGR in 2002, 2003
and 2004. The overall predictive ability of the model increased from 64.8 (in 2002) to 78.7 per
cent in 2004.
Across the three sets of results reported in Table 26, size, performance and listing category are
found to be statistically significant positive predictors of CG reporting by MSM-listed
companies. Hence, we found support for H1a, H1b, and H1d. The larger a company is, and the
higher its level of profitability, the more likely it is to provide CGRs. Also, companies listed on
the regular market of the MSM, are more likely to provide CGRs than those listed on the parallel
and third markets.
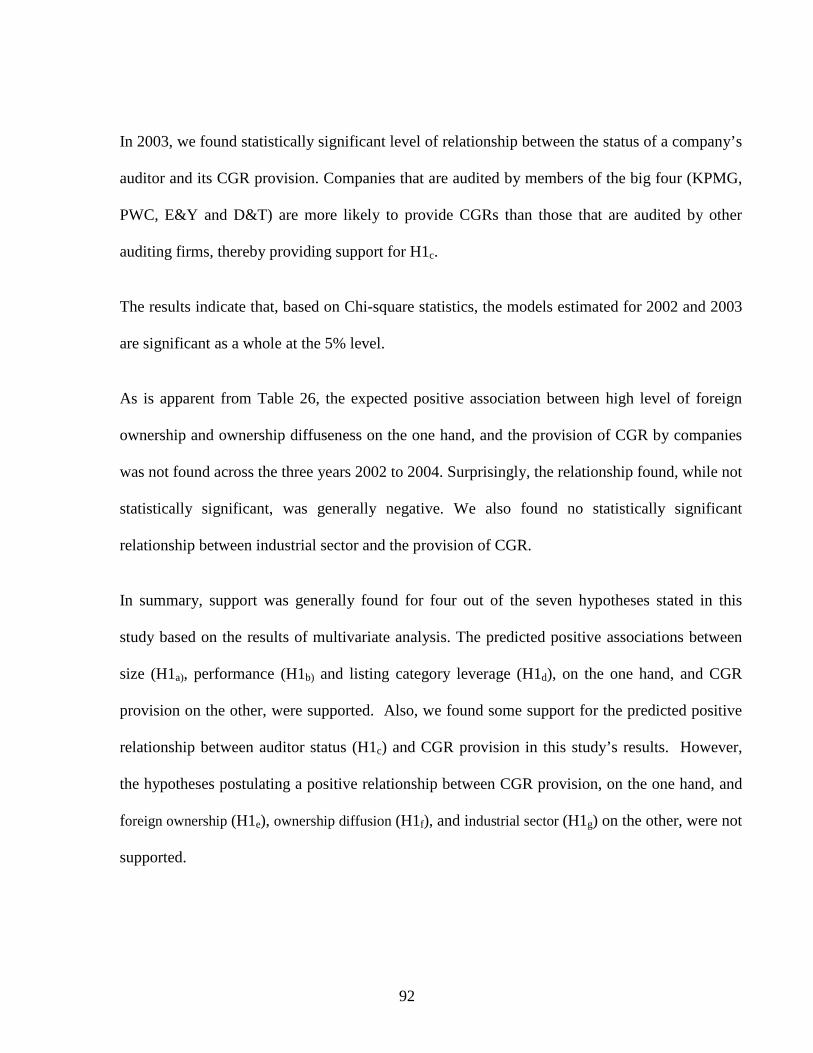
92
In 2003, we found statistically significant level of relationship between the status of a company’s
auditor and its CGR provision. Companies that are audited by members of the big four (KPMG,
PWC, E&Y and D&T) are more likely to provide CGRs than those that are audited by other
auditing firms, thereby providing support for H1c.
The results indicate that, based on Chi-square statistics, the models estimated for 2002 and 2003
are significant as a whole at the 5% level.
As is apparent from Table 26, the expected positive association between high level of foreign
ownership and ownership diffuseness on the one hand, and the provision of CGR by companies
was not found across the three years 2002 to 2004. Surprisingly, the relationship found, while not
statistically significant, was generally negative. We also found no statistically significant
relationship between industrial sector and the provision of CGR.
In summary, support was generally found for four out of the seven hypotheses stated in this
study based on the results of multivariate analysis. The predicted positive associations between
size (H1a), performance (H1b) and listing category leverage (H1d), on the one hand, and CGR
provision on the other, were supported. Also, we found some support for the predicted positive
relationship between auditor status (H1c) and CGR provision in this study’s results. However,
the hypotheses postulating a positive relationship between CGR provision, on the one hand, and
foreign ownership (H1e), ownership diffusion (H1f), and industrial sector (H1g) on the other, were not
supported.

93
5.8 Internet Financial Reporting Table 27 shows that the chi-square value is insignificant (p > .05). Therefore, it can be concluded
that there is no significant difference between the proportion of companies in the “Industry”
sector in Oman that have or do not have “Websites”. However, the result shows that the
companies that have websites are more than those without websites.
Table 27: Test Statistics - Industry and Hotels (website) Observed N Expected N Residual Industry with website 33 31.0 2.0 Industry without website 29 31.0 -2.0 Total 62 Chi-Square(a) .258 df 1 Asymp. Sig. .611 Exact Sig. .704 Point Probability .178 a 0 cells (.0%) have expected frequencies less than 5. The minimum expected cell frequency is 31.0.
Table 28 reveals that the chi-square value is insignificant (p > .05). Therefore, it can be
concluded that there is no significant difference between the proportion of companies in the
“Service & Insurance” sector in Oman that have or don’t have “Websites”. However, the result
reveals that the companies that have websites in this sector are more than those without websites.
Table 28: Test Statistics – Service and Insurance (website) Observed N Expected N Residual Service & Insurance with website 28 24.5 3.5 Service & Insurance without website 21 24.5 -3.5 Total 49 Chi-Square(a) 1.000 df 1 Asymp. Sig. .317 a 0 cells (.0%) have expected frequencies less than 5. The minimum expected cell frequency is 24.5.

94
Table 29 shows that the chi-square value is significant (p < .01). Therefore, it can be concluded
that there is a significant difference between the proportion of companies in the “Banks” sector
in Oman that have or don’t have “Websites”. The result suggests that the companies that have
“Websites” in this sector are significantly more than those without websites.
Table 29: Test Statistics - Banks (website) Observed N Expected N Residual Banks with website 23 15.5 7.5 Banks without website 8 15.5 -7.5 Total 31 Chi-Square(a) 7.258 df 1 Asymp. Sig. .007 Exact Sig. .011 Point Probability .007 a 0 cells (.0%) have expected frequencies less than 5. The minimum expected cell frequency is 15.5. Table 30 reveals that the chi-square value is significant (p < .05). Therefore, it can be concluded
that there is a significant difference between the proportion of companies in “All Sectors” in
Oman that have or do not have “Websites”. The result suggests that companies in all sectors that
have websites are significantly more than those without websites.
Table 30: Test Statistics – All Sectors (website) Observed N Expected N Residual All sectors with website 84 71.0 13.0 All sectors without website 58 71.0 -13.0 Total 142 Chi-Square(a) 4.761 df 1 Asymp. Sig. .029 Exact Sig. .036 Point Probability .012 a 0 cells (.0%) have expected frequencies less than 5. The minimum expected cell frequency is 71.0.

95
Table 31 shows that the chi-square value is significant (p < .01). Therefore, it can be concluded
that there is a significant difference between the proportion of companies in the “Industry and
Hotels” sector in Oman that have or don’t have “Company History” information on their
websites. The result suggests that the companies that have “Company History” information in
this sector are significantly more than those without such information.
Table 31: Test Statistics - Industry and Hotels company history Observed N Expected N Residual Industry with Company History 30 15.5 14.5
Industry without Company History 1 15.5 -14.5
Total 31 Chi-Square(a) 27.129 df 1 Asymp. Sig. .000 Exact Sig. .000 Point Probability .000 a 0 cells (.0%) have expected frequencies less than 5. The minimum expected cell frequency is 15.5.
Table 32 reveals that the chi-square value is significant (p < .01). Therefore, it can be concluded
that there is a significant difference between the proportion of companies in the “Service &
Insurance” sector in UAE that have or don’t have “Company History” information on their
websites. The result suggests that the companies in this sector that have company history
information are significantly more than those without such information.
Table 32: Test Statistics – Service and Insurance company history Observed N Expected N Residual Service & Insurance with Company History 23 12.0 11.0 Service & Insurance without Company History 1 12.0 -11.0 Total 24 Chi-Square(a) 20.167 df 1 Asymp. Sig. .000 Exact Sig. .000 Point Probability .000 a 0 cells (.0%) have expected frequencies less than 5. The minimum expected cell frequency is 12.0.

96
Table 33 shows that the chi-square value is insignificant (p > .05). Therefore, it can be concluded
that there is a significant difference between the proportion of companies in the “Banks” sector
in UAE that have or don’t have “Company History” information on their websites. However, the
result shows that the companies that have “Company History” information are more than those
without such information.
Table 33: Test Statistics - Banks company history Observed N Expected N Residual Banks with Company History 11 7.5 3.5 Banks without Company History 4 7.5 -3.5 Total 15 Chi-Square(a) 3.267 df 1 Asymp. Sig. .071 Exact Sig. .118 Point Probability .083 a 0 cells (.0%) have expected frequencies less than 5. The minimum expected cell frequency is 7.5. Table 34 shows that the chi-square value is significant (p > .01). Therefore, it can be concluded
that there is a significant difference between the proportion of companies in “All Sectors” in
UAE that have or don’t have “Company History” information on their websites. The result
suggests that the companies that have “Company History” information are significantly more
than those without such information.
Table 34: Test Statistics –All Sectors company history Observed N Expected N Residual All sectors with Company History 64 35.0 29.0 All sectors without Company History 6 35.0 -29.0 Total 70 Chi-Square(a) 48.057 df 1 Asymp. Sig. .000 Exact Sig. .000 Point Probability .000 a 0 cells (.0%) have expected frequencies less than 5. The minimum expected cell frequency is 35.0.

97
6. SUMMARY, CONCLUSION AND RECOMMENDATION This project explored corporate governance practices in two Arabian Gulf countries as compared
to practices by Singapore-listed companies. From our extensive collection and analysis of data,
we are able to observe and report on the following:
The Economics of the Arabian Gulf Comparison of business and economic practices between Oman and the UAE is comparatively
easy due to the similarity of culture and affiliations. Both countries have stable and emerging
economies that are in boom stages throughout the duration of this research. The economies are
largely dependent on crude oil revenue, although there is a stated and operational agenda to
diversify away from oil into other areas such as tourism, real estate and other service-based
activities. Both countries have adopted market economy, with liberalisation of trade activities,
and are continuously adapting, upgrading and aligning their local laws, rules and regulations
with international standards. They also permit varied levels of foreign ownership and
participation in their economies.
On the other hand, we found distinct differences between the two Arabian Gulf jurisdictions. The
key difference, as it applies to this research project, relates to the stage of development in the
regulatory regime for corporate governance in the two countries. While the CMA in Oman
enacted a Code of Corporate Governance for companies listed on the MSM as far back as June
2002 (as amended in April 2003), the regulatory authorities in the UAE have only just concluded
a comprehensive consultative process on a CG Code that will apply in the UAE from the year
2010. Hence, there is a gap in the regulatory regime: while Omani-listed companies are operating
under a mandatory CG reporting regime, UAE-listed companies are, at the moment, making
98
disclosures on CG matters, only on a voluntary basis. It was also observed that capital markets in
the two jurisdictions are at different stages of emergence: while the number of companies listed
on the MSM appears to be settled during the period of this project, that of UAE-listed companies
is increasing at a significant rate.
When compared to Singapore, we observed several similarities as well as differences in
corporate governance practices in Oman and the UAE. The capital markets in Oman and the
UAE appear to be running on more or less the same free-market principles that apply in the
Singapore market. However, there are certain corporate governance related issues that may
require the attention of regulators in the Arabian Gulf countries:
- Shareholder are considered as financial investors rather than as owners: Unlike in
western and western-like capital markets, we observed that shareholders are being considered, more or less as financial investors, with only short-term transient interest in the affairs of the company, rather than part-owners who are investing for the long-term.
- Shareholders are not using their right in a professional way: We also observed
that unlike in Singapore, shareholders in Oman and the UAE appear to be unsophisticated and naive in shareholding matters, such that they are unable or not allowed to discharge their shareholder rights and obligations in a professional and effective manner. These include the rights of attending and voting at company meetings, appointing directors and approving their remuneration, approving the appointment of company auditors and their fees, being kept informed of the affairs and performance of the company, etc.
- Hidden blockholders: We observed potential incidences of hidden blockholders,
where it was difficult to confirm the relationship between some of the shareholders.
- Insider trading: We found that the extended interconnectedness of family and
other social ties, and their preponderance in the business and corporate environment in Arabian Gulf countries, make the potentials for large-scale insider trading real and continuous. Preventing, detecting or monitoring such incidence is even more difficult in these environments.

99
- There is no real implementation and law enforcement: We observed that the implementation, monitoring and enforcement aspects of the corporate governance regulatory regime are still at a nascent stage, with the regulators in the process of developing or acquiring necessary resources to ensure strict compliance with the regulations.
- Weak effect of non-executive directors and independent directors: The concept of
non-executive and independent directors is still relatively novel in these jurisdictions, where culture and history dictates that each individual is highly interdependent on and interconnected with others in their business and corporate dealings. It may take some time and training for a strong culture of truly independent and non-executive directorship to emerge.
Value R l
HYP

100
References
Alves, C. and V. Mendes, 2004, " Corporate Governance Policy and Company Performance: the Portuguese case", Corporate Governance 12, 3, July, 290- 301
Ayogu, M., 2001, "Corporate Governance in Africa: The Record and Policies for Good Corporate Governance", African Development Bank, Blackwell Publishers, UK, 308-330
Baumol, W., 1959, Business Behavior, Value and Growth. Wiley, N.Y Baums, T., 1993 "Takeover versus institutions in corporate governance in Germany." In D.
Prentice and P. Holland (eds) Contemporary Issues in Corporate Governance. Oxford: Oxford University Press
Beck, P., and T. Zorn, 1982, "Managerial Incentives in a Stock Market Economy", Journal of Finance 37, 1151-1167
Berle Jr., A., and G. Means, 1932, "The Modem Corporation and Private Property", Macmillan, New York
Bhagat, S., and B. Black, 1997, "Do Independent Directors Matter?", Working Paper, University of Colorado
Black, B., 1998, Shareholder activism and corporate governance in the United States, in Peter Newman (ed.), The New Palgrave Dictionary of Economics and the Law, London: Macmillan, 459-465
Black, B., and J. Coffee, 1994, "Hail Britannia?: Institutional Investor Behaviour Under Limited Regulation", Michigan Law Review 92, 1997-2087
Borokhovich, K., R. Parrino and T. Trapani, 1996, "Outside Directors and CEO Selection", Journal of Financial and Quantitative Analysis 31, 337-355
Brickley, J., J. Coles and R. Terry, 1994, "Outside Directors and the Adoption of Poison Pills", Journal of Financial Economics 35, 371-390
Brickley, J., R. Lease, and C. Smith, Jr., 1994, "Corporate Voting: Evidence from Charter Amendment Proposals", Journal of Corporate Finance 1, 5-31
Brickley, J., R. Lease and C. Smith, Jr., 1988, "Ownership Structure and Voting on Antitakeover Amendments", Journal of Financial Economics 20, 267-291
Burkart, M., 1995, "Initial Shareholdings and Overbidding in Takeover Contests' Journal of Finance 50, 1491-1515
Burkart, M., D. Gromb and F. Panunzi, 1997, "Large Shareholders, Monitoring and the Value of the Firm", Quarterly Journal of Economics 112,693-728
Byrd, J., and K. Hickman, 1992, "Do Outside Directors Monitor Managers? Evidence from Tender Offer Bids", Journal of Financial Economics 32, 195221
Cadbury Committee, 1992, "Report of the Committee on the Financial Aspects of Corporate Governance", London, Gee Publishing
Cannella, A., D. Fraser and D. Lee, 1995, "Firm Failure and Managerial Labor Markets: Evidence from Texas Banking", Journal of Financial Economics 38, 185- 210
Caramanolis-Cotelli, B., 1995, "External and Internal Corporate Control Mechanisms and the Role of the Board of Directors: A Review of the Literature", Working Paper Number 9606, Institute of Banking and Financial Management
Carleton, W., J. Nelson and M. Weisbach, 1998, "The Influence of Institutions on Corporate Governance Through Private Negotiations: Evidence from TIAA-CREF", Journal of Finance 53, 1335-1362
Coase, R., 1973, "The Nature of the Firm" Economica 4 ", 386-405

101
Cole, R., and H. Mehran, 1998, "The Effect of Changes in Ownership Structure on Performance: Evidence from the Thrift Industry", Journal of Financial Economics 50, 291-317
Cotter, J., A. Shivadsani, and M. Zenner, 1997, "Do Independent Directors Enhance Target Shareholders Wealth During Tender Offers?", Journal of Financial Economics 43, 195-218
Coughlan, A., and R. Schmidt, 1985, "Executive Compensation, Management Turnover and Firm Performance: An Empirical Investigation", Journal of Accounting and Economics 7, 43-66
Cuervo, A. 2002, "Corporate Governance Mechanisms: a plea for less code of good governance and more market control" Corporate Governance 10, 2, April , 84-93
Dahya, J., A. Lome, and D. Power, 1998, "Ownership Structure, Firm Performance, and Top Executive Change: an Analysis of UK Firms", Journal of Business Finance and Accounting 25, 1089-1118
Dahya, J., J. McConnel and N. Travlos, 2002, "The Cadbury Committee, Corporate Performance, and Top Management Turnover", Journal of Finance 57,461-483
De Jong, H., 1989 "The Takeover market in Europe: control structures and the performance of large companies compared", Review of Industrial Organization,6,1-18
Demsetz, H., 1983, "The Structure of Ownership and the Theory of the Firm", Journal of Law and Economics 26,301-325
Demsetz, H., and K. Lehn, 1985, "The Structure of Corporate Ownership: Causes and Consequences", Journal of Political Economy 93, 1155-1177
Denis, D., 2001, " Twenty –five years of Corporate Governance Research ….and Counting" Review of Financial Economics 10, 191-212
Denis, D., D. Denis, and A. Sarin, 1997b, "Ownership Structure and Top Executive Turnover", Journal of Financial Economics 45, 193-221
Denis, D., and J. McConnell, 2003 " International Corporate Governance" ECGI Working Paper Series in Finance, No. 05/2003
Denis, D., and J. Serrano, 1996, "Active Investors and Management Turnover Following Unsuccessful Control Contests", Journal of Financial Economics 40, 239- 266
Easterbrook, F., and D. Fischel, 1991, "The Economic Structure of Corporate Law Harvard University Press, Cambridge, Mass.
Fama, E., 1980, "Agency Problems and the Theory of the Firm", Journal of Political Economy 88, 288-307
Fama, E. and M. Jensen 1983a, “Separation of Ownership and Control” Journal of Law and Economics, June, 301 – 25
Fama, E., and M. Jensen, 1983b, "Agency Problems and Residual Claims", Journal of Law and Economics 26,327-349
Fama, E., and M. Jensen, 1985 “Organizational Forms and Investment Decisions” Journal of Financial Economics, 14, 101-119
Farinha, J., 2003, "Corporate Governance: A Survey of the Literature", SSRN working paper, November.
Franks, J., and R. Harris, 1989, "Shareholder Wealth Effects of Corporate Takeovers the UK Experience 1955-1985", Journal of Financial Economics 23, 225-249
Franks, J., and C. Mayer, 1997, "Corporate Ownership and Control in the UK, Germany and France". In D.H. Chew (ed) Studies in International Corporate Finance and Governance Systems. NY: Oxford University Press.

102
Franks, J., and C. Mayer, 1996, "Hostile Takeovers and the Correction of Managerial Failure", Journal of Financial Economics 40, 163-181
Franks, J., and C. Mayer, 1994, "Ownership and Control in Germany" Working Paper, London Business School
Freeman,R.,1984, "Strategic Management: A Stakeholder Approach", Boston, Pitman Garvey, G., and P. Swan, 1994, "The Economics of Corporate Governance: Beyond the
Marshallian Firm", Journal of Corporate Finance 1, 139-174 Ghoshen, Z., 1995, "Shareholder Dividend Options", Yale Law Journal 104, 881-932 Gilson, S., 1989, "Management Turnover and Financial Distress", Journal of Financial
Economics 25, 241-262 Gregg, P., S. Machin and S. Szymanski, 1993, "The Disappearing Relationship Between
Directors Pay and Corporate Performance", British Journal of Industrial Relations 31, 1-10
Grossman, S., and O. Hart, 1986, "The Costs and Benefits of Ownership: a Theory of Vertical and Lateral Integration", Journal of Political Economy 94, 691-719
Grossman, S., and O. Hart, 1980, "Takeover Bids, the Free Rider Problem and the Theory of the Corporation", Bell Journal of Economics 11, Spring, 4264
Hampel Committee, 1998, "Committee on Corporate Governance: Final Report", London, Gee Publishing
Hansen, R., and P. Torregrosa, 1992, "Underwriter Compensation and Corporate Monitoring", Journal of Finance 47, 1537-1556
Hart, 0., 1995, "Corporate Governance, Some Theory and Applications", The Economic Journal 105, 687-689
Hart, 0., and J. Moore, 1990, "Property Rights and the Nature of the Firm", Journal of Political Economy 98, 1119-1158
Haubrich, J., 1994, "Risk Aversion, Performance Pay and the Principal-Agent Problem", Journal of Political Economy 102,258-276
Hermalin, B., and M. Weisbach, 1991, "The Effects of Board Composition and Direct Incentives on Firm Performance", Financial Management 20, 101-112
Hermalin, B., and M. Weisbach, 1988, "The Determinants of Board Composition", Rand Journal of Economics 19,589-606
Holderness, C., and D. Sheehan, 1988, "The Role of Majority Shareholders in Publicly Held Corporations", Journal of Financial Economics 20, 317-346
Holderness, C., and D. Sheehan, 1985, "Raiders or Saviours? The Evidence on Six Controversial Investors", Journal of Financial Economics 14,555-579
Holmstrom, B., and J. Tirole, 1993, "Market Liquidity and Performance Monitoring", Journal of Political Economy 101,678-709
Hussain, S. and C. Mallin, 2002, " Corporate Governance in Bahrain" , Corporate Governance 10,3,July, 197-210
Jensen, M., 1993, "The Modem Industrial Revolution, Exit and the Failure of Internal Control Systems", Journal of Finance 48, 831-880
Jensen, M., 1986, "Agency Costs of Free Cash-flow, Corporate finance and Takeovers", American Economic Review 76, 323-329
Jensen, M., and W. Meckling, 1976, "Theory of the Firm: Managerial Behaviour, Agency Costs and Ownership Structure", Journal of Financial Economics 3, 305-360

103
Jensen, M., and K. Murphy, 1990, "Performance Pay and Top Management Incentives", Journal of Political Economy 98, 225-264
John, K., and L. Senbet, 1998, "Corporate Governance and Board Effectiveness", Journal of Banking and Finance 22,371-403
Kaplan, S., 1989, "The Effects of Management Buyouts on Operating Performance and Value", Journal of Financial Economics 24, 217-254
Kaplan, S., and D. Reishus, 1990, "Outside Directors and Corporate Performance", Journal of Financial Economics 27,389-410
Kennedy, V., and R. Limmack, 1996, "Takeover Activity, CEO Turnover, and the Market for Corporate Control", Journal of Business Finance and Accounting 23, 267- 293
Kester, C., 1997, "Governance, Contracting, and Investment Horizons: A Look at Japan and Germany" In D.H. Chew (ed) Studies in International Corporate Finance and Governance Systems. NY: Oxford University Press.
Laporta, R., F. Lopez-de-Silanes, A. Shleifer and R. Vishny,1997, "Legal Determinants of Extemal Finance", Journal of Finance 52, 1131-1150
Lewellen, W. C. Loderer and K. Martin, 1987, "Executive Compensation and Executive Incentive Problems: an Empirical Analysis", Journal of Accounting and Economics 9, 287-310
Lewellen, W. C. Loderer and A. Rosenfeld, 1985, "Mergers, Stockholder Decisions and Executive Stock Ownership", Journal of Accounting and Economics 7, 209-231
Loderer, C., and K. Martin, 1997, "Executive Stock Ownership and Performance: Tracking Faint Traces", Journal of Financial Economics 45, 223-255
Loderer, C., and D. Sheehan, 1989, "Corporate Bankruptcy and Managers' Self- Serving Behavior", Journal of Finance 44, 1059-1075
Lorsch, J., and E. McIver, 1989, "Pawns or Potentates: the Reality of America's Corporate Boards", Harvard Business School Press, Boston, MA
Mace, R., 1986, "Directors: Myth and Reality", Harvard University, Boston, MA Mallin, C., 1997, "Investors' Voting Rights", in Keasey, K. and M. Wright (eds.) "Corporate
Governance: Responsibilities, Risks and Remuneration", John Wiley and Sons Manne, H., 1965, "Mergers and the Market for Corporate Control", Journal of Political
Economy, 110-120 Marris, R. 1964. "The Economic Theory of Managerial Capitalism". Macmillan, London. Martin, K., and J. McConnell, 1991, "Corporate Performance, Corporate Takeovers and
Managerial Turnover", Journal of Finance 46,671-687 Mertzanis, H. 2001 " Principles of Corporate Governance in Greece" , Corporate Governance 9,
2, April, 89-100 McConnell, J., and H. Servaes, 1990, "Additional Evidence on Equity Ownership and Corporate
Value", Journal of Financial Economics 27,595-612 Mikkelson, W., and M. Partch, 1997, "The Decline of Takeovers and Disciplinary Managerial Turnover", Journal of Financial Economics 44, 205228
Mikkelson, W., and R. Ruback, 1985, "An Empirical Analysis of the Interfirm Equity Investment Process", Journal of Financial Economics 14,523-553
Moerland,P.,1995a "Alternative disciplinary mechanisms in different corporate systems" Journal of Economic Behaviour and Organization,26, 17-34
Moerland,P.,1995b "Corporate Ownership and Control Structures: An International Comparison" Review of Industrial Organization, 10, 443-464
104
Monsen, R. And A. Downs, 1965, “A Theory of Large Managerial Firms “The Journal of Political Economy, June,. 221 - 36
Morck, R., A. Shleifer and R. Vishny, 1990, "Do Managerial Objectives Drive Bad Acquisitions?", Journal of Finance 45,31-48
Morck, R., A. Shleifer and R. Vishny, 1988, "Managerial Ownership and Market Valuation", Journal of Financial Economics 20, 293-315
Pound, J., 1988, "Proxy Contests and the Efficiency of Shareholder Oversight", Journal of Financial Economics 20, 267-265
Rediker, K., and A. Seth, 1995, "Board of Directors and Substitution Effects of Alternative Governance Mechanisms", Strategic Management Journal 16, 8599
Roll, R., 1986, "The Hubris Hypothesis of Corporate Takeovers", Journal of Business 59, 197-216
Rose, C. and C. Mejer, 2003 " The Danish Corporate Governance System: from stakeholder orientation towards shareholder value" Corporate Governance 11, 4, October, 335-344
Rosenstein, S., and J. Wyatt, 1990, "Outside Directors, Board Independence, and Shareholder Wealth", Journal of Financial Economics 26, 175-191
Scott,J.1985, "Corporations, Classes and Capitalism" London : Hutchinson. Shivdasani, A., 1993, "Board Composition, Ownership Structure and Corporate Control",
Journal of Accounting and Economics 16, 167-198 Shleifer, A., and R. Vishny, 1997, "A Survey of Corporate Governance", Journal of Finance 52,
737-783 Shleifer, A., and R. Vishny, 1986, "Large Shareholders and Corporate Control", Journal of
Political Economy 94, 461-488 Short, H., and K. Keasey, 1997, "Institutional Shareholders and Corporate Governance", in
Keasey, K., and M. Wright (eds.), "Corporate Governance: Responsibilities, Risks and Remuneration", John Wiley and Sons
Smith, A., 1990, "Corporate Ownership Structure and Performance: the Case of Management Buyouts", Journal of Financial Economics 27, 143-164
Smith, M., 1996, "Shareholder Activism by Institutional Investors: Evidence from CalPERS", Journal of Finance 51, 227-252
Solomon, J. and A. Solomon, 2004 "Corporate Governance and Accountability" NY: Wiley Solomon, J. A. Solomon, C. Park, 2002, " A Conceptual Framework for Corporate Governance
Reform in South Korea" Corporate Governance 10, 1, January, 29-46 Stiglitz, J., 1985, "Credit Markets and the Control of Capital", Journal of Money, Credit and
Banking 17, 133-152 Subrahrnanyam, V., N. Rangan, and S. Rosenstein, 1997, "The Role of Outside Directors in
Bank Acquisitions", Financial Management 26, 23-36 Sudarsanam, S., 1996, "Large Shareholders, Takeovers and Target Valuation", Journal of
Business Finance and Accounting 23, 295-317 Sudarsanam, S., P. Holl, and A. Salami, 1996, "Shareholder Wealth Gains in Mergers: Effect of
Synergy and Ownership Structure", Journal of Business Finance and Accounting 23, 673-698
Turnbull, S., 1997 "Corporate Governance: Its Scope, Concerns and Theories, Corporate Governance 5, 180-205
Vafeas, N. , and E. Theodorou, 1998, "The Relationship Between Board Structure and Firm Performance in the UK", British Accounting Review 30, 383-407
105
Van den Berghe, L.A.A. and S. Carchon, 2002 "Corporate Governance Practices in Flemish Family Businesses", Corporate Governance 10, 3 , July, 225- 245
Useem, M., 1993 "Executive Defence: Shareholder power and Corporate Reorganization" Cambridge, MA: Harvard University Press.
Wahal, S., 1996, "Public Pension Fund Activism and Firm Performance", Journal of Financial and Quantitative Analysis 31, 1-23
Warner, J., R. Watts and K.H. Wruck, 1988, "Stock Prices and Top Management Changes", Journal of Financial Economics 20, 461-492
Weisbach, M., 1988, "Outside Directors and CEO Turnover", Journal of Accounting and Economics 20, 431-460
Weimer, J. and J. Pape , 1990, "A Taxonomy of Systems of Corporate Governance" Corporate Governance 7, 2, April, 152- 166
Williamson. 0., 1970, "Corporate Control and Business Behavior: An Enquiry Into the Effects of Organization Form on Enterprise Behavior", Prentice-Hall International Series in Management
Williamson, O. 1964, “The Economics of Discretionary Behavior : Managerial Objectives in a Theory of the Firm” Englewood Cliffls, NJ : Prentice Hall
Winter, R., 1977, "State Law, Shareholder Protection and the Theory of the Corporation", Journal of Legal Studies 6, 251-292
Yermack, D., 1997, "Good Timing: CEO Stock Option Awards and Company News Announcements", Journal of Finance 52, 449-476
Yemlack, D., 1995, "Do Corporations Award CEO Stock Options Effectively?", Journal of Financial Economics 39, 237-269
Zingales, L., 1998, "Corporate governance", in Peter Newman (ed.), The New Palgrave Dictionary of Economics and the Law, London: Macmillan, 497-502
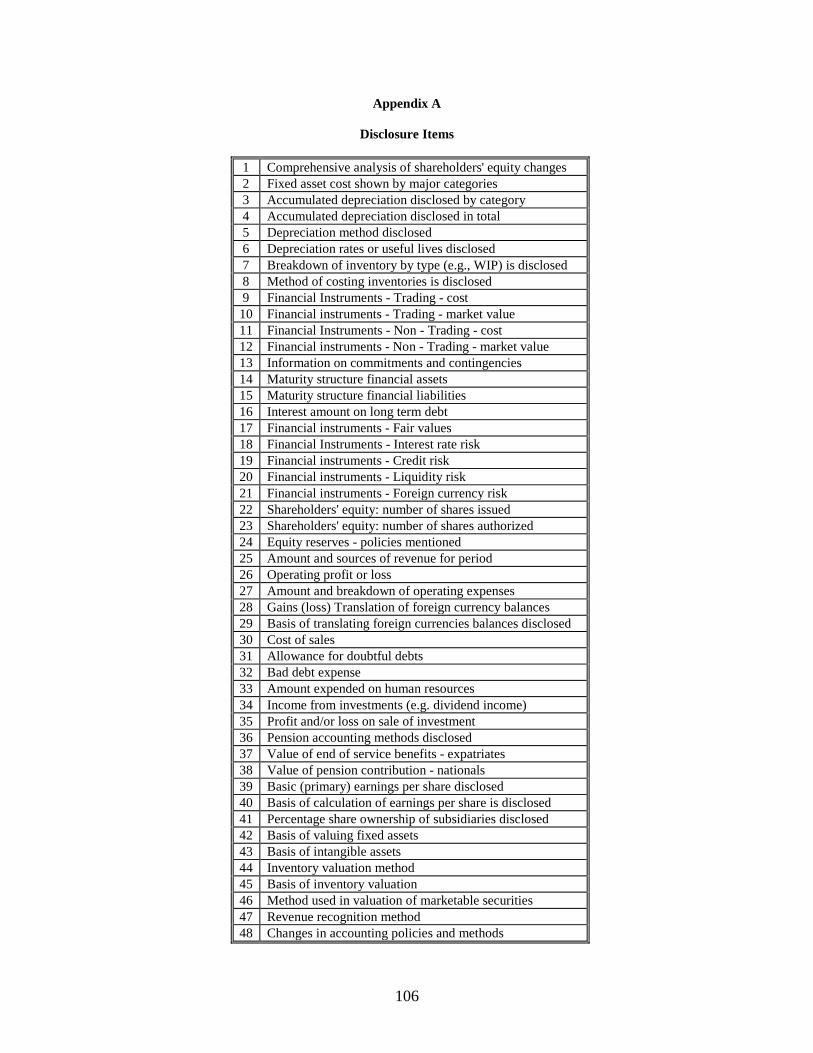
106
Appendix A
Disclosure Items
1 Comprehensive analysis of shareholders' equity changes 2 Fixed asset cost shown by major categories 3 Accumulated depreciation disclosed by category 4 Accumulated depreciation disclosed in total 5 Depreciation method disclosed 6 Depreciation rates or useful lives disclosed 7 Breakdown of inventory by type (e.g., WIP) is disclosed 8 Method of costing inventories is disclosed 9 Financial Instruments - Trading - cost 10 Financial instruments - Trading - market value 11 Financial Instruments - Non - Trading - cost 12 Financial instruments - Non - Trading - market value 13 Information on commitments and contingencies 14 Maturity structure financial assets 15 Maturity structure financial liabilities 16 Interest amount on long term debt 17 Financial instruments - Fair values 18 Financial Instruments - Interest rate risk 19 Financial instruments - Credit risk 20 Financial instruments - Liquidity risk 21 Financial instruments - Foreign currency risk 22 Shareholders' equity: number of shares issued 23 Shareholders' equity: number of shares authorized 24 Equity reserves - policies mentioned 25 Amount and sources of revenue for period 26 Operating profit or loss 27 Amount and breakdown of operating expenses 28 Gains (loss) Translation of foreign currency balances 29 Basis of translating foreign currencies balances disclosed 30 Cost of sales 31 Allowance for doubtful debts 32 Bad debt expense 33 Amount expended on human resources 34 Income from investments (e.g. dividend income) 35 Profit and/or loss on sale of investment 36 Pension accounting methods disclosed 37 Value of end of service benefits - expatriates 38 Value of pension contribution - nationals 39 Basic (primary) earnings per share disclosed 40 Basis of calculation of earnings per share is disclosed 41 Percentage share ownership of subsidiaries disclosed 42 Basis of valuing fixed assets 43 Basis of intangible assets 44 Inventory valuation method 45 Basis of inventory valuation 46 Method used in valuation of marketable securities 47 Revenue recognition method 48 Changes in accounting policies and methods

107
49 Accounting policies for research and development expense 50 Report of the chairman or CEO 51 Audit report 52 Accounting policy for derivative securities 53 Share held by directors of the company 54 Shares held by the government 55 Name of principal shareholders 56 Dividends per ordinary share 57 Brief narrative history of the company 58 Discussion of operating results for the year 59 Name of top employees with position 60 List of directors 61 Remuneration of directors 62 Discussion of lines of business 63 Related party transactions 64 Industry segment revenue disclosed 65 Industry segment operating profit disclosed 66 Industry segment assets employed disclosed 67 Industry segment depreciation/ amortization disclosed 68 Industry segment capital expenditures disclosed 69 Geographic segment revenue disclosed 70 Geographic segment operating profit disclosed 71 Geographic segment assets employed disclosed 72 Geographic segment depreciation/ amortization disclosed 73 Geographic segment capital expenditures disclosed


