\ DETERMINANTS OF ENTREPRENEURIAL PERFORMANCE IN SMALL SCALE ENTERPRISES IN KENYA: A CASE STUDY OF MATHIRA DIVISION, NYERI f/ DISTRICT. I BY I MUGO, MERCY G. O V • FOR USE IN TH 3 >.Y ONLY A Research Paper Submitted to the Department of Economics Univex'sity of Nairobi in Partial Fulfillment of the Requirements o the Degree of Master of Arts in Economics. JUNE 1991.
Transcript
\
DETERMINANTS OF ENTREPRENEURIAL
PERFORMANCE IN SMALL SCALE
ENTERPRISES IN KENYA: A CASE
STUDY OF MATHIRA DIVISION, NYERIf/DISTRICT.
I BYI MUGO, MERCY G.
O
V
• FOR USE IN T H 3 >.YONLY
A Research Paper Submitted to the Department of Economics Univex'sity of Nairobi in Partial Fulfillment of the Requirements o the Degree of Master of Arts in Economics.
JUNE 1991.
This Research Paper is my original work and has not been presented for a degree in any other University.
\
MUGO, MERCY G.
This Research Paper has been submitted for examination with our approval as University of Nairobi supervisors.
DR. S. W. MASAI
&0ubtloy 7(/l- ______
DR. DOROTHY McCORMICK
i
UNIVERSITY OF NAIROBI LIBRARY
DEDICATIONTO MY DAUGHTER
DaisyAND MY MOTHER AND LATE FATHER
Racheal and Mugo.
*/
ii
**
ACKNOWLEDGEMENTSMy special thanks go to my supervisors Dr. Masai and Dr.
McCormick for their guidance, assistance and supervision throughout the writing of this research paper.
I am indebted to Dr. F. M. Mwega, Dr. A. B. Ayako and Mr. D.M. Kulundu who helped me in one way or another in the preparation of this paper.
I am grateful to all my graduate student colleagues, friends and staff of the Economics department for their moral and academic support during the course of my study.
I wish to thank all those small scale entrepreneurs in Mathira division who assisted me by responding to my questionnaires and providing me with the information on which this study is based.
My sincere gratitude goes to the University of Nairobi whose sponsorship and financial support enabled me to undertake the masters degree course.
My heartfelt gratitude goes to my family whose encouragement, moral and financial support has made me what I am. Specifically, I appreciate Daisy, my daughter for her patience ajrcl coping well with my prolonged absence.
Finally, I am wholly responsible for any errors and mistakes in this work; these should not be blamed on the above mentioned persons.
1 1 1
ABSTRACTWith an increasing level of unemployment in the country, the
government has come to the realization that small scale enterprises can serve as "shock absorbers" to this problem. Past experience shows that even with the government assistance, there have been cases of failure * in these enterprises. This forms the major stimulus of this study.
The main objectives of the study are to determine, model and estimate the statistical significance of the factors that influence performance of small scale entrepreneurs specifically in Mathira division.
The study found that business management, availability of inputs, capital-labour ratios and sex have a positive and significant effect on performance. Job training and innovative activities have a positive but insignificant effect on performance of the entrepreneurs. Tentative explanations are given for any ■contradictions found in this study.
Policies recommended from the findings of the study include that emphasis should be laid on business management^ practices, provision of inputs at reasonable costs and encouragement of females to venture into more risky but profitable businesses. Also in making policies, capital should be made more expensive than labour to ensure more labour-intensive businesses. Other policies recommended arise from other aspects of research and not directly from the model.
IV
TABLE OF CONTENTS
DECLARATION ....DEDICATION ....ACKNOWLEDGEMENTS .ABSTRACT .........TABLE OF CONTENTS LIST OF TABLES ... CHAPTER ONE:
1.01.11.2
1.3
INTRODUCTION ................Background....................Statement of the Problem. ...Objectives of the Study.....Significance of the Study. ..
PAGEiiiiiiivvviii11911
12
CHAPTER TWO: LITERATURE REVIEW...........2.0 Literature Review............2.1 Overview of the Literature. .
151529
CHAPTER THREE: METHODOLOGY.3.0 Introduction ..........3.1 Sampling Procedure. ...3.2 Area of Study..........3.3 Model Specification and
Hypotheses.............3.31 Model Specification. ..
'V' 31313233
34 34
3.32 Justification and Measurement PAGEof the Dependant Variables. . 37
3.33 Hypotheses................ 38\
CHAPTER FOUR: RESULTS OF THE FIELD WORKAND DATA ANALYSIS........ 43
4.1 BASIC CHARACTERISTICSOF THE FIELD DATA. ............. 43
4.11 Social Characteristicsof Entrepreneurs......... 43
4.12 Performance ofthe Enterprises.......... 48
4.13 Training of the Entreprenurs. 504.14 Experience of the
Sample Entrepreneurs.... 524.15 Innovative Activities... 554.16 Business Management Practices. 554.17 Availability of Inputs.. 564.18 Levels of Capital for the ’/
Sample Entrepreneurs.... 584.19 Opinions of Entrepreneurs
and Kind of Support Required. 594.2 Results of the Model .... 63
CHAPTER FIVE: CONCLUSIONS AND POLICYIMPLICATIONS............. 77
vi
PAGE5.1 Summary and Conclusion....... 775.2 Policy Implications.......... 81
\ 5.3 Contribution of' the Study. .. 835.4 Limitations of the Study. ... 845.6 Suggestions for Further
1.1 Capital and Labour Inputs forSelected Manufacturing Activities............ 4
1.2 Size Distribution of Manufacturing Establishments: Number of Establishmentsby Employment Group........................... 6
1.3 Size Distribution of Manufacturing Establishments: Number of Employeesby Employment Group........................... 6
4.1 Social Characteristics of Survey Respondents. 454.2 Age of Entrepreneurs and Marital Status..... 464.3 Age of Entrepreneurs by Sex.................. 474.4 Mean Monthly Sales, Costs, and Gross
Revenues by Activities........................ 494.5 Duration and Place of Training in Years..... 514.6 Experience of Entrepreneurs by Age of
their Enterprises............................. 534.7 Age of Enterprises and Experience
of Entrepreneurs by Activities in Percentages./' 544.8 Entrepreneurs' Opinions of
Quality of Materials.......................... 574.9 Capital Levels in the Sample Businesses..... 584.10 Correlation Matrix............................ 704.11 Correlation Matrix............................ 71
LIST OF TABLES PAGE
viii
*S
CHAPTER ONEINTRODUCTION
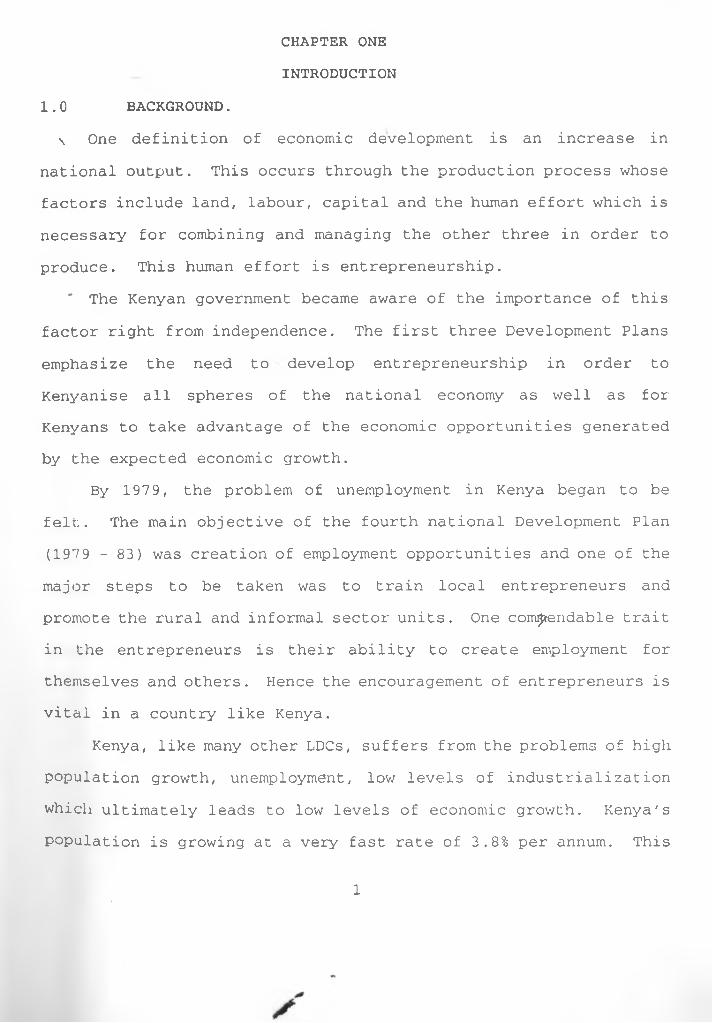
1.0 BACKGROUND.\ One definition of economic development is an increase in
national output. This occurs through the production process whose factors include land, labour, capital and the human effort which is necessary for combining and managing the other three in order to produce. This human effort is entrepreneurship.
' The Kenyan government became aware of the importance of this factor right from independence. The first three Development Plans emphasize the need to • develop entrepreneurship in order to Kenyanise all spheres of the national economy as well as for Kenyans to take advantage of the economic opportunities generated by the expected economic growth.
By 1979, the problem of unemployment in Kenya began to be felt. The main objective of the fourth national Development Plan (197 9 - 83) was creation of employment opportunities and one of the major steps to be taken was to train local entrepreneurs and promote the rural and informal sector units. One commendable trait in the entrepreneurs is their ability to create employment for themselves and others. Hence the encouragement of entrepreneurs is vital in a country like Kenya.
Kenya, like many other LDCs, suffers from the problems of high population growth, unemployment, low levels of industrialization which ultimately leads to low levels of economic growth. Kenya's population is growing at a very fast rate of 3.8% per annum. This
1
is expected to hit the 27.2 million mark by 1993.1 By the year 2000, Kenya will have a population of about 35 million people.This means that " it will be necessary ..... to double the numberof\jobs in Kenya".2
On the other hand Kenya's arable land (high and medium potential) is only 18% of the total land area while about 4/5 of the land is arid or semi arid.3 Land supply is not elastic relative to population growth. High population and scarce land has led to population pressure with places like Nyeri having a population density of 497 persons per square kilometer. Intensification of land use has not solved the problem due to fragmentation into uneconomic sizes which reduces productivity. This leads to the problem of unemployment. By the year 2000, 14 million jobs will be required. With only moderate growth of employment in the modern wage sector, an increasing number of people will have to settle down to small scale enterprises whose share as a proportion of total employment in the economy is expected to rise from 4.9% in 1987 to 7.1% in 1993.4
Small scale enterprises are the seedbed o4 the future\
industrial development which economists contend is the engine of
1 Republic of Kenya: Development Plan 1989-1993. GovernmentPrinters, p. 206.
2 Republic of Kenya: Sessional Paper Number 1 of 1986 on Economic Management for Renewed Growth. Government Printers.
3 Republic of Kenya: Development Plan 1989-1993. Government Printers. p. 171.
4 Republic of Kenya: Development Plan 1989 - 1993. GovernmentPrinters. pp 47-48.
2
economic growth and development. The Kenyan government has seen the correctness of this and has laid down several strategies to enhance industrial development. These include a shift from import substitution to export promotion o'f consumer and intermediate goods. Incentives such as establishment of export processing zones, manufacturing under bond, the green channel scheme and tax incentives have been provided. Several financial institutions such as ICDC, K-MAP, DFCK, KIE, and trade offices have been established with the aim of helping small scale enterprises establish an industrial base in the country.
Small scale enterprises are the instruments through which the government intends to achieve higher levels of income and employment generation. Small scale enterprises account for the largest share of employment in the private sector particularly for Africa. Surveys indicate that firms with fewer than 10 employees provide 59% of total private sector employment in KenyaQ Furthermore these small scale enterprises are attractive to the majority of people because of the ease of entry into the sector. They are relatively labour intensive in low ancty semi-skilled labour. They economize on the use of capital, managerial and other scarce resources. They only require modest capital to start.
Table 1 shows capital and labour inputs for selected manufacturing activities. The main source of initial investment
r’ Ademola, Oyeyide T. (1990) Entrepreneurship and Growth in Sub-Saharan Africa:>Evidence and Policy Implications.Paper prepared for the World Bank Conference on African Economic Issues in Nairobi, Kenya. June 4-7 1990. p. 3.
3
capital is from personal saving and loans from relatives and friends. The technologies used- by this sector require smaller inputs of capital but larger inputs of labour. This has been confirmed by studies such as Kenneth King's (1977) on Kenya's informal sector.
Table 1.1 Capital and Labour Inputs for Selected Manufacturing Activities.
Sources: Abstracted from Central Province nonfarm enterpriseSurvey 1977.
Small scale enterprises can play an important role in providing productive employment and earning opportunities. These small scale enterprises are involved in manufacturing^ services and trade. These activities can either be formal or informal depending on the definition we give them. Many studies have concentrated on the informal activities. These activities have received considerable negative public image, but of late their potential has been realized and the necessary assistance accorded6.
b There is ambiguity surrounding the definition of theinformal sector. The definition varies according to whether the activity is legal, there are barriers to entry, level of initial capital, labour requirements, competitiveness and
For instance in the 1989/93 development plan of Kenya, their role was spelt out as "that of income and employment generation". They are also efficient users of scarce resources, enhance personal sayings, spread benefits of industrialization more widely, make a contribution to technical progress as well as play a significant role in the development of entrepreneurs (Page and Steel, 1984). Tables 2 and 3 show the size distribution of manufacturing establishments by employment groups in terms of employees and number of establishments. The figures in these tables include those establishments which are limited liability companies and public bodies of an enterprise nature engaged in business activities. Very small non-agricultural rural establishments are excluded as well as establishments in the local government, private households and dormant establishments. To be precise the coverage is limited to the modern sector.* 7
7
it varies from one author to another. This term is deliberately not used in this study. We instead use the term small scale enterprises which include those employing 0-19 workers. This choice is arbitrary.
7 Republic of Kenya. Statistical Abstracts. 1987, 1988, 1989. C.B.S.
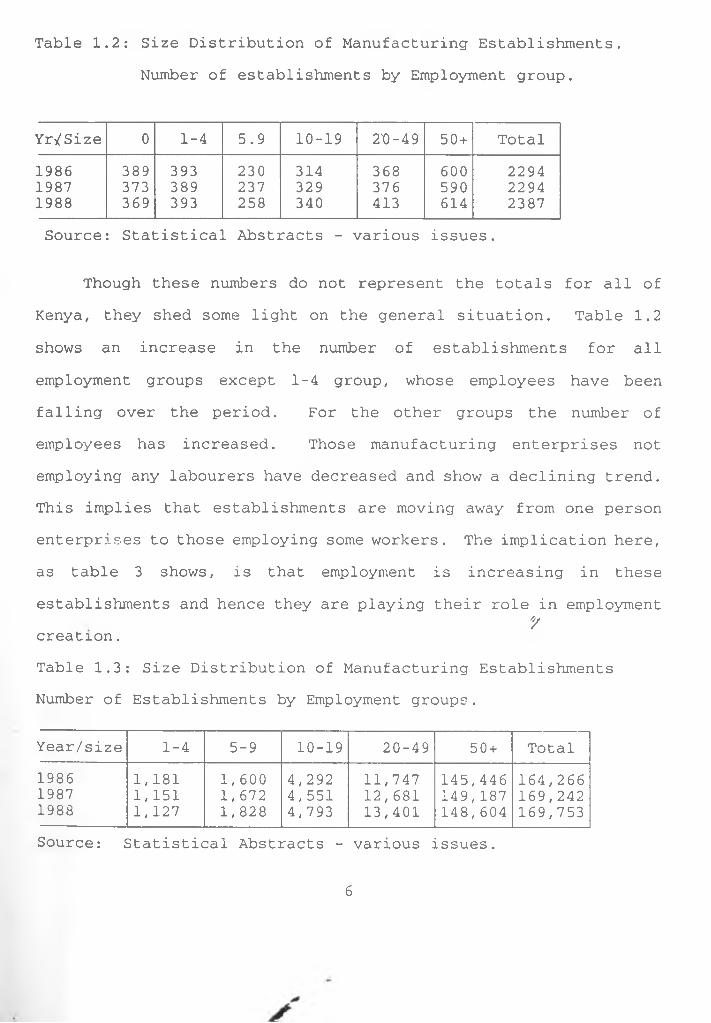
Table 1.2: Size Distribution of Manufacturing Establishments. Number of establishments by Employment group.
Though these numbers do not represent the totals for all of Kenya, they shed some light on the general situation. Table 1.2 shows an increase in the number of establishments for all employment groups except 1-4 group, whose employees have been falling over the period. For the other groups the number of employees has increased. Those manufacturing enterprises not employing any labourers have decreased and show a declining trend. This implies that establishments are moving away from one person enterprises to those employing some workers. The implication here, as table 3 shows, is that employment is increasing in these establishments and hence they are playing their role in employment
7creation.Table 1.3: Size Distribution of Manufacturing Establishments Number of Establishments by Employment groups.
Despite their enormous contribution and the great help accorded by the government, these enterprises still show massive failures. For instance, in an evaluation of Kenya rural industrial development programme, Livingstone' (1975) described it as "a comprehensive failure." The reasons for this failure may not be attributed to lack of capital or the environment because the government has tried to alleviate these. The World Bank (1987) further suggests that the "poor performance of the small scale sector cannot be attributed to unfavorable incentive structure" and this leaves, "entrepreneurial capacities as the principle explanation for the sectors lacklustre record."
The entrepreneur is an important part of an enterprise. It is the entrepreneur who makes things fit in the most practical and concrete way. The entrepreneur has been recognized as the "apex of the hierarchy that determines the behavior of the firm" (William 1968) .
(gap-filling) as well as is an input-completer. The entrepreneur takes up new opportunities and brings forth new ideas by creating and expanding input transforming entities or firms. The entrepreneur specializes in taking responsibility and making decisions that affect location, form and use of goods, resources, or institutions.
If we look at the entrepreneur as a decision maker, we can argue that an economy with more decision makers will make better use of its resources. They will be combined more efficiently since entrepreneurs allocate resources among alternative uses and assuming that they are used productively and that an entrepreneur is likely to make good decisions. In such a situation, the economy will be able to realize higher levels of output.
A successful entrepreneur must be able to identify and respond to opportunities for profit, manage the enterprise so as to maximize revenues and minimize costs, gain access to finance and other inputs required for production, market the goods and manage relations.
The entrepreneur is the central player pti the small manufactiiring enterprise drama being at the centre of economic activity carried out by the small firm. The entrepreneur handles all the aspects of the business: providing capital, overseeing operations, and participating in the production process. All this is done under risk and uncertainty and the entrepreneur has to prove himself in the competitive context of the market before his position becomes secure. These characteristics and roles are
8
/
responsible for differentials in profits among individual entrepreneurs. The entrepreneurs are responsible for accomplishing the process of economic development. They innovate and make new conobinations in production. The entrepreneur has actually been treated as one of the factors of production, a function which is a vital component in the process of economic growth. Without entrepreneurs, therefore, it is uncertain whether any society can acquire any economic vitality. As such in a growth conscious world, encouragement of entrepreneurs is the key to economic growth and development.
However, rather little work has been done on small business entrepreneurs and particularly on the relation between their characteristics and success (Little, Mazumdar and Page. 1987). In addition to this Morawetz (1974) concluded that remarkably little is known about the composition and characteristics of the small scale enterprises and therefore policy makers have been forced to make decisions in this area unencumbered by information. Nevertheless, evidence suggests that small scale firms are a significant and frequently dominant component of ttye industrial sector in LDCs, providing bulk of: industrial employment.
1.1 STATEMENT OF THE PROBLEMSmall scale enterprises can play a major role in achieving our
development objectives as outlined in the development plans. To do so, the enterprises need to be profitable in their activities.
I 9
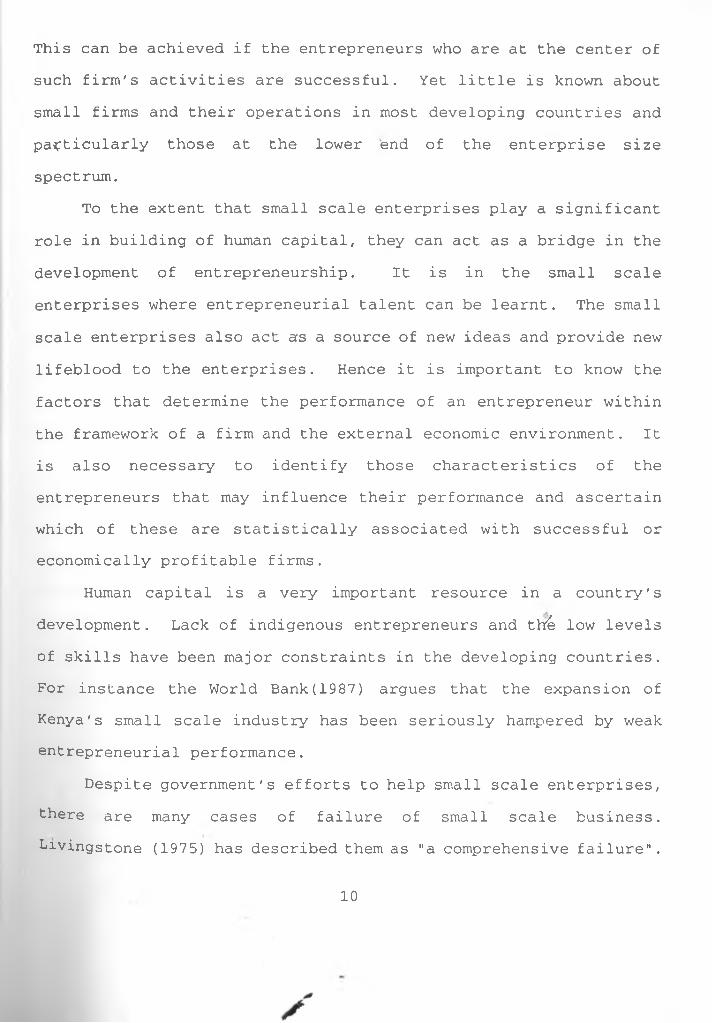
This can be achieved if the entrepreneurs who are at the center of such firm's activities are successful. Yet little is known about small firms and their operations in most developing countries and particularly those at the lower end of the enterprise size spectrum.
To the extent that small scale enterprises play a significant role in building of human capital, they can act as a bridge in the development of entrepreneurship. It is in the small scale enterprises where entrepreneurial talent can be learnt. The small scale enterprises also act as a source of new ideas and provide new lifeblood to the enterprises. Hence it is important to know the factors that determine the performance of an entrepreneur within the framework of a firm and the external economic environment. It is also necessary to identify those characteristics of the entrepreneurs that may influence their performance and ascertain which of these are statistically associated with successful or economically profitable firms.
Human capital is a very important resource in a country's development. Lack of indigenous entrepreneurs and thf£ low levels of skills have been major constraints in the developing countries. For instance the World Bank(1987) argues that the expansion of Kenya's small scale industry has been seriously hampered by weak entrepreneurial performance.
Despite government's efforts to help small scale enterprises, there are many cases of failure of small scale business. Livingstone (1975) has described them as "a comprehensive failure".
10
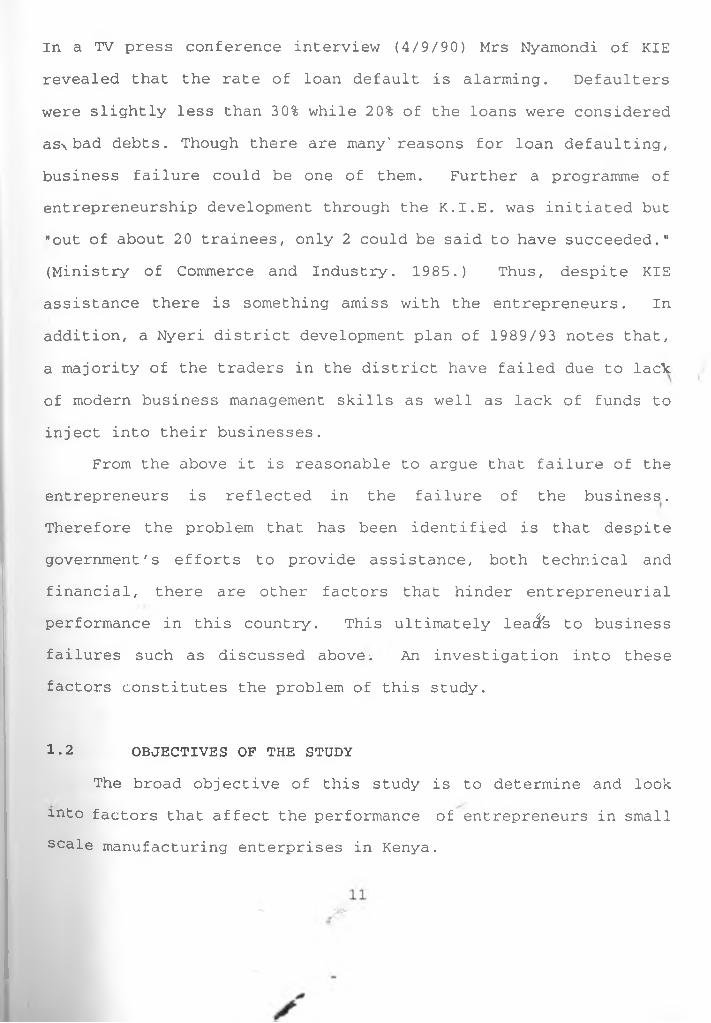
In a TV press conference interview (4/9/90) Mrs Nyamondi of KIE revealed that the rate of loan default is alarming. Defaulters were slightly less than 30% while 20% of the loans were considered as\ bad debts. Though there are many'reasons for loan defaulting, business failure could be one of them. Further a programme of entrepreneurship development through the K.I.E. was initiated but "out of about 20 trainees, only 2 could be said to have succeeded." (Ministry of Commerce and Industry. 1985.) Thus, despite KIE assistance there is something amiss with the entrepreneurs. In addition, a Nyeri district development plan of 1989/93 notes that, a majority of the traders in the district have failed due to lack of modern business management skills as well as lack of funds to inject into their businesses.
From the above it is reasonable to argue that failure of the entrepreneurs is reflected in the failure of the business. Therefore the problem that has been identified is that despite government's efforts to provide assistance, both technical and financial, there are other factors that hinder entrepreneurial performance in this country. This ultimately lead's to business failures such as discussed above-. An investigation into these factors constitutes the problem of this study.
1.2 OBJECTIVES OF THE STUDYThe broad objective of this study is to determine and look
into factors that affect the performance of entrepreneurs in small scale manufacturing enterprises in Kenya.
The specific objectives of this study are as follows:1. Determine factors that affect the performance or success of
entrepreneurs in Mathira Division.2. \ To specify and estimate a model' showing the relationship
between entrepreneurial performance (profitability) and the various factors affecting it.
3. To assess the relative significance of these factors in affecting entrepreneurial performance.
4. On the basis of (2) and (3) make conclusions and policy recommendations regarding small scale enterprises,
entrepreneurs and the determinants of their success.
1.3 SIGNIFICANCE OF THE STUDYAs has already been indicated, the entrepreneur is a vital
person in the process of economic development. The indigenous entrepreneur appears to be a driving force in success of businesses in Korea and Taiwan (Westphal et al 1981, Ho 1980).
But many studies treat the entrepreneurship issue in a very general manner. Only a few studies have l^een done on entrepreneurship and management in Africa (Harris 1971, Kilby 1971, Marris and Sommerset 1971, Beveridge and Oberschall 1979 ) .
This situation implies that very little is actually known about Kenyan entrepreneurs and the conditions or factors which affect them. Furthermore no econometric study has yet been done in Kenya on entrepreneurship. Rather most of the studies have based their results on descriptive analysis of field data with the
*S
12
exception of Matsebula (1988), Harris (1969), Olakanpo (1968) whose studies are econometric.
It is the entrepreneur who ensures that the means of prQduction are used most efficiently. Thus, an understanding of the factors affecting the performance of entrepreneurs is important as it will enhance entrepreneurial development programmes. It will also provide an indication of the potential constraints to the supply of entrepreneurs. This may also provide an insight into how policies for overcoming such constraints may be formulated. The present econometric study on Kenyan entrepreneurs, will add to the existing literature on entrepreneurship in Kenya, thereby acting as reference material for future studies.
In the past, the government emphasized providing capital and other forms of financial assistance, despite which firms have failed. This study, in establishing the factors which determine entrepreneurial performance will make it possible for policy makers to decide where assistance should be channelled. Appropriate policies can lead to reducing a major disadvantage of misdirecting funds in areas where they are not required. This ^study will no doubt make that vital contribution. There is also need to determine the characteristics of entrepreneurs in small scale industries and identify the determinants of their performance. This will help policy makers in understanding the kind of people they make policies for and also know what kind of assistance should be provided. This study will provide such information thereby closing the existing information gap and provide more information
13
to policy makers. It is hoped that with such information better policy for small scale enterprises will emerge.
\
V
14
*
CHAPTER TWO
2.0 LITERATURE REVIEW\ The literature reviewed below fbcuses on studies done in both
developed and developing countries on small scale enterprises. These studies have mainly looked at the constraints facing the enterprise as well as the entrepreneur, with only a few of them focusing on the entrepreneur and particularly so in Kenya.
These constraints are seen as the different variables affecting business success. The most frequently discussed are reviewed below. They include infrastructural facilities and support services, education and training of the entrepreneur, capital, personal attributes of the entrepreneur such as age, sex, marital status, experience and innovativeness, training in business management skills, availability of inputs such as raw material supply and policy biases and regulations.
Nzomo (1986) in looking at entrepreneurship development policy in Kenya, concludes that attention has mainly concentrated on the provision of infrastructural facilities and other support services. He considers this inadequate since despite their provisions we still have cases of failures. Provision of infrastructural facilities is seen by the government as a major handicap arising from lack of suitable financial, distributive and marketing infrastructure (Development Plan 1989/93). Page and Steel (1984) say that inadequate infrastructure is a constraint to small scale enterprises which is also highlighted by Wahome and Ng'et.he (1987)
15
in their study.Child (1973) in his empirical study of small scale
enterprises found complaints from owners to include transport, raw materials, machinery and equipment. 'Nevertheless, Nzomo says that too much attention has been given to provision of these facilities and calls for a review of the entrepreneurship development policy. He suggests that more emphasis should be laid on other factors and policies on infrastructure formulated and implemented.
Little (1987) found education of the entrepreneur to be of value in explaining profitability and growth. Also Page (1979) considered formal education attainment as a factor in explaining entrepreneurial success. Other studies however find no such relationships. Studies relating formal education and businesssuccess have consistently found weak and negative relationships (Harris 1971, Child 1977, Kilby 1969). Nevertheless, functional literacy has been found to be positively correlated with profitability of small scale firms (Aryee 1976, Olakanpo 1968). Little, Mazumdar and Page (1987) suggest that the explanation of this weakness might be that formal education is competitive with learning on the job, particularly for Africa. Their results of an Indian study showed that education beyond functional level was a significant positive factor for growth and profitability.
Kabwegyere (1978) says that participants in the informal sector lack requisite skills. He sees low levels of education of the entrepreneur causing a poor perception of the monetary economy. Kilby (1982) cites the low educational background of the
16
entrepreneur as a major handicap to the small scale sector. Ho (1980) argues that formal education can enhance a person's managerial and technical skills and consequently his or her ability toy operate the firm. This view is also held by Chuta and Leidholm (1985). They hypothesized that education would have a positive effect on profits of a firm. Nevertheless their regression results showed that formal education affected profits negatively and was not statistically significant hence supporting Harris (1971), Child(1977)< and Kilby (1969). The regression explained 59% of the variation. On the other hand, Olakanpo (1968) in his statistical analysis of some determinants of entrepreneurial success in Nigeria, cites educational attainment as a factor influencing performance. He measured the performance of the entrepreneur using the difference between initial capital and the present values of capital. In his model performance was influenced by initial capital, commodity group, experience, educational attainment and previous job. He postulated positive coefficients for all the variables.
Cortes, Berry and Ishaq (1987) found that the success of the firm as defined by Benefit-Cost ratios was significantly related to education and skills. These have a high explanatory power. They argued that university educated entrepreneurs employ a wide range of techniques whereas entrepreneurs with only elementary education tend to choose the simplest techniques. This would certainly have an effect on performance.
Harris (1969) found similar results regarding
17
education. He relates entrepreneurs with higher levels of education with higher profits. He ran a regression equation between observed profitability of the firm and observed characteristics of the entrepreneurs. He assumed no multicollinearity in the explanatory variables and that they affected the dependent variable (profitability) in an additive manner. In his model
Pr == c + aa Ind + a2 Eth + a3 Ed + a4 Exp + a5 Inov + a6 Res + a7 Pol + U
wherePr -• profitabilityc - constant
Ind - Specific industry or regional effectsEth -- Ethnic group membershipEd -- Education v
Exp - ExperienceInov -- Innovational activityRes -- Access to resources >pol - . . . "/ - Political involvement'U -- random error term .
He used Nigerian data. The R2 ranged from 0.13 to 0.57 which though low was found to be statistically significant given the crude measures of entrepreneurial performance.
Matsebula (1986) used different forms of education such as formal academic education, primary education, formal vocational training to capture some personal attributes of the entrepreneur.
18
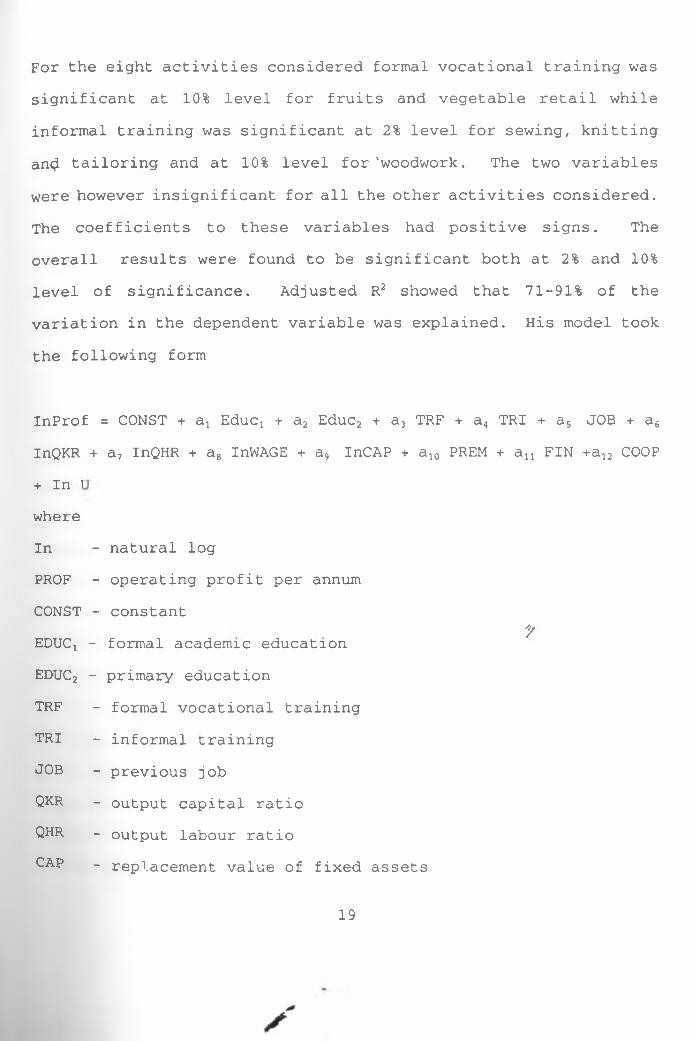
For the eight activities considered formal vocational training was significant at 10% level for fruits and vegetable retail while informal training was significant at 2% level for sewing, knitting an<l tailoring and at 10% level for 'woodwork. The two variables were however insignificant for all the other activities considered. The coefficients to these variables had positive signs. The overall results were found to be significant both at 2% and 10% level of significance. Adjusted R2 showed that 71-91% of the variation in the dependent variable was explained. His model took the following form
InProf = CONST + aj Educj + a2 Educ2 + a3 TRF + a4 TRI + a5 JOB + a6 InQKR + a7 InQHR + a8 InWAGE + a9 InCAP + a10 PREM + an FIN +a12 COOP + In 1 where InPROF CONST EDUCi
EDUC2 TRF TRI JOB QKR QHR CAP
19
- natural log- operating profit per annum- constant
*/- formal academic education- primary education- formal vocational training- informal training- previous job- output capital ratio- output labour ratio- replacement value of fixed assets
WAGE - wage rate per hour PREM - premisesFIN - financeCOOP - cooperative membershipU - disturbance term which is assumed to be lognormally
distributed.Other studies appreciate the fact that education is rare
among the small scale entrepreneurs (Nzomo 1986, Leidholm and Mead 1989, Marris and Somerset 1971, ILO 1972). This can act as a constraint to the success of the entrepreneur as it isolates him.
We have seen that actual evidence on the relationship between the level of education and successful management of small scale enterprises is mixed (Chuta, 1989) . Despite this most studies have found positive, though weak relationships. In the Kenyan situation education may not be a major explanatory variable given that it has been established that most of the entrepreneurs are primary schoolleavers, whose level of education may not have a great impact on
• • • profits (Wahome and Ng'ethe 1987) . Also majority of'entrepreneursin this sector are apprentices whose level of education is very lowand yet are successful. This implies that it is the training thatone gets and not his education that may have an effect on hisperformance. Education is a wide term that covers differentaspects of learning and acquisition of knowledge. This may beformal, informal, vocational, non-formal and they all reflecteducation. This study takes training in the relevant field to be
20
a representative of the entrepreneur's education because it enhances the acquisition of skills to run the enterprise. The role of education in the Kenyan case is appreciated and taken into account in that education is important in enhancing perception of ideas and business management skills. Hence education is reflected in the other variables such as job training and business management practices in our model though it does not appear.
Capital shortages is another factor that several studies have given prominence. ILO (1972) and Nzomo (1986) see capital shortages as a major constraint. Page (1979) identifies lack of access to investment and working capital as a constraint to small scale enterprises. He found that these enterprises can utilize capital more productively in terms of output generated. This view is also expressed by Leidholm and Mead (1987). Though several studies have mixed findings regarding the efficiency of small scale enterprises as compared to large firms , their social Benefit-Cost analysis showed the Social Benefit Cost ratios of the small firmsnot only exceeded one but was greater than the comparable ratios
✓for the large scale firms. This reveals that there isf accumulating evidence that at least for a significant range of products, small scale enterprises are indeed economically efficient. Little (1987) found that small scale enterprises are not reliably more labour intensive than their larger counterparts nor are they more technically efficient in their use of resources. This is a rather isolated view in that there seems to be a consensus among several works that they are more labour intensive and use relatively less
21
or moderate capital in their operations. Donald and Glen (1985) have stated that technologies used by the small scale firms (informal) are generally assumed to require smaller inputs of capital but larger inputs of labour.' They cite the study done by King (1977) in Kenya's informal sector which shows that this is the case. Availability of capital can be closely related to the availability of credit facilities. This is cited by Marris and Somerset (1971) as a major difficulty that entrepreneurs face in starting businesses. This view is also held by Cortes, Berry and Ishaq (1987) . They argue that access to a particular source of finance is probably as much a consequence as a cause of its success. Ng'ethe and Wahome (1987) consider entrepreneurial skills and capabilities as a factor in explaining the magnitude of initial capital which they consider a limiting factor in setting up of firms. Page (1979), on the other hand, argues that lack of access to credit and adequate working capital are the constraints. Kabwegyere (1978) cites this as lack of finance and hastens to add that institutions charged with providing finance have laid prohibitive lending conditions which very few rur^il people can meet. He concludes that the entrepreneurs are able, but lack of resources, goods, and services limits their performance.
Kilby (1982) also agrees with the latter by citing lack of cash, working capital as some of the handicaps in small scale enterprises and argues that the capital labour ratio is a good yardstick for factor intensity and a determinant of economic efficiency. Ho (1980) singles out capital as one of the major
22
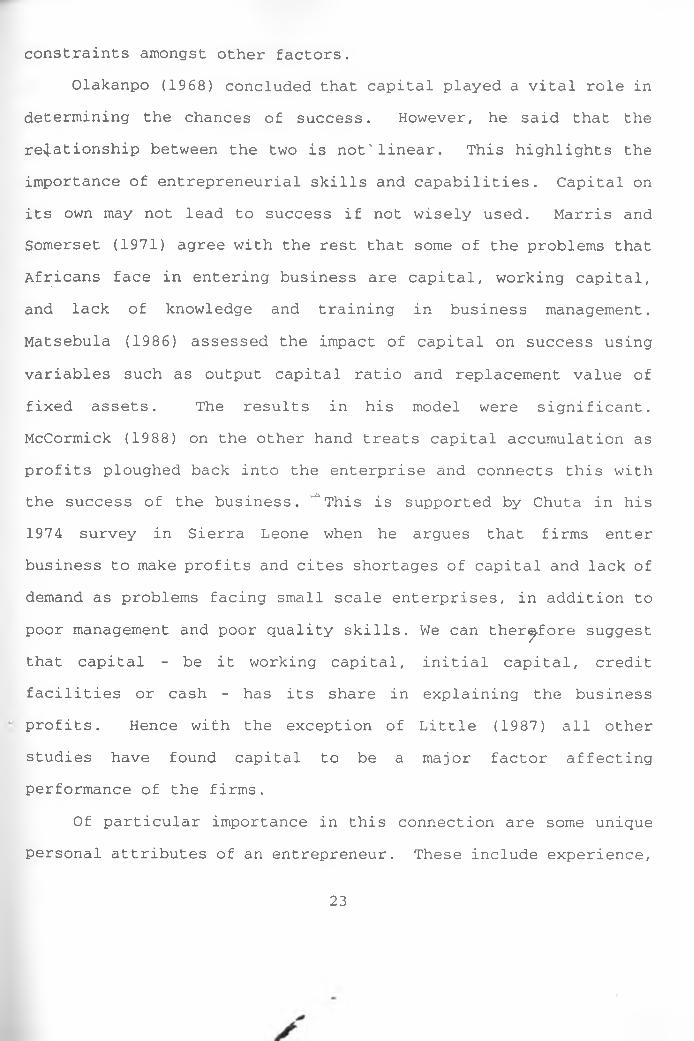
constraints amongst other factors.Olakanpo (1968) concluded that capital played a vital role in
determining the chances of success. However, he said that the relationship between the two is not'linear. This highlights the importance of entrepreneurial skills and capabilities. Capital on its own may not lead to success if not wisely used. Marris and Somerset (1971) agree with the rest that some of the problems that Africans face in entering business are capital, working capital, and lack of knowledge and training in business management. Matsebula (1986) assessed the impact of capital on success using variables such as output capital ratio and replacement value of fixed assets. The results in his model were significant. McCormick (1988) on the other hand treats capital accumulation as profits ploughed back into the enterprise and connects this with the success of the business. ^This is supported by Chuta in his 1974 survey in Sierra Leone when he argues that firms enter business to make profits and cites shortages of capital and lack of demand as problems facing small scale enterprises, in addition to poor management and poor quality skills. We can therefore suggest that capital - be it working capital, initial capital, credit facilities or cash - has its share in explaining the business profits. Hence with the exception of Little (1987) all other studies have found capital to be a major factor affecting performance of the firms.
Of particular importance in this connection are some unique personal attributes of an entrepreneur. These include experience,
23
age, innovative activities and sex as factors explaining performance of an enterprise. Ng'ethe and Wahome (1987) found that most of the entrepreneurs were male, young and married, between the ag^s 24-40 years. Most of them webe primary school leavers who were previously employed in other jobs. In their study, Little, Mazumdar, and Page (1987) found the modal age of entrepreneurs to be 35 years. While in Korea a survey of small businesses in 1973 found it to be 46 years. They argue that age is strongly related to growth rates. This finding is contradicted by Herbert and Link (1989) citing Hisrich (1980) when they say that, "according to sociological and psycho-management research, entrepreneurs who are risk takers are usually first born children, generally male, college educated, in their thirties at the time of start of the venture, highly motivated, creative, energetic and willing to take risk." There is a contradiction here as regards education and creativeness which we can attribute to cultural differences, such that the situation found in developed countries is different from that found in developing countries. The two studies however agree on the fact that they are mostly males and young. This brings in the question of sex. There is an indication that small scale enterprises are dominated by males and it raises concern as to whether this has an effect on performance. But Leidholm and Mead (1987) argue in their findings that in many countries a significant number of small scale entrepreneurs were females. They however do not indicate whether this has effect on performance or not. Nevertheless, little has been written on the subject of women in
24
small scale enterprises. McCormick (1988) found a significant difference in profitability between male and female operated enterprises. Hence, sex of the entrepreneur is seen as another fagtor affecting performance of a business. There is also the issue of innovation on the part of the entrepreneur. Lack of innovation leads to competition which is a constraint.
Page (1979) has used the age of the enterprise to capture the experience of the owner. This is also used by McCormick (1988) where she found that in general higher rates of profitability are observed for older firms. Chuta and Leidholm (1985) in their model used experience as an explanatory variable. They argue that entrepreneurs with greater experience would be expected to earn higher economic profits than those with fewer years of experience.In their findings experience had a positive and significant . coefficient at 5% level. They concluded that years of experience has a very important bearing on entrepreneurial success. Child (1973) in an empirical study of small scale enterprises found lackof experience to be a major constraint among other factors he
*/considered. Prior occupation of the owner and experience are treated by Ho (1980) as factors affecting performance while William (1968) and Leibenstien (1968) emphasize the importance of the entrepreneur in economic development and consider their personal characteristics as being important in explaining performance. Harris (1969) goes further to include ethnic group membership and political i involvement as factors affecting profitability in addition to the others cited above. These factors are relevant in
25
✓
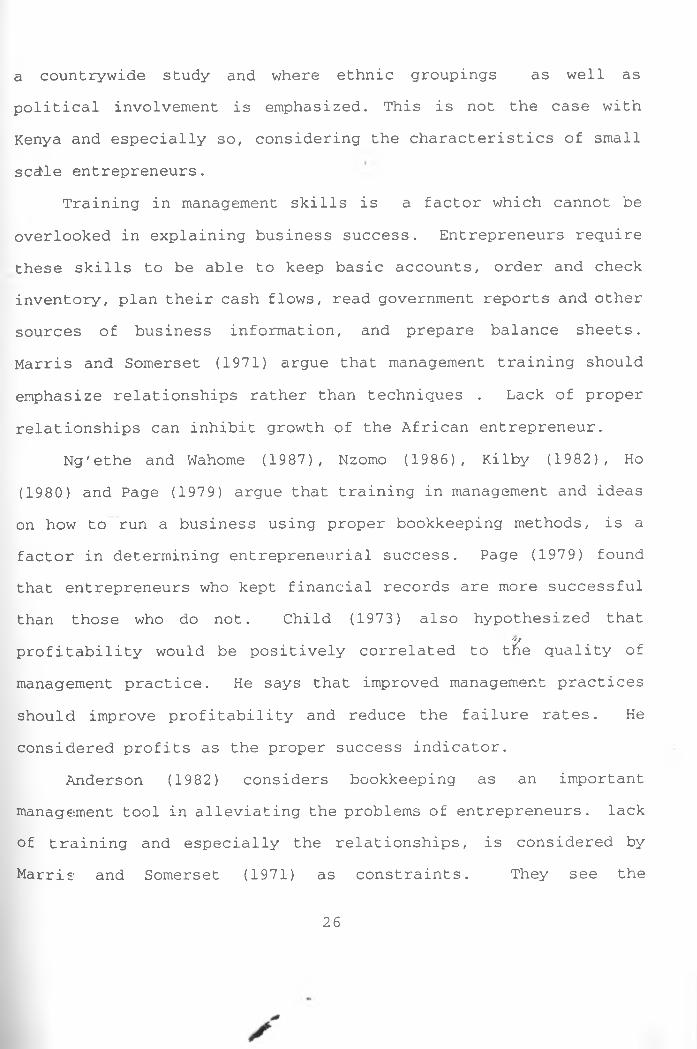
a countrywide study and where ethnic groupings as well as political involvement is emphasized. This is not the case with Kenya and especially so, considering the characteristics of small scehLe entrepreneurs.
Training in management skills is a factor which cannot be overlooked in explaining business success. Entrepreneurs require these skills to be able to keep basic accounts, order and check inventory, plan their cash flows, read government reports and other sources of business information, and prepare balance sheets. Marris and Somerset (1971) argue that management training should emphasize relationships rather than techniques . Lack of proper relationships can inhibit growth of the African entrepreneur.
Ng'ethe and Wahome (1987), Nzomo (1986), Kilby (1982), Ho (1980) and Page (1979) argue that training in management and ideas on how to run a business using proper bookkeeping methods, is a factor in determining entrepreneurial success. Page (1979) found that entrepreneurs who kept financial records are more successful than those who do not. Child (1973) also hypothesized that profitability would be positively correlated to tKe quality of management practice. He says that improved management practices should improve profitability and reduce the failure rates. He considered profits as the proper success indicator.
Anderson (1982) considers bookkeeping as an important management tool in alleviating the problems of entrepreneurs, lack of training and especially the relationships, is considered by Marris and Somerset (1971) as constraints. They see the
26
integration of the entrepreneur with the people he works with as a factor explaining their success. Ademola (1990) identified low levels of managerial skills as one of the major deficiencies in small scale sector. A majority of firms, he says, do not keep financial records. They also lack training in marketing, financial and management skills (Leidholm and Mead, 1989) . We note here that, though this is an important factor in explaining business profits or success, none of the studies done has incorporated it into their models. This study will include this variable in its model.
The problem of raw material supply is another constraint that small scale enterprises face (Page and Steel 1984). Child (1973) in an empirical study of small scale enterprises identified lack of raw materials as a major constraint. Raw materials are specific to the type of activity being carried out. In this connection the availability of the raw materials at affordable prices is an important determinant of good performance. Also of importance is the quality of the raw materials to good performance. Poor quality raw materials may often lead to very poor products which may lack markets. This factor though mentioned in various studies, does not appear in any of the models used and is thus incorporated into our model. This is a vital input in to the enterprise without which the enterprise may not operate.
The other issue in this connection is skill shortages. Performance may deteriorate due to lack of the appropriate skills or the necessary skilled labour.
Other studies such as Ravi and Uda (1981) in looking at the
27
industrial strategy for late starters, consider the establishment of markets as the major constraint. This view is held by Lee (1978) and Westaphal, Phee and Pussell (1981) who say that the quality of the product in this conne'ction is vital.
Other factors which affect small scale enterprises include policy biases and regulations disfavouring them. Page (1979) states that shortages of entrepreneurs has contributed to slow development of many economies. Also a World Bank paper (1987) sees entrepreneurial talents in Kenya as new and that their performance is weak. They see this as a function of the policy environment as well as factors internal to the firm. Hence they attribute the lacklustre record of the small scale enterprises to the poor performance of the entrepreneurial capabilities. Leidholm and Mead (1987) also consider policies to have effects on entrepreneurial performance. They argue that the bulk of small traders do not have access to credit and hence rely on informal sources. Policies on capital availability tend to make capital cheaper for large producers than for small producers. They state that in most LDCs the overall policy environment is skewed against^ small producers and is aimed at providing special benefits to the large manufacturers.
28
2.1 OVERVIEW OF THE LITERATUREThe studies reviewed revealed many factors that affect both
the entrepreneur and the enterprise in their general performance. Th^se factors range from provision of infrastructural facilities; education, capital, management skills, experience and many other personal attributes of the entrepreneur.
Most of these studies however, are mainly descriptive with only a few being econometric studies. Furthermore, most of these studies treat the entrepreneur issue in an aside manner. Only a few have given it a detailed analysis (Herbert and Link 1989, Nzomo 1986, Marris 1971, Kilby 1971, Marris and Somerset 1971 and Ademola 1990). Consequently we see that particularly in Kenya, the issue of the entrepreneur has not been given adequate treatment and analysis.
The few studies that are based on econometric methods of analysis are rather country specific (Matsebula 1988 and Olakanpo 1968). This is seen by examining the choice of their variables. For instance Harris (1969) used ethnic group membership and political involvement while Matsebula (1986) uses membership in a cooperative as variables in their models. The point here is that we cannot use these studies to generalize for the Kenyan case. This calls for a study in Kenya based on those variables best suited to Kenya. A number of variables emerge from the literature as important explanatory variables in the performance of the enterprises. These include job training which reflects the education of the entrepreneurs in relation to their jobs, initial
29
capital which is seen as a constraint in starting up a business. Capital labour ratios reflect economic efficiency and are also a good yardstick for factor intensity.
x Business management practices using tools such as bookkeeping and records of accounts are also factors that explain business performance. Improved management practices improve profitability and also reduce the failure rates. Another factor is availability of inputs which has not appeared in any other model. We include this factor in our model as it is an important input in an enterprise and its effects on performance should be known. Other factors relate to the personal characteristics of the entrepreneur. These are sex of the entrepreneur, age of the entrepreneur, experience of the entrepreneur as well as the innovative activities they are involved in. All these factors help in explaining differentials in profitability. These factors and their effects on profitability will be analyzed in chapter four and hypotheses about their relationships with profitability will be tested using data from Kenyan small scale entrepreneurs.
30
CHAPTER THREE
METHODOLOGY3.0 INTRODUCTION.
This chapter presents the sampling procedure, limitations of the sample and the data collected, area of study, model specification, justification and measurement of the dependent variable, hypotheses, and the estimation procedure used.The model specified tries to capture the relationship between profitability and the nine variables outlined at the end of chapter two. These are job training, experience of the entrepreneurs, age of the entrepreneurs, innovative activities, sex, business management practices, availability of inputs, initial capital and capital labour ratios.
The data for this study were collected through administering a questionnaire to individual small scale enterprise owners /operators in Mathira division of Nyeri district. Some information was also obtained through general discussions with the entrepreneurs and some officers in charge of licensing businesses in the area.
The questionnaire was structured to gather information on the following aspects of the entrepreneurs and the enterprises.
i) Personal data relating to ownership, age, sex, marital status and general education as well as location of the
vi) Business management practices,vii) Availability of inputs,
viii) Labour and capital.ix) Infrastructure and institutional supportx) Other economic activities and
xi) Data relating to general information on opinion and kind of assistance required
3.1 SAMPLING PROCEDUREThe sample respondents were selected at random from small
scale enterprise owners in Mathira division who had boughtlicenses for their businesses from January 1990 to March 1991.This was to ensure that those who had not renewed their licenses for 1991 were also included.
A list of 88 businesses was obtained from^ the licence conservancy and sign boards register and from the Nyeri district trade officer. The businesses selected comprise of tailoring, woodwork, metalwork, leatherwork, and poshomilling.
A simple random sampling procedure was used to select 80 respondents who form the sample of this study. The businesses were numbered from 1 to 88. Using pieces of paper of equal size thesenumbers were written. Then, they were folded and mixed in a
32
HI isauoimaa \ r "■ '
container from which 80 were randomly selected. 80 is roughly 91% of the 88 enterprises.
\
\
3.2 AREA OF STUDYThe area studied is Mathira division in Nyeri district. This
is a high agricultural potential area. Rainfall is approximately 750-1750 mm and the area is within the highland equatorial zone of Kenya. Mathira division covers an area of 324 sq.km. It has a density of 392 persons per square kilometer. The main cash crops grown in the area include coffee, tea and foodcrops such as maize, beans, vegetables and fruits. Most trade and business is small scale and competitive especially in trade and services. Most of the industrial ventures are light industries.
The main reasons for selecting Mathira as the study area are as follows:1 The area is densely populated and the scarcity of land has
driven people to start small scale enterprises. Most of the enterprises have been established for a reasonably long time to warrant a study.
2 Most of the activities are small scale, so the researcher did not have problems in getting the required sample size.
3 There are no communication barriers between the researcher and the respondents and transport means are well established .
4 The area is easily accessible to the researcher.
33
3.3 MODEL SPECIFICATION AND HYPOTHESESFrom the literature review several factors have been iden
tified as being responsible for the performance of entrepreneurs as weil as their enterprises. This study will consider some of the factors, particularly those relevant to the Kenyan situation. The factors will serve as the working hypotheses against which entrepreneurial performance will be assessed.
3.3.1 MODEL SPECIFICATION.Profitability, which has been used as a proxy for performance,
is regressed on the factors identified as having influence on entrepreneurial performance. These factors include job training, experience, age, innovative activities, sex, business management practices, availability of inputs, initial capital and capital labour ratio.
We first run nine simple regressions. Profitability is regressed on each variable. This will provide us with the individual effects of each variable on profitability. The second step involves running five regressions each corresponding to the five activities. The final step is to run one regression for all the 80 observations. The hypothesized model is as shown below.Step 1PROFi = f (JTRi# u) .............................................................i
PROFi = f(REXi, u) .............................................................i i
PROFi = f(AGEi, u) .............................................................. i i i
PROFi = f (INNOi, u)
34
PROFi = f (SEXj, u) ......................... vPROFi = f(BUMAi# u) ....................... viPROFi = f (AVIi, u) ......................... viiPRQFi = f (ICAPj, u) ................. '..... viiiPROFi = f (CLRi, u) ........................ ixWhere i runs from 1 to 80.
Where i stands for activity and runs from 1 to 5 j stands for observations such that
■v ■*j = 1 to 15 for woodwork.'A
j = 1 to 8 for metalwork, j = 1 to 16 for leatherwork. j = 1 to 8 for poshomilling. j = 1 to 33 for tailoring.
Step 3PROF =f (JTR,REX, AGE, INNO, SEX,
BUMA, AVI, ICAP, CLR, U)where;
*/
PROF = profitability of the business.JTR = job training in years, (a dummy variable; 1 = has had
job training; otherwise 0).
35
REX = relevant experience in years.AGE = age of the entrepreneur in years.INNO = innovative activities .(a dummy variable; 1 = there
\ are innovative activities'; otherwise 0)SEX = sex of the entrepreneur.(a dummy variable; 1 = male
otherwise; 0)BUMA = business management practices, (a dummy variable;
1 = there are business management practices; otherwise 0)
AVI = availability of inputs as measured by costs of acquiring inputs.
ICAP = initial capital.CLR = capital labour ratio.U = random error term which is assumed to be normally
distributed with constant variance and 0 mean.The appropriate estimation procedure for our model is Ordinary
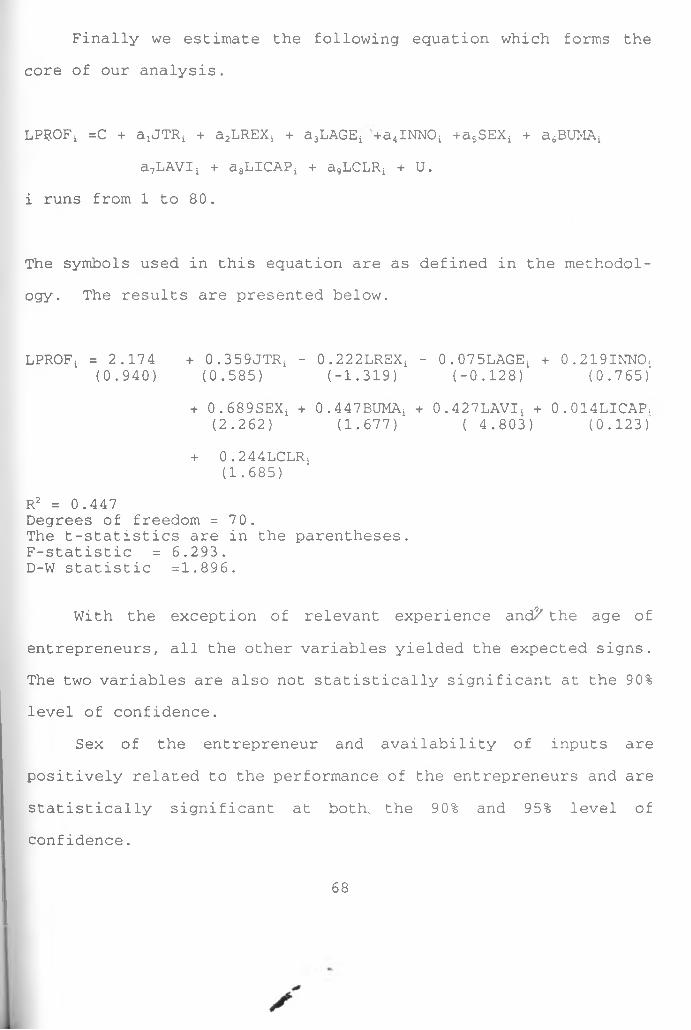
Least Squares (OLS) estimation technique. The equation to be estimated will take a log-linear function augmented by dummy variables. This will enable us to capture the influence of those important variables which are not quantitative. Specifically we estimate the model above as shown below.
LPROF = C + a^T R i + a 2LREXi + a 3LAGEi + a 4INNOi + a 5SEXi
+ a 6BUMA + a 7LAVI4 + agLICAP4+ agLCLR^ + U
aj > 0 for all j = 1 to 9.L stands for log and i runs from 1 to 80.
Q u a l i t a t iv e in fo r m a t io n i s a l s o th o ro u g h ly a n a ly zed u s in g SPSS/PC
36
computer package and is used as a basis for recommendation and understanding the sample in more details.
\
3.3.2 JUSTIFICATION AND MEASUREMENT OF THE DEPENDENT VARIABLE.Profits are normally taken to be the amount by which the total
revenue of an enterprise exceeds its total costs. Profits can be treated as returns to the entrepreneur as a result of correct decisions made in the present to bear fruit in the uncertain future. Hence, good performance of an entrepreneur can be indicated by the profitability of his enterprise.
In this study, profitability is used as a proxy for good performance. In economic theory it is assumed that firms are profit maximizers. In this study) it is assumed that entrepreneurs go into business to maximize profits. McCormick (1988) considers success as contingent upon the business' ability to generate sufficient profits to ensure its survival. Hence good performance can be properly defined in terms of profitability. Page (1979) also argues that entrepreneurial success can be measured using the rate of profits or the rate of growth of the firm, while Chuta (1974) argues that entrepreneurs must be profit motivated. In addition, in the competitive environment in which these firms operate, only those firms making profits are able to survive. This is an indicator of good performance. As such, profitability will be used to represent good performance.
In the field survey information regarding sales and costs was
37
gathered. From this information we calculated total monthly operating revenues and expenses for each enterprise. Profits were calculated by getting the difference between operating revenues and operating expenses.
3.3.3 HYPOTHESES.Hypothesis 1
A positive relationship exists between job training and the profitability of the business.
H0: ax = 0Ha: o> V o
Job training in this context means training in the relevant field. The variable is enhanced by previous jobs held, formal education and functional education. This variable tries to capture these aspects of education. It enhances the requisite skills the entrepreneur needs to run the enterprise.
Hypothesis 2Businesses run by entrepreneurs with more years of experience
are more profitable.H0: a2 = 0 Ha: a2 > 0
Experience is gained by doing the same thing over years. This also has some correlation with the previous jobs done by the entrepreneur. Hence this variable is measured using the number of
38
years the business owner/operator has been doing the kind of work related to the present job.
Hypothesis 3We hypothesize that age of the entrepreneur is positively
related to profitability.Hc: a3 = 0 HA: a3: > 0As outlined in the literature review older entrepreneurs are
likely to be more experienced and so their businesses may perform well. Older entrepreneurs also know more business " tricks" and may make better decisions than the younger ones. Their businesses are thus expected to have better performance.
Hypothesis 4A positive relationship exists between profitability and
innovationHc: a4 = 0HA: a4 > 0 -
Entrepreneurs who have innovated are likely to enjoy higher profits. They may not only benefit from the innovation but may also patent their discoveries hence enjoying the royalties. This should improve their performance.
39
Hypothesis 5There is a significant difference in profitability between
businesses run by males and females, x H0: a5 = 0
Ha: a5 > or < 0The sign on this coefficient is ambiguous. The literature does not come out clearly how the sex of the entrepreneur affects the performance of the enterprise. It is our task to find out the sign of this coefficient.
Hypothesis 6A positive relationship exists between the business management
practices and the level of profits.H0: a6 = 0 Ha : a6 > 0
Business management practices involve bookkeeping and accounting practices as a form of management tool. Evidence from the literature suggests that entrepreneurs who keep financial records are more successful than those who do ndt. Business management practices act as a pointer to where the business is going wrong or right so that remedial measures can be applied. Hence, businesses applying proper management practices are likely to perform well.
40
\
A positive relationship exists between availability of inputs and profitability.
Hypothesis 7
\ H0: a7 = 0Ha: a 7 > 0
Entrepreneurs who have no problems in acquiring inputs are more assured of continued production than those who experience problems. Hence availability of inputs will affect the business profit position.
Hypothesis 8Businesses which have high levels of initial capital are more
profitable than those with less.H0: a8 = 0Ha: a8 > 0
Initial capital portrays the size of the business. It is expected that those with large businesses should be doing better than those with smaller businesses. Size is positively related to the performance of the enterprise. ■'?
Hypothesis 9We hypothesize a positive relationship between profitability
and the capital labour ratio.H0: oIIa\rtf
Ha : a9 > 0Capital labour ratio is a good yardstick for factor intensity as
41
well as a determinant of economic efficiency. Firms which are more economically efficient are expected to have good performance.
All the hypotheses will be tested at a = 0.025 and a = 0.05. a\ stands for level of significance.'
*/
42
CHAPTER FOUR
RESULTS OF THE FIELD WORK AND DATA ANALYSIS\
\
This chapter is divided into two sections. We present the basic characteristics of the field data in the first section. This will be a descriptive analysis of the sample data as obtained from the field. In the next section, we shall present the results of the model specified in chapter three. These will be the results of the regression analysis. Hypotheses will be tested in this section and the results summarized.
4.1 BASIC CHARACTERISTICS OF THE FIELD DATA.In this section we present the basic data on small scale
entrepreneurs in Mathira division. This information consists of social characteristics, performance of the enterprises, job training, experience of the entrepreneurs, innovative activities, business management practices, availability of inputs such as labour and capital. Other information is general relating to the opinions of the entrepreneurs, kind of assistance they have received as well as the kind of assistance required.
4.1.1 Social Characteristics of EntrepreneursThis subsection provides personal information such as age,
sex, marital status, and general level of education of the entrepreneurs.
43
Of the 80 respondents the youngest was 18 years old while the oldest was 72 years. The modal age was 30 years. The mean age of the entrepreneurs was 30.4 years. This tallies with previous stvdies which suggest that most entrepreneurs are in their 30s, though in our study most of the entrepreneurs are in their 20s The table below gives a summary of the social characteristics of the survey respondents.Table 4.1 shows, 57.5% of the entrepreneurs are between 21 and 30 years while 76.3% lie between the ages 20-40 years. This holds for all the five groups of activities that were considered. In woodwork 73.3% lie in the 21-40 years group, while 87.5% in metalwork, 56.2% in leatherwork, 87.5% in poshomilling and 81.9% in tailoring fall in the same group. Considering the mean age of entrepreneurs, those in leatherwork are younger than the rest. This may be due to the low levels of initial capital needed to start those businesses such that more younger people venture into this activity to start with.(See table 4.9). We can therefore argue that the entrepreneurs are relatively young. The results also show that out of 80 respondents 54 were males and 26 were females. This is 67.5% and 32.5% respectively. As table 4.1 shows, all the businesses are male dominated with the exception of tailoring which is 69.7% female. Woodwork is 93.3% male, metalwork 100% male, leatherwork 100% male and poshomilling 75% male. Among the entrepreneurs, 55% [44 out of 80 ] were married while the rest were single.
a - Numbers in the parentheses indicate sample size. Source: Field Survey.
45
Tables 4.2 and 4.3 show the age of the entrepreneurs and their marital status and the age of the entrepreneurs by sex respectively. At 4 degrees of freedom and 0.01 level of significance, a X2 of\ 23.7 indicates that there is 'association between age and marital status. Table 4.1 shows that most of the entrepreneurs in leatherwork and tailoring are young and single. For the other activities the entrepreneurs are older and more are married.
Table 4 .2: Age of Entrepreneurs and Marital Status.
Age Married Single TotalNumber % Number % Number %
When asked whether they could read and write, all the 80respondents said yes. Further assessment revealed that they allhad some years of education. The majority (43.8%) had completedprimary school and another 27.5% had some secondary education.
Table 4.1 reveals that the levels of education aire rather low. Most of the entrepreneurs are primary school leavers. This confirms the findings by Ng'ethe and Wahome. For instance 80% of the entrepreneurs in woodwork have only had primary education. One hundred percent of those in metalwork have only some secondary education. This means that they never completed form four and can be treated as primary school dropouts. In leatherwork 93.8% corresponds to this group while in poshomilling we have 75% and in
47
tailoring 78.8% fall in this group.Out of 80, only 13 respondents had education of form four and
above. This means that 83.8% of the respondents have very low levels of education.
4.1.2 Performance of the Enterprises.Nearly all the entrepreneurs complained of slack business at
the time of the interview, but we managed to get data on their normal sales as well as costs of materials. The sales ranged between Kshs.200 and Kshs.93,640 per month . The mean sales per month was Kshs.15,431 and the median sales were Kshsl0,000 .
Costs of raw materials ranged between a low of Kshs.200 and a high of Kshs.60,000. The mean cost of raw materials was Kshs. 8,254 per month.
Table 4.4 shows the sales and costs by type of activity, as well as the mean monthly sales, costs and gross revenues by type of activities. The table shows that 32 out of 80 businesses were making sales of less than Kshs.5000 per month. At 0.01 level of significance, the critical X2 statistic for 16 degrees of freedom is 32.00. Our calculated X2 at 0.01 level of significance for 16 degrees of freedom is 38.31. This implies that there is a significant association between performance and the business type. We can therefore conclude that on „the whole the types of business show some marked differences in their performance as per sales.
Numbers in the parentheses indicate percentages.Totals add up to 28 due to missing information from 5
respondents.** Totals add up to 67 due to missing information from 13 respondents.Source: Field Survey.
49
Woodwork, metalwork and leatherwork have the highest mean sales as compared to poshomilling and tailoring which are performing relatively poorly. In terms of monthly costs, a X2 of 23>42 at 9 degrees of freedom indicates significant association between costs and performance of the entrepreneurs. Woodwork, metalwork and leatherwork have the highest mean monthly costs compared to tailoring.
Mean monthly gross revenue which is taken as the difference between mean monthly sales and mean monthly costs shows metalwork to be more profitable than the rest. The mean monthly gross revenue for tailoring and woodwork falls below the mean for all the businesses.
However, considering the size of enterprises we can argue that their performance is satisfactory.
4.1.3 Training of the Entrepreneurs.Most of the respondents, 95% (76 out of 80) said they had been
trained in the jobs they were currently undertaking. Out of these, 14 had been trained at village polytechnic for a peric^d of not less than two years. Six of them had been trained at traininginstitutes of technology for not less than two years. Fifty-six out of 76 were trained as apprentices and advanced several reasons why they did not train at village polytechnic or training institutes of technology. Out of these 56, 49 had been trained for less than a year, approximately six months and above while 7 of them had been trained for 3-5 years. Table 4.5 shows the duration
50
and place of training for the sample entrepreneurs.
Table 4.5: Duration and Place of Training in Years. \ Duration in years
0-2 3-5 Total respondentsPlace of training Number % Number % Number %
* Totals add up to 76 because 4 respondents had had no training. Source: Field Suevey.
The table shows that 73.7% of the respondents had been trained as apprentices. This reveals very low levels of trailing in recognized institutions. We note here that there is no relationship between the place of training and the duration of training. A X2 of 2.12 for 2 degrees of freedom at 0.01 level of significance confirms this.
The entrepreneurs advanced several reasons for not training in the recognized institutions. Among them were lack of fees (30%), others did not know where to train (2.5%) . Many (35%) had very low
51
opinion of the recognized training institutions. They argued that graduates from such institutions still become apprentices for some time to perfect their skills. Others thought that only those who wapt government employment go to su'ch places. Others said that they were in desperate need of money so they wanted to start earning immediately. Nevertheless, when asked about their skill rating 87.5% said their skills were good.
4.1.4 Experience of the Sample Entrepreneurs.The experience of the entrepreneurs was assessed by the length
of time the entrepreneur had performed the present kind of job. Several studies use age of the business to denote experience (Page 1979 and McCormick 1988). In our study, age of the business and experience of the owner are treated differently. Some entrepreneurs had businesses which were only a few years old while they had done the same work for many years. This implies that they had more years of experience than the age of their businesses.
A cross tabulation of the experience of entrepreneurs and the age of their enterprises reveals that 4 businesses were aged between 1-10 years but had 11-20 years of experien<Jte while one business with the same age had 21-3 0 years of experience and another 31 years and above of experience. Out of 8 businesses aged 11- 20 years, 1 had 21-30 years of experience, while out of 4 businesses aged 21-30 years, 2 had 31 and over years of experience and 1 had 1-10 years of experience. This situation is shown in the table below.
52
Table 4.6: Experience of Entrepreneurs by Age of their Enterprises.Experience
A test of differences between age of businesses and experience of entrepreneurs shows that there is a significant difference between the two. A X 2 at 0.01 level of significance and 12 degrees of freedom equals 86.6 while the critical value is 26.2. This leads us to conclude that there is a significant difference between age and the experience of the entrepreneurs.
Using the number of years the entrepreneur had performed the present kind of job, we found that the years of experience ranged between 1-41 years. The mean years of experience are 8.3 years. The age of the businesses ranges from 1 to 51 years with a mean age of 6.7 years and a mode of 2 years. Table 4.7 sftows age of enterprises and the experience of entrepreneurs by the activities.
53
Table 4.7: Age of Enterprises and Experience of Entrepreneurs byActivities in percentages.
WDn=15
MTn=8
LTn=16
PSn=8
TLn=33
TTSAMn=80
Ag^ of enterprises (years) 1-10 80.0 71.4
\
100.0 62.5 81.8 82.311-20 13.3 28.6 - - 12.1 10.121-30 6.7 - - 12.5 6.1 5.131-40 - - - 12.5 - 1.341 + - - : - 12.5 - 1.3Mean age of businesses in years. 8.2 8.4 5.5 16.8 7.9 6.7Experience of entrepreneurs in years.1-10 57.1 37.5 100.0 87.5 78.8 75.911-20 28.6 50.0 - - 12.1 15.221-30 14.3 12.5 - - - 3.831 + - - - 12.5 9.1 5.1Mean years of experience 11.2 13.0 5.5 9.2 9.4 8.3KEY: WD - Woodwork. MT - Metalwork . LT - Leatherwork. PSPoshomilling. TL - Tailoring . TTSAM - Total SampleSource: Field Survey.•
A comparison of the mean age of the business and the rr.esn years of experience shows that except for leatherwork, businesses show more mean years of experience than their mean ages. F°r instance, woodwork has a mean age of 8.2 years and mean experience of 11.2 years. Metalwork has a mean age of 8.4 years but a mean experience of 13 years. Even for the total sample the mean age of the business is 6.7 years while the mean experience is 8.3 yeans.
The table also shows that a majority of the entrepreneurs (75.9%) had experience of between 1 and 10 years. For instance/ 78.8% of the tailors, 87.5% of the poshomillers, 100% °f
54
leatherworkers fall in this group. Only 4 out of 80 (5.1%) had experience of over 30 years.
On previous jobs done , only 31 entrepreneurs answered in the affirmative. These jobs include casual work, clerical jobs, farming, shopkeeping, construction, teaching, and matatu business.
4.1.5 Innovative Activities:The innovative activities considered include coming up with a
design or improving the present design, coming up with or modifying a production technique.
From the sample, only 18 entrepreneurs (22.5%) said they had come up with their own designs. Six of them either bought from or copied from the designer. A majority (59%) said that they waited for customers to describe designs for them. Hence, we can see that the level of innovativeness is very low among these entrepreneurs.
Out of 80 entrepreneurs, only one entrepreneur said he had come up with a new product and only six had discovered new markets, while three said they had come up with a new production technique.
yIf we combine these to denote innovative activities, then we can say that very few entrepreneurs have innovated.
4.1.6 Business Management Practices.Several entrepreneurs were aware that record keeping is good
but were not practising it. They argued that it is demoralizing if the business is making losses. Nevertheless, 30 (37.5%) keptrecords of sales, another 30 (37.5%) kept records of costs while
55
only 26 kept records of creditors and another 27 kept records of stocks. We can therefore see that record keeping is not very common among these entrepreneurs. In addition, only 7 out of 80 entrepreneur were employing accountants in their businesses and 15 of them had attended business management courses.
4.1.7 Availability of InputsA v a i l a b i l i t y o f in p u ts can be r e f l e c t e d by many f a c t o r s .
These are whether the in pu ts are hard to g e t , whether they are
a v a i la b le in the r ig h t q u a n t i t i e s , t h e i r c o s t s , q u a l i t y ,
t im e l in e s s o f a c q u ir in g them and the d is t a n c e t r a v e l l e d in search
o f in p u t s .
From the sample data 71 out of 80 (89%) said that the materials they used were not hard to get and 83.8% said that they were satisfied with the inputs they used. Seventy per cent got their materials in time. This information reveals that most of the entrepreneurs had no problems in acquiring their inputs. When asked about the quality of the inputs they used the entrepreneurs responded as shown in table 4.8. x
56
Table 4.8: Entrepreneurs' Opinions of Quality of Materials.Response Number of Entrepreneurs % of totalBad 8 10.0%Good 59 73.8%Be§t 10 12.5%Total 77* 96.3%*** Totals add up to 77 because information from three respondents was missing.** Totals do not add up to 100% for the same reason as above. Source: Field Survey.
The table shows that 73.8% thought the materials they used were good. In addition to those who said they were best we have 86.3% who had no problems with the quality of the faw materials. In addition to this 91.3% said that they got their materials in the right quantities. This is more evidence to show that availability of raw materials can not be considered as a problem among these entrepreneurs.
Thirty-two out of eighty entrepreneurs travelled approximately 120 Km. to purchase their raw materials while another 35 purchasedtheir raw materials within the town. On average the cost of
. . . '</ acquiring the materials was Kshs.4500 per month. '/
Thirty-two entrepreneurs employed paid workers. 48.8% of thefirms employed between 1 and 3 workers. Hence most of theenterprises were one-person affairs.
57
Levels of Capital for the Sample Entrepreneurs.Table 4.9: Capital Levels in the Sample Businesses.
capital(Kshs) 30,667 103,125 9, 688 226,875 38 ,334 51,499KEY: WD - Woodwork. MT - Metalwork. LT - Leatherwork. PM -Poshomilling. TL - Tailoring. TTSAM - Total sample.Figures in the parentheses indicate percentages.Source: Field Survey
58
The mean initial level of capital was approximately Kshs. 10,000 though most of the entrepreneurs had started with only Kshs. 5,000. Just over a half (51.3%) of the businesses had started with capital levels of upto Kshs. 5,000. '
At 16 degrees of freedom and 0.01 level of significance, we have a X2 of 39.3. This implies that there is a significant association between the level of initial capital and the business type. Woodwork and poshomilling are the businesses requiring higher levels of initial capital (see table 4.9). Leatherwork requires the lowest levels of initial capital while metalwork and tailoring require just the average of around Kshs. 8,000.
The present levels of capital show that there is association between business type and the present capital levels. This is indicated by a X2 of 43.4 at 0.01 level of significance and 12 degrees of freedom. Again leatherwork seems to have the lowest levels of present capital while poshomilling has the highest followed by metalwork.
A comparison of mean levels of initial capital and present capital for all the businesses shows that they have a<£l accumulated more capital since their start. For some businesses capital levels have risen by as much as 6 times. This implies that the businesses have grown in terms of initial capital.
4.1.9 O pinions o f E ntrepreneurs and Kind of Support R equired .
Opinions of the entrepreneurs were sought regarding tax Payment, transport facilities, business success and constraints to
59
expanding their businesses.Out of 80 entrepreneurs 62 (77.5%) had no problems with the
transport facilities in the area. The transport facilities were gcxpd. Only 17 said there was a problem especially during the rainy weather.
Regarding tax, 38.8% wanted it reduced while 6.3% said it should be abolished. Another 10% said it was oppressive particularly for the small businesses most of which lacked premises. The rest were resigned and said it should be paid since the government cannot abolish tax once it was introduced.
Most entrepreneurs had positive attitudes towards theirbusinesses. Seventy-eight point eight per cent said that theirbusinesses were successful while the rest said that they were not.F if t e e n per cent o f the en trepren eu rs s a id th a t t h e i r b u s in e s s e s
were successful because they had added more capital in to theirbusinesses. A minority (21.3%) thought that their businesses weresuccessful because they were able to meet all their needs usingproceeds from t h e i r b u s in e s s e s . A few (8 .8% ) s a id t h e i r
"/businesses were successful because "I would not be here if my business was not successful." The fact that they were still operating revealed to them that their businesses were doing well. Another 30% said that they make profits and by their own judgments their businesses had expanded. This made them say that theirbusinesses were successful. Of those who said that their businesses were not successful, ' 19.1% attributed this to competition such that there were no markets for their products.
60
The entrepreneurs were also asked what problems they encountered in trying to expand their businesses. The problems included lack of money, lack of premises, lack of capital and markets.
Lack of money seemed to be the most pressing problem, with 26 (32.5%) citing money alone and another 23 (28.8%) citing a combination of lack of money and either premises or capital. Lack of premises makes the business very insecure. This is also a problem as 13 out of 80 (16.3%) cited this alone as problem while another 21 (26.4%) cited lack of premises combined with lack of capital, money and markets. Only two thought capital was a problem. Overall opinion was that with money one can do the necessary to expand a business.
In this connection they were asked what kind of support they required to improve the performance of their businesses and what institutional support they had thus far received. Only 3 out of 80 (3.8%) had received support from banks and K.I.E. in form of loans, machines and equipment. A majority (96.3%) had not received any support. They cited lack of collateral securities as the main reason why they had not sought or received such support. Others revealed that it was extremely hard to get the support particularly from K.I.E. and they had tried in vain to do so.
As for the kind of support they needed, 28 (35%) wanted loans alone while 18 (22.5%) wanted loans and credit. Twenty five (31.3%) wanted premises alone while 8 (10%) wanted loans and premises. Generally the kind of support needed included loans,
61
premises, credit facilities and protection from established industrialists, assistance in looking for markets, improvement of infrastructure in the rural areas. Two of the entrepreneurs thought that it would be beneficial if education on business management was provided.
Several entrepreneurs expressed the wish to have some kind of a forum through which they can channel their problems. They said that due to lack of organization they could not seek or receive help from the government on individual basis. They hoped that if they were organized into groups it would be easier for their problems to be known and they could also suggest the kind of assistance that they required.
62
4.2 RESULTS OF THE MODELIn this section we present the results of the model specified
in chapter three.x Using OLS estimation procedure we estimate the following
equations.LPROFi = C + ajJTRi +U.LPROFi = C + a2LREXi +U.LPROFj = c + a3LAGEi +U.LPROFi = c + a4INNOi +U.LPROFi = c + a5SEXi +U.LPROFi = c + a6BUMAi +U.LPROFi = c + a7LICAP.i +uLPROFi = c + a8LAVIi +u.LPROFj = c + a9LCLRi +u.
i runs from 1 to 80. L stands for logarithms. The symbols used inthese equations are as defined in the methodology. The computerresults of the above equations are shown below.
The results show that the variables innovative activities, business management practices and availability of inputs have the expected signs and are significant at both the 90% and 95% level of confidence. Sex of the entrepreneur has a positive sign and is significant at both the 90% and 95% level of confidence. The levels of initial capital and capital-labour ratio are positively related to profitability and are only significant at 80% level of significance. Experience of the entrepreneurs though insignificant is positively related to profitability. Job training and the age of the entrepreneurs are both insignificant and do not have the expected signs.
The explanatory powers of the individual variables are very low with the exception of availability of inputs which alone explains 34.8% of the variation in profits. The D-W statistics being very close to 2 indicate that there is no serious problem of autocorrelation.
To a s s e s s the e f f e c t s o f our v a r i a b le s fo r each o f the
a c t i v i t y , we estim a te d the fo l lo w in g f i v e e q u a t io n s .
LPROFj,
i = 1 to 5.j = 1 to 15 for i = 1.j = 1 to 8 fo r i = 2 .
j = 1 to 16 for i = 3.
✓
64
1 1 to 8 for i = 4.j = 1 to 33 for i = 5.L stands for logarithms.The results are summarized below in a tabular form.
In woodwork the five independent variables explain 36.1% of the variation in profitability. These are job training, relevant experience, business management practices, availability of inputs
65
and capital labour ratios. All these variables affect profitability positively except experience which is negative and insignificant. Capital labour ratios and availability of inputs ar^ both significant at 80% level of confidence. The F-statistic indicates that this is a poor fit. The variables age and initial capital were eliminated due to multicollinearity while innovative activities and sex of the entrepreneur were causing the problem of the dummy variable trap resulting in a near singular matrix.
In metalwork, age of the entrepreneur, innovative activities, availability of inputs and capital labour ratios explain 96.6% of the variation in profitability. With the exception of capital- labour ratio which is negative and significant at 90% level of confidence, all the other three variables are positively related to profitability. Age and availability of inputs are both significant at 90% level of confidence. For this activity only four variables were used. This was due to the problem of degrees of -freedom, having had 8 parameters to estimate and only 8 observations. The fact that we now have only 4 degrees of freedom means that wecannot draw any policies as we require at least 1/5 degrees offreedom to do so. A D-W statistic of 1.85 indicates noautocorrelation while the F- statistic of 23.1 indicates a good fit.
In leath erw ork , age o f the e n trep ren eu r, in n o v a tiv e
a c t i v i t i e s , se x , b u s in e s s management p r a c t i c e s , a v a i l a b i l i t y o f
inputs and c a p i t a l - l a b o u r r a t i o to g e th e r e x p la in 68.8% o f the
v a r ia t i o n in p r o f i t a b i l i t y . Age o f the en trepren eu r a f f e c t s
66
profitability negatively and it is also significant at 80% level of confidence. Business management practices and availability of inputs are both positive and significant at 80% level of confidence. Innovative activities,'sex and capital labour ratio are positive but not significant. Job training, relevant experience and initial capital were eliminated due to the problem of multicollinearity that they were causing.
Poshomilling is another area where we had degrees of freedom problem. Four variables - relevant experience, availability of inputs, business management practices and capital labour ratio - explain 78% of the variation in profitability. Of the four only business management practices is significant at 90% level of confidence. The rest are positively related to profitability (except capital-labour ratio) and are all insignificant.
Relevant experience, innovative activities, sex, business management practices, availability of inputs and capital labour ratio explain 44.4% of the variation in profitability in tailoring. Among them capital labour ratios and availability of inputs are positively related to profitability and are significant at 80% level of confidence. Relevant experience is negatively related to profitability but it is not significant. All the other variables are positively related to profitability. The F- statistic and the D-w statistic indicate that the model is good and there is no autocorrelation. Job training, age of the entrepreneur and initial capital variables are dropped 'as they are the cause of multicollinearity.
Finally we estimate the following equation which forms the core of our analysis.
LP^OFi =C + a^JTRj + a 2LREXj + ajLAGEj +a4lNN0j + a 5SEX^ + a^BUMA ̂
a 7LAVIi + asLICAPi + a9LCLRi + U.
i runs from 1 to 80.
The symbols used in t h i s equ ation are as d e f in e d in the m ethodol
R2 = 0 . 4 4 7Degrees of freedom = 70.The t-statistics are in the parentheses.F-statistic = 6.293.D-W statistic =1.896.
With the exception of relevant experience and?' the age of entrepreneurs, all the other variables yielded the expected signs. The two variables are also not statistically significant at the 90% level of confidence.
Sex of the entrepreneur and availability of inputs are positively related to the performance of the entrepreneurs and are statistically significant at both, the 90% and 95% level of confidence.
68
Business management skills and the capital labour ratio are also positively related to performance of the entrepreneurs. Both the variables are significant at the 90% level of confidence. Job training, though affecting performance positively, is not statistically significant at the 90% level of confidence. Therefore we can argue that sex, business management practices, availability of inputs and capital labour ratio have a positive and significant effect on the profitability of the enterprises.
The nine variables explain 44.7% of the variation in profitability. This leaves 55.3% of the variation explained by the factors not included in the model. These may include educational attainment, previous jobs, premises, finance and others. These may also help to explain the variation in profitability.
An examination of the D-W statistic which is 1.896 reveals that we have no problem of autocorrelation or serial correlation. The critical values of F-statistic are 2.72 for 1% level and 2.04 for 5% level for our equation. The degrees of freedom are 9 and 71
yrespectively. Hence, looking at our critical F-statistic we can say that our regression equation is significant at both 1% and 5% level.
Examination of the results above reveals that there is multicollinearity among some of the variables. Multicollinearity makes it impossible to interpret the coefficients of the affected variables. Hence it makes sense i'f only one of the collinear variables appear in the model. (Pindyck and Rubenfeld, 1976 p. 67).
69
Looking at the correlation matrix, we see that age of the entrepreneur is highly correlated to relevant experience while capital labour ratio and initial capital are also correlated.
v We shall perform step-wise 'regression to decide which variables to drop from the model in order to solve the problem of multicollinearity.
Table 4.10 Correlation Matrix for all Variables.
LPROF JTR LREX LAGE INNO SEX BUMA LAV I LICAP LCLR
Through a series of step-wise regression, the variables age of the entrepreneur and initial capital were dropped. Als<4 by examining the results of the regression, capital labour ratio is significant while initial capital is not. Similarly relevant experience is significant while age of the entrepreneur is not. Hence using OLS estimation technique we estimate the model without the two variables. The model estimated is as specified below.LPROF* =C + ajJTRj + a 2LREXj + a^INNO* + a^SEX* + asBUMA* + ajLAVI*
+ a 7LCLRi + U
70
The symbols used in the equation above are as defined in chapter three. The computer results of this model are presented below.
+ 0.467BUMAi + 0 . 4 46 L A V I i +0 .240LCLRi .( 1 . 8 0 4 ) ( 5 . 0 0 7 ) ( 2 . 0 2 2 )
R2 =0.443Degrees of freedom = 72.The t-statistics are in the parentheses. F-statistic = 8.174.D-W statistic = 1.921.
Before we embark on a comparison of the results of the two models, we would like to see whether the problem of multicol- linearity has been solved. To do so we present the correlation matrix of the variables used in the above model.
Table 4.11 Correlation matrix for all variables used in the model.LROF JTR LREX INNO SEX BUMA LAVI
The correlation matrix shows that there is no multicollinearity. This problem has been solved by dropping the two variables, age of the entrepreneur and the initial capital. Now we can compare the
71
results of the two models.First, the standard error of-the whole regression has lowered
from the previous one of 1.047 to 1.036. Also by dropping the two variables LAGE and LICAP the standard errors of all the other variables have decreased indicating that multicollinearity was actually a problem.
Secondly, all the variables have retained their expected signs with the exception of relevant experience. This variable has a negative sign. This is contrary to previous studies which have found experience to be positively related to performance. This variable is statistically significant at the 90% level of confidence while in the previous model it was not significant. Job training has not changed much though its t- statistic has improved. It is not statistically significant at the 90% and 95% level of significance. Nevertheless, job training has retained the expected sign. It affects performance positively.
Innovative activities still have a positive effect on performance but it is statistically not significant at the two levels. Sex remains significant at the 90% level of confidence and is positively related to performance. Previously it was significant at both the 90% and 95% levels of confidence. Business management practices has improved its t-statistic but it remains significant at the 90% level of confidence. Similarly availability of inputs has improved the t-statistic and it remains significant at both the 90% and the 95% level of significance.Lastly the capital labour ratio has also improved and it is now
S
72
The explanatory power of the seven variables is 44.3%. This leaves 55.7% unexplained by the model. Comparing this with the previous model, the R2 has lowered by 0.004 which is a very small change considering that the present results are free of multicollinearity. In addition to this the D-W statistic has improved from 1.896 to 1.921 which is very close to 2 and so we have no problem of autocorrelation. Also comparing the F-statistic we see that it has improved from 6.293 to 8.174. This implies that this is a better model than the previous one. Therefore considering these points we shall rely on the second model for our analysis. Below is a summary of the regression results outlined above.
From the latter model on whose results we base our summary we have seen that relevant experience affects the performance of the entrepreneurs negatively. This factor is also significant. Our finding is contrary to previous studies which found experience to have a positive and significant effect on profits (Harris 1969, McCormick 1988, Page 1979, Chuta and Leidholm 1985) /
One possible explanation of this unexpected sign lies in our definition of experience. Majority of the businesses lie in the age and experience bracket of 1-10 years. The mean and the median age of the businesses is 6.7 years and 3 years respectively. The mean and the median experience is 8.3 years and 6 years
significant at the two levels of confidence.
r e s p e c t i v e l y . This im p lie s th a t en trep ren eu rs had more y e a r s o f
exp erien ce w h ile t h e i r b u s in e s s e s had fewer y e a r s o f a g e . These
S
73
businesses may not have established a very firm base and could have been making very low profits. We can also argue that the businesses being very young, had not reached the age where they had recouped the initial investments 'in their businesses, and so experience could not explain profits positively.
Another possible explanation can be attributed to the fact that experience and age are very closely correlated. Age also has a negative effect on profitability. It is therefore possible that older entrepreneurs have other business interests and social responsibilities such that they do not devote all their energies on the businesses. They may therefore be more experienced but their businesses perform poorly due to lack of involvement and reinvestment of business profits therein.
Despite the above, a simple regression of experience on profitability shows that experience and profitability are positively related though it is not significant. Also job training and age of the entrepreneur are related to experience and may be actually the ones causing the problem.
"/Sex of the entrepreneur, business management practices, availability of inputs and capital labour ratio have positive and significant effects on profitability or performance of the entrepreneurs. From our findings we have seen that these businesses are male dominated and there is a significant difference between the male and female owned businesses. Businesses run by males are better off than those run by females. This is shown by the positive and significant coefficient of the gender variable.
74
(
Using the X2 test at 0.10 level of significance, business management practices, experience of the entrepreneur, initial capital, capital-labour ratios, type of activity, education and marital status were found to have significant association with the sex of the entrepreneur.
Out of 26 females, only 6 were practicing business management practices while 21 had experience of between 1- 10 years. These two factors could have had a negative impact on the businesses run by females. We found significant association between the type of activity and sex of the entrepreneur. Out of 26 females 23 (88.5%) are engaged in tailoring. There is also a significant association between business type and performance. One conclusion that arises out of this is that businesses run by females perform relatively poorly than those run by males because of the type of activities females are involved in. From table 4.4 we found that tailoring businesses perform relatively poorly than the other businesses.
Another p o s s i b l e e x p la n a tio n i s th a t most fem ales are s i n g l e .yThere is a significant association between sex of the entrepreneur
and marital status. Out of 26 females 20 are single. Marital status may have some indication of a "sense of responsibility". Our expectation is that married entrepreneurs are more responsible than the single ones. Since more males are married, and thus more responsible, their businesses perform better than those of their female counterparts.
Lastly our low value of R2 may be attributed to the fact that
75
(
this is a cross-section study. In cross-section studies a low value of R2 may occur even if the model is a satisfactory' one. This is due to the large variation across individual units of observations which is inherently present in the data (Pindvck and Rubenfeld 1976. p. 37).
CHAPTER FIVE
CONCLUSION AND POLICY IMPLICATIONS
\
5.1 SUMMARY AND CONCLUSIONMost of the entrepreneurs, about 76.3% were aged between
20 and 40 years. This tallies with a previous study done in Kenya by Ng'ethe and Wahome (1987). Also their levels of education are rather low with 83.3% having at most some secondary education or approximately less than 10 years of formal education. Majority (73.3%) were trained as apprentices mostly due to the negative attitude held by entrepreneurs regarding the recognized training institutions.
We found that the age of the enterprise and experience of the entrepreneurs were significantly different. Seventy-six per cent of the entrepreneurs had only between 1 and 10 years of experience. Levels of innovative activities turned out to be very low. Only 22.5% had come up with a new design while only 3 out of 80 had come up with a new or modified the production technique. ^The business management practices are not very common though the entrepreneurs are aware of the benefits of such practices. The entrepreneurs also revealed that they have no problems in acquiring their inputs. They were comfortable with the quality of the materials they use. Another finding was that 51% of the businesses were sole proprietorships. Those which employed paid labour (48.8%) were employing between 1 and 3 workers. But due to low levels of
77
(
capital used the capital labour ratios are low.Judging by the resppnse of the entrepreneurs the transport
facilities are not a problem in the area. Among the problems encountered in trying to expand their businesses were lack of money, premises, capital and high taxation.
Among the factors identified as affecting performance of entrepreneurs are job training, relevant experience, innovative activities, sex of the entrepreneur, business management practices, availability of inputs, and capital labour ratio. Availability of inputs is positively related to profitability. This factor is statistically significant at 95% level of confidence for the total sample. This factor is also significant at 90% level of confidence for metalwork and tailoring. This implies that performance can improve even more if inputs are made available to the entrepreneurs. Capital labour ratio is also positively related to profitability. It is significant at 95% level of confidence. As outlined above the capital labour ratios in this sample are low. This factor affects the woodwork businesses positively and it is
. . ysignificant at the 90% level of confidence. This means that use of more labour and less capital especially where labour is abundant has a positive effect on performance.
Business management practices have a positive effect on profitability. It is significant at 90% level of confidence for the total sample. In poshomilling, this factor is positive and significant at 90% level of confidence. The implication is that those who practice the various forms of bookkeeping and accounting
78
methods are likely to realize more profits than those who do not. Sex of the entrepreneur also has a positive effect on profits. The coefficient for this variable is positive and significant at 90% level of confidence for the total sample though insignificant for the disaggregated activities. Those businesses operated by males are more profitable than those operated by females. This is attributed to the kind of activities most females are engaged in, whose performance is poor. The implication is that maybe males are involved in more risky and "hard to start" businesses and hence are better entrepreneurs.
Contrary to our expectations, the experience of the entrepreneur has a negative effect on performance. This factor is significant at 90% level of confidence. These results are rather strange considering that "practice makes perfect". This may be explained by our definition of experience, such that more experienced entrepreneurs were having very young businesses which had not established a firm base. Also experience and the age of the entrepreneurs are highly correlated. Older entrepreneurs may
7be having other business interests and this could have affected the profit position of their businesses.
Innovative activities and job training have positive effects on profitability. However, the two variables are not significant either at 90% or 95% level of confidence. This does not mean that these factors should be ignored but rather they should be enhanced.
Most of the findings from this analysis confirm what other
79
researchers found to be true. The study confirms that most entrepreneurs are young, males, and have low levels of education as found in Ng'ethe and Wahome (1987). The levels of business management practices was found to be low. Capital-labour ratios were found to be rather low in these businesses as well as the initial levels of capital. Hence, the businesses were relatively more labour intensive. Some findings were contrary to those of the previous studies. Age of the business was found to be significantly different from the experience of the owners which in our case affected profitability negatively. Tentative explanation has been given for this contradiction. Job training, which was reflecting education had a weak positive effect on performance. Lastly the study found that sex of the entrepreneur had a positive and significant effect on performance. Male operated businesses were doing better than female operated ones. The major reason for this is the kind of businesses females venture into and their poor performance.
80
5.2 POLICY IMPLICATIONSThe policy measures outlined below are aimed at ensuring that
the performance of the small scale entrepreneurs is improved and entrepreneurship encouraged in the country.
To improve the performance of small scale entrepreneurs, training in business management practices should be emphasized. Such courses should be organized in form of seminars or even on- the-job training. This can be done by extension officers who should monitor the progress of the small scale enterprises. Also the mass media can be used to educate the entrepreneurs on the importance of proper and efficient business management practices.
Inputs that the small scale entrepreneurs use in their enterprises should be made affordable to them. An arrangement should be made such that the entrepreneurs can get the inputs and the raw materials on credit. Also instead of making long journeys to purchase inputs every small town should have a wholesaler who would deal with the requirements of the entrepreneurs. This is only possible if the number of entrepreneurs in such a town allows it. Since a low capital labour ratio affects' the profits positively, the government in formulating its policies should make labour cheaper than capital. This can be done by subsidizing labour instead of capital. This will make capital more expensive in relation to labour and ensure that more labour is utilized hence improving the performance of small scale enterprises. Though sex of the entrepreneur was found to have a significant and positive effect on performance, the policy recommendations arising are not
81
very robust. From the tentative explanation given we can recommend that females be encouraged to venture into other kinds of activities (apart from tailoring) which are more profitable.
x Job training affects performance positively and so should be emphasized. Since apprenticeship seems to be a very popular method of technical training for the small scale industry operators, a way should be worked out in which the entrepreneurs get the best training. For instance the best entrepreneurs could be employed by the government or any other agencies for the purpose of training the apprentices. Besides this, the negative attitude that the entrepreneurs have against the village polytechnics should be reversed. This can be done by providing all round or complete training so that the graduates from these institutions serve as motivation for others to join them. Also the fees in these
einstitutions should be made affordable to the majority of the dropouts. With the relevant training we would then expect the products to be of high quality thereby improving performance.This policy and the rest that follow arise from other aspects of the research and not directly from the model. Th& small scale enterprises as well as entrepreneurs lack proper organization. This makes it very difficult for them to air their views as well as their problems and seek for what they need most. As such a good starting point would be the formation of small scale enterprise cooperatives. This should begin by coming up with one universally accepted definition of the small scale enterprises. Formation of such cooperatives can act as* a medium through which entrepreneurs
82
can r e c e iv e a s s i s t a n c e in form o f e d u c a tio n , c r e d i t f a c i l i t i e s ,
lo a n s , e x te n s io n a d v ice and o t h e r s . This would c e r t a i n l y go a long
way in im proving the performance o f sm a ll s c a l e e n tr e p r e n e u rs .
N P r o v is io n o f prem ises would a lS o improve the perform ance o f
the e n tr e p r e n e u rs . The prem ises p ro v id e s e c u r i t y f o r s to c k s ,
machinery and o th e r wares o f the e n tre p re n e u r . T h e re fo re a
s t r a t e g y sh ou ld be worked out on to p ro v id e s u i t a b l e p r e m is e s . In
a d d it io n to t h i s , lo an s to sm all s c a l e e n trep ren eu rs sh ou ld be
o f f e r e d a t s o f t e r terms w ithout demanding v ery h igh c o l l a t e r a l
s e c u r i t i e s . They should a l s o be educated on how b e s t to u t i l i z e
such lo a n s . I s s u in g o f loan s should be done w ithout in v o lv in g a
l o t o f r e d -ta p is m as most o f the en trep ren eu rs w ith t h e i r l i t t l e
ed u ca tion do not know what happens. This to g e th e r w ith the long
p r o c e s s o f f i n a l l y g e t t i n g loan money may d isc o u ra g e p o t e n t i a l
en trep ren eu rs from borrowing hence a f f e c t i n g t h e i r perform ance.
T h erefo re the i s s u in g o f loan s should in v o lv e fewer s t e p s .
5.3 CONTRIBUTION OF THE STUDY. ■ */
This econom etric study on Kenyan sm all s c a le en trep ren eu rs and
the d eterm in an ts o f t h e i r performance has s e v e r a l c o n t r ib u t io n s to
make. F i r s t , i t has e s t a b l i s h e d s e v e r a l fa c t o r s which have a
s i g n i f i c a n t e f f e c t on performance o f en trepren eu rs and which had
not been an alyzed e c o n o m e tr ic a l ly b e f o r e . These in c lu d e the
b u sin e ss management p r a c t i c e s , a v a i l a b i l i t y o f in p u ts , and sex o f
the e n tre p re n e u r . The study a l s o found th at low c a p i t a l labour
83
ratios are favorable to the performance of entrepreneurs.In addition to providing evidence to the findings of the
previous studies, the study also provides reference material for future studies. The findings of this study are also of help to policy makers. This is due to the fact that we can generalize these results beyond Mathira. This is because most small scale entrepreneurs in Kenya share the same characteristics as those found in Mathira case. Therefore, in making policies regarding small scale entrepreneurs, the findings of this study can be applied to other areas in Kenya.
5.4 LIMITATIONS OF THE STUDY.One of the limitations of this study is in the sample and the
data collected. The sample selected excludes two groups of entrepreneurs. The first group is that of entrepreneurs who for some reason do not buy licenses for their businesses. From the general discussions and participant observation, I noted many businesses which did not appear in records bu£ were still operating. These are excluded from our sample. Since they perform the same kind of activities as those sampled and our sample is large it is hoped that their exclusion should not affect our results significantly. •
The second group is that of entrepreneurs who operate in Sophia area. Due to a land dispute, those businesses operating there particularly woodwork and metalwork do not appear in the
84
records. These are not included in our sample. Since they operate in the same environment, it is likely that they share the same problems and conditions. As such their exclusion is not expected t O \ affect the results.
The results of this study need to be interpreted with caution. This is because most entrepreneurs do not keep records or accounts of their operations. As such computations based on their data may have some errors, but efforts have been made to minimize them by comparing and cross-checking responses from different entrepreneurs.
Another methodological limitation of this study is that we made use of cross-section data which gives information at a given point in time. Theoretically time series data is more appropriate for the estimation of economic relationships (Koutsoyiannis, 1977 p.403 ). Therefore, this causes a weakness in our methodology.
5.5 SUGGESTIONS FOR FURTHER RESEARCH.This study examined seven variables v£hich affect
entrepreneurial performance using a log-linear model augmented by dummy variables. The model explains 44.4% of the variation leaving 55.6% unexplained. Hence, there is need for further research to include other variables such as the effects of marketing, financing, forms of cooperation, and institutional support. The modelling can also be changed to include some macro-economic variables such as population, inflation, national income,
85
unemployment, and the economic growth of the economy. This is a step towards ensuring a complete focus on the determinants of entrepreneurial performance.
\
*/
BIBLIOGRAPHYAdamu, S.O (1969); "A Statistical Analysis of some Determinants
of Entrepreneurial Success; A Nigerian Case Study.-A Theoretical Consideration and Extension." Nigerian Journal of Economics and Social Studies Vol. 11 No. 1 (1969) 29-41
x Nigerian Economic Society. Ibadan University Press.Ademola, Oyeyide T. (1990); Entrepreneurship and Growth in
Sub-Saharan Africa: Evidence and Policy Implications. Paper Prepared for the World Bank Conference on African Economic Issues in Nairobi, Kenya. June 4-7 1990.
'Anderson, Dennis (1982); Small Industry in Developing Countries: Some Issues. World Bank Staff Working Paper No. 518. Washington D.C. World Bank.
Child, C. Frank (1973); "An Empirical Study of Small Scale Rural Industry in Kenya." IDS Working Paper No. 127 UON.
Child, C. Frank (1973); "Entrepreneurship, Management and Labour in a Society in Transition." IDS Working Paper No. 128 UON.
-Child, Frank (1973); "Programmes and Policies for PromotingGrowth of the Intermediate Sector in Kenya. IDS Working Paper No. 130
£huta, Enyinna (1989); "Weaknesses in Small Enterprises Manage ment." in Ed. Gerald Meir and William M. Steel; Industrial Adjustment in Sub-Saharan Africa. Published for the World Bank. OUP
Chuta, Enyinna and Leidholm, Carl (1985); Employment and Growthin Small Scale Idustry. Empirical Evidence and Policy Assesment from Sierra Leone. St. Martins press. New York.
Cortes, Mariluz , Berry, Albert and Ishaq, Ashfaq/t 1987);Success in Small and Medium-scale Enterprises: The Evidencefrom Colombia. A World Bank Research Publication. Published for -the World Bank. OUP.
Donald, B. Freeman and Glen B Norcliffe (1985); Rural Enterprises in Kenya: Development and Spatial Organisation of the Non - farm Sector. York University. The university of Chicago. Department of Geography Research Paper No. 214 .
Evans, Edward C.D. (1964); Profit Planning and the Measurementof Return on Capital Employed. London. Macdonald and Co. Ltd publishers.
87
Gulhati, Ravi and Uda, Sekhar (1981); Industrial Strategy forLate Starters; The Experience of Kenya, Tanzania and Zambia.World Bank Staff Working Paper No. 457. The World Bank. Washington D. C.
Harris, John R. (1969); "Entrepreneurship and Economic Develop ment. " IDS Discussion Paper No'. 75 UON.
Harvie C.H (1978); "Some Basic Ideas on the Informal Sector in Kenya." IDS Occasional Paper No. 25 UON.
Herbert, Robert F. and Albert N. Link (1989); "In Search of theMeaning of Entrepreneurship." Small Business Economics Vol. 1 No. 1 1989 p. 39-49. London. Kluwer Academic Publishers.
Ho, Sam P.S (1980); Small Scale Enterprises in Korea andTaiwan. World Bank Staff Working Paper No. 384. Washington D.C.
House, W.J (1971); Market Structure and Industry Performance:The Case of Kenya. IDS Discussion Paper No. 116 UON.
ILO, (1972); Employment, Incomes and Equality: A Strategy forIncreasing Productive Employment in Kenya. ILO. Geneva.
Intriligator, M. D (1978); Econometric models, Techniques andApplications: Prentice Hall Inc Eglewood Cliffs.
Kabagambe, House W.J and Terry green (1977); The Potentialfor Income and Employment Generation in Kenya's Urban Informal sector: A proposed survey. IDS Working Paper No. 310 UON
Kabwegyere, T.B (1978); "Institutional Bottlenecks and the Growth of Informal Sector in Kenya." IDS Occasional paper NO.25 UON
Killick, Tonny (1978); "The Informal Sector and Development Strategy in Kenya." IDS Occasional Paper No. 25^tlON
KIE (1978); Development of Small Scale and Informal Units in Manufacturing Sector. Nairobi. K.I.E.
t.Kilby, Peter (1982); "Small Scale Industry in Kenya." MSU Rural Development Series. Working Paper No. 20.
King, Kenneth (1977); The African Artisan: Education and the Informal Sector in Kenya. London Heinmann.
Koutsoyiannis, A (1977); Theory of Econometrics. Macmillan Education Ltd. Second Edition.
88
Lee, Michael (1978); "Constraints on the Expansion of theInformal Manufacturing Sector. Some Thoughts. IDS Occasional Paper No. 25 UON
Leibenstein, Harvey (1968); "Entrepreneurship and development"American Economic Review vol. 58 No. 2 1968. Washington D.C.
\Leidholm, Carl and Mead, Donald (1987); Small Scale Industries in Developing Countries. Emperical Evindence and Policy Implications. MSU International Development Papers No 9 1987. Department of Agricultural Economics. Michigan state University.
Leidholm, Carl and Mead D.C (1989); "The Small Scale Sectorand Entrepreneurship." In ed. Gerald Meir and William F. Steel; Industrial Adjustment in Sub-Saharan Africa. Published for the World Bank. OUP. 1989.
Little, I.M.D (1987); Small Manufacturing Enterprises inDeveloping Countries. The World Bank Economic Review vol. 1 No. 2 Jan. 1987.
Little, IMD, Mazumdar, Dipak and Page, J. M. (1987); SmallManufacturing Enterprises. A Comparative Analysis of India and Other Economies. Published for the World Bank. OUP.
Livingstone Ian (1975); "Kenya's Rural Industrial DevelopmentProgramme. An Evaluation of Experience and Proposals for Action." IDS Working Paper No. 210 UON.
Marris, Peter (1968); "The Social Barriers to African Entrepren eurship." IDS Discussion Paper No. 61 UON.
Marris , Peter (1971); "African Businessmen in a Dual Economy."Journal of Industrial Economics vol. XIX No. 3 July 1971. Basil Blackwell. Oxford, England.
yMarris, Peter and Somerset A. (1971); African Businessmen : A
Study of Entrepreneurship and Development in Kenya. London. Routledge and Kegan Paul.
Matsebula M.S.(1988); "Entrepreneurial success in Swaziland'sUrban Informal sector: A Profit Function Framework. E.A.E.R. vol 4 No.l 1988.
McCormick,Dorothy (1988) Small Manufacturing Enterprise inNairobi :Golden Opportunity or Dead ? Phd Thesis. Baltimore, Maryland. John Hopkins University.
\
Muench,Louis H (1978); "A Final Demand Approach to the InformalSector and Implications for Public Policies." IDS Occasional Paper No 25 UoN.
89
Mullineaux Donald (1978); "Economics of Scale and Organisational Efficiency in Banking: A Profit Function Approach." TheJournal of Finance vol.33 No 1 March 1978. New York.
Ng'ethe Njuguna and Wahome J. G. (1987); "The Rural Informal Sector x in Kenya: Report of a Survey in Nyeri,Meru, Uasin Gishu and
Siaya Districts." IDS Consultancy Reports Nol6 UoN.Nzomo,N.D.(1986) "Entrepreneurship Development Policy in National
Development Planning: The Kenyan Case." E.A.E.R. Vol 2 No 1 1986
Obasanmi Olakanpo (1968); "A Statistical Analysis of some Determinants of Entrepreneurial success: A Nigerian case study." The Nigerian Journal of Economic and Social Studies vol 10 No21968. Nigerian Economic Society. Ibadan University Press.
Obilo Lucas (1989); “Employment Potential in Urban Informal Sector: A Case Study of Garages in Nairobi." M.A. Research paper. UoN.
Page J.M. (1979); Small Enterprises in African Development :ASurvey . World Bank staff working paper No 363. Washington D.C. The World Bank.
Page J.M. and Steel F.W.(1984); Small Enterprise Development:Economic issues from African Experience.World Bank Technical Paper No 26. Washington D.C. World Bank.
Pindyck, Roberts and Rubinfeld, Daniel L. (1976); Econometric Models and Economic Forecasts. McGraw-Hill Book Company.
Republic of Kenya: National Development Plan 1989-1993.Government Printers. Nairobi.
Republic of Kenya: Nyeri District Development Plan 1989-1993.Government Printers. Nairobi. ''/
Republic of Kenya: Statistical Abstracts (various issues)C . B*. S .
Republic of Kenya: Economic surveys (various issues) Ministry of Planning and National Development.
Sidney, B.Westly (1978); "The Informal Sector in Kenya" IDS Occasional Paper No 25. UoN.
Sri-Ram Aiyer (1989); "Developing Entrepreneurship in WestAfrica" in Ed. Gerald M. Meir and William F.Steel; Industrial Adjustment in Sub-Saharan Africa. Published for World Bank OUP 1989
90
UNECA (1988) Focus on African Industry: vol 2 No 2 Dec 1988.Waite,David (1973); "The Economic Significance of small firms."
Journal of Industrial Economics vol XXI No 2 April 1973. Basil Blackwell. Oxford, England.
Westphal,Phee and Pussel (1981); Korean Industrial Competence:Where it Came From . World Bank staff working paper No. 469 Washington D.C. World Bank.
William,J.B. (1968); "Entrepreneurship in Economic Theory" American Economic Review vol 58 No 2. Washington D.C.
World Bank (1987); Kenya: Industrial Sector Policies for Investment and Export Growth. Unpublished.
■*/
91
APPENDIX 1
Location Of District
_______ D i s t r i c t B o u n d a r y
• Towns
I TRANS NZOIA
2 E IG E Y O MARAKWET
O B U S IA
4 KA K A M E G A
5UA$IN GISHU
6 K IS IJ M U
7 MYERI
0 K IR IM Y A G A 9 KIAMBJ IONAIROBI
I I M O M B A S A
Source: Myeri District Development Plan, 1 9 8 9 - 9 3
NYERI DISTRICTa d m i n s t r a t i v e b o u n d a r i e s
Greetings.x I am a postgraduate student at 'the university of Nairobi. I am conducting a study on factors that determine the performance of entrepreneurs in Mathira Division. I would like to see the owner of the business. I want to assure you that any information you give is merely for academic purposes and it will be treated confindentially.
CASE NUMBER1.PERSONAL DATA.
1.1 Name of the respondent ......................1.2 Position in the business.
1.21 Business owner.......................1.22 Business operator....................1.23 Other.................................
1.3 Sex.1.31 Female 1.32 Male ^
1.4 Age ..........years.1.5 Marital status.
1.51 married...........1.52 single............
1.6 Can you read and write? Yes...... No......1.7 How much formal education have'had?
1.71 None..............
96
1.72 Some primary school............1.73 Completed primary school..........1.74 Some secondary school ............
x 1.75 Completed form 4 ...... '...........1.7 6 Completed form 6.................
1.8 Location of business (by observation).1.81 Inside town .................1.82 On the roadside..............1.83 In the rural area..............1.84 Other. ........................
1.9 Do you have1.91 postal address? yes. ... no.....1.92 telephone? yes...... no.....
1.10 Type of activities1.101 Woodwork.........1.102 Metalwork........1.103 Leatherwork......1.104 Posho milling.....1.105 Tailoring..........1.106 Other..............
2.0 PERFORMANCE2.1 How much of your product did you sell last week? .....2.2 How much do you normally sell?'....... units at Kshs.
97
Kshs.
2.3 How much did you pay for the raw materials last week? ....Kshs2.4 How much do you normally pay?....... Kshs per week.2V 5 Are there any other costs you i'ncurin producing your product?
yes.........no..........2.6 If yes, which ones?
COSTS TYPE AMOUNT IN KSHS2.61.............. .....................................2.62.............. .....................................2.63 ............. .....................................2.64 ............. .......................................2.65 ............. .......................................
2.7 Approximately how much of your profits go to taxes?. ......................................... Kshs
3.0 JOB TRAINING.3.1 Have you ever had any training to do with your business?
yes.......... no............ /3.2 If yes,where? (if no go to 3.6)
3.21 Village polytechnic.............3.22 Training institute of technology................3.23 Demonstration seminars...............3.24 Other (specify)...................................
3.3 For how long were you trained?............. years
98
3.4 How would you rate your skills as far as your present job isconcerned .
3.5 How was your proficiency tested?3.51 Certificate test..................3.52 Grade test........................3.53 other.................................
3.6 If no , why did you not train?3.61 Lack of fees.......................................3.62 I was an apprentice in a similar job...............3.63 I did not know where to train..............3.64 Other reason...................................
3.7 Have you done any other kind of work other than this business?yes..................... no.....................
3.8 If yes, please describe the work............
3.9 For how long did you do this work? years .4.0 EXPERIENCE.4.1 How old is your business? years.4.2 Did you start this business? yes. no.4.3 If yes , when year
99
4.4 If no, who started it?4.41 Father .........4.42 Mother............
v 4.43 Grandparents...........'4.44 Other..................................
4.5 When did you start operating this particular business?............ year
4.6 For how long have you done this kind of work even outside thisbusiness? ............ years.
5.0 INNOVATIVE ACTIVITIES5.1 Where did you get the design of the product you produce here?
5.11 I designed it..............5.12 Copied from a friend.................5.13 Bought from a designer......................5.14 Other..............
5.2 Have you improved it over the years?yyes............... no........................
5.3 Have you come up with any new products?yes ............ no................
5.4 Have you discovered any new markets since you started producing? yes...... no......5.5 What marketing strategies have you used?
x 5.55 Other....................'......5.6 Have you adopted a new production technique in the recent past
yes........... no..........5.7 If yes, from where?
5.71 I came up with it...................5.72 From a friend who had come up with it........5.73 From an institution .................5.74 Other.................
6.0 BUSINESS MANAGEMENT PRACTICES6.1 Do you keep a written record of your :
"/6.2 Do you employ an accountant in your business?Yes ........ No............
6.3 Have you ever attended any business management course?
7.0 AVAILABILITY OF INPUTS.7.1 What are the main items you produce here?7.2 What inputs do you use in making these products? 7S3 Are they hard to get?
7.1Products
7.2Inputs
7.3Hard to get? yes no
*/
7.4 Are you satisfied with the inputs you use?Yes ...... No.........
7.5 If no, why7.51 Costly to aquire...........7.52 They are of poor quality...........7.53 Due to delays.....................7.54 Lack of inputs when needed..........7.55 Other.................
7.6 Approximately how far do you travelto purchase thematerials? ........ Km
raw
102
7.7 How many times do you purchase your raw materials in a month?7.71 Once............7.72 Twice...........
\ 7.73 When they get finished. '......7.74 Other...........................
7.8 How much does it cost per trip? ......... Kshs7.9 Approximately how much does it cost to aquire your rawmaterials and other inputs per month? ........ Kshs7.10 Apart from transport and the actual costs of raw materials and
other inputs, are there any other costs you incurr?Yes.......... No..............
7.11 If yes, please state them7.111 .........................7.112 ...........................7.113 .............................
7.12 Do you always get your raw materials in time?Yes ......... No............. .
7.13 If no, what causes the delays?7
7.14 What happens in case of shortages?
7.15 What is the quality of the raw materials you get?7.151 Bad...........
103
7.152 Good.7.153 Best..........
7.16 Are they available in the right quantities? x Yes ........ No........'.....
8.0 LABOUR AND CAPITAL8.1 How many regular workers are currently employed in yourbusiness? .................................8.2 Of these how many are
8.21 Paid workers......................\
8.22 Family workers..................8.23 Apprentices .....................
8.3 How much do you pay per day? Kshs...........8.4 Are there any problems you encounter in getting labourers?
Yes......... No..........8.5 If yes, which problems
8.51 Lack of labourers...............8.52 Lack of money to pay wages......................8.53 Other..................
*/8.6 What was the mtial level of capital you started the businesswith? ......... Kshs.
8.7 Approximately how much capital do you have at present?........... Kshs
8.8 How much do you incurr in servicing the capital every month?............ Kshs
8.9 How much do you incurr in repair and maintenance of equipmentevery month? .......... Kshs
104
>
9.0 INFRASTRUCTURE AND INSTITUTIONAL SUPPORT.9.1 What is your opinion of the transport facilities as it affects
your business in this area?N 9.11 Poor..............
3 ......................................................11.4 In your opinion what should be done to improve the performance
of small scale enterprises like yours in this area.
11.5 What is your opinion of the government tax that you pay?1. Should be reduced.....................2. Should be abolished....................3. Oppresive for a small business like mine...............4. We should continue paying..............................5. Other................. */
THANK YOU VERY MUCH FOR SPARING SOME OF YOUR TIME TOASSIST ME.