Page 1
Fachbereich Agrarwirtschaft und Lebensmittelwissenschaften
Fachgebiet Landwirtschaftliche Betriebslehre
Prof. Dr. Clemens Fuchs
Master-Thesis
Determinants of Financial Literacy in Rural Areas of Kazakhstan
von
Sholpan Gaisina
Neubrandenburg
März 2016
URN:nbn:de:gbv:519-thesis 2016-0021-5
Page 2
Sholpan Gaisina – Master thesis
Abstract
Much of financial literacy studies is limited to developed economies, there are few
studies considering financial literacy and financial behavior of people in developing
and transition economies. Financial literacy is a crucial problem in both high-income
and poorer countries. Following experiences of rich countries governments in
emerging and developing economies started to pay more attention to this issue.
A main contribution of this study is to extend the literature on financial literacy in
developing and transition countries in a direction which is not yet widely covered,
namely, the rural population financial literacy. This study studied the relation between
financial literacy of rural population in Kazakhstan and determinants, such as
financial experience, presence of financial institutions in the rural areas, socio-
demographic characteristics.
Since the subsistent majority of rural population in Kazakhstan depends heavily on
income from their small subsidiary households the issue of access to formal financial
services becomes of a significant importance. Along with a number of reasons of
being underbanked, a problem of low financial literacy among rural dwellers is one of
the keenest.
Despite some activities undertaken recently by the Kazakhstani government, rural
people still have very limited access to financial education programs; suffer from the
lack of financial experience due to the insufficient presence of financial institutions in
rural areas; have low level of income which is one of the most important impediments
in having access to financial services.
I
Page 3
Sholpan Gaisina – Master thesis
Table of content
Abstract ....................................................................................................................... I
Table of content.......................................................................................................... II
List of figures ............................................................................................................. III
List of tables .............................................................................................................. IV
Abbreviations.............................................................................................................. V
1 Introduction.............................................................................................................. 1
2 Literature review ...................................................................................................... 3
2.1 Definitions of financial literacy........................................................................... 3
2.2 Determinants of financial literacy ...................................................................... 5
3 Country context ....................................................................................................... 8
4 Financial education in Kazakhstan ........................................................................ 10
5 Development of advising centers in rural areas of Kazakhstan ............................. 14
6 Data source and description of variables............................................................... 18
6.1 Data set........................................................................................................... 18
6.2 Sample description.......................................................................................... 20
7 Methodology .......................................................................................................... 28
7.1 Dependent variable ......................................................................................... 29
7.2 Explanatory variables...................................................................................... 30
8 Empirical Results................................................................................................... 32
8.1 Factors affecting financial literacy level........................................................... 32
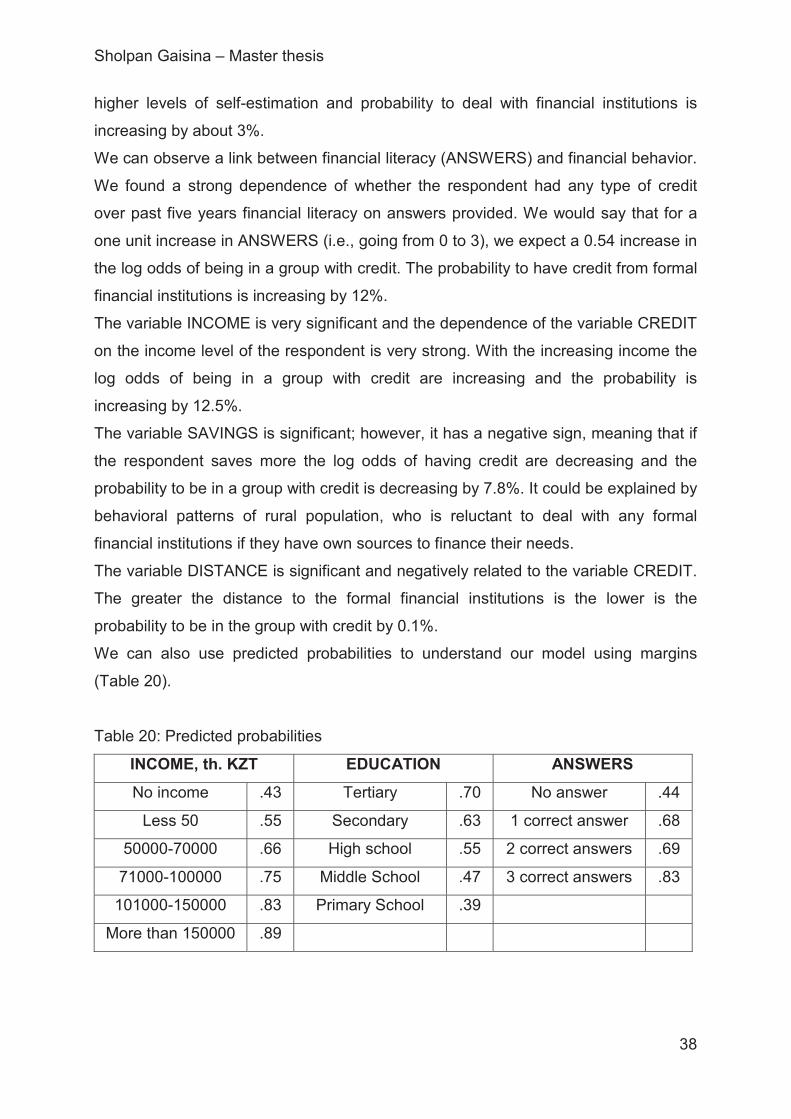
8.2 Factors affecting credit behavior ..................................................................... 37
8.3 Factors affecting saving rates ......................................................................... 39
9 Discussions ........................................................................................................... 43
10 References .......................................................................................................... 47
II
Page 4
Sholpan Gaisina – Master thesis
List of figures
Figure 1: Number of CKD participants by regions .................................................... 14
Figure 2: Structure of teaching methods at Centers for Knowledge
Dissemination, 2011 ................................................................................................. 15
Figure 3: Structure of CKDs participants, 2012 ........................................................ 16
Figure 4: Distribution of the correct answers among respondents............................ 19
Figure 5: Consumer credit in Kazakhstan................................................................. 27
Figure 6: Distribution of respondents according to the level of savings .................... 40
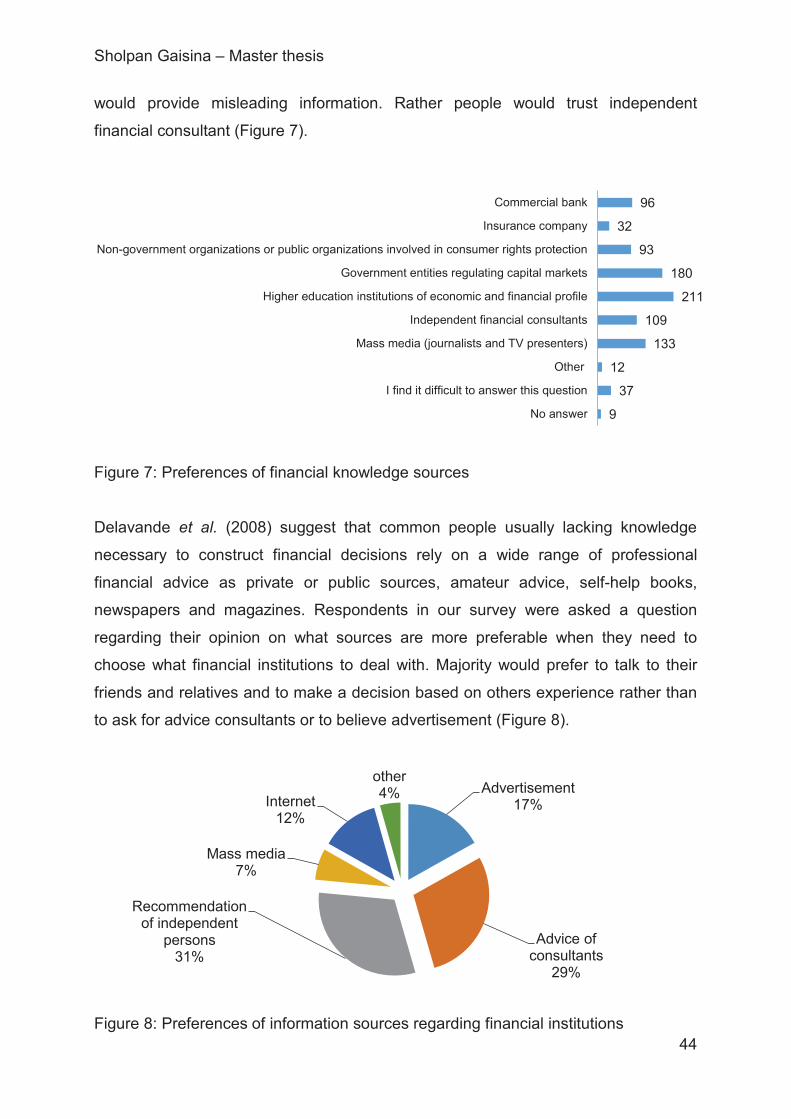
Figure 7: Preferences of financial knowledge sources ............................................. 44
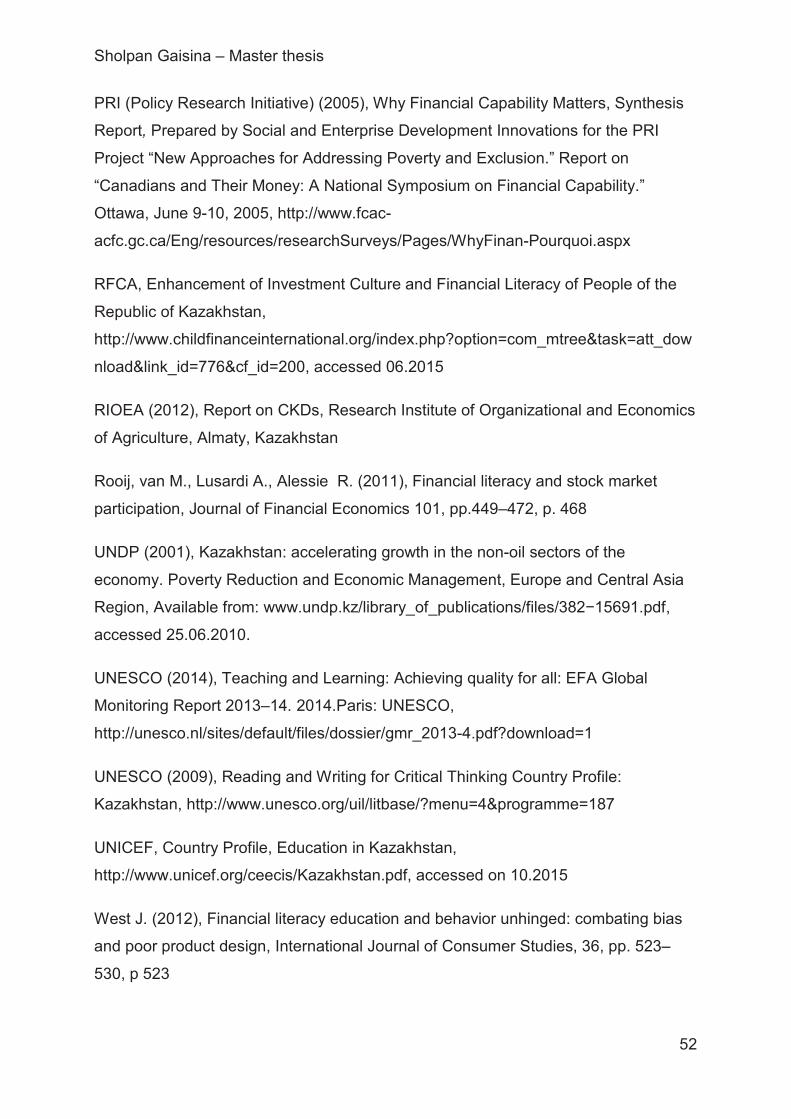
Figure 8: Preferences of information sources regarding financial institutions........... 44
Figure 9: Preference criteria in choosing a financial institution................................. 45
III
Page 5
Sholpan Gaisina – Master thesis
List of tables
Table 1: Stages of institutional formation of consumer protection in financial services
in Kazakhstan ........................................................................................................... 10
Table 2: Results of surveys, in % ............................................................................. 13
Table 3: Self-estimation of financial literacy.............................................................. 21
Table 4: Correlation between objective and subjective literacy level ........................ 21
Table 5: Composition of financial literacy level by gender ........................................ 22
Table 6: Composition of financial literacy level by age groups ................................. 22
Table 7: Composition of financial literacy level by education level ........................... 22
Table 8: Composition of financial literacy level by education level ........................... 23
Table 9: Composition of financial literacy level by education level ........................... 23
Table 10: Composition of sources of financial knowledge by education groups....... 24
Table 11: Composition of sources of financial knowledge by financial literacy
measurement results ................................................................................................ 25
Table 12: Correlation between objective literacy level and financial activity ............. 25
Table 13: Correlation between objective literacy level and financial experience ...... 26
Table 14: Correlation between objective literacy level and number of financial
institutions in the area............................................................................................... 26
Table 15: Ordered probit model results of financial literacy measurement ............... 32
Table 16: Predicted outcomes of correct answers under the variable CREDIT........ 34
Table 17: Predicted outcomes of answers under the variable NUMBERFI .............. 35
Table 18: Predicted outcomes of answers under the variable EMPLOYMENT ........ 36
Table 19: Ordered probit model results of financial behavior towards formal credit . 37
Table 20: Predicted probabilities .............................................................................. 38
Table 21: Ordered probit model results of financial behavior towards savings ......... 40
Table 22: Composition of correct answers on specific questions by gender groups. 43
IV
Page 6
Sholpan Gaisina – Master thesis
Abbreviations
OECD Organization for Economic Co-operation and Development
IMF International Monetary Fund
RFCA Regional Financial Center Almaty
RIOEAReport on CKDs, Research Institute of Organizational and Economics of
Agriculture
CKD Centers for knowledge dissemination
V
Page 7
Sholpan Gaisina – Master thesis
1 Introduction
Financial literacy problem has received rising interest over the past two decades in
both high-income countries and poorer parts of the world (Holzmann, 2010).
Following experiences of rich countries in the development of national financial
literacy policies, governments in emerging and developing economies started their
activities in this area. Much of financial literacy study is limited to developed
economies, there are few studies considering financial literacy and financial behavior
of people from developing and transition economies.
Financial education is beginning to be interested and cared in Kazakhstani society as
a whole. The necessity and importance to be financial literate for Kazakhstani people
have increased significantly due to a number of reasons, among them are those
which were formulated by the Organization for Economic Co-operation and
Development (OECD). OECD emphasizes the emergence of new more complicated
financial products in modern financial markets, significantly increased quantity of
financial products, and specific knowledge required in finance are most important
barriers of making effective decisions making (OECD, 2005), as well as the financial
market being more globalized became increasingly risky for financial decisions
(Lusardi et al., 2011).
Some governmental initiatives in the area of financial education have been launched
recently in Kazakhstan. They include creating a national fund supporting the
promotion of financial education among citizens, funding specifically designed
educational programs for both urban and rural population, and supporting non-
government organizations working in this area. All these activities started very
recently and are on their first stage. Currently in Kazakhstan, a variety of financial
educational programs are offered and different educational materials are available in
many forms. However, most of those programs and material are designed without
considering needs of specific groups of Kazakhstani population.
In Kazakhstan according to the World Bank data, in 2014 some 8.1 million or about
46.7% of the population lived in rural areas and a significant part of the rural
population is officially employed in the agricultural sector, about 36.4% (World Bank,
2015). At the same time agriculture production is a main source of income for the
majority of rural population, for more than 6.5 million rural dwellers. There is a
1
Page 8
Sholpan Gaisina – Master thesis
substantial population of rural unemployed and rural poor whose economic prospects
depend heavily on a reversal in the fortunes of the sector.
Rural households, semi-commercial agricultural entities not legally registered,
produce a large part of agricultural products for the domestic market in Kazakhstan.
Vegetables and fruits (about 80%), meat and dairy production (about 90%) are
dominated by rural households. However, as legally unregistered physical persons,
rural households are excluded from all state supported programs and preferential
state credit lines. On the other hand, the unregistered rural households in many
cases are large enough to be considered as family farms, but they are not motivated
to register and change their status. Nevertheless, these agricultural entities need to
have access to formal financial services to be able to maintain their wellbeing as well
as to increase their productivity and quality. However, as in many other developing
and transition economies, rural population find themselves excluded or dissuaded
from the formal financial sector (Nguyen, 2007).
It is well known that different types of customers have different levels of access to
certain types of financial services and certain types of financial institutions (Hoff et al.,
1990). The problem of limited access to formal financial services by the rural
population is crucial for most developing and transition economies. On the one hand,
formal financial institutions in these economies tend to restrict access to their
products for marginal clientele (in most cases small-scale farmers) (Gonzalez-Vega,
1982). On the other hand, rural population, possessing a low level of basic financial
literacy, is generally unable to demand financial services to suit their needs, or to
take proper advantage of those services that already exist (GIZ, 2014). It is obvious
that people with low financial literacy are more likely to face financial problems
(Lusardi et al., 2010)
A main contribution of this study is to extend the literature on financial literacy in
developing and transition countries in a direction which is not yet widely covered,
namely, the rural population financial literacy. This study studied the relation between
a level of financial literacy of rural population in Kazakhstan and a number of
determinants, such as financial experience, presence of financial institutions in the
rural areas, socio-demographic characteristics.
2
Page 9
Sholpan Gaisina – Master thesis
2 Literature review
2.1 Definitions of financial literacy
Financial markets become more sophisticated consisting of a range of new types of
entities as on-line banks and brokerage firms and constantly offering new financial
products and instruments (OECD, 2005). People must be prepared to make well-
informed financial decision in an increasingly risky and globalized marketplace; it is
true for both developed economies and emerging economies (Lusardi et al., 2011).
Even in developed countries the level of financial literacy of population is reported as
poor and not corresponding to innovative financial products emerging worldwide; a
lack of basic economic and financial knowledge is an important impediment in
effective financial decision-making (Gaurav et al., 2012). Conclusions based on
financial literacy surveys in OECD countries show that understanding financial issues
among people is low, in particular among specific groups, such as less educated and
having low levels of income (OECD, 2006).
Xiao considers financial behavior as human behavior related to money management
which includes budgeting, spending, borrowing, saving and investing, and risk
managing (Xiao, 2008). Individuals who are more financially literal tend to make
fewer mistakes in financial decisions and as a result are in better financial conditions
(Meier et al., 2008).
Hira (2012) believes that financial behavior should be aimed to achieve financial
sustainability when personal and household resources are managed in a manner that
ensures sufficient funds to meet personal financial obligations including dealing with
formal financial institutions and making decisions regarding savings. The financial
behavior is affected by both external and internal factors. Among external factors the
author considers those over which people do not have any direct control, as for the
internal factors, most people have some control over them. Among internal factors
one can consider education, financial skills, income level, and a family size.
There are different definitions of financial literacy presented in literature. According to
Orton (2007) financial literacy is the ability to understand and distinguish financial
options, feel comfortable talking on personal finance topics, make decisions
protecting against future insecurities as well as be prepared to solve every day
financial problems effectively. PRI (2005) considers financial literacy as a concept
3
Page 10
Sholpan Gaisina – Master thesis
that “emphasizes objective knowledge on specific topics related to money,
economics, or financial matters, and subjective measures of self-reported
confidence”. Financial literacy could be also defined as an ability of a person to
understand and process information to be able to make a proper financial decision
(Gaurav et al., 2012). Financial literacy is very often associated with knowledge on
saving and borrowing, which means in turn possessing sound financial management
skills and habits (Hogarth et al., 2002).
When talking about financial literacy, one should keep in mind that it is not about just
individual retirement security, but indeed about the stability of the global financial
system (Lusardi et al., 2011). The financial decisions could range from simple
everyday spending to making choices regarding banking products, investments, and
saving ways (PRI, 2005). It is believed that financial literacy affects financial security,
well-being, and prosperity of people (PRI, 2005). Financial literacy could be
considered from two points of view, the first one is related to the financial knowledge
which includes such things as understanding the concept of interest rate, inflation
rate, different types of loans etc.; the second point related to a confidence component
such as self-estimated level of financial knowledge and self-reported abilities to make
effective financial decisions (PRI, 2004).
There exist very few studies investigating financial literacy and factors affecting the
level of financial literacy in rural areas of transition economies. Most researches are
aimed at the national level without focusing on rural population. Many studies show
that household’s financial behavior is determined significantly by financial literacy
(Lusardi et al., 2013). At the same time being more financially experienced can be a
source of getting financial knowledge and improving financial literacy. Those who
report keeping day-to-day management over their finance and being involved in
some formal financial operations such as formal credit or a deposit account indicate
that this experience is the most important source of financial knowledge (Monticone
et al., 2010).
Even people with limited resources, in particular from rural areas, who would never
afford to have a mortgage or own a big amount of money, need to be able to perform
some financial calculations because their incomes are highly vulnerable and difficult
to be predicted. Such low-income population needs to be financial literate to be able
to make decisions without the expertise of paid consultants (Willis, 2008).
4
Page 11
Sholpan Gaisina – Master thesis
It is generally assumed that financial literacy could change people’s behavior towards
financial services and products, however, as West emphasizes financial literacy does
not provide sustained changes in and optimal of financial behavior (West, 2012).
According to Hogarth (2006) financial education is considered differently by different
people. Some people would esteem themselves as financial educated if they
possess quite broad range of financial knowledge as understanding complicated
macroeconomic issues and their effect of everyday household financial decisions. At
the same time others would focus exclusively on basic routine money management.
However, apparently financial education covers both macro and narrow ranged
topics.
Financially literate people according to Bhushan and Medury (2013) are “… able to
sail through tough financial times” because financial literacy is directly correlated with
positive financial behavior.
2.2 Determinants of financial literacy
Klapper, Lusardi, and Panos (2013) surveyed 160 individuals from seven federal
regions in Russia in 2008 and 2009. A questionnaire included four financial literacy
questions covering interest rate, interest compounding, inflation, and sales discount.
The questionnaire was similar to ones used in studies investigating financial literacy
in the USA and Great Britain. Their findings indicate a significantly positive effect of
financial literacy on the probability of the respondents to have a bank account and to
have formal credit. At the same time financial literacy is negatively correlated to
getting credit from informal sources. This study shows that respondents with higher
financial literacy are more resistant to income shocks and have higher spending
capacity levels.
Rooij et al. (2011) used data from the 2005 De Nederlandsche Bank’s Household
Survey (DHS) containing over 2,000 households. Their questionnaire included two
sets of questions aimed to assess financial literacy of the respondents. The first set
was designed to estimate basic financial literacy and the second one had a goal to
assess more advanced financial knowledge. The results show that lack of literacy
prevents households from participating in the stock market.
Meier and Sprenger (2008) showed that financial knowledge is positively related to
the income level. Monticone (2010) studied 3,992 households using data of a survey
5
Page 12
Sholpan Gaisina – Master thesis
conducted by the Bank of Italy in 2006. The respondents were given questions
regarding financial literacy; results of the analysis indicate that financially wealthy
respondents and those having greater education show higher levels of financial
literacy. In general, the study concluded that the Italian population’s average financial
literacy is quite low compared with the United States and other European countries.
Willis (2008) claims that people’s financial literacy self-assessments measure the
confidence, and apparently overconfidence; however do not provide a robust
measure of actual financial literacy. She says that those individuals who believe in
the effectiveness of their own financial decision making must be able to prove it by
making decisions at hand. Mistaken financial decisions could happen due to both
overconfidence and underconfidence, when people either do not ask for help or to
shy away from engaging in the information search literacy (Willis, 2008). OECD
(2005) reports that respondents in the United States, the United Kingdom, and
Australia often feel that they possess enough financial knowledge than is actually the
case.
According to Lusardi and Mitchell (2011) there is a significant difference in the level
of financial literacy between male and female respondents as well as between
younger/older and middle-aged ones. They showed that respondents with higher
level of education are more financially knowledgeable. Monticone (2010) showed that
there is some evidence of an inverse U-shaped age profile of financial knowledge,
when middle-aged respondents reported higher scores than younger and older
counterparts and also positively related financial experience and the level of financial
literacy; she reports that the respondents consider financial experience as their most
important source of financial knowledge (Monticone, 2010).
Availability of financial services is determined by the availability of financial
institutions in the area. Berry says that the scarcity of bank branches in low-income
and minority neighborhoods prevent some households from being allowed to have an
account (Berry, 2004) and as a result become less financially experience and
knowledgeable. Such so-called “under-banked” or “under-served” people who are
little engaged in the conventional banking system, whose access to information on
even basic financial goods and services is limited (Orton, 2007) have potentially little
financial experience and consequently are less financially educated. Studies show
that in Russia financially literal people are more likely to borrow from formal banking
rather than from informal financial institutions. The authors worn that the rapid growth
6
Page 13
Sholpan Gaisina – Master thesis
of consumer loans in Russia over past several years combined with low financial
literacy of population could lead to the dangerous consequence (Klapper et al.,
2013).
Hogarth et al. (2005) using data from Survey of Consumer Finances for a number of
years conclude that the households’ ability to manage and understand financial
products is an impediment to having bank accounts (Hogarth et al., 2005). They also
indicated that those who lack knowledge regarding the use of specific devices such
as ATMs, personal computers, and mobile phones for banking transactions would
prefer likely informal financial institutions over formal ones (Hogarth et al., 2005).
Studies show that financial literacy is affected by financial behavior and financial
experience emphasizing that the latter can be a source of learning (Monticone,
2010). Monticone also refers to the Michigan Survey of Consumers in 2001
describing a positive influence of personal financial experience on financial
knowledge of respondents, as well as she refers to the study of credit literacy of
Lyons, Rachlis, and Scherpf (Lyons et al., 2007), who found that reported financial
experience had a positive effect on knowledge about credit reports.
Lusardi et al. (2010), using the National Longitudinal Survey of Youth fielded in 2007-
2008, analyzed relationship among financial literacy and a set of socio-demographic
factors, family and peer characteristics. They found that female respondents are less
likely to give correct answers, to the identical results Lusardi and Tufano (2009)
came, studying 1000 respondents in the USA (the survey was fielded by the staff of
Taylor Nelson Sofres Global). This research reports that there is a significant
difference between male and female debt literacy levels. For all the questions in
survey related to financial literacy women gave less correct answers than their male
counterparts (Lusardi et al., 2009).
Christelis et al. (2010) found that individuals with higher education are more
financially sophisticated, as well as the financially wealth respondents are more likely
to become stockholders (Christelis et al., 2010). According to Hogarth (2006) more
educated people could create so-called “economic ripples” making better financial
decision not only for themselves but also for their families (Hogarth, 2006). Calvet et
al (2009) used the Swedish panel covering four years (1999-2002) to investigate
three types of investment mistakes; according to the results respondents with higher
education make smaller investment mistakes (Calvet et al., 2009).
7
Page 14
Sholpan Gaisina – Master thesis
3 Country context
Kazakhstan belongs to a group of upper-middle-income economies with per capita
GDP of about US$ 13000 and with a GDP growth rate of 6% in 2013 which
decreased to 3.9% in 2014 due to recent changes in the world oil market and
economic sanctions in Russia. Poverty in Kazakhstan was estimated to be about 3%
in 2013, as measured by the national poverty line, and about 4% in 2009, as
measured by the PPP approach US$2.5 per capita per day (World Bank, 2015).
Currently agriculture is no longer a leading contributor to the Kazakhstani economy.
Agricultural sector accounts for about 5% of GDP (Ministry of national economy of
the republic of Kazakhstan committee on statistics). The agricultural sector of
Kazakhstan experienced a steep decline in the period since the collapse of the
former Soviet Union. Various agrarian reforms caused a dramatic production
recession in the middle of the 1990s, while further reforms at the beginning of the
2000s became factors of growth. The most important reforms, which have affected
agricultural development, are price liberalization, reorganization of state corporate
farms, mass privatization, and land reforms.
In Soviet times, agriculture in Kazakhstan used to be a sector which received
particular state support. The state provided agricultural producers with fuel, elite
seeds and fertilizers at prices much lower than world market prices. This situation
which was based on absolute state support and artificially set prices and interest
rates has certainly changed during the transition to a market economy.
In 2010 about 2% of rural settlements in Kazakhstan were not provided with electric
power, because of remoteness and low technical conditions, over 11% of settlements
have no automobile communications. The great bulk of agricultural population lives
with limited access to information or in total isolation, 37% of all settlements are not
provided with telecommunication. More than 57% of rural settlements use drink water
from decentralized sources where the quality of water is often not appropriate to
normative parameters. At the lowest level are qualified health services, medicinal
drugs provision, and education. In 2010 medical institutions provided only 83.6% of
rural settlements and only 76.5% of rural settlements had schools. The maintenance
of the agricultural population with communal services lags behind cities: supply with
gas is 25 m3 per capita per month, whereas in cities it is 116.2 m3; daily average
supply with water accordingly 83 and 239 liters (OECD, 2013). Rural poverty dropped
8
Page 15
Sholpan Gaisina – Master thesis
from 59% to 6% for the same period, while urban poverty fell from 36% to 2% (IMF,
2014)
According to official statistics in the mid-1990s each fifth able-bodied agricultural
worker was unemployed, in 2013 the rural unemployed population accounted for
about 42% of total unemployed population in Kazakhstan (the total unemployment
rate in 2013 was 5.2%, in agriculture it was about 21%). Official rural labor statistics
in Kazakhstan is not reliable due to ambiguous treatment of self-employment: a
substantial portion of the rural labor force is recorded as self-employed (IMF, 2014).
Underemployment in agriculture, which was called by statistical agencies as “self-
employment”, reached at that period a rate of close to 70% in rural areas and over
60% in agriculture (Rukowski, 2011). Additionally, low wages in agriculture mean that
being employed does not necessarily protect from poverty. Rural poverty is almost
three times as high as urban, 5% and 1.3% respectively in 2013 (IMF, 2014).
The literacy rate in Kazakhstan is among highest in the world accounting for about
99.8% in 2009 (UNESCO, 2009). According to the Education for All (EFA) 2013-14
Global Monitoring Report, Kazakhstan’ policies in education are aimed at further
strengthening of formal education (UNESCO, 2014). Access to primary and
secondary education is very high and accounts for 91% of net enrolment rate with the
net attendance ration of 98% (UNICEF, 2015).
9
Page 16
Sholpan Gaisina – Master thesis
4 Financial education in Kazakhstan
Financial education is beginning to be interested and cared by the Kazakhstani
government and Kazakhstani society as a whole. The National Bank of Kazakhstan
starting in 2001 paid attention to the protection of financial services consumers’
rights. A special department established in 2001 has been several times reorganized,
nevertheless keeping its leading role as last resort for protection rights of financial
services consumers in Kazakhstan (Table 1).
Table 1: Stages of institutional formation of consumer protection in financial services
in Kazakhstan
Year State institutionsNon-state
institutions
2001-2004National Bank of Kazakhstan. The department of
financial services surveillance/ The department of
consumer protection in financial services.
No
2004-2011
The Agency of the Republic of Kazakhstan on
financial market and financial organizations
regulation and surveillance.
The department of financial services surveillance/
The department of consumer protection in financial
services.
Insurance
ombudsman
2011-2012The Committee on financial organizations control
and surveillance. The department of consumer
protection in financial services.
Insurance
ombudsman
Bank
ombudsman
29.12.2012The Committee on consumer protection in financial
services.
Insurance
ombudsman
Bank
ombudsman
Source: Chusnutdinova, 2013
In 2011, as a stage of the reforming process in this area and according to the decree
of the President of the Republic of Kazakhstan of December 29, 2012 No. 458 "On 10
Page 17
Sholpan Gaisina – Master thesis
some questions of National Bank of the Republic of Kazakhstan" the Committee on
protection of the rights of financial services’ consumers under the National Bank of
the Republic of Kazakhstan was created. The Committee was designed to secure
proper protection of the rights and interests of financial services consumers and
services of micro-financial entities (Presidential Decree, 2013).
Among other tasks, the Committee is responsible for the development of specific
instruments aimed to improve financial education of Kazakhstani citizens. These
instruments include such activities as carrying out explanatory work by means of
mass media resources, the Committee’s website, holding trainings and meetings with
financial services’ consumers. The Committee publishes articles in the central
republican newspapers, mainly on topics related to collateralized real estate court
sale procedure, mortgage lending, mandatory insurance, consumers and financial
services investors’ protection. Also the Committee representatives are interviewed by
the central republican TV Company on such topics as:
a. Fines and penalties for failure to comply with terms and conditions of a bank
loan agreement (overdue liabilities) and the restriction of interest;
b. Banking commissions under a bank loan agreement;
c. Out of court sale of the collateralized property;
d. Getting pensions and state benefits by plastic cards;
e. How to choose a pension fund?
The Committee’s web-site, www.fingramota.kz (finliteracy), is an informational-
educational web-site, which provides basic knowledge for using financial instruments,
managing personal savings, evaluating risks. The web-site includes such subsections
as “Fundamentals of financial literacy”, “Financial glossary”, “What a customer should
know?”, the information is placed on three languages Kazakh and Russian
(Committee for the Control and Supervision, 2013).
In 2008 “Informational and educational centers” (Centers) for population began to
operate in all regions and cities Astana, Almaty and Semei. Centers provide free of
charge seminars and consulting for population and have covered more than 360,000
people from all over the country, 2.7% of adult population (RFCA, 2015). Additionally,
in 2009, a TV training talk show “Vash vykhod” (Your solution) was launched on a
weekly basis. The Program touches such issues as banking, pension, insurance, and
11
Page 18
Sholpan Gaisina – Master thesis
securities market. Participants of the talk show are people with real stories, experts,
and analysts.
A number of surveys on the national level aimed at measuring financial literacy of
Kazakhstani population were conducted. According to the RFCA (Regional Financial
Center Almaty), survey about 40% of respondents never had any experience dealing
with financial instruments and only 8% reported to have a deposit account in the
bank.
In 2013 the non-governmental fund “International Centre of Economic Literacy”
(ICEL), the first non-governmental organization in Kazakhstan in the sphere of
financial literacy, was founded. The main goal of this NGO is to improve financial
literacy of Kazakhstani people taking into account particularities of social-economic
development of the country as well as to protect rights of consumers of financial
services using mass media means. One of its first projects ICEL was a large-scale
research on the level of financial literacy of Kazakhstan’s population in early 2014.
According to the data based on a survey conducted in all 14 regions of Kazakhstan
as well as in Almaty and Astana cities, around 44% of the Kazakh population prefers
to keep their savings at home; around 38% of respondents do not keep record of
family budget while 43% of the respondents were not aware of deposit insurance
mechanisms. Only 6% of respondents were aware of the maximum value of the
deposits insured and 63% admitted that they usually ran out of money before next
salary payments (Interfax-Kazakhstan, 2015). The results of the survey says that
about 44% indicated their financial literacy level as satisfying to be able to make
decisions related to formal financial services. However, according to the data 67% of
respondents believes that they would not face any punishments if they would fail to
meet the legal obligations of a formal loan and 50% indicated that they do not plan to
pay their loans back (Nuraichan, 2014). The available data on Kazakhstani
population financial literacy and own data based on the survey in Pavlodar region
undertaken in 2014 are summarized in Table 2.
12
Page 19
Sholpan Gaisina – Master thesis
Table 2: Results of surveys, in %
RFCA
survey
ICEL
survey
Pavlodar
region,
rural areas,
own survey
Used any type of financial services 62.5 72
Used any type of formal loans 32 65
Used consumer loans 52
Have a deposit account 8.5 8 3
Keep savings at home 44 21
Save exclusively in livestock 37
Do not keep records on family budget 55 38 37
Self-estimation of financial literacy as
high44 69
Sources of financial knowledge
TV programs 36.9 8
Internet resources 24.3 15
Newspapers 20
Consultancy 23 27
Special training and workshops 17.1 23
Sources: RFCA, NFDFS, Own calculations
In November 2014 the National Fund for the Development of Financial Services
(NFDFS) in Kazakhstan has been founded. The goals of the NFDFS are to help
financial services consumers to realization their rights and legal interests, “… to
monitor quality of services provided by banks and financial organizations, to study
financial services market and to explain legislation related to financial services”
(inform.kz, 2015).
13
Page 20
Sholpan Gaisina – Master thesis
5 Development of advising centers in rural areas of Kazakhstan
According to the National Plan on Realization of "Strategy of Kazakhstan-2050", as a
task of top priority the improvement of knowledge and professional skills of
Kazakhstani people was indicated. This issue is particularly important for rural areas.
The government undertook a number of measures to create an information and
advisory system in rural areas (Agribusiness 2020, 2012).
Since 2009, JSC "Kazagroinnovation” (KAI), entirely state-owned company, aiming to
implement modern achievements in agricultural sector and distribute highly effective
technologies, started a project designed to create a system of knowledge distribution
and transfer. A model called "Extension”, used widely in the USA and other
developed countries, has been used as an example. According to this model,
advising centers initially supported by the state subsequently should become either
entirely or partly independent. Within this pilot project a network of “Centers for
knowledge dissemination” (CKDs) was created. CKDs are attached to research
institutes in each region. The CKDs along educational goals are aimed to be involved
into assessment of specific needs of rural people in order to improve understanding
of rural population demand for extension/training/advisory service (Fileccia et al.,
2010). Currently there are eight centers (RIOEA, 2012) in such regions as Akmola,
Almaty, Kostanay, Southern Kazakhstan, Karaganda and Eastern Kazakhstan
(Figure 1).
Figure 1: Number of CKD participants by regions
Source: RIOEA, 2012
406
80127
5 25 5 84
317
94153
22 1 7 15
252
17
125
5 250
50100150200250300350400450
2009 2010 2011
14
Page 21
Sholpan Gaisina – Master thesis
CKDs conduct training (up to 5 days) on the premises either of research institutes,
agricultural enterprises or using own infrastructure. Major activities of CKDs include:
a. Research based training;
b. Practical instructions;
c. Improvement of existing knowledge;
d. Scientific conferences and workshops.
During 2009 more than 1700 persons engaged in agricultural production were trained
at the CKDs. The major source of funding is a national budget. There are a number
of problems the CKDs faced:
a. Lack of sufficient equipment and teaching technologies for conducting
trainings;
b. Lack of well-developed manuals and training materials;
c. The content of trainings does not always meet the needs of trainees;
d. Underdeveloped monitoring system;
e. Low interest from agricultural producers and their passiveness (Yespolov et
al., 2012).
Scientific and practical seminars include three components (RIOEA, 2012):
theoretical part, practical part, and demonstration of practical experience (Figure 2).
The topics meet the major needs of agricultural producers and are formulated taking
into account results of special analytical researches.
Figure 2: Structure of teaching methods at Centers for Knowledge Dissemination,
2011
Source: RIOEA, 2012
theoretical49%
practical27%
demonstration24%
15
Page 22
Sholpan Gaisina – Master thesis
During three years since CKDs were created, 259 workshops for agricultural
producers were held. International lecturers/experts from Canada, Germany,
Australia, Syria, and Russia were invited for 25 seminars to teach participants and
promote new ideas. Along with on place trainings, distance consultations via Internet
and call centers started in July, 2010 in eight agricultural research institutes. Since
the beginning of call-centers activity over 2700 phone consultations were made, while
direct consultations are carried out on the basis of applications from agricultural
producers. Direct consultations include individual and group consultations. The
service of the CKD is purposed mainly on farmers and farm staff (RIOEA, 2012),
however, the participation is not limited by agricultural producers, civilian officers from
rural districts and subsidiary small households are also provided with services by
CKDs (Figure 3).
Figure 3: Structure of CKDs participants, 2012
Source: RIOEA, 2012
CKDs consist of three main branches:
a. Administrative
b. Educational
c. Supporting
Administrative staff is responsible for organizing workshops, inviting lecturers,
attracting participants. Educational branch is represented by lecturers, who are
responsible for preparing study programs, handouts, and manuals.
Farmers51%
Farm staff18%
Local authority19%
others12%
16
Page 23
Sholpan Gaisina – Master thesis
The number of consultants annually increases, in 2011, twelve research institutes
and 18 consultants worked in the project. For comparison, in 2010 four institutes and
seven consultants were involved into this activity.
Along with the internal efforts to develop a network of CKDs, there is also an external
support in this activity. "The International German agrarian center", which started
functioning in Kazakhstan in 2011, has as a main goal promoting advanced
European agricultural technologies and equipment in Kazakhstan. The center along
with the main goal attracts attention of foreign companies operating in agriculture to
Kazakhstani "Extension system". The center conducts various trainings for farmers
and demonstrates German agricultural machinery and technologies.
One more state owned company, JSC “Fund of financial support of agriculture”
among other activities undertakes efforts to increase financial literacy of rural
population in Kazakhstan. Through micro-credit organizations created in rural areas
about 100,000 rural people were trained in 2008-2009.
Despite state programs aimed to improve the situation with access to knowledge by
rural people in agriculture of Kazakhstan, a large number of small agricultural
producers, in particular rural households are still underserved, in particular as for
getting financial knowledge. Moreover, the current banking system is not favorable to
a large majority of rural population, specifically to those whose income comes
exclusively from rural households. The lack of basic knowledge in financial area
makes access to formal financial services and financial instruments significantly
difficult. At the same time, better financial literacy of consumers will definitely improve
the performance of financial services providers who “… have a responsibility to
understand their market, and respond with a range of appropriate and affordable
services” (Cohen, 2011).
17
Page 24
Sholpan Gaisina – Master thesis
6 Data source and description of variables
Since the subsistent majority of rural population in Kazakhstan depends heavily on
income from their small subsidiary households, which are mainly producing for
commercial purposes, the issue of access to formal financial services becomes of a
significant importance. Along with a number of reasons of being underbanked, a
problem of low financial literacy among rural dwellers is one of the keenest.
A main objective of our study is to determine and measure factors which affect the
financial literacy level of rural households in Kazakhstan.
6.1 Data set
The sample consists of rural people and therefore it is of particular interest for the
research questions concerning financial literacy, because rural people in Kazakhstan
are in a very vulnerable financial position.
To measure basic financial literacy the questions adopted from the “Supplementary
Questions: Optional Survey Questions for the OECD INFE Financial Literacy Core
Questionnaire” (OECD, 2012) were used. In the questionnaire three questions were
included:
1. Suppose you had USD 100 in a savings account and the interest rate was 2%
per year. After 5 years, how much do you think you would have in the account
if you left the money to grow?
a. More than USD 102
b. Exactly USD 102
c. Less than USD 102
d. no answer
2. Imagine that the interest rate on your savings account was 1% per year and
inflation was 2% per year. After 1 year, how much would you be able to buy
with the money in this account?
a. More than today
b. Exactly the same
c. Less than today
d. no answer
18
Page 25
Sholpan Gaisina – Master thesis
3. A 15-year mortgage typically requires higher monthly payments than a 30-year
mortgage, but the total interest paid over the life of the loan will be less.
a. True
b. False
c. no answer
Those who were not able to give an answer or gave the wrong ones account for 20%
of asked individuals, only 64% demonstrated an understanding of interest rate
concept and only 12% can answer a simple question about inflation. Those who
could give a correct answer on a question regarding mortgage account for 46%. In
general, respondents with one, two, or three correct answers account
correspondently for 42%, 34%, and 4% (Figure 4).
Figure 4: Distribution of the correct answers among respondents
We investigated what and to what extent factors characterizing financial experience,
education, socio-demographic status, and the representativeness of financial
institutions determine the level of financial literacy of respondents. The study is based
on a static model with cross-sectional data for a specific year (2014).
The study uses data from rural areas of Kazakhstan. The study took place in
Pavlodar region of Kazakhstan in spring 2014. Based on the survey we were able to
acquire information for 405 individuals living in villages of four rural districts located in
different distances from the city. The surveys collected information on individual
050
100
150
200
frequ
ency
0 1 2 3
19
Page 26
Sholpan Gaisina – Master thesis
levels of financial literacy (knowledge of interest rate, understanding of inflation, and
understanding of mortgage), as well as information on financial services (the use of
bank accounts and formal credit). The information covers such areas as: whether the
respondent has any experience dealing with formal financial institutions, a measure
of the objective and subjective financial literacy, their income situation. The dataset
provides information on respondents’ socio-demographic characteristics and their
opinion regarding financial education. This survey has questions concerning whether
the individual has got a loan from a formal financial institution for last five years,
information on keeping records of the family budget, as well as a question on the
respondents’ opinion what should be the primary attention when someone compares
the banks in order to choose to take credit from or to make deposit in.
6.2 Sample description
The percentage of female respondents is 52.3%; it corresponds to the national level
of 51.85% in 2013. The average age in the sample is around 40. Households with 3-
4 family members make up 45% and with more than four members is 26.7%. The
percentage of formally employed respondents is around 61%, self-employed
respondents make up about 6.7%, while others including retirees, students and
housewives make up about 30% of all the respondents.
The literacy level of respondents is high enough, 42.96 % have tertiary education and
45.2% have secondary education. According to the World Bank statistics, in
Kazakhstan a secondary education enrollment rate in 2012 was 97.1%, while the
tertiary enrollment rate was 44.53%.
Among respondents with secondary and tertiary education majority of respondents is
formally employed, 56.3% and 71.8% respectively. However, among those who
indicated their status as unemployed the respondents with secondary education
make up the biggest share of 54.6%.
The respondents were asked to provide self-measurements of their financial
knowledge. Most respondents assessed their financial knowledge being above
average: 32.84% of respondents stated their level is 3; 25.93% that their level is 4
and 10.86% that their level is 5. At the same time, only 6.67% reported they do not
have any knowledge in finance. Most importantly, there is no strong correlation
between objective and subjective literacy (Table 3).
20
Page 27
Sholpan Gaisina – Master thesis
Table 3: Self-estimation of financial literacy
FINLITSELF Frequency Percent Cumumulative
0 27 6.67 6.67
1 37 9.14 15.8
2 59 14.57 30.37
3 133 32.84 63.21
4 105 25.93 89.14
On average, 63.95% of respondents correctly answered the question on interest rate;
12.1% correctly answered the question on inflation; and 46.4% correctly answered
the question on mortgage payments. However, 20% of respondents were not able to
provide correct answers.
We can rank respondents who provide correct answers to at least two financial
literacy questions as the ‘‘high’’ financial literacy respondents, a fraction of such
respondents is 34.1%. It was expected that the fraction of those who gave correct
answers to all three questions is small enough, in our survey it is 4.2% of all the
respondents.
We can observe the moderate relationship between measures of financial literacy
and a subjective measure of financial knowledge (Table 4).
Table 4: Correlation between objective and subjective literacy level
ANSWERS FINLITSELF
ANSWERS 1.0000
FINLITSELF 0.1535 1.0000
Financially literate respondents are more likely to be female, out of those who
provided correct answers on two questions 38.51% are female and 29.53% are male
(Table 5).
21
Page 28
Sholpan Gaisina – Master thesis
Table 5: Composition of financial literacy level by gender
No answerOne correct
answer
Two correct
answers
Three correct
answers
female 17.92 39.15 38.21 4.72
male 22.28 44.56 29.53 3.63
The most financially literate respondents’ age is between 25 and 54 years old (Table
6).
Table 6: Composition of financial literacy level by age groups
No answerOne correct
answer
Two correct
answers
Three correct
answers
16-24 12.35 9.47 7.25 23.53
25-34 14.81 22.49 26.09 17.65
35-44 22.22 33.14 34.78 17.65
45-54 22.22 21.89 26.09 23.53
55-64 23.46 10.65 2.9 17.65
65+ 4.94 2.37 2.9 0
Financially literate respondents are more likely to have secondary/technical
education or tertiary education, respectively, 45.65% and 46.38 of those who gave
correct answers on two questions (Table 7).
Table 7: Composition of financial literacy level by education level
Education No answerOne correct
answer
Two correct
answers
Three correct
answers
Tertiary 39.51 41.42 46.38 47.06
Post secondary/
technical School43.21 45.56 45.65 47.06
22
Page 29
Sholpan Gaisina – Master thesis
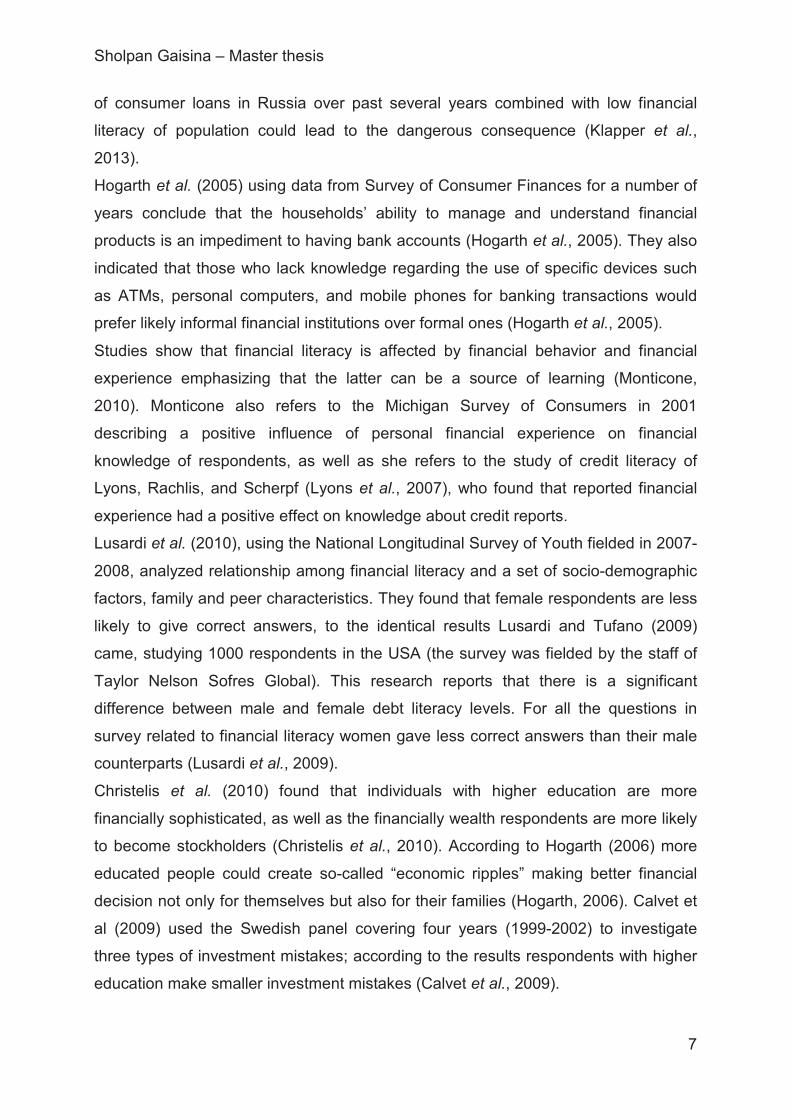
Table 7: Composition of financial literacy level by education level (continuous)
High School 14.81 9.47 7.25 5.88
Middle School 2.47 2.37 0.72 0
Primary School 0 1.18 0 0
Those, whom we consider as the ‘‘high’’ financial literacy respondents, belong to a
formally employed group. However, the percentage points of those who are self-
employed and answered with high scores are also high enough and amount for
33.33% (Table 8).
Table 8: Composition of financial literacy level by education level
No answerOne correct
answer
Two correct
answers
Three correct
answers
Formally
employed14.17 39.27 42.11 4.45
Self employed 18.52 44.44 33.33 3.7
Unemployed 27.27 54.55 18.18 0
Others (retirees,
students,
housewives)
31.67 45 19.17 4.17
Those who indicated having no income showed the lowest scores of financial literacy.
However, there is not big difference in terms of financial literacy among low and high
income groups (Table 9).
Table 9: Composition of financial literacy level by education level
No answerOne correct
answer
Two correct
answers
Three correct
answers
More than
240 Euros18.78 44.9 31.84 4.49
23
Page 30
Sholpan Gaisina – Master thesis
Table 9: Composition of financial literacy level by education level (continuous)
Less than
240 Euros20.26 37.25 38.56 3.92
No income 57.14 28.57 14.29 0
Respondents with tertiary education indicated that they prefer to use information
obtained from independent sources not affiliated with any financial institution, 43.1%.
At the same time respondents from the group with secondary and high school level
would rely mostly on consultants of the financial institutions. It means respondents
with higher level of education consider this issue as not simple and the wrong
decision would in the future create some troubles and problems. The third group with
lower level of education would make their decision regarding the choice of the
financial institution based on advertising. It could mean that less educated people
from rural areas either possess a deep mistrust of paid advice or consider this
decision as risk-free and not worth to be paid for. For all three groups such sources
of information as press and internet are of low attractiveness (Table 10).
Table 10: Composition of sources of financial knowledge by education groups
Advertise-
ment
Advice of
consultants
Recommen-
dation of
independent
persons
Mass
mediaInternet Other
Tertiary 17.8 32.8 43.1 7.5 17.8 4.0
Post-
secondary/
High
School
19.4 35.6 33.3 8.6 12.6 6.3
Middle
School/
Primary
School
77.8 22.2 0.0 0.0 11.1 0.0
24
Page 31
Sholpan Gaisina – Master thesis
Regardless whether the respondent gave a correct answer and regardless how many
correct answers were given, the majority of respondents would rather follow the
advice provided either by an official consultant or by an independent advisor than rely
on advertisement or mass media and internet. People from rural areas prefer to make
the decision on what financial institution to choose based on a personal talk and
personal advice (Table 11).
Table 11: Composition of sources of financial knowledge by financial literacy
measurement results
Advertise-
ment
Advice of
consultants
Recommen-
dation of
independent
persons
Mass
mediaInternet Other
No correct
answer23.5 25.9 38.3 9.9 13.6 6.2
One correct
answer20.1 33.1 36.1 8.3 16 2.4
Two correct
answers19.6 39.1 35.5 7.2 14.5 8
Three
correct
answers
5.9 41.2 47.1 0 11.8 5.9
Looking at the association between financial literacy and financial activity for last five
years, we observe a moderate positive association (Table 12).
Table 12: Correlation between objective literacy level and financial activity
ANSWERS FINSERV5YEARS
ANSWERS 1.0000
FINSERV5YEARS 0.1452 1.0000
25
Page 32
Sholpan Gaisina – Master thesis
Financial inclusion in our analysis is measured with two variables, the first one is
CREDIT, and this variable indicates whether the respondent used ant type of credit
within last five years (Table 13).
Table 13: Correlation between objective literacy level and financial experience
ANSWERS CREDIT
ANSWERS 1.0000
CREDIT 0.1844 1.0000
We can observe a moderate positive association between financial literacy and a
number of finical institutions operating in the area NUMBERFI, representing a second
variable characterizing financial inclusion. In the questionnaire respondents were
asked to indicate whether they have in their area following financial institutions:
branches of commercial banks, post offices, ATMs, Rural Credit Partnerships, Micro
Credit Organizations, Insurance companies (Table 14).
Table 14: Correlation between objective literacy level and number of financial
institutions in the area
ANSWERS NUMBERFI
ANSWERS 1.0000
NUMBERFI 0.1583 1.0000
We did not use in our analysis such a variable as a deposit account, since such a
variable would not show the real inclusion of the respondent into the financial activity.
In Kazakhstan almost all the formally employees are provided by the employer with a
so-called salary account in the assigned bank. This account is used exclusively to
withdraw the salary and cannot be used for other financial activities.
Despite we collected information on a number of credits obtained by the respondents
during the last five years, for analysis we constructed a single variable indicating for
all types of credits. However, it is interesting to notice that about 52% of the
respondents used a consumer credit, which is one of the most popular types of credit
among Kazakhstani population due to the short term nature of such lending. On the
other hand, only 2.5% of respondents reported on the mortgage. This type of credit is
26
Page 33
Sholpan Gaisina – Master thesis
less popular among rural population, since almost all the rural inhabitants possess
own house or apartment (Figure 5).
Figure 5: Consumer credit in Kazakhstan
Source: http://www.tradingeconomics.com/kazakhstan/consumer-credit
27
Page 34
Sholpan Gaisina – Master thesis
7 Methodology
The study tries to answer the following question:
a. What is the relationship between financial literacy and provision of financial
services?
b. What is the relationship between demographic characteristics of age, family
status, education, financial experience and financial literacy?
c. How does financial literacy affect the probability that a respondent receives
credit from the formal financial institution?
d. Whether the financial literacy level affects savings rate of respondents?
Following hypotheses are formulated, based on the questions and objectives of the
research:
H 1. Following Klapper et al. (2013) we assume that financial literacy is positively
related to participation in financial markets.
H 2. Following Lusardi and Mitchell (2011) we suppose that here are significant
differences between men and women in financial literacy.
H 3. Following Monticone (2010) we expect that there is a positive significant
relationship between financial literacy and age.
H 4. Following Christelis et al. (2010) we expect that higher level of education
would lead to higher scores of financial literacy measurements.
H 5. Following Beryy (2004) we expect that the higher representativeness of
financial institutions leads to higher financial literacy.
H 6. Our assumptions that there is a positive relationship between objective and
subjective financial literacy we based partly on conclusions made by Willis
(2008).
H 7. Following Hogarth et al. (2005) we hypothesize that there is a positive
relation between an ability to manage own finance and financial literacy.
H 8. We assume that financial literacy has a significant impact on saving rates, as
financial skills and knowledge enable people to make more substantive
financial plans and wiser allocation of their financial resources (Mahdzan,
2013).
28
Page 35
Sholpan Gaisina – Master thesis
We use ordered probit model to investigate the relationship between financial literacy
and socio-economic factors.
7.1 Dependent variable
To answer above research questions and prove the hypothesis three analyses were
undertaken.
In the first analysis we summarized information about financial literacy resulting from
three questions and used it as a dependent variable coded “ANSWERS” varying from
category “0” meaning that the respondent either did give a correct answer or did not
know the correct answer till a category “3” meaning that the respondent gave corrects
answers on all three questions.
In the second analysis as a dependent variable we used information regarding credit
taken by a respondent for past five years. The variable “CREDIT” is varying as
follows: “0” – no credit, “1” – got credit.
The third analysis considers the dependence of saving rates on some factors
including the level of financial literacy. The respondents were asked to indicate the
savings rate answering a question “What is your average monthly savings (if any) in
percentage to the income?” They had the following options:
a. 0%
b. 1-5%
c. 6-10%
d. 11-15%
e. 16-20%
f. 21-25%
g. above 25%
The variable “SAVINGRATE” was coded as “0” – no savings, “1%-5%” – 1, “6%-10%”
– 2, “11%-15%” – 3, “16%-20%” – 4, “20%-25%” – 5, and “ above 25%” – 6.
29
Page 36
Sholpan Gaisina – Master thesis
7.2 Explanatory variables
A choice of explanatory variables was based on recommendations of Kempson
(2009) as well as studies of Lusardi et al. (2010 and 2011), Klapper et al. (2013).The
explanatory variables include:
a. a set of variables measuring financial inclusion and financial experience of the
respondents: whether the respondent had credit from the formal financial
institution for last five years, whether the respondent has such a habit in
his/her family to keep records on the family budget, and how many formal
financial institutions are available in the area;
b. a set of variables characterizing socio-demographic status of the respondent,
such variables as gender, age, educational level, type of employment, and a
family size;
c. a variable indicating a level of financial literacy based on individual’s self-
estimation
d. and the income level of a respondent (Kempson, 2009).
We used eleven independent variables (predictors) for three regressions:
a. GENDER – a binary variable, where “0” - male and “1” – female.
b. AGE – a discrete variable grouped into six levels: 16-24; 25-34; 35-44; 45-54;
55-64; older than 65
c. EDUCATION – a discrete variable grouped into five levels: Tertiary = 1; Post-
secondary/technical school = 2; High School = 3; Middle School = 4; Primary
School = 5.
d. CREDIT – a binary variable that refers to the respondent’s having or nor
having got a credit for last five years: with credit = 1; without credit = 0.
e. DEPOSIT – a binary variable that refers to the respondent’s having or nor
having a deposit account at the formal financial institution for last five years:
with deposit = 1; without deposit = 0.
f. RECORDS – a binary variable that refers to the respondent’s keeping
regularly records on family budget: yes – 1; no - 0
30
Page 37
Sholpan Gaisina – Master thesis
g. EMPLOYMENT – a discrete variable grouped into five levels: formally
employed – 1; self-employed – 2; unemployed – 3; others (including retirees
and students) – 4.
h. NUMBERFI – a continuous variable that measures the number of financial
institutions available in the area without determining what kind of institution.
i. FINLITSELF – a continuous variable that measures the level of financial
literacy ascending from “0” to “5.”
j. FAMILY – indicates a family size, is a continuous variable that measures the
number of family members
k. INCOME – indicates monthly income per household (including all the
sources), is a discrete variable grouped into five levels: less than 50,000 KZT
– 1, 50,000-70,000 KZT – 2, 71,000-100,000 KZT – 3, 101,000-150,000 KZT –
4, more than 150,000 KZT – 5
l. DISTANCE – a continuous variable that measures the distance from the
settlement to a nearest financial institution, km.
31
Page 38
Sholpan Gaisina – Master thesis
8 Empirical Results
8.1 Factors affecting financial literacy level
We see that all 405 observations in our data set were used in the analysis. The
likelihood ratio chi-square of 55.6 with a p-value of 0.0000 tells us that our model as a
whole is statistically significant, as compared to the zero model with no predictors.
Table 15: Ordered probit model results of financial literacy measurement
ANSWERS Coef Std. Err. p - value
GENDER 0.244** 0.112 0.029
AGE -0.09* 0.046 0.05
EDUCATION
2 0.134 0.122 0.272
3 -0.044 0.208 0.832
4 -0.012 0.439 0.979
5 0.259 0.783 0.741
CREDIT 0.333*** 0.120 0.006
RECORDS 0.289* 0.213 0.175
EMPLOYMENT
2 -0.233 0.223 0.295
3 -0.427 0.351 0.224
4 -0.446*** 0.130 0.001
NUMBERFI 0.181*** 0.063 0.004
FINLITSELF 0.077* 0.042 0.069
Notes: * a significance level of 10%, ** a significance level of 1%, *** a significance
level of 0.5%
Almost all variables are significant at different levels (Table 15). Only one of nine
variables is not significant, however, a sign of this variable meets our expectations. A
variable EDUCATION is not significant. We can explain it by the fact the overall
literacy level in Kazakhstan, including rural areas, is greater than 99%. Moreover, the
literacy level in Kazakhstan does not mean merely an ability to read and to write, but
32
Page 39
Sholpan Gaisina – Master thesis
a particular level of education. Therefore, the education of respondents is not directly
corresponding to the financial literacy. However, the sign of this variable is negative,
which means that the log odds of being in a group with higher answer scores would
decrease as the level of education of the respondent would decrease too.
The variables AGE has a negative sign and a significance level of 10%, it means we
can expect a decrease in the log odds of being in a group with higher answer scores
by 0.08 when the respondent‘s age is increasing.
Being a female increases log odds of being in a group with higher answer scores.
We believe that having some experience of dealing with formal financial institutions
as well as keeping records of the households’ income and expenditure could mean
that the respondent has some level of financial literacy. We expected these variables
to be significant. The variable CREDIT is significant at the level of 0.5% and the
variable RECORDS is significant at the level of 10%.
We can observe a link between financial literacy and some type of financial
behaviors. We found a strong dependence of financial literacy on whether the
respondent had any type of credit over past five years. We would say that for a one
unit increase in CREDIT (i.e., going from 0 to 1), we expect a 0.34 increase in the log
odds of being in a higher level of answer scores, given all of the other variables in the
model are held constant. Also, we found that keeping day-to-day financial
management by a household would positively affect financial literacy, with a one unit
increase in RECORDS (i.e., going from 0 to 1), we expect a 0.32 increase in the log
odds of being in a group with higher answer scores.
A variable EMPLOYMENT is significant at the level of 0.5% for a group of retirees,
students and housewives and insignificant for the groups of self-employed and
unemployed. At the same time, the variable has a negative sign for all the groups. It
means being in a group of retirees and students in comparison with formally
employed respondents, will decrease by 0.44 in the log odds of being in a group with
a higher level of answer scores, given that all of the other variables in the model are
held constant. Formally employed respondents in comparison with other employment
groups provide better scores.
The number of financial institutions located in the area is a significant variable at the
level of 0.5% and positively affects the dependent variable. Going towards greater
number of financial institutions would increase the log odds of being in a group with
higher answer scores by 0.18.
33
Page 40
Sholpan Gaisina – Master thesis
The financial literacy self-estimation is significant at the level of 10% and has a
positive sign. For a one unit increase in the financial literacy self-estimations, we
would expect a 0.07 increase in the log odds of being in a higher level of answer
scores, given that all of the other variables in the model are held constant.
We also obtained predicted probabilities to be able to observe how the probabilities
of belonging to each category of answer scores change as the variable CREDIT is
varied holding the other variables at their means (Table 16).
Table 16: Predicted outcomes of correct answers under the variable CREDIT
CREDIT Margin Std. Err. z p - value
Predicted outcome = 0, not correct answers
1 0.245 0.033 7.410 0.000
2 0.151 0.020 7.350 0.000
Predicted outcome = 1, one correct answer
1 0.466 0.027 17.360 0.000
2 0.433 0.026 16.600 0.000
Predicted outcome = 2, two correct answers
1 0.271 0.032 8.450 0.000
2 0.375 0.028 13.420 0.000
Predicted outcome = 3, three correct answers
1 0.019 0.007 2.840 0.005
2 0.041 0.011 3.840 0.000
As we can see, the predicted probability of being in the category with no correct
answers is 0.25 for the respondent who did not get any type of credit from the formal
financial institutions over past five years and 0.15 if the respondent indicated having
credit. It means those who had some financial experience, the probability to five now
correct answers is lower. For the category of respondents who provided one correct
answer, the predicted probabilities are 0.46 and 0.43, indicating an insignificant
difference between those respondents with and without credit. At the same time, for
the respondents from the group with two correct answers the predicted probabilities
are 0.27 for the respondents without credit and 0.37 for ones who had it. It means
those respondents who dealt with financial institutions during the past five years the
probability to give either two correct answers is higher than for those who did not 34
Page 41
Sholpan Gaisina – Master thesis
have such an experience. Respectively, the predicted probability to provide three
correct answers is greater for those with some financial experience, 0.04 in
comparison to those without any experience, 0.02.
As the variable NUMBERFI (number of financial institutions in the area varying from 1
financial institution to 3 different financial institutions) is varied the predicted
probabilities of being in each category of answer scores is as follows (Table 17).
Table 17: Predicted outcomes of answers under the variable NUMBERFI
NUMBERFI Margin Std. Err. z p - value
Predicted outcome = 0
0 0.250 0.035 7.170 0.000
1 0.196 0.021 9.260 0.000
2 0.150 0.021 7.310 0.000
3 0.112 0.025 4.420 0.000
Predicted outcome = 1
0 0.467 0.027 17.410 0.000
1 0.457 0.026 17.330 0.000
2 0.434 0.026 16.520 0.000
3 0.401 0.033 12.240 0.000
Predicted outcome = 2
0 0.265 0.033 8.070 0.000
1 0.320 0.024 13.160 0.000
2 0.375 0.028 13.220 0.000
3 0.428 0.040 10.630 0.000
Predicted outcome = 3
0 0.018 0.007 2.710 0.007
1 0.027 0.008 3.600 0.000
2 0.041 0.011 3.860 0.000
3 0.060 0.018 3.330 0.001
We can see that the predicted probability increases for the categories of 2-3 answer
scores as number of financial institutions in the area of residence increases. At the
same time the fewer financial institutions in the area the greater the probability of not
providing any correct answers. 35
Page 42
Sholpan Gaisina – Master thesis
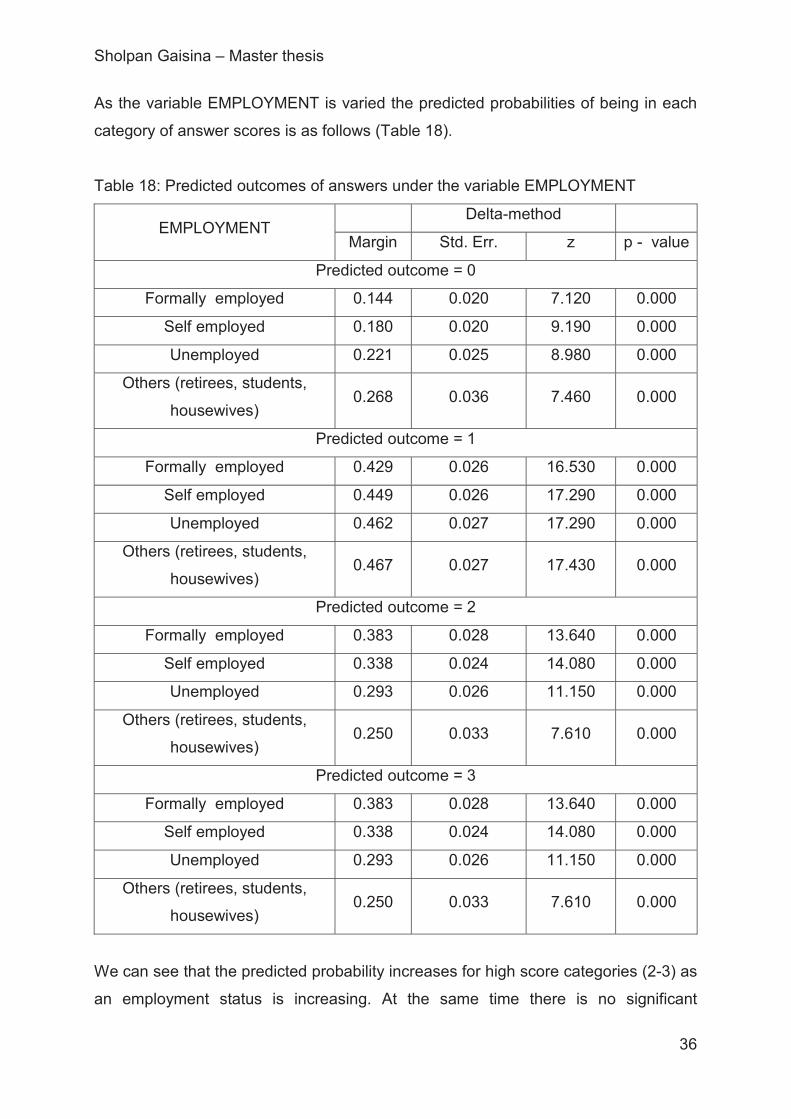
As the variable EMPLOYMENT is varied the predicted probabilities of being in each
category of answer scores is as follows (Table 18).
Table 18: Predicted outcomes of answers under the variable EMPLOYMENT
EMPLOYMENTDelta-method
Margin Std. Err. z p - value
Predicted outcome = 0
Formally employed 0.144 0.020 7.120 0.000
Self employed 0.180 0.020 9.190 0.000
Unemployed 0.221 0.025 8.980 0.000
Others (retirees, students,
housewives)0.268 0.036 7.460 0.000
Predicted outcome = 1
Formally employed 0.429 0.026 16.530 0.000
Self employed 0.449 0.026 17.290 0.000
Unemployed 0.462 0.027 17.290 0.000
Others (retirees, students,
housewives)0.467 0.027 17.430 0.000
Predicted outcome = 2
Formally employed 0.383 0.028 13.640 0.000
Self employed 0.338 0.024 14.080 0.000
Unemployed 0.293 0.026 11.150 0.000
Others (retirees, students,
housewives)0.250 0.033 7.610 0.000
Predicted outcome = 3
Formally employed 0.383 0.028 13.640 0.000
Self employed 0.338 0.024 14.080 0.000
Unemployed 0.293 0.026 11.150 0.000
Others (retirees, students,
housewives)0.250 0.033 7.610 0.000
We can see that the predicted probability increases for high score categories (2-3) as
an employment status is increasing. At the same time there is no significant
36
Page 43
Sholpan Gaisina – Master thesis
difference in the predicted probability for the category with one correct answer.
However, it is obvious, that the lower the employment status the greater is the
probability of not providing any correct answers.
8.2 Factors affecting credit behavior
All 405 observations in our data set were used in the analysis. The likelihood ratio
chi-square of 59.06 with a p-value of 0.0000 tells us that our model as a whole is
statistically significant, as compared to the null model with no predictors. All variables
are significant at different levels (Table 19).
Table 19: Ordered probit model results of financial behavior towards formal credit
CREDIT Coef. Marginal effects p - value
INCOME 0.564*** 0.125 0.000
EDUCATION -0.290* -0.064 0.076
ANSWERS 0.544*** 0.120 0.000
SAVINGS -0.353** -0.078 0.039
DISTANCE -0.005** -0.001 0.025
SELFFINLITERACY 0.154* 0.034 0.078
_cons -0.543 0.337
Notes: * a significance level of <10%, ** a significance level of <5%, *** a significance
level of <0.1%.
The variables EDUCATION and SELFFINLITERACY are less significant. We can
explain it by the fact the overall literacy level in Kazakhstan, including rural areas, is
greater than 99%. Moreover, the literacy level in Kazakhstan does not mean merely
an ability to read and to write, but a particular level of education. Therefore, the
education of respondents is not directly corresponding to the financial literacy. The
sign of the variable EDUCATION is negative, which means the log odds of having
credit (versus non-having credit) decreases by 0.29 by moving from higher levels to
lower levels of education and the probability to have credit is decreasing by 6%. The
financial literacy self-estimation has a positive sign meaning the log odds of having
credit (versus non-having credit) increases by 0.15 by moving from lower levels to
37
Page 44
Sholpan Gaisina – Master thesis
higher levels of self-estimation and probability to deal with financial institutions is
increasing by about 3%.
We can observe a link between financial literacy (ANSWERS) and financial behavior.
We found a strong dependence of whether the respondent had any type of credit
over past five years financial literacy on answers provided. We would say that for a
one unit increase in ANSWERS (i.e., going from 0 to 3), we expect a 0.54 increase in
the log odds of being in a group with credit. The probability to have credit from formal
financial institutions is increasing by 12%.
The variable INCOME is very significant and the dependence of the variable CREDIT
on the income level of the respondent is very strong. With the increasing income the
log odds of being in a group with credit are increasing and the probability is
increasing by 12.5%.
The variable SAVINGS is significant; however, it has a negative sign, meaning that if
the respondent saves more the log odds of having credit are decreasing and the
probability to be in a group with credit is decreasing by 7.8%. It could be explained by
behavioral patterns of rural population, who is reluctant to deal with any formal
financial institutions if they have own sources to finance their needs.
The variable DISTANCE is significant and negatively related to the variable CREDIT.
The greater the distance to the formal financial institutions is the lower is the
probability to be in the group with credit by 0.1%.
We can also use predicted probabilities to understand our model using margins
(Table 20).
Table 20: Predicted probabilities
INCOME, th. KZT EDUCATION ANSWERS
No income .43 Tertiary .70 No answer .44
Less 50 .55 Secondary .63 1 correct answer .68
50000-70000 .66 High school .55 2 correct answers .69
71000-100000 .75 Middle School .47 3 correct answers .83
101000-150000 .83 Primary School .39
More than 150000 .89
38
Page 45
Sholpan Gaisina – Master thesis
Table 20: Predicted probabilities (continuous)
DISTANCE, km SELFFINLITERACY SAVINGS
1 .67 Cannot evaluate .52 Nothing .71
51 .62 Very bad .53 1-5% .65
101 .57 Bad .63 6-10% .58
151 .52 Good .69 11-15% .52
201 .46 Very good .67 16-20% .45
Excellent .65 21-25% .38
Above 25% .32
We can see that the mean predicted probability of having any type of credit over past
five years is only 0.43 if one does not report any income and it increases to 0.89 if
one's income is greater than 1,500,000 KZT. As well as the mean predicted
probability of having any type of credit increases from 0.44 to 0.83 if one's answer
scores are increasing from “no answer” to “three correct answers”. The lower a level
of education the smaller is a probability to be in a group with credit. The longer is a
distance to the financial institution the smaller is the probability to be in the group with
credit, ranging from 0.67 to 0.46. For the respondent estimating his/her financial
literacy as very bad the probability to be in the group with credit is smaller (0.52) in
comparison with those respondents reporting having excellent financial literacy
(0.65). The more the respondent saves the less is the probability to find this
respondent among those who had formal credit over past five years, ranging from
0.71 to 0.32. P values for all the variables are less than 0.0000.
8.3 Factors affecting saving rates
It is necessary to mention that the respondents with the lowest saving rate of 1-5%
take the biggest share, more than 67%, those who indicated to save more than 10%
of their income make just 4% of all the respondents (Figure 6).
39
Page 46
Sholpan Gaisina – Master thesis
Figure 6: Distribution of respondents according to the level of savings
In the analysis only respondents who save were included, about 85% of the sample.
The dependent variable is a saving rate varying from 0% to more the 25% of income.
Independent variables include measurement of financial literacy and other socio-
demographic variables.
Four options of financial literacy were considered:
1. How each of three questions affect the level of savings?
2. How an increase in number of correct answers affect the level of savings?
3. Whether those who correctly answered all three questions indicate higher
saving rates?
4. Whether any given correct answer affect the level of saving?
Table 21: Ordered probit model results of financial behavior towards savings1 2 3 4
SAVINGRATE (only who
saves)Coef.
Std.
Err.Coef.
Std.
Err.Coef.
Std.
Err.Coef.
Std.
Err.
ANY CORRECT 0.401*** 0.117
ALL THREE
CORRECT0.297 0.391
do not save, 15%
save less than 5%, 67%
save 6%-10%, 14%
save more than 10%, 4%
40
Page 47
Sholpan Gaisina – Master thesis
Table 21: Ordered probit model results of financial behavior towards savings
(continuous)
ANSWERS 1.001*** 0.275
QUESTION
INTEREST0.259 0.200
QUESTION
INFLATION0.166 0.259
QUESTION
MORGAGE0.616*** 0.178
SELFFINLIT 0.069 0.072 0.085 0.071 0.073 0.07 0.051 0.071
INCOME 0.643*** 0.093 0.600*** 0.090 0.557*** 0.087 0.634*** 0.092
CREDIT -0.113 0.203 -0.141 0.204 -0.072 0.197 -0.112 0.201
DEPOSIT 1.964*** 0.477 1.964*** 0.479 1.839*** 0.467 1.949*** 0.474
GENDER -0.162 0.176 -0.125 0.176 -0.114 0.171 -0.138 0.174
AGE -0.129* 0.074 -0.133* 0.075 -0.139** 0.072 -0.129* 0.073
FAMILY -0.030 0.050 -0.034 0.050 -0.040 0.049 -0.028 0.049
EDUCATION
2 -0.091 0.197 -0.160 0.198 -0.123 0.194 -0.114 0.196
3 0.431 0.382 0.324 0.379 0.228 0.373 0.395 0.378
4 -0.413 0.869 -0.600 0.880 -0.384 0.841 -0.366 0.850
5 -3.008 650.06 -3.610 651.25 -3.359 648.9 -3.244 651.21
EMPLOYMENT
2 0.481 0.303 0.378 0.304 0.383 0.291 0.419 0.300
3 -4.712 258.85 -4.725 254.73 -4.621 266.2 -4.504 261.49
4 -0.022 0.216 0.070 0.210 -0.105 0.203 0.018 0.207
Notes: * a significance level of <10%, ** a significance level of <5%, *** a significance
level of <0.1%.
Table 21 shows that a correct answer on the questions regarding Mortgage increases
positively the log odds of saving rates by 0.62. Other questions do not affect log odds
of saving rates significantly.
Moving from “No correct answer” to “three correct answers” increases log odds of
saving rates by 0.28. Also giving any correct answer increases significantly log odds
of saving rates. 41
Page 48
Sholpan Gaisina – Master thesis
At the same time a variable describing self-assessment is not significant when the
issue is about savings. It could be explained that making savings requires not just
particular feelings, but need specific knowledge.
As it was expected an income level positively and significantly affects the log odds of
saving rates. The higher income is, the more people can save. Having a deposit
account at the formal financial institution increases the probability to have the higher
level of savings.
42
Page 49
Sholpan Gaisina – Master thesis
9 Discussions
Our study contributes to the literature and existing knowledge by explaining the
relation between the level of financial literacy of rural people in Kazakhstan and a set
of socio-economic and behavioral factors. The study explores what rural people know
and do not know as determined by questions assessing the financial literacy. Unlike
results in Lusardi and Mitchell (2008), Lusardi, Mitchell and Curto (2010), and Lusardi
and Tuffano (2009), who found that female respondents show low scores, in our
study rural women showed higher level of financial literacy (Table 22). We can
explain it by the fact, that traditionally in rural families with many children; women are
responsible for keeping family budget. Despite they have less than male population
access to formal finance; women are more experienced in making home budget
decisions.
Table 22: Composition of correct answers on specific questions by gender groups
Questions
Interest Inflation Mortgage
Female 123 30 104
Male 136 19 84
Total 259 49 188
In general, we found that financial literacy was severely lacking among respondents
with lower level of education, however, the share of people with primary or middle
school levels of education is insignificant, only about 2.5%. Only 64% could do simple
interest rate calculations, about 46.4% knew about particularities of mortgage, and
only 12% were able to provide a correct answer on a question regarding inflation.
Delavande et al. (2008, p.2) consider the acquisition of financial knowledge as a
human capital investment. Our study also provides information on important channels
which respondents consider as important for acquiring financial knowledge. Majority
of respondents think that specialized education institutions are the best sources of
financial knowledge. On the second place they put state agencies responsible for
financial regulation. It means, that rural people are not really trustful towards financial
institutions as they think, the latter are interested to get more clientele and probably
43
Page 50
Sholpan Gaisina – Master thesis
would provide misleading information. Rather people would trust independent
financial consultant (Figure 7).
Figure 7: Preferences of financial knowledge sources
Delavande et al. (2008) suggest that common people usually lacking knowledge
necessary to construct financial decisions rely on a wide range of professional
financial advice as private or public sources, amateur advice, self-help books,
newspapers and magazines. Respondents in our survey were asked a question
regarding their opinion on what sources are more preferable when they need to
choose what financial institutions to deal with. Majority would prefer to talk to their
friends and relatives and to make a decision based on others experience rather than
to ask for advice consultants or to believe advertisement (Figure 8).
Figure 8: Preferences of information sources regarding financial institutions
9
37
12
133
109
211
180
93
32
96
No answer
I find it difficult to answer this question
Other
Mass media (journalists and TV presenters)
Independent financial consultants
Higher education institutions of economic and financial profile
Government entities regulating capital markets
Non-government organizations or public organizations involved in consumer rights protection
Insurance company
Commercial bank
Advertisement17%
Advice of consultants
29%
Recommendation of independent
persons 31%
Mass media7%
Internet12%
other4%
44
Page 51
Sholpan Gaisina – Master thesis
Answering a question “In your opinion what should be primary attention when
someone compare the banks in order to choose the one where to take a credit from
or to make deposit in?” most respondents indicated that the bank’s reputation is of
greatest importance for them, followed by a level of interest rates and fees. These
results corresponding to the previous ones mean that good reputation of financial
institutions spread over by reliable people as friends and relatives is determining
factor in the decision making process (Figure 9).
Figure 9: Preference criteria in choosing a financial institution
Findings of this research could be considered as a valuable source of information
related to financial literacy in rural areas of Kazakhstan and could be used by
politicians for designing measures protecting rural household’s financial security.
Despite some activities undertaken recently by the Kazakhstani government, rural
people still have very limited access to financial education programs; suffer from the
lack of financial experience due to the insufficient presence of financial institutions in
rural areas; have low level of income which is one of the most important impediments
in having access to financial services. Additionally, rural population should not be
considered as a homogeneous group. Rather gender, educational attainment and
other observable characteristics should be considered by policy makers in their
activities aimed at the improvement of financial literacy of rural people (Lusardi et al.,
2008).
0,0 10,0 20,0 30,0 40,0 50,0
Bank’s reputation (fame) and its reliability
View of the bank office and qualifications…
Credit interest rate and the credit cost
Gifts and advertising campaigns
Other
I cannot estimate it even roughly
No answer
45
Page 52
Sholpan Gaisina – Master thesis
The study has shown that credit behavior of rural people is significantly affected by
financial literacy, the more correct answers gives the respondent the higher is a
probability to find this respondent among those with credit. It means, that rural people
would be more active in dealing with formal financial institutions and using different
financial products, if they would better prepared and possess more at least some
financial knowledge.
The study has also shown the financial literacy is a very important determinant of the
saving level. If people better understand such basic financial concepts as interest
rate, inflation, time value of money, they would wiser use their financial resources
and would be able to save larger part of the income.
The findings of this research suggest that if the government aims to increase savings
by households, it should increase efforts in improving financial literacy through
various education programs provided by both state and private agencies.
46
Page 53
Sholpan Gaisina – Master thesis
10 References
Agribusiness 2020, Agricultural Development Program 2013-2020,
http://gain.fas.usda.gov/Recent%20GAIN%20Publications/Agricultural%20Developm
ent%20Program%202013-2020_Astana_Kazakhstan%20-%20Republic%20of_10-
24-2013.pdf
Berry, C. (2004), To bank or not to bank? A survey of low-income households, Joint
Center for Housing Studies Working Paper BABC 04, Cambridge, MA: Harvard
University, http://www.jchs.harvard.edu/sites/jchs.harvard.edu/files/babc_04-3.pdf
Bhushan P., Medury Y. (2013), Financial Literacy and its Determinants, International
Journal of Engineering, Business and Enterprise Applications (IJEBEA), pp. 13-145,
p.155
Calvet, L., Campbell, J., Sodini, P. (2009), Measuring the financial sophistication of
households, American Economic Review 99 (2), pp. 393-398,
https://www.aeaweb.org/assa/2009/retrieve.php?pdfid=278
Christelis D., Jappelli T., Padula M. (2010), Cognitive abilities and portfolio choice,
European Economic Review 54, pp. 18–38, p.28
Chusnutdinova M. (2013), Formation of financial services consumers’ rights
institutions in Kazakhstan. The first international conference “The development and
integration of financial and commodity markets in CIS”, 4-5 October, 2013, Kiev,
Ukraine,
http://aeaep.com.ua/wp-content/uploads/2013/10/zashchita_prav_v_kazakhstane.pdf
Cohen M. (2011), Financial Literacy: A Step for Clients towards Financial Inclusion,
Global Microcredit Summit Commissioned, Workshop Paper, November 14-17,
2011,Valladolid, Spain,
http://citeseerx.ist.psu.edu/viewdoc/download?doi=10.1.1.466.2029&rep=rep1&type=
pdf
Committee for the Control and Supervision (2013), ANNUAL REPORT of Financial
Market and Financial Organizations of the National Bank of the Republic of
Kazakhstan for 2012, www.afn.kz/attachments/9/20/publish20-1020746.pdf
47
Page 54
Sholpan Gaisina – Master thesis
Delavande A., Rohwedder S., Willis R.J. (2008), Preparation for Retirement,
Financial Literacy and Cognitive Resources, Working Paper No. 2008–190, Ann
Arbor: Michigan Retirement Research Center, University of Michigan, p. 2,
http://www.mrrc.isr.umich.edu/publications/Papers/pdf/wp190.pdf
Fileccia T., Jumabayeva A., Nazhmidenov K. (2010), Executive summary, Highlights
on four livestock sub-sectors in Kazakhstan,
http://www.fao.org/fileadmin/user_upload/tci/docs/LH1-Executive%20Summary.pdf
Gaurav S., Singh A. (2012), An Inquiry into the Financial Literacy and Cognitive
Ability of Farmers: Evidence from Rural India, Oxford Development Studies, Vol. 40,
No. 3, pp. 358–380, p.360
GIZ (2014), Agricultural and Rural Finance Programme,
https://www.giz.de/en/worldwide/19361.html
Gonzalez-Vega, C. (1982), Credit-rationing behavior of agricultural lenders: The iron
law of interest restrictions. Discussion Paper No. 9. Colloquium on Rural Finance.
Economic Development Institute, World Bank, Washington, D.C. September 1-3,
1981. Retrieved from http://pdf.usaid.gov/pdf_docs/PNAAN113.pdf
Hira K. T. (2012), Promoting sustainable financial behaviour: implications for
education and research, International Journal of Consumer Studies 36, pp. 502–507
Hoff, K., Stiglitz, J. E. (1990), Imperfect information and rural credit markets, puzzles
and policy perspectives. In Hoff, K., Braverman, A. & Stiglitz, J. E. (Eds.), The
Economic of rural organization. Theory, practice, and policy. Oxford University press
for the World Bank.: pp. 33-52
Hogarth J.M. (2006), Financial Education and Economic Development Federal
Reserve Board, U.S.A., Paper prepared for “Improving Financial Literacy”
International Conference hosted by the Russian G8 Presidency in Cooperation with
the OECD 29-30 November 2006, p 3, http://www.oecd.org/finance/financial-
education/37742200.pdf
48
Page 55
Sholpan Gaisina – Master thesis
Hogarth J.M., Anguelov C. E., Lee J. (2005), Who Has a Bank Account? Exploring
Changes, Over Time, 1989–2001 Journal of Family and Economic Issues, Vol. 26(1),
pp. 7-30, p.10
Hogarth, J. M., Hilgert, M. A., Schuchardt, J. (2002), Money managers: The good,
the bad, and the lost. Proceedings of the Association for Financial Counseling and
Planning Education, p 12, http://pfeef.org/wp-content/uploads/2015/01/Money-
Managers-The-Good-the-Bad-and-the-Lost.pdf
Holzmann R. (2010), Bringing Financial Literacy and Education to Low and Middle
Income Countries, October 2010, PRC WP2010-38, Pension Research Council
Working Paper Pension Research Council, The Wharton School, University of
Pennsylvania
Inform.kz, http://www.inform.kz/eng/article/2717850, accessed on 30.07.2015
IMF (2014), Republic of Kazakhstan, Selected Issues, International Monetary Fund,
Washington DC, http://www.imf.org/external/pubs/ft/scr/2014/cr14243.pdf
OECD (2005), Improving financial literacy: analysis of issues and policies, OECD
Publishing, http://www.oecd.org/finance/financial-
education/improvingfinancialliteracyanalysisofissuesandpolicies.htm, p. 25
Interfax-Kazakhstan, July, 22, 2015,
https://www.interfax.kz/?lang=eng&int_id=10&news_id=8561
Kempson, E. (2009), “Framework for the Development of Financial Literacy Baseline
Surveys: A First International Comparative Analysis”, OECD Working Papers on
Finance, Insurance and Private Pensions, No. 1, OECD Publishing,
http://dx.doi.org/10.1787/5kmddpz7m9zq-en
Klapper L., Lusardi A., Panos G.A. (2013), Financial literacy and its consequences:
Evidence from Russia during the financial crisis, Journal of Banking & Finance 37
(2013) pp. 3904–3923
Lusardi A., Mitchell O. S. (2008), Planning and financial literacy: How do women
fare?, American Economic Review: Papers & Proceedings 2008, 98:2, pp. 413–417,
http://www.dartmouth.edu/~alusardi/Papers/AER-FinalPublishedVersion.pdf
49
Page 56
Sholpan Gaisina – Master thesis
Lusardi A., Mitchell O. S. (2011), Financial literacy around the world: an overview.
Journal of Pension Economics and Finance, pp 497-508., p. 10
Lusardi A., Mitchell O. S., Curto V. (2010), Financial Literacy among the Young, The
Journal of Consumer Affairs, pp. 358-380,p.360,
http://onlinelibrary.wiley.com/doi/10.1111/j.1745-6606.2010.01173.x/pdf
Lusardi A., Mitchell O.S. (2011), The Outlook for Financial Literacy, Working Paper
17077, http://www.nber.org/papers/w17077NATIONAL BUREAU OF ECONOMIC
RESEARCH, May 2011
Lusardi A., Tufano P. (2009), Debt Literacy, Financial Experiences, and
Overindebtedness, Working Paper 14808, http://www.nber.org/papers/w14808.pdf
Lusardi, A., Mitchell, O.S. (2013), The Economic Importance of Financial Literacy:
Theory and Evidence. NBER Working Paper 18952,
http://www.nber.org/papers/w18952
Lyons A. C., Mitchell R., Scherpf E. (2007), What’s in a Score? Differences in
Consumers’ Credit Knowledge Using OLS and Quantile Regressions. Journal of
Consumer Affairs, 41 (Winter): pp. 223–249.
Mahdzan N.S., Tabiani S. (2013), The impact of financial literacy on individual
saving: an exploratory study in the Malaysian Context, Transformation in Business
and Economics, Vol. 12, No 1 (28), p. 41-55
Maximchuk N., A. Rudetskih (2004), Kazakhstan’s experience in transition. In:
Globalisation, integration, and transition. Country Papers Series 5. UNDP
Kazakhstan
Meier S., Sprenger C. (2008), Discounting Financial Literacy: Time Preferences and
Participation in Financial Education Programs, Public Policy Discussion Papers,
Federal Reserve Bank of Boston, No, 07-5, p.2
Meier S., Sprenger C. (2013), Discounting Financial Literacy: Time Preferences and
Participation in Financial Education Programs, Federal reserve bank of Boston, No
07-5, Public Policy discussion papers
50
Page 57
Sholpan Gaisina – Master thesis
Ministry of national economy of the republic of Kazakhstan committee on statistics,
www.stat.gov.kz, accessed on 16.07.2015
Monticone C. (2010), How Much Does Wealth Matter in the Acquisition of Financial
Literacy?, Journal of Consumer Affairs Volume 44, Issue 2, Article first published
online: 1 JUN 2010 pp. 403-422, p.404
Nguyen C. H. (2007), Access to credit and borrowing behavior of rural households in
a transition. International Conference on Rural finance research: Moving results into
policies and practice, FAO Headquarters Rome, Italy 19-21 March 2007. Retrieved
from http://www.fao.org/ag/rurfinconference/docs/papers_theme_1/access_credit.pdf
Nuraichan G. (2014), 44% of Kazakh people do not trust financial market, Financial
Journal, http://lsm.kz/44-kazahstantsev-ne-doveryaet-finansovomu-ry-nku.html
OECD (2005), “Improving Financial Literacy: Analysis of Issues and Policies”,
Financial Market Trends, Vol. 2005/2.http://dx.doi.org/10.1787/fmt-v2005-art11-en
OECD (2006), “Improving Financial Literacy: Analysis of Issues and Policies”,
Financial Market Trends, Vol. 2005/2.http://dx.doi.org/10.1787/fmt-v2005-art11-en
OECD (2013), OECD Review of Agricultural Policies: Kazakhstan 2013,
https://books.google.de/books?id=XsPB7YetUVoC&printsec=frontcover#v=onepage
&q&f=false
OECD (2012), Supplementary Questions: Optional Survey Questions for the OECD
INFE Financial Literacy Core Questionnaire, http://www.oecd.org/finance/financial-
education/49878153.pdf
Orton L. (2007), Financial Literacy: Lessons from International Experience, Canadian
Policy Research Networks Inc., p8
Presidential Decree of The Republic of Kazakhstan, http://cis-
legislation.com/document.fwx?rgn=59213
PRI (Policy Research Initiative) (2004), Financial Capability and Poverty Discussion
Paper. Prepared by Social and Enterprise Development Innovations for the PRI
Project “New Approaches for Addressing Poverty and Exclusion.” Ottawa: PRI.
51
Page 58
Sholpan Gaisina – Master thesis
PRI (Policy Research Initiative) (2005), Why Financial Capability Matters, Synthesis
Report, Prepared by Social and Enterprise Development Innovations for the PRI
Project “New Approaches for Addressing Poverty and Exclusion.” Report on
“Canadians and Their Money: A National Symposium on Financial Capability.”
Ottawa, June 9-10, 2005, http://www.fcac-
acfc.gc.ca/Eng/resources/researchSurveys/Pages/WhyFinan-Pourquoi.aspx
RFCA, Enhancement of Investment Culture and Financial Literacy of People of the
Republic of Kazakhstan,
http://www.childfinanceinternational.org/index.php?option=com_mtree&task=att_dow
nload&link_id=776&cf_id=200, accessed 06.2015
RIOEA (2012), Report on CKDs, Research Institute of Organizational and Economics
of Agriculture, Almaty, Kazakhstan
Rooij, van M., Lusardi A., Alessie R. (2011), Financial literacy and stock market
participation, Journal of Financial Economics 101, pp.449–472, p. 468
UNDP (2001), Kazakhstan: accelerating growth in the non-oil sectors of the
economy. Poverty Reduction and Economic Management, Europe and Central Asia
Region, Available from: ,
accessed 25.06.2010.
UNESCO (2014), Teaching and Learning: Achieving quality for all: EFA Global
Monitoring Report 2013–14. 2014.Paris: UNESCO,
http://unesco.nl/sites/default/files/dossier/gmr_2013-4.pdf?download=1
UNESCO (2009), Reading and Writing for Critical Thinking Country Profile:
Kazakhstan, http://www.unesco.org/uil/litbase/?menu=4&programme=187
UNICEF, Country Profile, Education in Kazakhstan,
http://www.unicef.org/ceecis/Kazakhstan.pdf, accessed on 10.2015
West J. (2012), Financial literacy education and behavior unhinged: combating bias
and poor product design, International Journal of Consumer Studies, 36, pp. 523–
530, p 523
52
Page 59
Sholpan Gaisina – Master thesis
World Bank, http://www.worldbank.org/en/country/kazakhstan/overview, accessed on
10.2015
Willis, L.E. (2008), Against financial literacy education. Iowa Law Review, 94, 197–
285, http://papers.ssrn.com/sol3/papers.cfm?abstract_id=1105384
Willis, L. E. (2008), Evidence and Ideology in Assessing the Effectiveness of
Financial Literacy Education". Faculty Scholarship. Paper 197,
http://scholarship.law.upenn.edu/faculty_scholarship/197
Xiao J.J. (2008), Applying Behavior Theories to Financial Behavior in Handbook of
Consumer Finance Research, Xiao JJ (ed.), Springer Link. pp 69-81, p.4
Yespolov T.I., Johnson S.R., Suleimenov Zh.Zh., Kalna-Dubinyuk T., Arynova A.
(2012), Extension in Kazakhstan and the experience of the USA: lessons from a
working national model, Xlibris Corporation, USA, pp. 96-101
53
Page 60
Sholpan Gaisina – Master thesis
EEidesstattliche Erklärung
Hiermit erkläre ich an Eides statt, dass ich die vorliegende Arbeit selbstständig und
ohne Benutzung anderer als der angegebenen Hilfsmittel angefertigt habe. Die aus
fremden Quellen direkt oder indirekt übernommenen Gedanken sind als solche
kenntlich gemacht. Die Arbeit wurde bisher in gleicher oder ähnlicher Form keiner
anderen Prüfungsbehörde vorgelegt.
Ich bin damit einverstanden, dass meine Diplomarbeit in der Hochschulbibliothek
eingestellt wird.
__________________________ ____________________________________
Ort, Datum Name, Unterschrift
54