Determinants of Innovation in Portugal. Determinants of Innovation in Portugal. Designing, Implementing and Analyzing Evidence from Designing, Implementing and Analyzing Evidence from the 3 the 3 rd rd Community Innovation Survey Community Innovation Survey (1) (1) Manuel João de Albuquerque Rocha Pereira Bóia Manuel João de Albuquerque Rocha Pereira Bóia [email protected][email protected]Orientador: Orientador: Doutor Pedro Filipe Teixeira da Conceição Doutor Pedro Filipe Teixeira da Conceição Instituto Superior Técnico – Universidade Técnica de Lisboa Instituto Superior Técnico – Universidade Técnica de Lisboa 3 September 3 September 2003 2003 (1) (1) the research reported in this thesis was partially supported by Observatorio da Ciencia e do Ensino Superior (OCES) [Obervatory of the research reported in this thesis was partially supported by Observatorio da Ciencia e do Ensino Superior (OCES) [Obervatory of Science and Higher Education, Ministry for Science and Higher Education, Portugal] Science and Higher Education, Ministry for Science and Higher Education, Portugal]
Transcript
Determinants of Innovation in Portugal.Determinants of Innovation in Portugal. Designing, Implementing and Analyzing Evidence fromDesigning, Implementing and Analyzing Evidence from
the 3 the 3rdrd Community Innovation Survey Community Innovation Survey (1)(1)
Manuel João de Albuquerque Rocha Pereira Bóia Manuel João de Albuquerque Rocha Pereira Bóia
Orientador:Orientador: Doutor Pedro Filipe Teixeira da ConceiçãoDoutor Pedro Filipe Teixeira da ConceiçãoInstituto Superior Técnico – Universidade Técnica de LisboaInstituto Superior Técnico – Universidade Técnica de Lisboa
3 September3 September 2003 2003
(1)(1) the research reported in this thesis was partially supported by Observatorio da Ciencia e do Ensino the research reported in this thesis was partially supported by Observatorio da Ciencia e do Ensino Superior (OCES) [Obervatory of Science and Higher Education, Ministry for Science and Higher Education, Superior (OCES) [Obervatory of Science and Higher Education, Ministry for Science and Higher Education, Portugal]Portugal]
OutlineOutline
1.1. ObjectiveObjective
2.2. The Community Innovation Survey The Community Innovation Survey (1)(1)
3.3. Results,Results,
Innovative Enterprises by Sector and CIS Trajectories in the Innovative Enterprises by Sector and CIS Trajectories in the European ContextEuropean Context
Input vs. Output of Innovation in EuropeInput vs. Output of Innovation in Europe
A regression analysis of the CIS III dataA regression analysis of the CIS III data
Other Strategic and Organizational Important ChangesOther Strategic and Organizational Important Changes
Innovation SourcesInnovation Sources
Innovation BarriersInnovation Barriers
4.4. Lessons Learned and ConclusionsLessons Learned and Conclusions
(1) Performed under contract with the Observatório das Ciências e Tecnologias (OCT – Sciences and (1) Performed under contract with the Observatório das Ciências e Tecnologias (OCT – Sciences and Technologies Observatory, and since early 2003, Observatório das Ciências e do Ensino Superior, Sciences and Technologies Observatory, and since early 2003, Observatório das Ciências e do Ensino Superior, Sciences and Higher Education Observatory - OCES) within the Center for Innovation, Technology and Policy Research at Higher Education Observatory - OCES) within the Center for Innovation, Technology and Policy Research at Instituto Superior Técnico (IN+/IST) and primary sources of the analyzed data.Instituto Superior Técnico (IN+/IST) and primary sources of the analyzed data.
ObjectiveObjective
To contribute to the characterization of the Determinants of To contribute to the characterization of the Determinants of
Innovation in Portugal through the Design, Implementation and Innovation in Portugal through the Design, Implementation and
Evidence Analysis of the Third Community Innovation Survey Evidence Analysis of the Third Community Innovation Survey
(1998-2000) and the analysis of the EU countries Innovation (1998-2000) and the analysis of the EU countries Innovation
Trajectories from CIS II to CIS III.Trajectories from CIS II to CIS III.
1.1.
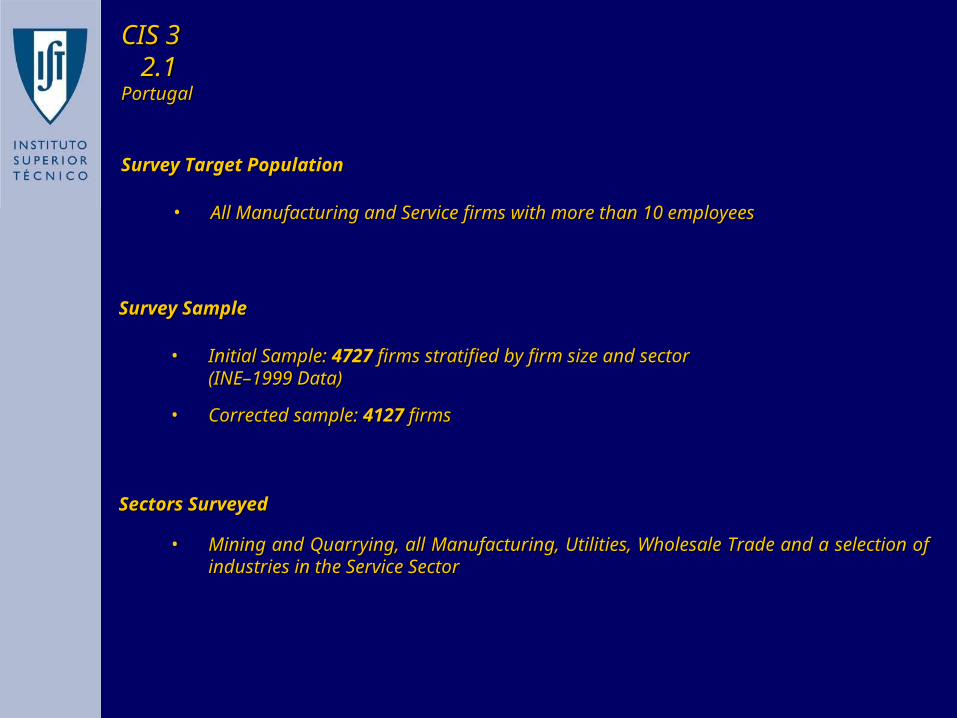
CIS 3CIS 32.12.1
PortugalPortugal
Survey SampleSurvey Sample
• Initial Sample: Initial Sample: 47274727 firms stratified by firm size and sector firms stratified by firm size and sector (INE–1999 Data)(INE–1999 Data)
• Mining and Quarrying, all Manufacturing, Utilities, Wholesale Trade and a Mining and Quarrying, all Manufacturing, Utilities, Wholesale Trade and a selection of industries in the Service Sectorselection of industries in the Service Sector
Survey Target PopulationSurvey Target Population
• All Manufacturing and Service firms with more than 10 employeesAll Manufacturing and Service firms with more than 10 employees
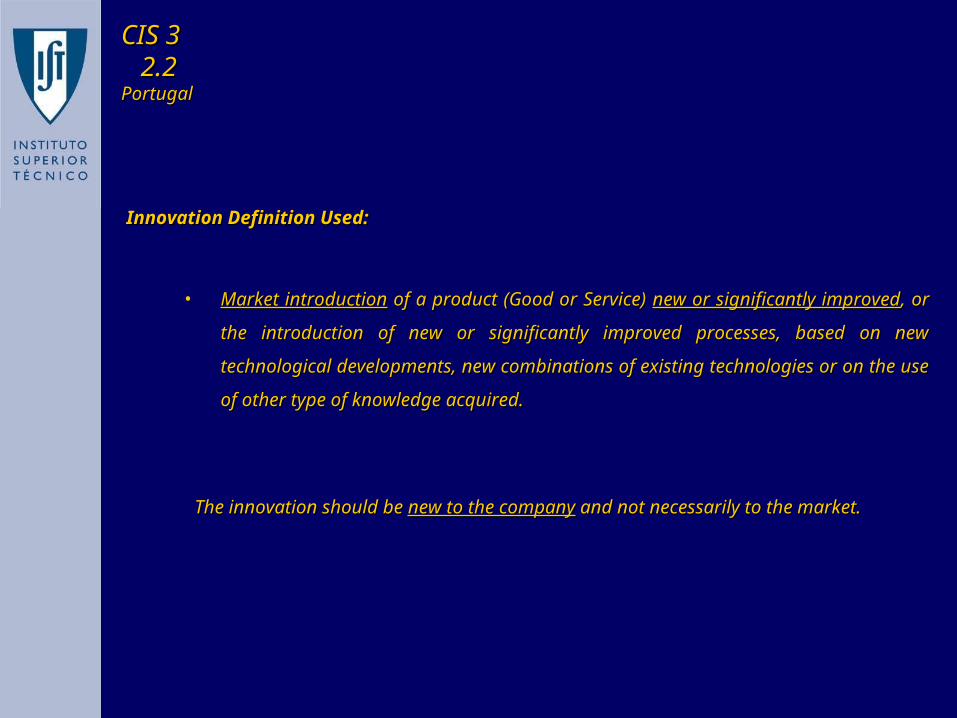
• Market introductionMarket introduction of a product (Good or Service) of a product (Good or Service) new or significantly new or significantly
improvedimproved, or the introduction of new or significantly improved processes, , or the introduction of new or significantly improved processes,
based on new technological developments, new combinations of existing based on new technological developments, new combinations of existing
technologies or on the use of other type of knowledge acquired.technologies or on the use of other type of knowledge acquired.
The innovation should be The innovation should be new to the companynew to the company and not necessarily to the market. and not necessarily to the market.
CIS 3CIS 32.22.2
PortugalPortugal
QuestionnaireQuestionnaire
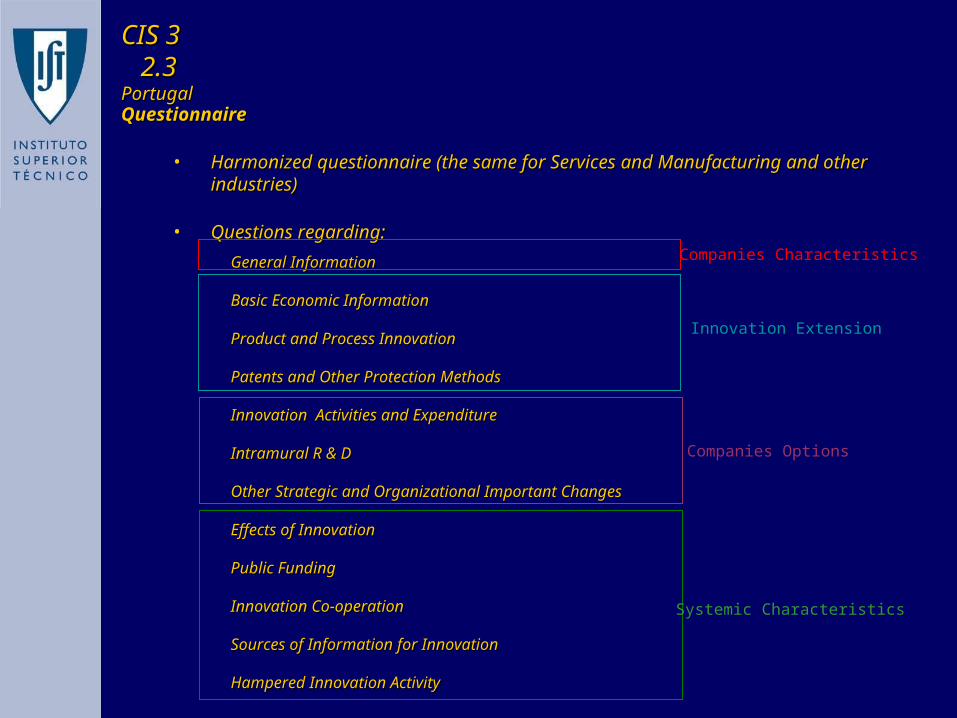
• Harmonized questionnaire (the same for Services and Manufacturing and Harmonized questionnaire (the same for Services and Manufacturing and other industries)other industries)
• Questions regarding:Questions regarding:
General InformationGeneral Information
Basic Economic InformationBasic Economic Information
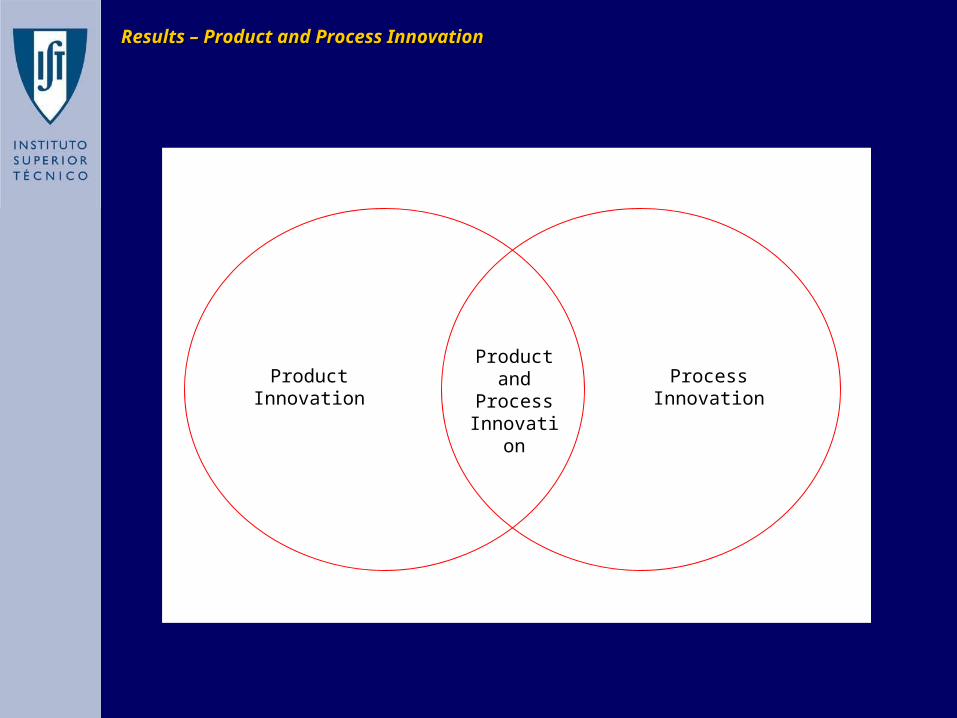
Product and Process InnovationProduct and Process Innovation
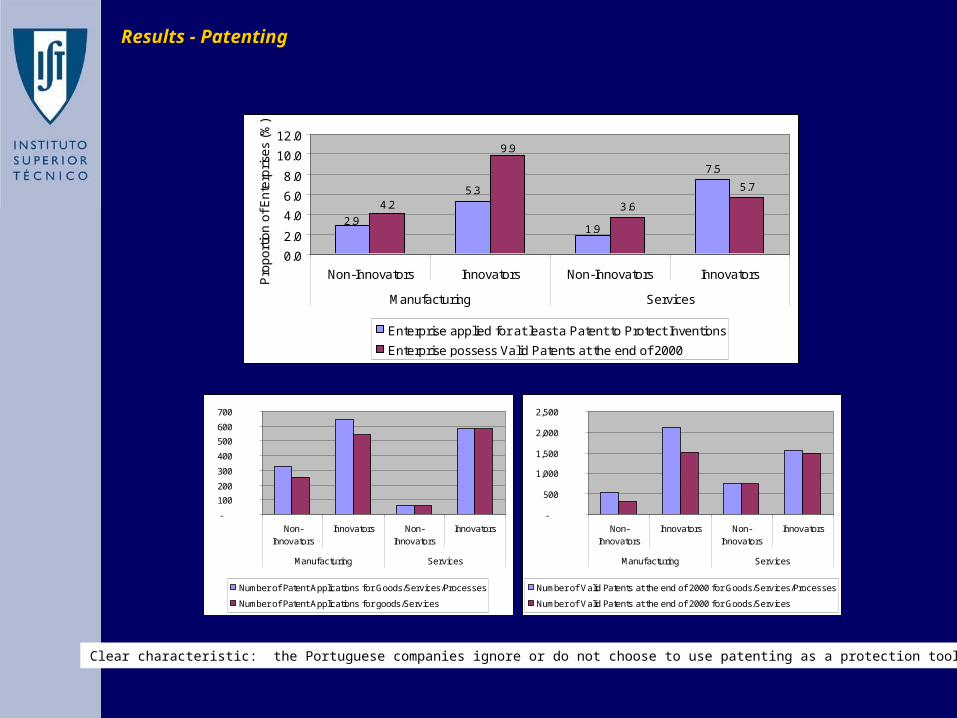
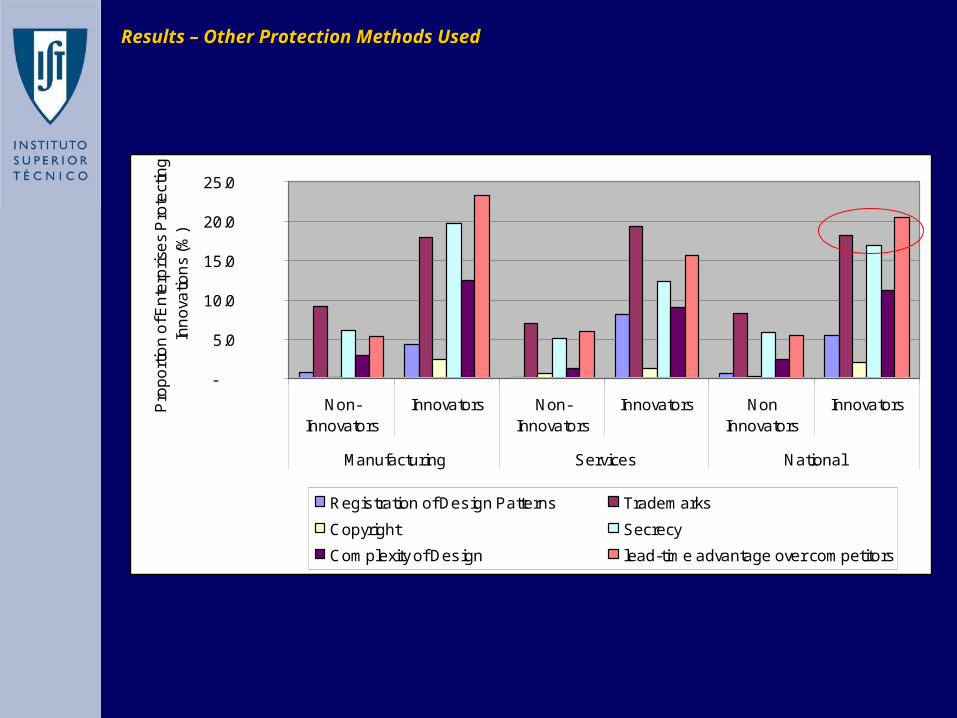
Patents and Other Protection MethodsPatents and Other Protection Methods
Innovation Activities and ExpenditureInnovation Activities and Expenditure
Intramural R & DIntramural R & D
Other Strategic and Organizational Important ChangesOther Strategic and Organizational Important Changes
Effects of InnovationEffects of Innovation
Public FundingPublic Funding
Innovation Co-operationInnovation Co-operation
Sources of Information for InnovationSources of Information for Innovation
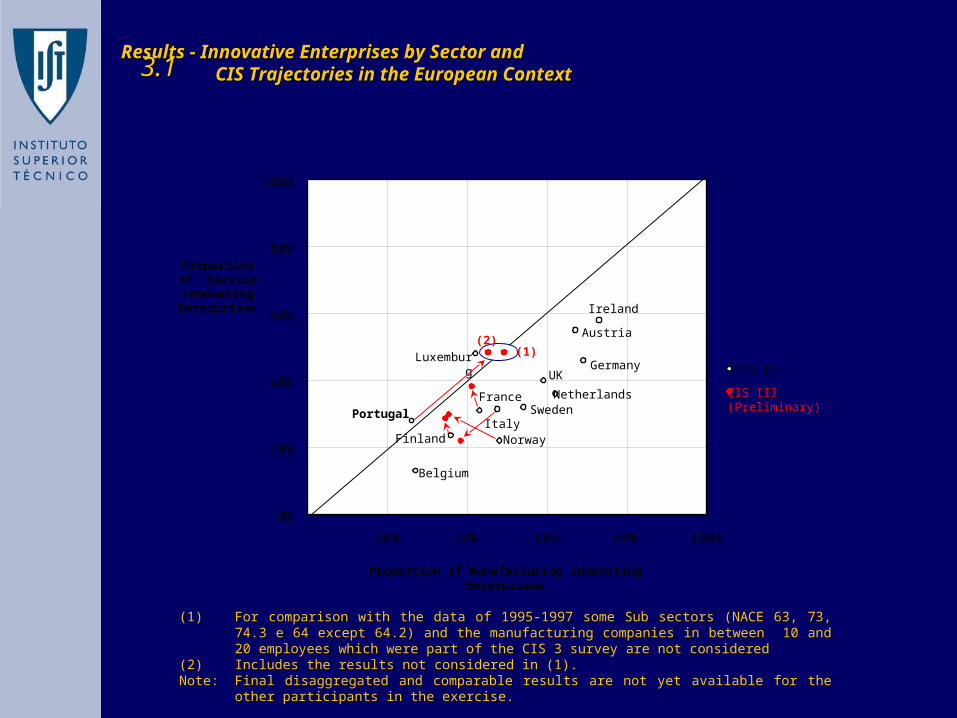
Results - Innovative Enterprises by Sector and Results - Innovative Enterprises by Sector and CIS Trajectories in the European ContextCIS Trajectories in the European Context
Ireland
Austria
Germany
Netherlands
UK
Sweden
Norway
France
Luxemburg
Belgium
0%
20%
40%
60%
80%
100%
20% 40% 60% 80% 100%
Proportion of Manufacturing Innovating Enterprises
Proportion of Service
Innovating Enterprises
PortugalItaly
(1) For comparison with the data of 1995-1997 some Sub sectors (NACE 63, 73, 74.3 e 64 except 64.2) and the manufacturing companies in between 10 and 20 employees which were part of the CIS 3 survey are not considered
(2) Includes the results not considered in (1).Note: Final disaggregated and comparable results are not yet available for the other
participants in the exercise.
(1)(2)
CIS III(Preliminary)
CIS II
Finland
3.13.1
Ireland
GermanyAustria
NetherlandsUK
Sweden
NorwayFrance
Finland
BelgiumPortugal
0%
20%
40%
60%
80%
0.0% 2.0% 4.0% 6.0% 8.0%
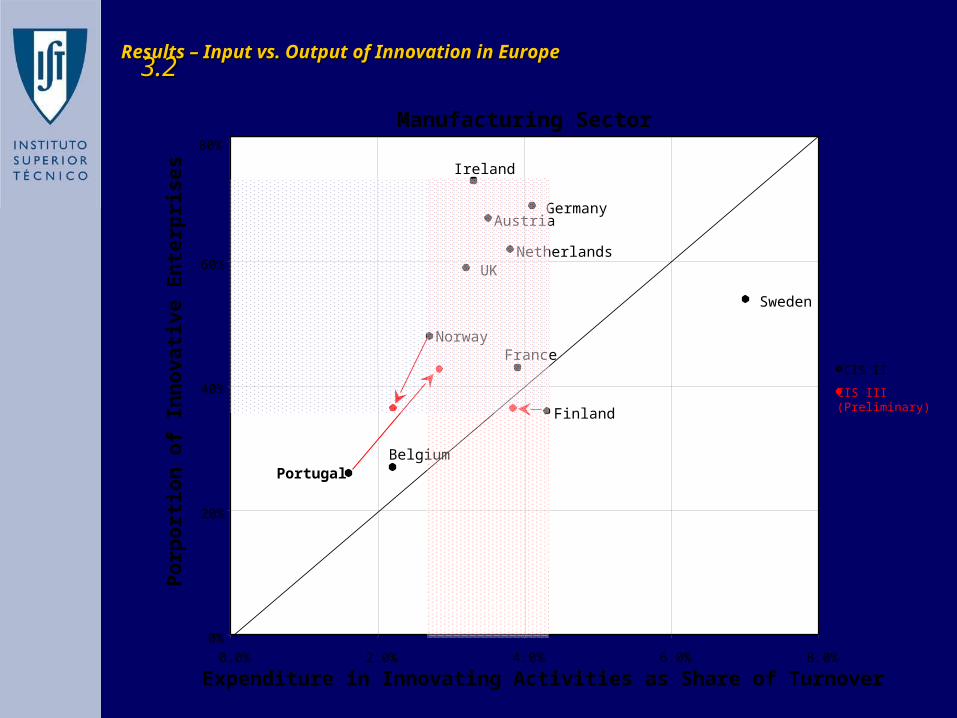
Expenditure in Innovating Activities as Share of Turnover
Po
rpo
rtio
n o
f In
no
va
tiv
e E
nte
rpri
se
s
Manufacturing Sector
CIS III(Preliminary)
CIS II
Results – Input vs. Output of Innovation in EuropeResults – Input vs. Output of Innovation in Europe3.23.2
Logistic Regression(Manufacturing)
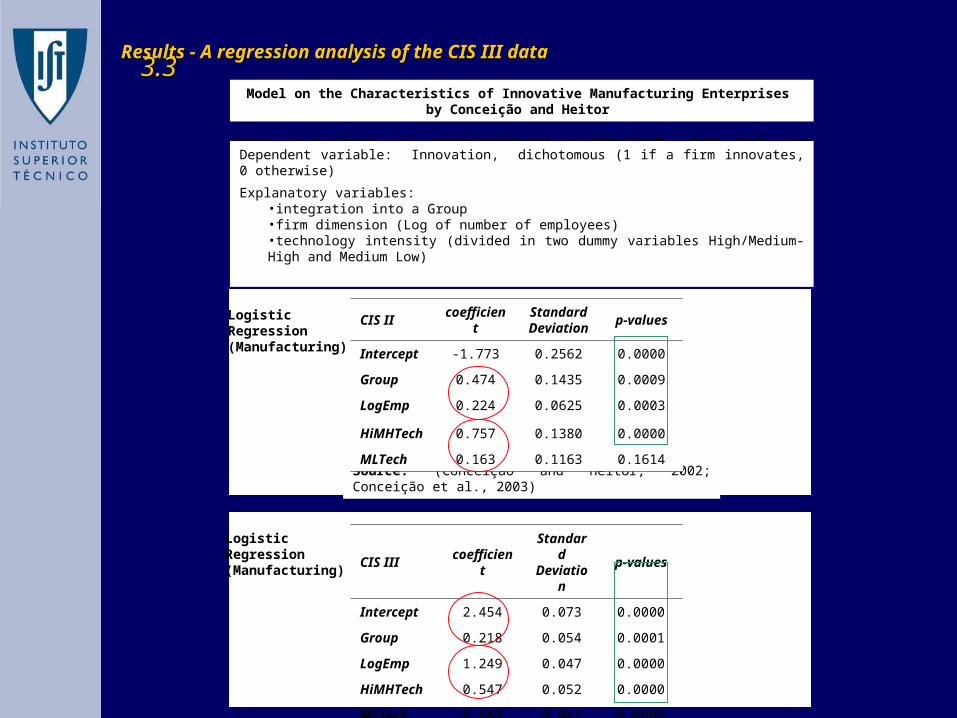
Source: (Conceição and Heitor, 2002; Conceição et al., 2003)
Logistic Regression(Manufacturing)
Results - A regression analysis of the CIS III dataResults - A regression analysis of the CIS III data
err MLTech * f HiMHTech * d loyees)Log(no.Emp * c Group * b a Innov iiiii
Model on the Characteristics of Innovative Manufacturing Enterprises by Conceição and Heitor
Dependent variable: Innovation, dichotomous (1 if a firm innovates, 0 otherwise)
Explanatory variables:•integration into a Group•firm dimension (Log of number of employees)•technology intensity (divided in two dummy variables High/Medium-High and Medium Low)
CIS II coefficientStandard Deviation
p-values
Intercept -1.773 0.2562 0.0000
Group 0.474 0.1435 0.0009
LogEmp 0.224 0.0625 0.0003
HiMHTech 0.757 0.1380 0.0000
MLTech 0.163 0.1163 0.1614
CIS III coefficientStandard Deviation
p-values
Intercept 2.454 0.073 0.0000
Group 0.218 0.054 0.0001
LogEmp 1.249 0.047 0.0000
HiMHTech 0.547 0.052 0.0000
MLTech 0.589 0.041 0.0000
3.33.3
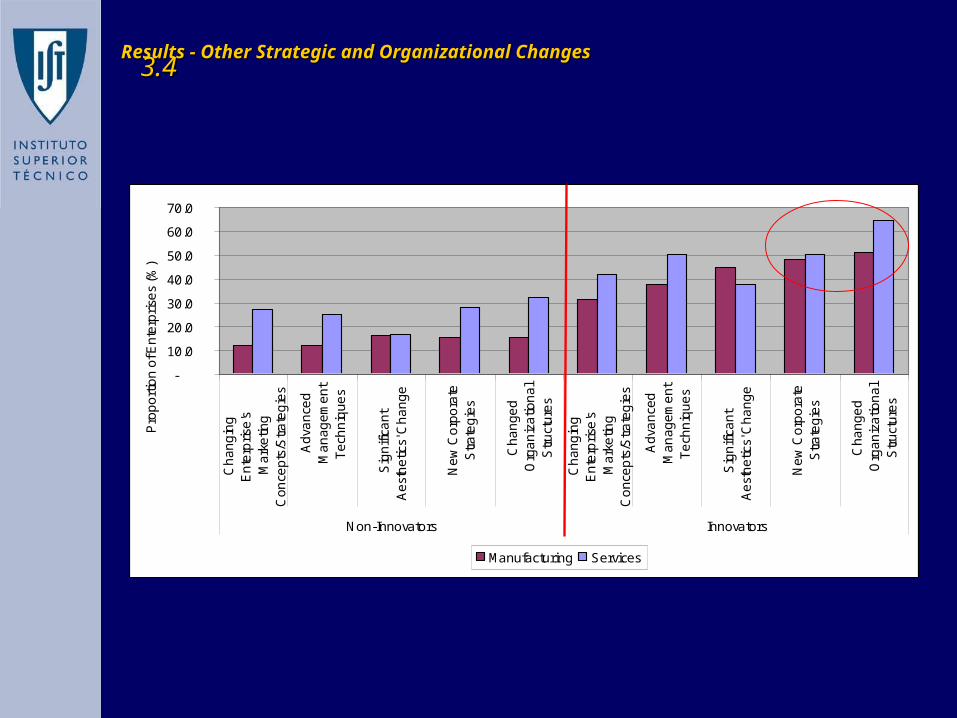
Results - Other Strategic and Organizational ChangesResults - Other Strategic and Organizational Changes
-
10.0
20.0
30.0
40.0
50.0
60.0
70.0
Ch
an
gin
gE
nte
rpri
se's
Ma
rke
ting
Co
nce
pts
/Str
ate
gie
s
Ad
van
ced
Ma
na
ge
me
nt
Te
chn
iqu
es
Sig
nifi
can
tA
est
he
tics'
Ch
an
ge
Ne
w C
orp
ora
teS
tra
teg
ies
Ch
an
ge
dO
rga
niz
atio
na
lS
tru
ctu
res
Ch
an
gin
gE
nte
rpri
se's
Ma
rke
ting
Co
nce
pts
/Str
ate
gie
s
Ad
van
ced
Ma
na
ge
me
nt
Te
chn
iqu
es
Sig
nifi
can
tA
est
he
tics'
Ch
an
ge
Ne
w C
orp
ora
teS
tra
teg
ies
Ch
an
ge
dO
rga
niz
atio
na
lS
tru
ctu
res
Non-Innovators Innovators
Pro
po
rtio
n o
f En
terp
rise
s (%
)
Manufacturing Services
3.43.4
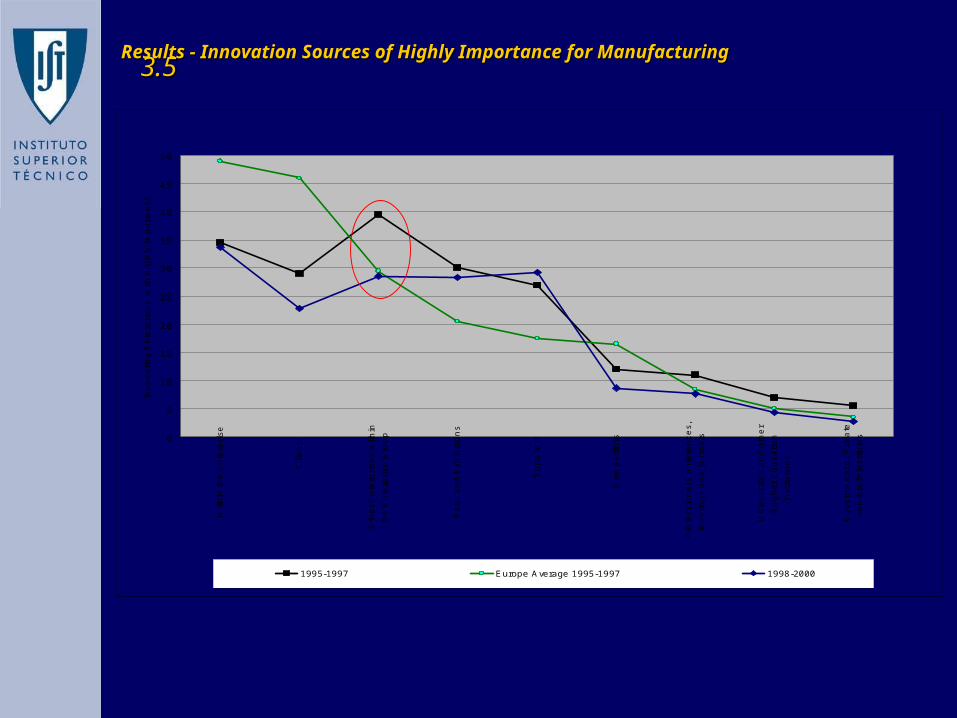
Results - Innovation Sources of Highly Importance for ManufacturingResults - Innovation Sources of Highly Importance for Manufacturing
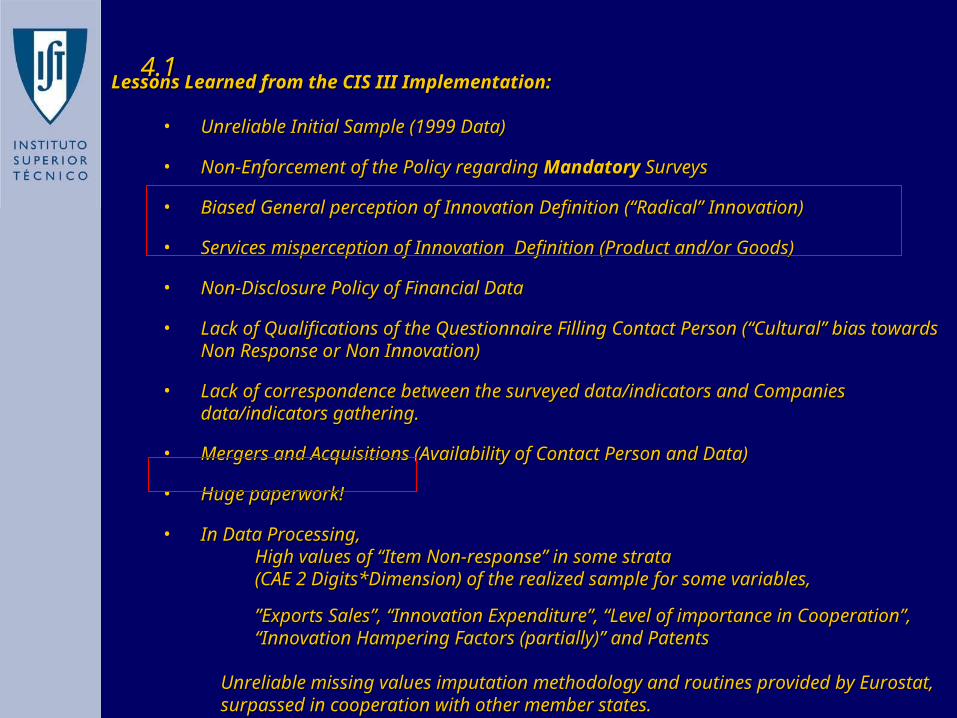
• Non-Enforcement of the Policy regarding Non-Enforcement of the Policy regarding MandatoryMandatory Surveys Surveys
• Biased General perception of Innovation Definition (“Radical” Innovation)Biased General perception of Innovation Definition (“Radical” Innovation)
• Services misperception of Innovation Definition (Product and/or Goods)Services misperception of Innovation Definition (Product and/or Goods)
• Non-Disclosure Policy of Financial DataNon-Disclosure Policy of Financial Data
• Lack of Qualifications of the Questionnaire Filling Contact Person (“Cultural” Lack of Qualifications of the Questionnaire Filling Contact Person (“Cultural” bias towards Non Response or Non Innovation)bias towards Non Response or Non Innovation)
• Lack of correspondence between the surveyed data/indicators and Companies Lack of correspondence between the surveyed data/indicators and Companies data/indicators gathering.data/indicators gathering.
• Mergers and Acquisitions (Availability of Contact Person and Data)Mergers and Acquisitions (Availability of Contact Person and Data)
• Huge paperwork!Huge paperwork!
• In Data Processing,In Data Processing,High values of “Item Non-response” in some strata High values of “Item Non-response” in some strata (CAE 2 Digits*Dimension) of the realized sample for some variables,(CAE 2 Digits*Dimension) of the realized sample for some variables,
”Exports Sales”, “Innovation Expenditure”, “Level of importance in ”Exports Sales”, “Innovation Expenditure”, “Level of importance in Cooperation”, “Innovation Hampering Factors (partially)” and PatentsCooperation”, “Innovation Hampering Factors (partially)” and Patents
Unreliable missing values imputation methodology and routines provided by Unreliable missing values imputation methodology and routines provided by Eurostat, surpassed in cooperation with other member states.Eurostat, surpassed in cooperation with other member states.
4.14.1
Lessons Learned and Conclusions:Lessons Learned and Conclusions:
1.1. The CIS is a good evolving instrument for benchmarking and follow up of The CIS is a good evolving instrument for benchmarking and follow up of
the best practices, although incomplete in what concerns the systemic the best practices, although incomplete in what concerns the systemic
characteristics of innovation.characteristics of innovation.
2.2. A significant increase in the innovation extension and in the firms A significant increase in the innovation extension and in the firms
innovation expenditure was achieved for Portugal in CIS III compared to innovation expenditure was achieved for Portugal in CIS III compared to
CIS II.CIS II.
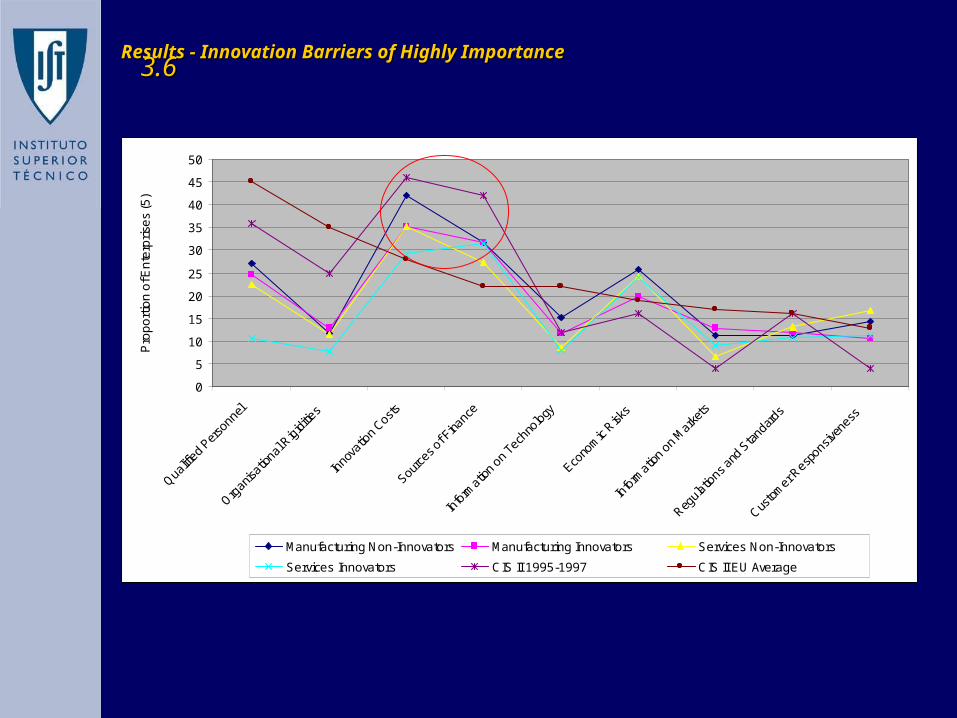
3.3. In the innovation process, both sources and barriers to innovation profiles In the innovation process, both sources and barriers to innovation profiles
remain consistent with the CIS II data, where the most relevant are remain consistent with the CIS II data, where the most relevant are
respectively “Within the Enterprise” and financial constraints. respectively “Within the Enterprise” and financial constraints.
4.4. Innovation expenditure has reached a milestone above which innovation Innovation expenditure has reached a milestone above which innovation
effectiveness appears to be more correlated with factors of systemic effectiveness appears to be more correlated with factors of systemic
nature.nature.
5.5. Technological innovation appears to be strongly correlated with Technological innovation appears to be strongly correlated with
Organizational Innovation and Change.Organizational Innovation and Change.
4.24.2
Determinants of Innovation in Portugal.Determinants of Innovation in Portugal. Designing, implementing and Analyzing Evidence fromDesigning, implementing and Analyzing Evidence from
the 3 the 3rdrd Community Innovation Survey Community Innovation Survey
Manuel João de Albuquerque Rocha Pereira Bóia Manuel João de Albuquerque Rocha Pereira Bóia
Orientador:Orientador: Doutor Pedro Filipe Teixeira da ConceiçãoDoutor Pedro Filipe Teixeira da ConceiçãoInstituto Superior Técnico – Universidade Técnica de LisboaInstituto Superior Técnico – Universidade Técnica de Lisboa
3 September3 September 2003 2003
Additional SlidesAdditional Slides
CIS 3CIS 3PortugalPortugal
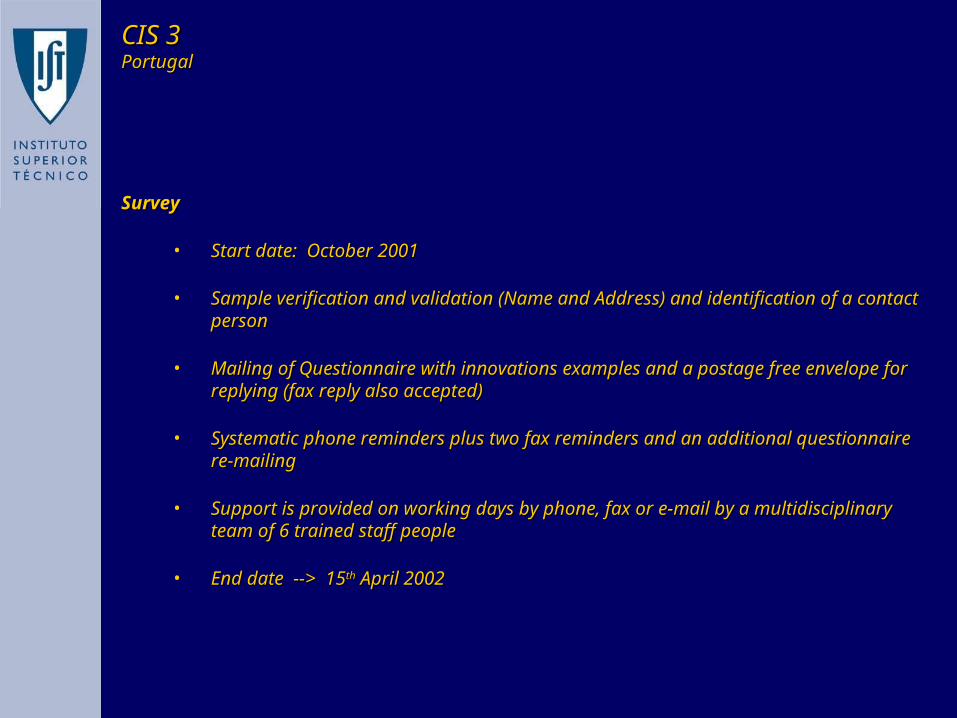
SurveySurvey
• Start date: October 2001Start date: October 2001
• Sample verification and validation (Name and Address) and identification of Sample verification and validation (Name and Address) and identification of a contact persona contact person
• Mailing of Questionnaire with innovations examples and a postage free Mailing of Questionnaire with innovations examples and a postage free envelope for replying (fax reply also accepted)envelope for replying (fax reply also accepted)
• Systematic phone reminders plus two fax reminders and an additional Systematic phone reminders plus two fax reminders and an additional questionnaire re-mailingquestionnaire re-mailing
• Support is provided on working days by phone, fax or e-mail by a Support is provided on working days by phone, fax or e-mail by a multidisciplinary team of 6 trained staff peoplemultidisciplinary team of 6 trained staff people
• End date --> 15End date --> 15thth April 2002 April 2002
Response RatesResponse Rates
CIS 3CIS 3PortugalPortugal
ValidResp. Rate
ValidResp. Rate
ValidResp. Rate
Valid Resp. Rate
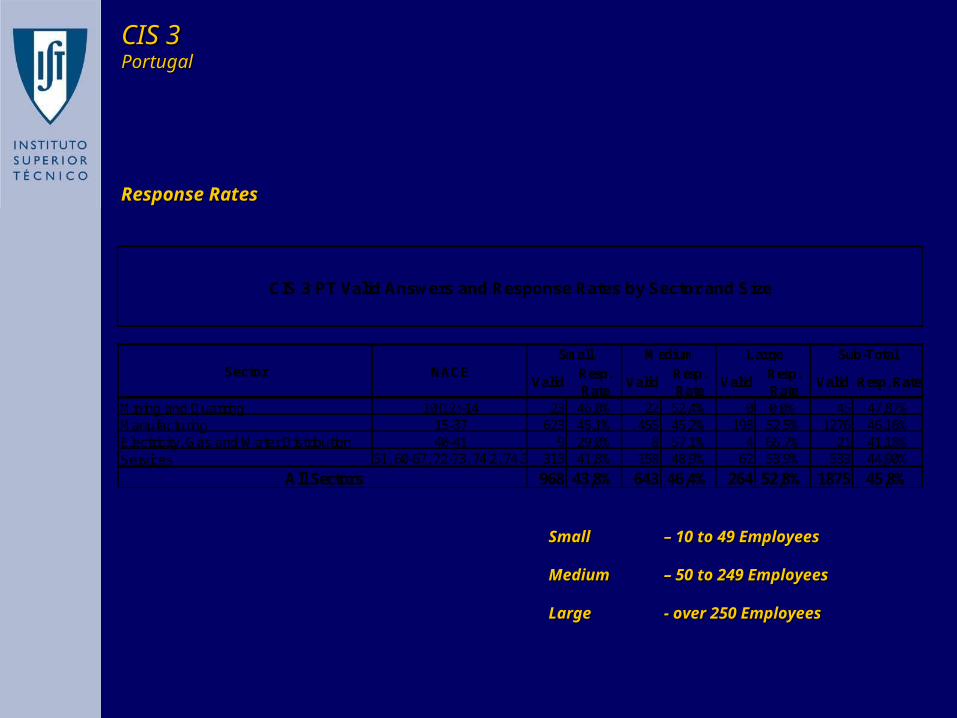
Mining and Quarring 10(12)-14 23 46,0% 22 52,4% 0 0,0% 45 47,87%Manufacturing 15-37 623 45,1% 455 45,2% 198 52,5% 1276 46,16%Electricity, Gas and Water Distribution 40-41 9 29,0% 8 57,1% 4 66,7% 21 41,18%Services 51, 60-67, 72-73, 74.2, 74.3 313 41,8% 158 48,9% 62 53,9% 533 44,90%
968 43,8% 643 46,4% 264 52,8% 1875 45,8%
Sector
All Sectors
CIS 3 PT Valid Answers and Response Rates by Sector and Size
Small Medium Large NACE
Sub-Total
Small Small – 10 to 49 Employees– 10 to 49 Employees
Medium Medium – 50 to 249 Employees– 50 to 249 Employees
Large Large - over 250 Employees- over 250 Employees
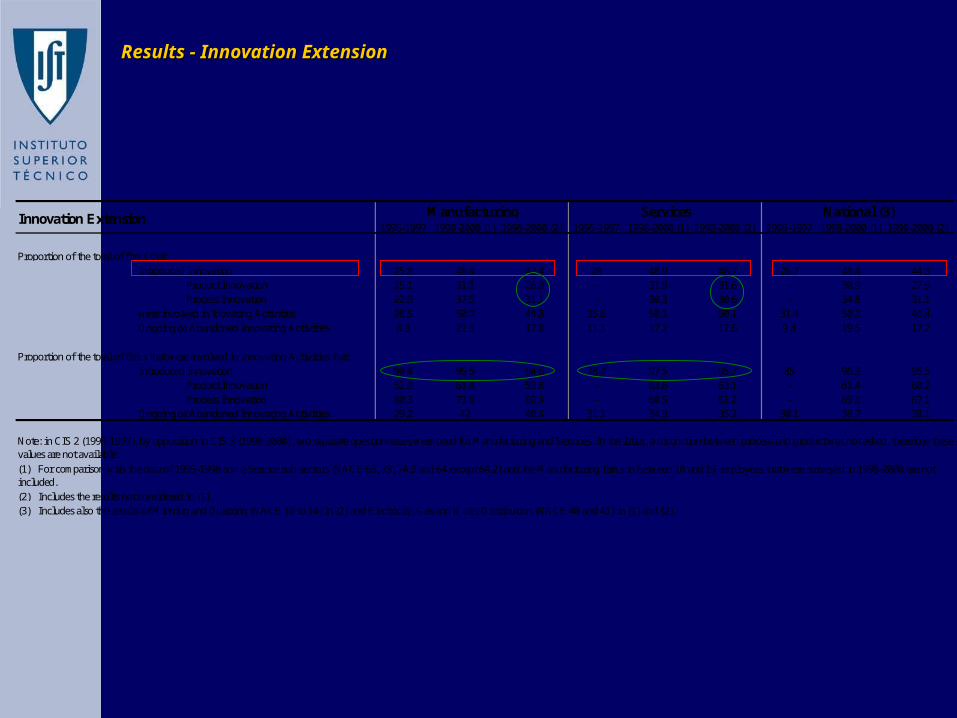
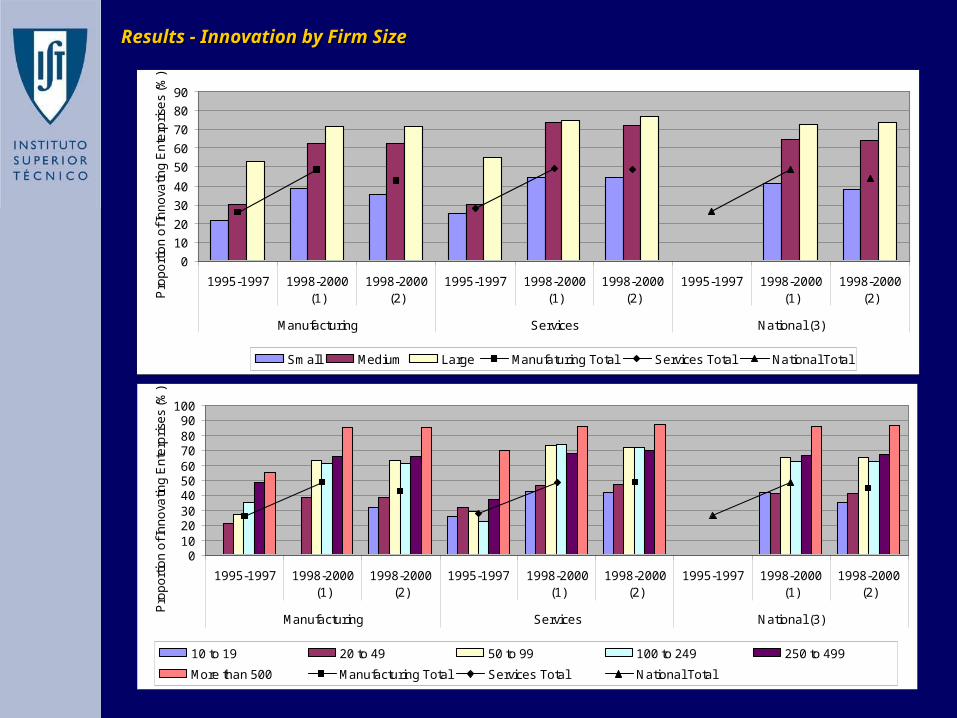
(3) Includes also the results of Minning and Quarring (NACE 10 to 14) in (2) and Electricity, Gas and Water Distribution (NACE 40 and 41) in (1) and (2).
Note: in CIS 2 (1995-1997), by opposition to CIS 3 (1998-2000), two separate questionnaires were used for Manufacturing and Services. In the latter, a distinction between process and product was not asked, therefore these values are not available.
Proportion of the total of firms that were involved in Innovating Activities that:
Proportion of the total of firms that:
National (3)
(1) For comparison with the data of 1995-1998 some Service sub-sectors (NACE 63, 73, 74.3 and 64 except 64.2) and the Manufacturing firms in between 10 and 19 employees that were surveyed in 1998-2000 are not included.