96
DETERMINANTS OF INPUTS DEMAND AND ADOPTION OF GRAIN LEGUMES AND ASSOCIATED TECHNOLOGIES OF N2Africa IN KANO STATE, NIGERIA BY MUHAMMAD, HALLIRU (SPS/12/MEX/00006) AUGUST, 2015
DETERMINANTS OF INPUTS DEMAND AND ADOPTION OF GRAIN
LEGUMES AND ASSOCIATED TECHNOLOGIES OF N2Africa IN KANO
STATE, NIGERIA
BY
MUHAMMAD, HALLIRU
(SPS/12/MEX/00006)
AUGUST, 2015

DETERMINANTS OF INPUTS DEMAND AND ADOPTION OF GRAIN
LEGUMES AND ASSOCIATED TECHNOLOGIES OF N2Africa IN KANO
STATE, NIGERIA
HALLIRU, MUHAMMAD
(SPS/12/MEX/00006)
A DISSERTATION SUBMITTED TO THE DEPARTMENT OF
AGRICULTURAL ECONOMICS AND EXTENSION, FACULTY OF
AGRICULTURE, BAYERO UNIVERSITY, KANO, IN PARTIAL FULFILMENT
OF THE REQUIREMENT FOR THE AWARD OF THE DEGREE OF MASTER
OF SCIENCE (M.SC) IN AGRICULTURAL ECONOMICS
AUGUST, 2015

i
DECLARATION
I hereby declare that this work is the product of my own research efforts; undertaken under the
supervision of Prof. A. Suleiman and Dr. A. Mustapha and has not been presented and will not
be presented elsewhere for the award of a degree in Master of Science. References made to
published literature have been duly acknowledged.
…………………………. ………………………….
Muhammad Halliru Date
(SPS/ 12/MEX/00006)
The above declaration is confirmed
…………………………. ………………………….
Prof. A. Suleiman Date
(Supervisor)

ii
CERTIFICATION
This Project Entitled Determinants of Inputs Demand And Adoption of Grain Legumes And
Associated Technologies of N2africa In Kano State, Nigeria by Muhammad Halliru with the
Registration number SPS/12/MEX/00006 meets the regulations governing the award of Master
Degree in Bayero University, Kano and approved its contribution to knowledge and literary
presentation.
______________________ _______________
Prof. A. Suleiman. Date
(Supervisor)
______________________ _______________
Dr. A. Mustapha Date
(Internal Examiner)
______________________ _______________
Prof. A. Suleiman. Date
(Head, Department of Agricultural Economics and Extension)

iii
APPROVAL PAGE
This is to Certify that, this Dissertation Title “ Determinants of Inputs Demand and Adoption of
Grain Legumes and Associated Technologies of N2Africa in Kano-Nigeria” Prepared By
HALLIRU MUHAMMAD (SPS/12/MEX/00006) Has Been Examined and Approved in
Accordance With the Regulations Governing the Award of the Degree of MASTER OF
SCIENCE (M.Sc) IN AGRICULTURAL ECONOMICS
______________________ _______________
Date
(External Examiner)
______________________ _______________
Dr. A. Mustapha Date
(Internal Examiner)
______________________ _______________
Prof. A. Suleiman. Date
(Supervisor)
______________________ _______________
Prof. A. Suleiman. Date
(Head of Department)
______________________ _______________.
Date
(Representative of School of Post Graduate Studies)

iv
ACKNOWLEDGMENTS
All praise is to almighty ALLAH for giving me life, health, and strength of this noble
opportunity of completing this phase of my academic career. I wish to acknowledge distinguish
individuals and academic colleagues that help in bringing this research work to fruition.
Firstly, I would like to express a profound gratitude to my supervisors Prof. Aminu Suleiman and
Dr. Amina Mustapha for their tireless guidance and critical comments which help in bringing
this study to a successful completion. I wish to thank Edward Baars, Emmanuel Sangodele and
N2Africa Project for making this study possible. Special thanks to Prof. J.M. Jibrin, may Allah
reward them all. I am also greatly indebted to N2Africa staff specifically Bassey Ukem, Esther
Chinedu, Kaka T. Bukar and George Uchiebe all at IITA Kano Station, Nigeria.
I also want to express my sincere appreciation to acknowledge the contribution of Dr. A.B
Mohammed, Prof. A. Abba, Dr. M.M. Ahmad, Dr. M.I Daneji, Dr. Z. Abdu, Dr. Ali Abdullahi, I.
Tafida, M.S. Suleiman, Z.A. Abdullahi and U. Sani, A.A. Idris, M. Zekeri, A. Mustapha, all from
Department of Agricultural Economics and Extension, Bayero University Kano. Special thanks
to Prof. A.A Manga, Prof. S.G Mohammed and Prof. B.M Auwalu all form Agronomy
Department, BUK. I also express my deepest appreciate to the hard work of M. Abdullahi
Maigarabi and other extension agents particularly for their wonderful and tireless effort during
the phase of data collection for this research.
Special thanks to Dr. A. Muazu, Dr. B. Zakari and Prof. I. Zango, May ALLAH reward them,
Amin. I also extend my gratitude to our entire academic colleagues who have contributed in one
way or another to the success of this research. Never shall I forget the contribution of important
personalities like Alh. Sabiu Alhassan Zango, M. Hassan Y. Gamaji, Baba Saleh Karkarna, Alh.
Lawal Abdu Diza and Kabir UmarMaiadua.
Very special thanks to my parents (Alhaji Halliru Muhammad and Haj. Amina Salisu); brothers
and sisters of mine (Haj. Amina, Haj. Bilkisu, Haj. Fateema, Haj. Hadeeza, Abdurahman,
Hussain, Ibrahim) are unforgettable for their cooperation and assistance in my entire life.
Patience and understanding of my wife (Aisha Bello Dokajo) and son (Muhammad Sudais) has
to be recognized. May ALLAH forgive and reward them all.

v
DEDICATION
This project work is dedicated to the memory of my beloved father Late Alhaji Halliru
Muhammad Daura who train me from childhood to the end of his life

vi
TABLE OF CONTENTS
Contents Page
Declaration - - - - - - - - - - i
Certification - - - - - - - - - - ii
Approval Page - - - - - - - - - iii
Acknowledgement - - - - - - - - - iv
Dedication - - - - - - - - - - v
Table of Contents - - - - - - - - - vi
List of Tables - - - - - - - - - - ix
List of Figures - - - - - - - - - x
List of Abbreviations and Acronyms - - - - - - - xi
Abstract - - - - - - - - - - xii
CHAPTER ONE - - - - - - - - - 1
1.0 INTRODUCTION - - - - - - - - 1
1.1 BACKGROUND TO THE STUDY - - - - - - 1
1.2 PROBLEM STATEMENT - - - - - - - 3
1.3 OBJECTIVES OF THE STUDY - - - - - - - 6
1.4 JUSTIFICATION OF THE STUDY - - - - - - 6
CHAPTER TWO - - - - - - - - - 8
2.0 LITERATURE REVIEW - - - - - - - - 8
2.1 LEGUMES PRODUCTION IN NIGERIA - - - - - 8
2.1.1 Review of Legumes Production in Nigeria - - - - - 8
2.1.2 Prospects of Boosting Grain Legumes Production in Nigeria - - - 9
2.1.3 Constraints and Challenges Affecting Legume Production - - - 12
2.2 CONCEPTUAL FRAME WORK - - - - - - 13
2.2.1 Conceptual Framework on Agricultural Inputs and Demand - - - 13
2.2.2 Conceptual Framework on Adoption of Agricultural Technology - - 21
2.2.3 Conceptual Frame on Regression and Gross Margin Analysis - - 22
2.3 REVIEW OF EMPIRICAL STUDIES - - - - - - 24
2.3.1 Empirical Study on Inputs Demand among Smallholder Farmer - - 24
2.3.2 Empirical Studies on Adoption of Agricultural Technology - - - 26

vii
2.3.3 Empirical Studies on Profitability of Grain Legumes - - - - 29
CHAPTER THREE - - - - - - - - - 31
3.0 METHODOLOGY - - - - - - - - 31
3.1 THE STUDY AREA - - - - - - - 31
3.2 METHOD OF DATA COLLECTION - - - - - - 33
3.3 SAMPLING TECHNIQUE - - - - - - - 31
3.4 DATA ANALYSES - - - - - - - - 34
3.4.1 Descriptive Statistics - - - - - - - - 34
3.4.2 Inferential Statistics - - - - - - - - 35
CHAPTER FOUR - - - - - - - - - 41
4.0 RESULTS AND DISCUSSION - - - - - - - 41
4.1 SOCIO ECONOMIC CHARACTERISTICS OF THE RESPONDENTS - 41
4.1.1 Gender of the Respondents - - - - - - - 42
4.1.2 Marital Status of the Respondents - - - - - - 43
4.1.3 Educational Status of the Farmers - - - - - - 43
4.1.4 Major Source of Income - - - - - - - 44
4.1.5 Cooperative Membership - - - - - - - 44
4.1.6 Ownership Structure of Land - - - - - - - 46
4.1.7 Age of the Respondents - - - - - - - - 46
4.1.8 Household Size of the Respondents - - - - - - 46
4.1.9 Farm Size of the Respondents - - - - - - - 47
4.1.10 Farming Experience - - - - - - - - 47
4.2 FACTORS THAT INFLUENCE INPUT DEMAND AMONG LEGUME FAMERS 48
4.3 ADOPTION AND FACTORS INFLUENCING ADOPTION OF GRAIN LEGUME 52
4.3.1 Awareness and Adoption of Grain Legumes Production - - - 52
4.3.2 Adoption Score of N2africa Legumes Production Technology - - - 52
4.3.3 Factors Influencing Adoption of Grain Legumes - - - - - 53
4.4 AVERAGE COST AND RETURN ANALYSIS OF LEGUMES PRODUCTION 55
4.5 INPUT-OUTPUT RELATIONSHIP OF LEGUMES PRODUCTION - - 59
4.6 CONSTRAINTS AFFECTING INPUTS DEMAND AND ADOPTION OF N2AFRICA
TECHNOLOGY - 62

viii
4.6.1 Constraints Militating Against Smallholder Farmers Input Demand - - 62
4.6.2 Constraints Militating Against Adoption of N2africa Legumes Technology - 64
CHAPTER FIVE - - - - - - - - - 65
5.0 SUMMARY, CONCLUSION AND RECOMMENDATIONS - - 65
5.1 SUMMARY - - - - - - - - - 65
5.2 CONCLUSION - - - - - - - - - 67
5.3 RECOMMENDATIONS - - - - - - - - 68
REFERENCES - - - - - - - - - 70
APPENDICES - - - - - - - - - 77
ix
LIST OF TABLES
Table 1: Summary of the Project Area
Table 2: Summary of the Sampling
Table 3a: Qualitative Socioeconomic Characteristics of the Respondents
Table 3b: Quantitative Socioeconomic Characteristics of the Respondents
Table 4: Multiple Regression Analysis for Determinants of Inputs Demand
Table 5: Adoption of N2africa Legumes Production
Table 6: Adoption Score of N2Africa Legumes Production Technology
Table 7: Logit Regression Result of Factors that Influence Adoption of Grain Legumes
Table 8: Profitability Analysis of Legumes Production
Table 9: Multiple Regression Analysis for Input-Output Relationship in Legumes Production
Table 10: Constraints Militating Against Smallholder Farmers Inputs Demand
Table 11: Constraints Militating Against Adoption of N2Africa Grain Legumes production

x
LIST OF FIGURES
Figure 1: N2Africa Action Areas 2014

xi
LIST OF ABBREVIATIONS AND ACRONYMS
CADP Commercial Agricultural Development Programme
FAO Food and Agricultural Organization
FMARD Federal Ministry of Agriculture and Rural Development
IAR Institute of Agricultural Research
IFAD International Fund for Agricultural Development
IITA International Institute for Tropical Agriculture
LDCs Less Developed Countries
MLE Maximum Likelihood Estimate
NSS National Seed Service
NAAE Nigerian Association of Agricultural Economists
NCAM National Centre for Agricultural Mechanization
NPC National Population Commission
NPA Non-Project Area
NCRI National Cereal Research Institute
NSPFS National Special Programme for Food Security
OLS Ordinary Least Square
PA Project Area
SSA Sub-Saharan Africa
USAID United State Agency for International Development
VODEP Vegetable Oil Development Programme

xii
ABSTRACT
The study analyzed the determinants of inputs demand and adoption of grain legumes and
associated technologies of N2Africa in Kano State. Multi-stage sampling technique was used for
the study. Primary data were collected using structured questionnaire. 150 farmers were sampled
each from project area and non project area making a total of 300 farmers. The analytical tools
employed include descriptive statistics, multiple regression, gross margin analysis and logistic
regression. The results shows that farmers in project and non-project area possess element of
similarity in terms of socio-economic characteristics especially gender, marital status, major
source of income and land ownership. Multiple regressions for determinants of inputs revealed
that annual income and farm size has positive coefficient and were statistically significant, while
price of inputs and distance to inputs source has negative coefficients and were also statistically
significant. The adjusted R2
values in respect of project area were 32%, 47% and 48% for
fertilizers, seeds and agrochemicals respectively. Also the corresponding adjusted R2
values were
44%, 37% and 49% for the legume enterprises in the non project area. Logit regression result
shows that household size, annual income, farming experience and educational status are the
factors that influence adoption of grain legumes. Gross margin analysis revealed that legume
production is profitable in both project and non-project areas but the gross revenue obtained is
higher in project area. Gross margin (per hectare) in the project area was NGN126,195.45,
NGN120,853.05 and NGN75,342.17 for soybean, cowpea and groundnut enterprises. In non-
project area, gross margin of NGN50,027.11, NGN65,837.91 and NGN6,799.28 were obtained
for soybean, cowpea and groundnut. Multiple regression for input-output relationship shows that
farm size, fertilizers and seeds were statistically significant within the project area having
adjusted R2 of 77.4%, 84% and 74.9%; while 82.9%, 86.4% and 74.4% were obtained in the non
project area for soybean, cowpea and groundnut. Constraints affecting input demand include
high cost of fertilizers and improved seeds, lack of inoculants and late arrival of inputs while
adoption of grain legumes is affected by attack of pest and diseases, drought problems and low
price of output. Farmers should be encouraged to produce legume through adequate training on
legumes production techniques including efficient utilization of labour and other resources as
well as proper disease and pest management. There is also the need for sustainable input supply
policy that will ensure availability, accessibility, affordability and timely delivery of agricultural
inputs for better legume production in the study area.

1
CHAPTER ONE
1.0 INTRODUCTION
1.1 Background to the Study
Agricultural research systems are generally responsible for generating and developing
innovations for increasing agricultural productivity. Technology development and
transfer play a crucial role in attaining the main goal to increase agricultural output,
productivity and farmers’ income. Adoption of recommended technologies implies that
technologies are relevant to the farmers' circumstances. If farmers become aware of
technologies or modifications in the use of resources that are relevant to their
circumstances and can improve their farm production and thus their welfare, they will
most likely adopt these changes (World Bank, 2011).
N2Africa is a development research introduced to Nigeria with sole objective of ensuring
nitrogen fixation to African soil for increased productivity, farmers’ income and overall
living standard of the smallholder farmers. The project is sponsored by Bill and Melinda
foundation and is being run by Weignigen University, Netherland in collaboration with
International Institute for Tropical Agriculture (IITA). The program focus on adoption of
grain legumes (cowpea, soybean and groundnut) and some associated technologies
specifically. These associated technologies includes the use of purchased inputs such as
seeds, inoculants and fertilizers as well as other good recommended agricultural
practices. These recommended practices includes seeds planting, appropriate spacing
(inter and intra-row spacing) and good management among others for better productivity.
(N2Africa, 2012).

2
It is widely accepted that increased use of purchased inputs (seeds, chemicals and
fertilizers) has a critical place, alongside organic soil fertility enhancement practices. This
is the technical change needed for sustained smallholder agricultural growth in Africa.
However, purchased input use is very low amongst the farmers especially from Sub-
Saharan Africa and has remained largely static over the last 20 years, with particularly
low usage in smallholder food-crop production where constraints on expanded purchased
inputs (seed and fertilizer) use exists on both the supply and demand sides. Adoption of
grain legumes such as cowpea, groundnut and soybean contribute substantially to sustain
crop production through their ability to fix atmospheric nitrogen, some of which is left
behind in the soil after harvesting for subsequent crops. However the use of other
associated technologies such as seeds, inoculants and labour saving technologies has
greater potentials to accomplish increase of agricultural output, productivity and farmers’
income (Assa, Mehire, Ngoma, Magombo and Gondwe, 2014).
Distance to production inputs also plays a significant role in the use of inputs among
smallholder farmers. Assa, (2014) reported that distance plays a negative effect on the
use of purchased inputs. Farmers are also constrained by the lack of information on, for
example, prices, time to apply inputs, yield responses, appropriate inputs, fragmented
landholdings etc. Even assuming that the information exists, it may not be within easy
reach of farmers because extension services within the country have been severely
affected by public sector budgetary constraints leaving many workers with their salaries
paid but without funds to visit farmers (Assa, 2014). The decision on the use of
purchased inputs requires information on prices and willingness to purchase inputs.
Willingness to purchase inputs is also affected by risk and uncertainty among farmers.

3
Cowpea (Vigna unguiculata (L.) Walp) is one of the most economically important
indigenous African grain legumes which is adapted to the savanna. Cowpea grain legume
has the potentials of multiple contributions by not only ensuring household food
production but also as cash crop (grain and fodder), source of livestock feed, and soil
ameliorant. The appreciating economic importance was due to its food value which made
it a good supplement/complimentary, source of protein for animal source (meat, egg and
fish). Cowpea contains 20 – 25% of protein and 64% carbohydrate (Modu, 2009). In
addition, the crop also helps in soil improvement by biologically fixing atmospheric
nitrogen in the soil. Cowpea―indigenous to sub-Saharan Africa (SSA), is grown on
about 14 million ha worldwide, with over 84% of this area in SSA. Between 1985 and
2007, the rate of growth was 4.5% in land area planted to cowpea, 4.5% in grain
yields/ha, and 5.9% in quantity of cowpea produced (Rose, 2012).
Soybean (Glycine max L.) may contribute to the N needs of maize in West Africa. This
crop has become increasingly important in Nigeria and has spread to large parts of guinea
savannah zones where it is well adapted. Soybean may contribute to soil N through
biological N2 –fixation, some of which can be available to a subsequent maize crop. It
may also absorb soil nitrate than maize, leaving more for a subsequent crop. It is believed
that soybean production will increase as more farmers become aware of the potential of
the crop, not only for cash/food but also for soil fertility improvement and control
(Agbaje, Ogunbodede and Makinde, 2002)
Groundnut (Arachis hypogea L) is a leguminous crop belonging to the fabaceae family
and is one of the world’s major food legumes grown by both developed and developing
countries. Groundnut seeds contain high quality edible oil (50%), easily digestible protein

4
(25%) and carbohydrate (20%). It is grown on 26.4 million ha worldwide with a total
production of 36.1 million metric tons, and an average productivity of 1.4 metric tons/ha
–1 (FAO, 2004). Groundnut pod yields from farmers’ field are low, averaging about 800
kg ha-1, less than one-third the potential yield of 3000 kg ha-1. This large gap between
actual and potential yields is due to several factors, including non-availability of seeds of
improved varieties for a particular ecology, poor soil fertility, inappropriate crop
management practices, pests and diseases (Ahmed, Rafay, Singh and Verma, 2010).
1.2 Problem Statement
UNDP (1999) revealed that the development of agriculture in Nigeria is not meeting the
demand of its teeming-population, despite the country’s endowment with abundant and
diversified range of natural, human and capital resources and oil revenue. Nigeria has
remained one of the poorest countries in Africa. The transformation of agriculture from
low productive traditional inputs to high productivity modern inputs is a major problem
facing agricultural development in Sub-Saharan African countries including Nigeria
(Ibrahim, 2006). Nigerian Government therefore, in trying to meet up with the teeming
demand and ensure food security in the country has developed several policies and
programmes (example; Green Revolution, Operation Feed the Nation, River Basin
Development Authority And Recently Agricultural Transformation Agenda) to ensure
increase food productivity to meet the demand of it increasing population. However,
these programmes have not been able to adequately solve the food problems. Since the
desired objectives have not been achieved and productivity of food crops has remained
low. This low productivity may likely be attributed to soil fertility problems and other
traditional practices among farmers. Soil fertility can be improved through the use of

5
inorganic fertilizers which is highly expensive and in most cases in accessible to the
farmers. The cost of inorganic fertilizer is very exorbitant that the resource poor farmers
cannot afford even a single bag to apply to their crops for lack of financial resources. The
low output realized by smallholder farmers is an indication that resources needed in the
production of crops are not at optimal levels, (Nweze, 2002; Panwal, 2006; Adinya,
2008).
One of the critical problems hindering improvement in productivities of legumes is the
traditional practices of cropping systems used by majority of the farmers as well as poor
linkage to inputs and output markets. Although improved technologies such as strip
cropping, seeds and inorganic fertilizers have been promoted among farmers, there is still
the need to conduct comprehensive study to obtain information that could facilitate
adoption of N2Africa grain legumes (i.e cowpea, soybean and groundnut) technologies
for better agricultural productivity in Nigeria. In line with this, this research attempts to
find answers to the following questions:
1. What are the socioeconomic characteristics of the legume farmers in the study
area?
2. What are the factors that influence smallholder farmers’ demand for purchase
inputs in the study area?
3. Does socioeconomic characteristics influence adoption of N2Africa grain legumes
technologies of among smallholder farmers?
4. How profitable are legumes production and associated technologies in the study
area?
5. What are the input-output relationships of legumes production in the study area?

6
6. What are the constraints affecting input demand and adoption of grain legumes
and associated technologies of N2Africa?
1.3 Objectives of the Study
The broad objective of the study is to analyze inputs demand and adoption of grain
legumes and associated technologies of N2Africa in Kano State. However, the specific
objectives of the study are to:
1. Describe socioeconomic characteristics of the grain legume farmers
2. determine factors influencing smallholder farmers demand for purchased inputs
3. determine the socioeconomic characteristics that influence adoption of N2Africa
grain legumes technology among farmers in the study area,
4. estimate the profitability of N2Africa grain legumes production technologies in
the study area,
5. evaluate the input-output relationships of N2Africa grain legumes production
technologies in the study area; and,
6. Identify and describe the constraints militating against input demand and adoption
of N2Africa grain legumes technology in the study area.
1.4 Justification of the Study
Adoption of legumes contribute substantially to sustain crop production through their
ability to fix atmospheric nitrogen, some of which is left behind in the soil after
harvesting for subsequent crops to utilize. Increased legumes production from intensified
cropping system can play a key role in income generation in West Africa because of their
multiple uses and fodder in human and animal diet. Legume is an important staple food
and cheap protein source to rural and urban dwellers with the demand for the commodity
7
increasing in the nation. Despite this importance, grain legumes can be grown together
with cereals using certain technologies for the purpose of improving soil fertility
improvement and better productivity. Legumes therefore have a tremendous potential to
contribute to the alleviation of malnutrition specifically amongst the poor.
Hybrid seed, agrochemicals and chemical fertilizer utilization of the smallholder farmers
ought to improve over time and space. Just as there is strong correlation between crop
yield and the volume of purchase input utilization, so there ought to exist a relationship
between the purchased input consumption of the farmer and selected socio-economic
factors (Nwagbo and Achoja, 2001) which are at play in the micro environment in which
the farmer operates. But it is difficult to generalize about the economic variables that are
responsible for the growth in purchased inputs demand. For instance, variables which
may correlate with purchase input consumption may relate to price of farm produce,
market access conditions, fertilizer price per bag, farm size, farm income to mention but a
few and each could have its own set of assumption (Assa, 2014). This study will try to
investigate the potentials of grain legumes and associated technologies especially issues
of adoption and profitability. This research is also important particularly to farmers and
other investors in realizing the relevance of cropping system in soil fertility improvement
for better productivity. The research will also provide information that are useful to
policy makers in the development of policies that are important to improve agricultural
productivity in Nigeria. This research work will be of great importance to other
researchers in future and it will serve as the basis for further research that could
contribute to improvement of livelihoods of the teaming population of smallholder
producers in the study area.

8
CHAPTER TWO
2.0 LITERATURE REVIEW
2.1 LEGUMES PRODUCTION IN NIGERIA
This component presents review of legume production in Nigeria, potentials of boosting
legumes production as well as constraints affecting legumes production in Nigeria.
2.1.1 Review of Grain Legumes Production in Nigeria
Grain legumes include some of the major food and industrial crops of the Nigeria. The
major legumes grown in Nigeria include groundnut, soybean and cowpea. These crops
occupy a large proportion of cultivated area and are grown under a wide range of agro-
ecological conditions, although the distribution varies with the specific ecology within
each zone. They are grown extensively in the North-East, North-West and North-Central
zones, and in the sub-humid and semi-arid regions (Shaib, Aliyu and Bakshi, 1997). A
review of the data reveals that starting from the late 1980s, appreciable increases in
output were recorded in some crops, however, there were abrupt and large shifts in
production which could be explained by extensive research carried out on varietal
improvement by IAR, IITA and NCRI, and the general awareness created among the
farmers on the need for increased food production following campaign programs, such as
the Green Revolution and others.
Grain legumes constitute a substantial percentage of the total crop requirement of Nigeria
to attain the dietary needs of its people. For instance, between 1996 and 2003 aggregate
average demand for groundnut (2.85 MMT) exceeded aggregate average annual
production (2.31 MMT). Furthermore, aggregate average demand for soybean (0.76
MMT was more than double the aggregate average production (0.34 MMT).
9
(Richathofen, Pahl and Nemecek, 2006). Similarly, average annual production of cowpea
between 1996 and 2001 (1.84 MMT) was about 38% below the aggregate average
demand (2.94 MMT). However, the implementation of presidential initiative on
vegetable oil development program (VODEP) led to reasonable growth in output of
groundnut and soybean. For instance, between 2004 and 2007, aggregate average output
of groundnut (3.69 MMT) was more than average demand (3.46 MMT), and aggregate
average output of soybean (1.46 MMT) was higher than the aggregate demand (0.89
MMT). This does not necessarily mean the attainment of self-sufficiency in these grain
legumes but rather suggests that the excess demand had been wholly absorbed by
accelerated production of these legumes by VODEP which had the mandate to increase
the production of vegetable oils during the period (2003-2007) and as such, promoted the
production of these oilseed legumes for the achievement of its objectives. This is an
indication that specific programmes directed at increased production of legumes could
indeed accelerate their production. Similarly, the introduction of improved varieties by
research institutes had increased the output of cowpea from a value of 3.52 MMT in 2001
to as high as 4.98 MMT in 2007 which was more than the aggregate demand during the
period indicating the need for a specialized research institute for grain legumes for further
productivity increases (Richathofen, Pahl and Nemecek, 2006).
2.1.2 Prospects of Boosting Grain Legumes Production in Nigeria
The economic importance of grain legumes rests on their advantage as food and feed
crops because the grains have high calorie value, rich in proteins of high quality to feed
humans and animals and are high income generating. Proteins are food nutrients essential
for growth, repairs and development; however, they are in short supply in many parts of
10
the world. The human consumption of protein, and still more strikingly the ratio of
animal versus total protein in the diet, varies considerably from one part of the world to
the other. In Nigeria, local production of protein rich crops has not been adequately
addressed while most diets consist mostly of carbohydrates. The country had relied
mainly on protein from animal sources. However, the limitations of these sources
include: unfavorable climatic condition for livestock production, inadequate supply and
high cost of production inputs, and high cost of animal products which cannot be
afforded by majority of Nigerians especially the rural poor (Katsa and Maku, 2004). As a
result of these limitations and the concern to bridge the gap between protein requirement
and production, the production of grain legumes as inexpensive sources of protein should
be boosted in the country. According to (IFAD, 2009), protein availability can be boosted
by increasing the supply of grain legumes rather than organizing mostly feeding
programmes based on protein rich foods of animal origin. Similarly, Eskola (2005) stated
that, grain legumes contain as much protein as animal sources and are therefore the most
practical means of eradicating protein malnutrition, since they are a good inexpensive
sources of various 1nutrients, notably protein, iron and B vitamins.
Grain legumes, apart from their uses as food for man and feed for animals, are economic
crops used for exports, production of oil, wines and soap in many parts of the world,
particularly Middle East. Nigeria has untapped potential for increasing GDP in the
utilization of grain legumes. In the event of the ban on importation of vegetable oil into
the country, oilseed legumes have provided excellent sources of raw materials to boost
the local production of vegetable oil. Oil is a valuable product with universal demand,

11
and the possible income from oil extraction is, therefore, often enough to justify the
relatively high cost of setting up and running a small oil milling business (FAO, 2010).
Legumes promote diversity and efficiency in agricultural rotations thereby providing long
term benefits that are difficult to convert into monetary value. Grain legumes are
particularly relevant for sustainable cropping systems as shown by the results of
economic and environmental studies undertaken within the scope of the Concerted
Action Glo-Pro. Unlike other cultivated plants, as a result of the symbiosis with nitrogen-
fixing bacteria, legume crops do not need nitrogen fertilization for optimal growth in
general. Legume crops play very important role in crop rotations, especially in poorer
soils. They are a key component of sustainable agriculture as they contribute to breaking
disease cycles in cereals-rich rotations and improve soil structure. They are also used for
green forage in pure stand or legume/cereal mixtures as well as for green manure to
improve the fertility and structure of poor soils (Szyrmer and Boros, 2006). In a study on
the environmental consequences of diversifying rotations with grain legumes,
Richathofen, Pahl, and Nemecek (2006) found out that, in intensive cropping systems,
with a high proportion of cereals and high N-fertilizer input, the incorporation of grain
legumes has especially beneficial effects on the environment. With respect to pollutant
management, introducing grain legumes in the crop rotation contributes to lower eco and
human toxicity. Less herbicides and fungicides are used because grass weed infestation
and certain diseases in cereal-rich rotations are reduced by the break-up crop effect of
grain legumes. Abayomi, (2001) affirmed that introducing grain legumes in crop
rotations with a high proportion of cereals leads to a slightly higher gross margin by the
break-crop effect of grain legumes. Versteeg, (1998) had earlier reported that, organic

12
inputs from legumes could increase crop yield through improved nutrient supply and/or
improved soil water-holding capacity. Moreover, legumes offer benefits such as
providing cover to reduce soil erosion, maintenance and improvement of soil physical
properties, increasing soil organic matter, cation exchange, microbial activity and
reduction of soil temperature. (Amoo, 2005) also pointed out that, apart from their
beneficial effect of N-fixation in the soil, grain legumes suppress weeds, have less
potential for environmental degradation, and improve soil physical conditions and water
retention.
2.1.3 Constraints and Challenges Affecting Legumes Production in Nigeria
The bulk of the domestic supplies of legumes come from the small-scale farmers. These
producers operate under limitations imposed mostly by poverty and inadequate
knowledge. The grain legume crop sub-sector has also been constrained by escalating
costs of production and reduced purchasing power of farmers; poor state of rural
infrastructure which makes the rural environment unattractive to the younger generation
and rural investment unviable; inadequate availability of inputs, especially improved
seeds, fertilizers, agro-chemicals and farm machinery compared to farmers’ needs; credit;
weak agricultural extension delivery services resulting in ineffective dissemination of
modern farming technologies and poor feedback mechanism for research to respond to
farmers needs; poor funding of agricultural development activities; inadequate
appropriate technology to reduce the drudgery in agricultural production and processing
activities; ineffective control of pest and diseases; and low capacity of the organized
farmer groups in service delivery (IFAD, 2009).
13
2.2 CONCEPTUAL FRAME WORK
This component presents conceptual frame work on inputs demand and adoption of
agricultural innovations.
2.2.1 Conceptual Frame Work on Inputs and Demand
The term agricultural inputs are defined as those raw materials that are subjected into
agricultural production process for the provision of certain output. Agricultural inputs can
either be fixed or variable resources. The variable are those operational resources
commonly required among smallholder farmers which includes fertilizers, seeds and agro
chemicals while the fixed inputs are those durable resources such as the land and other
farm tools. Variable resources constitute the major expenditure mostly among
smallholder farmers as the incomes required for the purchase of such inputs are not
adequate. It is widely accepted that increased demand of purchased inputs (seeds,
chemicals and fertilizers) has a critical place, alongside organic soil fertility enhancement
practices, in the technical change needed for sustained smallholder agricultural
production. However, purchased input use is very low amongst the farmers especially
from Sub-Saharan Africa and has remained largely static over the last 20 years or so, with
particularly low usage in smallholder food-crop production where constraints on
expanded purchased inputs (seed and fertilizer) use exists on both the supply and demand
sides. Five sets of issues are explored as related to inputs demand in Agriculture:
Affordability
Availability
Information
Uncertainty
14
Commercial context
There is no prioritization implicit in the order of the topics, they are all important and
linked by many interrelated issues. Whilst some of these topics may seem obvious, most
have several dimensions. In the following section, where strategies to increase the use of
purchased inputs are explored, the importance of these different dimensions becomes
clearer. Thus, for example, affordability can be improved by a change in the timing of
sales.
Affordability
Many African smallholders cannot afford to buy agricultural inputs. Although this is a
straightforward enough concept, it does encompass different dimensions. At its simplest,
farmers cannot afford inputs because they are too expensive. Many agricultural inputs
have been subject to dramatic price increases as a result of the removal of subsidies, price
controls and currency depreciation. Gibbon (1992) reports that under structural
adjustment in Ghana, fertilizer and pesticide price rises exceeded inflation by a factor of
five or six. In some cases, the price structure and yield response is such that the use of
certain inputs may no longer be justified on crops produced for the domestic market.
Whether or not this is the case, most African smallholders have limited purchasing power
and agricultural inputs represent a major outlay. Whilst there may be some profiteering
by traders, there are many other factors which contribute to the inherently high costs of
delivering inputs to farming areas, under the market and infrastructure conditions
prevailing at the present time. These factors include:
Low volume imports – so less discount for bulk purchases and higher per unit
transport costs (the latter is particularly true of land-locked countries);

15
Dispersed local markets making low volume purchases in a tightly concentrated
seasonal window – which all contribute to high costs per unit of input;
Poor roads and telecommunications, and transport bottlenecks (including the
operation of transport cartels) increase transaction costs;
Payment of bribes in order to obtain timely import clearance on seasonal inputs,
similarly bribes may be needed at other points in the transport chain.
Closely related to price are the cash costs involved in input purchase other than the price
of the input itself (there are other non-cash costs too, including the time needed to find
out about inputs and to source them). The purchase of inputs may require the farmer to
travel to a local (or distant) town, necessitating expenditure on transport and
accommodation, it may also require phone calls (where these are possible), or even
signing up for a larger package which includes unwanted inputs. Some farmers in Uganda
apparently sign up for seed and fertilizer packages available through development
projects, simply to obtain the seed, which is in short supply.
Some inputs would be more affordable if they were available in smaller pack sizes
(notwithstanding the additional packaging costs). African farmers tend to plant small
areas; they plant many crops and they intercrop. When they try out new seed they often
only want small quantities initially and may still demand modest quantities of seed which
is known to them. Obvious though this may be, inputs such as seed are often not available
in sufficiently small pack sizes. Even purpose-built seed handling systems may not have
appropriate pack size capacity. (For example, the Uganda Seed Project, a parastatal
concerned with smallholder seed provision, has the capacity for 25 kg and 10 kg seed
packs. In an attempt to respond to farmer needs, they fill 5 kg and 2 kg packs manually,

16
but recognize that pack sizes of 1 kg and 500 g would be better still.) Whilst retail outlets,
projects or farmers may split packs, this always calls into question seed quality
guarantees.
The decision to purchase inputs for a particular crop may be influenced by access to cash
within the household and traditional domains of decision making. Whilst men are often
involved in the production and marketing decisions concerning traditional cash crops,
women tend to play a greater role in the production and marketing of food crops. They
may find that their husbands do not attach a priority on input needs for these crops, whilst
their own resources may be too stretched to extend to input purchase.
Availability
Even when households can afford inputs, they may be unavailable. Again, there are
several aspects to this. Despite large numbers of farmers, many African countries
represent very small markets for agricultural inputs, largely because of low purchasing
power. Thus many inputs may not be available in the country simply because the
volumes that can be sold are small. Consideration of aggregate availability may conceal
some important distinctions. Fertilizer may not be available in the appropriate
formulations, for instance, or important complementary inputs may not be available,
thereby reducing the effectiveness of the overall package.
Farming is a highly seasonal activity and inputs are needed at very specific times. Some
peak needs can be anticipated (seed at planting time for instance, even if planting dates
shift depending on rainfall), whilst others arise at short notice (the sudden emergence of a
pest requiring rapid action to save the crop). Where inputs need to be imported at short
notice, it is unlikely that the market can respond in time, and even where it is a question

17
of distributing inputs from the capital to rural areas, information and transport constraints
may prevent a sufficiently timely response. For the farmer, the non-availability of inputs
often manifests itself in the first instance in the absence of local agricultural input
retailers. Farmers must generally travel some distance to locate inputs (sometimes to the
capital) with no guarantee of success or affordability. Moreover, where input needs arise
at short notice during the planting season, there is an especially high premium on the
farmer’s time, making the uncertainty and absence of local outlets all the more
problematic.
Access to Information
Information constraints arise at different levels. The information constraint is first of all
apparent in the straightforward lack of reliable information on yield response to, for
example, fertilizer, under the conditions and soils prevailing in farmers’ fields.
Application of inputs at an inappropriate time, or inputs of poor quality, may contribute
to a perception of unreliable information on yield response. Even assuming that the
information exists, it may not be within easy reach of farmers. Extension services in
many countries have been severely affected by public sector budgetary constraints
leaving many workers with their salaries paid but without funds to visit farmers. In many
cases they are doing the best they can in difficult circumstances, but certain problems are
widespread:
Bias towards less poor farmers, men and accessible farmers;
Lack of printed extension material available in local languages;
Messages not suited to conditions which prevail in farmers’ fields;
Inflexibility in adapting messages to farmer needs.
18
As a consequence farmers rely heavily on information available from other sources:
Friends and family;
Farmers with privileged access to information, for example, those involved in
trials, demonstration plots, seed multiplication or contract farming;
NGOs and development projects;
Farmers’ groups and associations;
Radio and newspaper;
Traders and purchasers of farmer crops;
Farm input retail outlets (where they exist);
Information provided with the product.
The first four are likely to have only piecemeal information expanding the farmer’s
knowledge, but with no certainty that s/he has sufficient information on which to make a
well-informed choice between technologies or inputs. Mass media may, in some
countries, provide targeted farmer information services but in many countries provision
for farming communities is weak. Traders can be a good source of information on
preferred varieties and may actually see enough farmers to gain an understanding of
problem remedies that work. Companies buying particular products, or running contract
farmer schemes, are more likely to have knowledgeable field agents.
In an ideal world, retail outlets would offer comprehensive impartial advice on the farm
inputs available. Often, however, there is an incentive for the trader to promote a
particular product, and in many areas there is no alternative supplier to which the farmer
can turn for a second opinion. (Recent work by NRI in India suggests that where retailers
are farmers themselves, and located within the farming community, they are more likely

19
to offer impartial advice.) Where products are retailed in their original packaging,
information provided with the product is likely to comply with international standards
(giving the active ingredients, intended use, recommended rates and methods of
application, and shelf-life). However, this information may be in an inaccessible form
(for example, written in small dense print, in a non-native language, using technical
terms). Such inaccessibility may extend to the retailer as well as the farmer. An informed
decision on the use of purchased inputs also requires information on prices, and in thin
markets (i.e. those with low and uneven volumes of transactions over time), prices can be
particularly uncertain and variable
Risk and Uncertainty
Farmer willingness to purchase inputs is also affected by risk and uncertainty. Low and
uncertain rainfall is closely linked to low use of purchased inputs, since it creates
additional yield risk. Most African agriculture is rain-fed, only 8% of cereal production is
irrigated, compared with 20–40% in other developing regions. Where output prices are
volatile, farmers may be unwilling to apply inputs for fear that they may not cover costs.
Chemicals, in particular, are often very specific and expensive and farmers will be
reluctant to apply them unless confident of their suitability. Unviable seeds are another
problem. Whilst suppliers may willingly replace or refund when seeds are found to be
unviable, planting has to be repeated and the ideal sowing date has passed.
Commercial Context
There are a number of ways in which the commercial context affects the use of purchased
inputs. These issues overlap with some of the other topics already discussed, but as a
group they offer an additional explanation for overall levels of input use. Farmers’
20
expectations of being able to market their crop at a remunerative price are an important
determinant of willingness to use purchased inputs. Although market prices may vary,
some will be subject to larger fluctuations than others. With sufficient experience,
farmers may, nonetheless, develop technology strategies which are robust in the face of
expected price variation, or where resources permit, may be able to take a calculated risk
on the likelihood of covering costs. Where debt amnesties and subsidized credit
programmes have been common, it may be more difficult to establish viable credit
schemes than in situations where those taking out loans expect to repay them. The
absence of retail outlets is not limited to farm inputs. It affects all sectors and reflects the
limited purchasing power of farming communities. When taken together, these factors
which reduce access to inputs, combine to create an additional disincentive: high and
unpredictable transaction costs. Trading in small quantities, to dispersed markets, with
irregular, seasonal demand, contributes to high transaction costs (low volume transactions
incur the same fixed ‘negotiation’ costs as those for higher volumes, and also incur
higher unit transport costs than could be negotiated for regular or larger shipments,
exacerbated by lack of competitive pressure). High transaction costs incurred by the
trader translate into higher retail prices, and in addition to these, transaction costs
incurred by the farmer contribute to uncertainty and conflict with alternative uses of
his/her time and resources. Farmer willingness to use purchased inputs depends in part on
the overall commercial environment, including the extent to which farming decisions are
influenced by business (profitability) criteria.

21
2.2.2 The Conceptual Framework on Adoption of Agricultural Innovations
Various authors define the term “technology” in a variety of ways. Rogers (1995) uses
the words ‘technology’ and ‘innovation’ synonymously and defines technology as the
design for instrumental action that reduces the uncertainty in the cause-effect relationship
involved in achieving a desired outcome.
A more meaningful definition may be that a technology is a set of ‘new ideas’ (Jackline,
2002). New ideas are associated with some degree of uncertainty and hence a lack of
predictability on their outcome. For a technology to impact on the economic system,
blending into the normal routine of the intended economic system without upsetting the
system’s state of affairs is required (Jackline, 2002). This entails overcoming the
uncertainty associated with the new technologies. It therefore comes as no surprise that
several studies set out to establish what these factors are and how they can be eliminated
(if constraints) or promoted (if enhancers) to achieve technology adoption (Jackline,
2002). In most cases, agricultural technologies are introduced in packages that include
several components, for example, high-yielding varieties, fertilizers, and corresponding
land preparation practices. While the components of a package may complement to each
other, some of them can be adopted independently (Feder, 1985).
Also Feder, (1985) defined adoption as the degree of use of a new technology in long run
equilibrium when a farmer has all of the information about the new technology and it’s
potential. Feder (1985) classified adoption as individual (farm level) adoption and
aggregate adoption. Therefore, adoption at the farm level describes the realization of a
farmer’s decision to implement a new technology. On the other hand, aggregate adoption
is the process by which a new technology spreads or diffuses through a region. Thus, a

22
distinction exists between adoption at the individual farm level and within a targeted
region. If an innovation is modified periodically, however, the equilibrium level of
adoption will not be achieved.
The literature shows that influences on adoption can be conceptualised as related to
either, 1) learning about relative advantage, or 2) the actual relative advantage. Similarly
each influence can also be characterised as being related to the population or to the
innovation. The conceptual framework at its simplest has four quadrants. The left-hand
quadrants—Population-specific influences on the ability to learn about the innovation
and the Learnability characteristics of the innovation—only influence the time taken to
reach peak adoption; they do not influence the peak adoption level. The right-hand
quadrants Relative advantage for the population and the Relative advantage of the
innovation influence both the time taken to reach peak adoption and the peak adoption
level. They influence the time taken to reach peak adoption in two ways, because Relative
Advantage also affects the Learning of Relative Advantage node. The main factors
affecting technology adoption among smallholders in Sub-Saharan Africa are assets,
vulnerability, and institutions (Meinzen-Dick, 2004).
2.2.3 Conceptual Frame Work on Regression and Gross Margin Analysis
Regression analysis is an inferential statistics tool that shows relationship between
dependent and independent variable. Regression models are classified into simple and
multiple regression analysis. The simple regression analysis is a situation in which there
is inclusion of only one independent variable in the model while the multiple regression
is a situation in which there is two or more independent variables.
Classical assumptions for regression analysis include:

23
1. The sample is representative of the population for the inference prediction.
2. The error is a random variable with a mean of zero conditional on the explanatory
variables.
3. The independent variables are measured with no error. (Note: If this is not so,
modeling may be done instead using errors-in-variables model techniques).
4. The independent variables (predictors) are linearly independent, i.e. it is not
possible to express any predictor as a linear combination of the others.
5. The errors are uncorrelated, that is, the variance–covariance matrix of the errors is
diagonal and each non-zero element is the variance of the error.
6. The variance of the error is constant across observations (homoscedasticity). If
not, weighted least squares or other methods might instead be used.
Logistic regression is a type of regression model where the dependent variable is
converted into dichotomous/binary variables coded 0 and 1 (Brian and Sabine 2004). The
model uses maximum likelihood estimation (MLE) procedure. The advantage of this is
that, the probabilities are bound between 1 and 0. Logit regression conceptually gives
maximum estimates, overcome the shortcomings associated with linear model of
regression and provide estimates that are consistent and efficient (Pindynk, 1998).
However, unlike the ordinary least square (OLS ), although it can be used to estimate
binary or dichotomous natured model, certain assumptions of classical regression model
will be violated such as non-normality of the disturbance, heteroscedastic variance of the
disturbance and a questionable value of R2 as measures of goodness of fit (Gujarati,
2004).
24
The gross margin for a farm enterprise is one measure of profitability that is a useful tool
for cash flow planning and determining the relative profitability of farm enterprises.
Gross margin profit is the difference between the annual gross income for that enterprise
and the variable costs directly associated with the enterprise (David, Jim and Daniel,
2013). Gross Margin can also be defined as the gross income from an enterprise less the
variable costs incurred in achieving it. Variable costs are those costs directly attribuTable
to an enterprise and which vary in proportion to the size of an enterprise. For example: If
the area of wheat or sorghum sown doubles, then the variable costs associated with
growing it, such as seed, chemicals and fertilizers, will roughly double. If the number of
breeding cows’ doubles, then the variable costs associated with carrying the additional
stock, such as drench and vaccination costs, will also roughly double. In constructing
gross margins, fixed (overhead) costs are ignored, as it is considered that they will be
incurred regardless of the level of the enterprise undertaken. The gross margin of
different enterprises should not be compared if they have different overhead costs.
2.3 REVIEW OF EMPIRICAL STUDIES
This component present empirical study on purchased inputs demand and adoption and
profitability of grain legumes among smallholder farmers.
2.3.1 Empirical Study on Inputs Demand among Smallholder Farmers
Assa, Mehire, Ngoma, Magombo and Gondwe (2014) conducted a study on Determinants
of Smallholder Farmers’ Demand for Purchased Inputs in Lilongwe District, Malawi. The
aim of this study was to empirically determine the factors that affect smallholder farmers’
demand for purchased fertilizer and seed using cross section data. Model solutions, which
were created by using Translog Cost function were carried out by Seemingly Unrelated
25
Regression (SUR). The study revealed that education, field size (plot of land cultivated)
and household size have significant negative relationship with the share of fertilizer
purchased and positively related with share of seed. Whereas price of output, seed,
fertilizer and income of the household are found to be significant and positively related to
share of fertilizer and negatively related with share of purchased seed.
Ezeh, Onwuka, and Nwachukwu (2008) investigated the correlates of inorganic fertilizer
consumption among smallholder farmers in Abia State, Nigeria A multi – stage random
sampling technique was employed in selected local government areas, communities and
farmers from the three agricultural zones (Aba, Ohafia and Umuahia) of the state making
sample size of 150 farmers for the study. The results of the linear functional model
indicate that four (farmer incomes, farm experiences, transportation costs and price of
50kg fertilizer bag) out of the eight variables were key determinants of the smallholder
farmers’ fertilizer consumption at 5% risk level. However the combined effects of all the
variables explained 57.6 percent of the variations in the total fertilizer consumption rate
of the smallholder farmers in Abia state Nigeria. Higher level of subsidy on fertilizer is
recommended as a deliberate policy to increase the fertilizer consumption propensity of
the smallholder farmers.
Amsalu, Kindie, and Belay. (2013) conducted research on determinants of household
demand for and supply of farm labour in rural ethiopia. Typical farm households in rural
areas of developing countries allocate their labour resource among own-farm work and
off-farm (market) activities in response to different factors. This study examines
determinants of household demand for and supply of farm labour in rural western
Ethiopia using household sample survey data collected during 2010/11 agricultural

26
season. The instrumental variable estimation technique used to analyze the data indicates
the importance of shadow wage, shadow income, and demographic factors at influencing
farm labour supply. Similarly, the demand for farm labour is significantly affected by
farm attributes, off-farm income and family composition. The findings with regards to
farm labour supply imply that measures taken to influence returns to labour on farm may
produce different results for labour market project and non-project households.
Moreover, increasing the off-farm employment opportunities can help release the
liquidity constraint and thus promote increased use of hired farm labour.
2.3.2 Empirical Studies on Adoption of Agricultural Innovations
Many studies were conducted on adoption and factors that influence adoption of
agricultural technologies. Some of the adoption studies conducted in Nigeria and Africa
in general includes the following:
Idrisa, (2012) examined the determinants of adoption of improved soybean seeds among
farmers in southern Borno State, Nigeria. Inferential statistical techniques namely the
Logit model and the Tobit model were used to estimate the likelihood of technology
adoption among farmers and the extent of adoption of improved soybean seeds by the
farmers, respectively. Yield of soybean and distance to source of improved seeds were
statistically significant factors that influenced the likelihood of adoption of improved
soybean seeds among the farmers. Farm size and distance of farmers to source of
improved soybean seeds were statistically significant factors that influenced the extent of
adoption of improved soybean seeds among the farmers. Based on the findings of this
study, it was recommended that improved technologies in the form of high yielding seeds
varieties should be made available to farmers. Farm service centers should be established

27
within reasonable distance from farming communities. This brings technologies closer to
farmers, thereby reducing the risks that farmers have to encounter to get farm inputs.
Bello, Dauda and Okwu. (2011) conducted a study focused on the factors influencing the
adoption of farming technologies among farmers in Jenkwe Development Area (JDA) of
Nasarawa State of Nigeria. The research farmers consisted of 96 farmers from five
districts of the development area selected through simple random sampling technique.
The results were analyzed using descriptive statistical tools involving frequency,
percentage and means in respect to farmers' characteristics. Regression analysis using the
Statistical package of Social Sciences (SPSS) was used to determine the relationship
among the variables. The results showed significant negative relationship between
adoption and number of farm plots and farm size positively significant correlation with
years of farming experience and farm income.
Solomon, (2011) examined the driving forces behind farmers’ decisions to adopt
agricultural technologies and the causal impact of adoption on farmers’ integration into
output in Ethiopia. They used a Double-Hurdle model to analyze the determinants of the
intensity of technology adoption conditional on overcoming seed access constraints.
Results show that knowledge of existing varieties, perception about the attributes of
improved varieties, household wealth (livestock and land) and availability of active labor
force are major determinants for adoption of improved technologies. Their results suggest
that the adoption of improved agricultural technologies has a significant positive impact
on farmers’ integration into output market and the findings are consistent across the three
models suggesting the robustness of the results. This confirms the potential direct role of

28
technology adoption on market participation among rural households, as higher
productivity from improved technology translates into higher output market integration.
Haji (2003) examined the adoption of crossbred dairy cows in Arsi zone used Logistic
regression model to identify factors affecting farm households’ adoption decision of
crossbred dairy cows. Formal education, total local livestock holding, the distance
between farmers’ residence and market, family size, total cultivated area, access to credit,
access to artificial insemination, access to bull service, farmer’s leadership position in
local farmers’ organization and extension contact were found to be significant variables
in the adoption decision of crossbred dairy cows.
Orebiyi, Benchendo, and Onyeka, (2007) investigated the adoption level as well as the
factors influencing the ADP contact farmer’s adoption of improved cassava production
technologies in Imo State of Nigeria. The data were analysed using the linkert scale
method to determine the adoption level of the contact farmers while multiple regression
analysis was used to isolate factors that are very critical to this study. The results showed
that the grand mean adoption level of the farmers was 0.61 with the planting of improved
cassava varieties having the highest adoption score of 0.72 while tillage practices had the
least score of 0.49. The value of the coefficient of multiple determination (R2
) was 0.879
implying that the farmers’ age, educational level of the contact farmers, level of
extension contact, availability of production credit as well as other farm inputs were
statistically significant factors influencing the adoption of improved IITA cassava
production technologies in the state.

29
2.3.3 Empirical Studies on Profitability Analysis
Ya’aishe, Alice, Putai and Petu-Ibikunle (2009) examine economic analysis of cowpea
production among women farmer in Askira/Uba Local Government Area, Borno State
Nigeria. Analytical tools such as descriptive statistics and regression analysis were used
for the analysis of the data. The analysis revealed that the coefficient of farm size was
positively significant at (10%) hired labour was negatively significant at (10%) and the
coefficient for mechanized labour was positively significant at (1%) leave respectively.
Costs farm income and gross margin analysis per hectare for cowpea, production were
N28,255.42, N75,032.26, N46,780.08 respectively.
Musa, Vosanka, Inuwa, and Mohammed (2010) conducted study the economics of
cowpea production in Donga Local Government Area of Taraba State. The specific
objectives were to determine the profitability of cowpea production and identify the
major constraints of cowpea production. The returns was estimated at N153, 250.00 for
gross income, with gross margin, net income and per naira invested estimated at N66,
005.00, N37, 380.00 and N0.7565.00 respectively.
TaruL, Kyagya and Mshelia (2010) examines the profitability of groundnut production
in Michika Local Government Area of Adamawa State. Gross Margin analysis was
strictly used. From the costs and return analysis, it is found that the total cost of
production by farm size per hectare in the area is N133, 812.68; the gross margin per
hectare is N221348.68 while the average net return per hectare is N40, 097.63. The
findings also shows that, farmers in the area earned an average net revenue ranging
between N17, 217.00 and N445, 011.35 depending on farm size which indicated that
groundnut production is a profitable venture in the study area. Farmers should maintain

30
output per hectare at a high level with the family labour at their disposal through good
management and efficient use of modern inputs.
Olorunsanya, Babatunde, Orebiyi And Omotosho (2009) examines the efficiency of
resources used in soybean production in Kwara State using 120 representative farmers.
The costs and returns analysis revealed soybean production as a profitable enterprise with
net farm income of N8,217.5 and rate of return of 62%. The regression results show
labour in mandays, farm size in hectares and quantity of seeds in kilogramme determined
the production of soybean in the study area and should be the focus for policy targeting.
Further analysis showed that land was underutilized while seeds and labour were over
utilized. It was therefore recommended that more of land area should be utilized while
less of quantities of labour and seeds should be used for optimal profit to be attained in
the study area.
Abu, G. A. (2012) analyzed the scarce resource allocation in the special crop programme
between farmers who participated in this programme and who did not. Data collected
were analyzed using descriptive statistics, gross margin analysis and regression analysis.
A significant difference in output was found between project and non-project farmers.
The per hectare average cost of production for soybean project farmers was N33,624. The
gross margins per hectare N26,734 soybean were found to be profitable. The results of
the multiple regression analysis showed that 83 and 67% of the variations in soybean
yield were explained by the combined effect of herbicide, fertilizer, seed and labor for
project and non-project farmers respectively. Soybean farmers (both projects and non
projects) were producing in stage two, the rational stage of production.

31
CHAPTER THREE
3.0 METHODOLOGY
3.1 The Study Area
The study area covers Kano State located in the north-western part of the Nigeria. Kano
State has coverage of 44 Local Government and the state share boarder with Jigawa,
Kaduna, Bauchi, and Katsina state respectively. Kano State was created in 1967 and lies
between latitude 100
33’ and 120 37’ North of the equator and longitudes 7
0 43’ and 9
0
35’ East of Greenwich. The population of Kano in 2011 was 9,383,682 people (NPC,
2006) and the current estimated population at 3.5% stands at 12,000,000 (GEMS, 2013).
Kano State lies in the tropical wet and dry climate zone. The mean rainfall is about
1000mm in the southern part of the state, 800mm around metropolitan Kano and about
600mm in the north-east. The rainy season usually covers the months of April – October.
This is followed by harmattan which usually begins in November and ends in February.
The primary activity of the populace is farming in rural areas and business in the urban
centers. The secondary occupational engagements include: civil service, animal
husbandry, marketing of agricultural products etc. Traditional farming system is the
dominant practice among most of the farmers with emphasis on mixture of cereals and
legumes. Most of the farmers in Kano state practice traditional farming system
cultivating local varieties of cowpea, millet, maize, sorghum and groundnut in various
intercropping systems with little or no purchased inputs (KNARDA, 2011). On the basis
of livestock production, sheep, goats and cattle production are commonly available
especially among rural dwellers in the study are.

32
Table 1: Summary of the Project Area
S/n LGAs Area (km2) Population Communities selected by N2Africa
1 Bichi 612 277,099 Badume, yakasai, sabo, dangawo, faras,
gara, mangwarau, munbira, jobe.
2 Bunkure 487 170,891 Gurjiya, jallorana, sabon ruwa, z/Buhari,
zanya, maslaure, gabo, falingo, Bunkure.
3 Doguwa 1,204 231,742 Maigado, tagwaye, yantame, dandoki,
dadin kowa, ragada karami.
4 Garko 450 162.500 Danmaliki, karfau, garwaji, gurjiya, lamire,
kakiya, dakare, Tudun zaki.
5 T/wada 1,473 151,181 Jammaje, tashar gora, yarmaraya,
marmara, tashar inji, damaga, dogon kawa,
yaryasa.
Source: CADP (2010) & N2Africa (2014)

33
3.2 Method of Data Collection
The research employs the use of primary data. The primary data were obtained using a
structured questionnaire with the assistance of trained enumerators carefully selected by
the researcher who can interview and communicate effectively in the manner that can
influence farmers to give sufficient information. The questionnaire provide information
on socioeconomic characteristics, determinants of inputs demand, socio-economic factors
influencing adoption of legumes, profitability analysis, input-output relationship of
legumes production, constraints affecting inputs demand and adoption of legumes
production technologies of N2Africa in Kano state.
3.3 Sampling Techniques
Multi-stage sampling techniques were used for this research. The study consider ten (10)
local governments purposefully where N2Africa Phase 1 project was introduced.
Specifically fifty percent (50%) of the local government areas were selected giving a total
of five (5) Local Governments Areas from the project area. The local governments
selected include Bunkure, Bichi, Garko, Doguwa and Tudun wada. Two participating
communities were randomly considered from each local government giving a total of ten
(10) communities from the intervention areas. Three (3) participating farmer group were
also randomly considered from the communities and thus thirty (30) farmer groups were
considered from the intervention areas. Finally, five (5) farmers were randomly
considered from each of the participating group and this give a total of 150 farmers as
sample size from the project areas.
Five local governments were also considered randomly from non-project areas with
emphasis of avoiding locations that are proximate to project areas. The local governments

34
selected include Gezawa, Madobi, Rimin Gado, Ungogo and Tofa. Two (2) communities
were randomly used in each of the non-project local governments giving a total of ten
(10) communities. Fifteen farmers were selected from each community and thus 150
farmers were considered from non-intervention areas. Doguwa and Tudun wada represent
sample of soybean farmers in the project area while Rimin gado and Tofa represent
sample of soybean farmers form non-project area.
Table 2: Summary of the Sampling
Project Area (5*2*3*5=150) Non-project Area (5*2*15=150)
L.G.As No. of
communities
No. of
group
No. of
farmers
L.G.As No. of
communities
No. of
farmers
Bunkure 2 6 30 Gezawa 2 30
Bichi 2 6 30 Madobi 2 30
Garko 2 6 30 Rimin gado 2 30
Doguwa 2 6 30 Ungogo 2 30
T/ wada 2 6 30 Tofa 2 30
Total 10 30 150 10 150
Source: preliminary survey, 2015 n=300
2.4 Data Analysis
Descriptive statistics were used to achieve objective 1 and 6, Multiple regression were
used to achieve objective 2 and 5, Logit regression for objective 3 and Gross margin
analysis for objective 4.
2.4.1 Descriptive Statistics
Descriptive statistics such as frequency and percentage, mean, minimum and maximum,
standard deviation and standard error were used, The descriptive approach is briefly
explained below:

35
Arithmetic Mean: this is the set of scores divided by the total number of the observation.
Mean is written mathematically as:
X = ∑Xi=X1 X2 X3 + ………………….XN …………………………………………………….(1)
n n
Where;
X = Arithmetic mean
∑ = Summation
XI = Individual observation
I = 1, 2, 3………………….n
Percentage: This was employed to determine the population of farmers to a particular
response. Percentage is written mathematically as:
Percentage (%) = X x 100 …………………………………………………………..(2)
n
Where;
% = percentage
X = Individual observation
N = Total observation
2.4.2 Inferential Statistics
Inputs Demand Models
The quantity demanded of purchased inputs for legumes production depends on the price
of the inputs, price of other inputs (substitute, complementary), producers income, size of
land devoted for legumes production and distance of the producer to the input market
(source) ceteris paribus. The quantity of purchased inputs demanded for legumes
production is expressed mathematically as follows:

36
Qd = f (P, Y, H, d)…………………………………………………………….......(3)
The explicit forms of the models for this study are specified below:
Multiple Regression (Inoculants Demand Model)
Qdi = β0 + β1P+ β2Y+ β3H+ β4D+U……………………………………………....(4)
Where;
Qdi = quantity of inoculants purchased in kg
Pi = price of inoculants in Naira/kg
Yi = producers income in Naira/season
Hi = land size devoted for legumes production in hectare
Di = distance to input market (source) in kilometer
Βo– β4 = Coefficients to be estimated
U = Noise term
Multiple Regression (Seeds Demand Model)
Qds = β0 + β1P+ β2Y+ β3H+ β4D+U…….…………………………………………..(5)
Where;
Qds = quantity of seeds purchased in kg
Ps = price of seeds in Naira/kg
Ys = producers income in Naira/season
Hs = land size devoted for legumes production hectare
Ds = distance to input market (source) in kilometer
Βo– β4= Coefficients to be estimated
U = Noise term
Multiple Regression (fertilizer demand model)

37
Qdf = β0 + β1P+ β2Y+ β3H+ β4D+U………………………………………………..(6)
Where;
Qdf = quantity of fertilizer purchased in kg
Pf = price of fertilizer in Naira/kg
Yf = producers income in Naira/season
Hf = land size devoted for legumes production hectare
Df = distance to input market (source) in kilometer
Βo– β4 = Coefficients to be estimated
U = Noise term
Multiple Regressions (Agrochemicals Demand Model)
Qdi = β0 + β1P+ β2Y+ β3H+ β4D+U………………………………………………..(7)
Where;
Qdi = quantity of insecticides purchased in kg
Ph = price of herbicides in Naira/kg
Yh = producers income in Naira/season
Hh = land size devoted for legumes production hectare
Dh = distance to input market (source) in kilometer
Βo– β4 = Coefficients to be estimated
U = Noise term
2.4.3 Binary Logistic Regression
The dependent variable for logit regression is binary taking a value of 1 and 0 for
adopters and non-adopters of legumes production. This eventually expressed itself as:
Yi = β0 + β1 X1 + U…………………………………………………………………...(8)

38
The logistic cumulative probability function can be expressed as:
PI = E [Y = 1/XI] = 1/1+e – (
β0 β1X1) ……………………………………………….…(9)
For ease of expression, the above equation is written as:
Pi = 1/1+e-Z
= eZ
/ 1+e-Z
………………………………………………………(10)
Where;
Pi = the probability that a farmer adopt maize-legume production system
ZI = β0 + β1 X1+……………+ βn Xn
e = the base of the normal logarithms.
Although Z is a linear combination of variable that both upper and lower bound will be
used as the variable Z. this is because the value of Z will depend on the value of the
unknown parameters βis. To obtain the value of Z, the likelihood of observing the sample
will be found by introducing a dichotomous response variable Y. such that;
Y = 1 if farmer adopt maize-legume production system, 0 if otherwise and P ranges from
0 to 1.
Pi is not linearly related to ZI ( i.e. XI), since Pi which is the probability of adopting
maize-legume production system is given in equation 4 above.
Then (1 - Pi) the probability of non-adoption of maize-legume can be expressed as:
1 - Pi = 1/1+e-Z
.……………………………………………………………….............(11)
Therefore, we can rewrite:
Pi / 1+e-Z
= 1+e-Z
/ 1+e-Z
= ez ……………………………………………………......... (12)
Taking the natural log of equation (5), this will be:
Li= Ln [Pi / 1- Pi] = ZI = β0 + β1 X1+……………+ βn Xn …………………………….(13)

39
L = log of the odds ratio, not only in X but also in the linear parameter. It is called the
logit or logit probability model. This implies that the logistic model explained in the
equation is based on the logit of Z. The influence of a set of explanatory variable on
adoption of maize-legume is specified using the following expression:
Adoption = f(X1 X2 X3 X4 X5………….Xn)…………………………………………..(14)
Y = β0 + β1 X1+ β2 X2+ β3 X3+ β4 X4 + β4 X4+ β5 X5 + β6 X6 + β7 X7 + U…..............(15)
Y = Dichotomous response variable such that, Y = 1 if farmer adopts legume production
system and 0 if otherwise
Β0– β8= Coefficients to be estimated
U = Noise term
X1 =Age (years)
X2 =Farm size (hectare)
X3 =Household size (numbers)
X4 =Educational status (years)
X5 =Years of experience (years)
X6 =Income level (NGN)
X7 =Contact to change agent (binary)
2.4.4 Gross Margin Analysis
Gross margin analysis was used to estimate profitability of legumes production. The
gross margin model of legumes production system is expressed as follows:
GM= ∑YiPi - ∑XjPj…………………………………………………………………..(16)
Where
GM = Gross margin N/ha
40
∑ = summation sign
Yi = quantity of output i
Pi = unit price of output i
Xj = unit cost of variable input j
Pj = quantity of variable input j
i and j = 1,2,3…….n
2.4.5 Multiple Regression Analysis (Input-Output Relationship)
Multiple regression analysis was used to determine input-output relationship in legumes
production.
Model Specification
K = f(X1, X2, X3, X4 … Xn) …………………………………………………………..(17)
K = P + β1QSD+β2FSZ+β3+β4TLB+β5FRT + β6CHE +β7MLB +U …………..........(18)
Where;
K= legume output (kg)
P = intercept
β1 – β7= Coefficient of the regressors
U = noise term
QSD =Quantity of seed (kg)
FSZ =Farm size (ha)
TLB =Total labour (mandays)
FRT =Fertilizer (kg)
CHE =Chemical (liter)
41
CHAPTER FOUR
4.0 RESULTS AND DISCUSSION
4.1 SOCIO-ECONOMIC CHARACTERISTICS OF GRAIN LEGUME FARMERS
Socio-economic characteristics of farmers are important human attributes that enhance
the adoption of agricultural innovations. They also assist in getting the clear
understanding of the behaviour of the farmers as well as providing a hint towards
explaining their disposition that could improve their productivity (Ayinde, 2007).
The socio-economic variables identified for this research include gender, marital status,
level of education, major occupation, age, household size, years of experience and
income level of the farmers. The socio-economic variables are presented in Table 3a and
3b.

42
Table 3a: Socio-economic Characteristics Grain Legume Farmers
Variables Project area (150) Non-project area (150)
Frequency Percentage Frequency Percentage
Gender
Male
Female
Marital status
Married
Single
Widow
Divorced
Educational status
Non-formal education
Primary education
Secondary education
Tertiary education
Major source of
income
Farming
Civil service
Livestock rearing
Trading
Cooperative
membership
Member
Non-member
Land ownership
Inherited
Purchased
Rented
130
20
142
3
3
2
63
41
35
11
117
11
12
10
145
5
133
16
1
86.7
13.3
94.7
2.0
2.0
1.3
42
27.3
23.3
7.3
78
7.3
8
6.7
96.7
3.3
88.7
10.7
0.7
147
3
145
1
2
2
70
38
21
21
118
17
4
11
142
8
136
12
2
98
2
96.7
0.7
1.3
1.3
46.7
25.3
14
14
78.7
11.3
2.7
7.3
94.7
5.3
90.7
8
1.3
Source: Field survey, 2015
4.1.1 Gender of Grain Legume Farmers
Gender is defined by FAO as ‘the relations between men and women, both perceptual
and material. It is a central organizing principle of societies, and often governs the
processes of production and reproduction, consumption and distribution’ (FAO, 1997).
Descriptive statistics presented in Table 3a indicated that legume production is dominated
by male both in project and non-project areas. This is clearly seen as 86.7% farmers in
the project area and 98% farmers in the non-project area are male. This might be related
to the believe that male bear family responsibility as bread winners while female are

43
traditionally expected to perform domestic work especially in rural areas. Female
participation on legume production in the project area is greater than that of non-project
area. This is in conformity with requirement of N2Africa legume technology were
introduced based on gender consideration.
4.1.2 Marital Status of Grain Legume Farmers
Marital status to some extent influences the size of the farmers’ family and availability of
labour for farm production because the marriage institution poses some restrictions as
regards which member of the family should practice farming (Victor, 2004). It can be
seen clearly from Table 3a that majority of the farmers in the project area were married
(94.7%) while only very few are single and widow (7%) respectively. It can also be noted
that majority (96.7%) of the farmers in the non-project area were also married. This may
not be contrary to the tradition in typical Hausa/Fulani community like Kano state where
marriage is considered as a symbol of respect and can increase household size. Marriage
is considered important for matured people in the African setting (Adebayo, 2010).
4.1.3 Educational Status of Grain Legume Farmers
Trichopoulou, 2002, defined education as ‘the wealth of knowledge acquired by an
individual after studying particular subject matter or experiencing life lessons that
provide an understanding of a particular thing. Descriptive statistics presented in Table 3a
revealed that 42% farmers have non-formal education while majority had one kind of
formal education or another (i.e primary, secondary or tertiary) in the project area. The
same is applied for non-project area as 46.7% had non-formal education while 53.3%
farmers had formal education. Farmers’ formal education may increase their ability to
understand agricultural innovations which might subsequently increase their production.
44
4.1.4 Major Source of Income
Occupations of the population are largely influenced by the setting of their environment
as well as their local economy as is often the case in most rural Africa and Nigeria in
particular where livelihood strategies usually involve mixture of activities including farm
and off-farm employment (IFAD, 2009). The result in Table 3a revealed that majority of
the farmers both in project and non-project areas had farming as their major source of
income. Findings also revealed that only 7.3% farmers in the project area had civil
service as their major source of income while 11.3% farmers from non-project area had
civil service as their major income source. Trading as indicated by 6.7% farmers in the
project area was the major source of income. This result goes in line with findings of
Isah, Adebayo, Muhammad and Offar (2013) in their paper titled profitability of sole
cowpea production in Gombi Zone of Adamawa State.
4.1.5 Cooperative Membership
Association is a form when individuals recognize common and desirable needs among
themselves (Olukosi, 2007). Descriptive statistics in Table 3a shows that majority
(96.7%) of the farmers in the project area members of cooperative organization while
only 3.3% of the farmers are not members of any cooperative organization. Also 94.7%
farmers as majority in non-project area are members of one cooperative organization or
another. Membership of cooperative organisation can offer certain benefits to members
such as input procurement, information on output market and subsidy.

45
Table 3b: Socio-economic Characteristics Grain Legume Farmers
Variables Project area (150) Non-project area (150)
Frequency Percentage variables Frequency Percentage
Age (yrs)
22 – 31
32 – 41
42 – 50
51 – 60
61 – 70
6
29
68
41
6
4
19.3
45.3
27.3
4
30 – 40
41 – 50
51 – 60
61 – 70
71 – 80
38
63
37
10
2
25.3
42.0
24.7
6.1
1.3
Minimum 22 30
Maximum 70 80
Mean 47.2 47.7
Household
size(No.)
2 – 6
7 – 12
13 – 16
17 – 20
21 – 24
79
52
16
2
1
52.7
34.7
10.7
1.3
0.7
1 – 6
7 – 12
13 – 18
19 – 24
25 – 30
43
60
34
6
7
28.7
40.0
22.7
4.0
4.7
Minimum 2 1
Maximum 1 30
Mean 6 11
Farm size(ha)
0.5 – 1.8
1.9 – 3.1
3.2 – 4.4
4.5 – 5.7
5.8 – 7.0
51
73
20
5
1
34
48.7
13.3
3.3
0.7
0.5 – 1.4
1.5 – 2.3
2.4 – 3.2
3.3 – 4.1
4.2 – 5.0
18
49
53
26
4
12
32.7
35.3
17.3
2.7
Minimum 0.5 0.5
Maximum 7 5
Mean 2.2 2.59
Farming
experience(yrs)
5 – 16
17 – 27
28 – 38
39 – 49
50 – 60
30
38
51
28
3
20
25.3
34
18.7
2
5 – 15
16 – 25
26 – 35
36 – 45
46 – 55
31
47
35
28
9
20.7
31.3
23.3
18.7
6.0
Minimum 5 5
Maximum 60 55
Mean 27 26.9
Source: Field survey, 2015

46
4.1.6 Ownership Structure of Land
Majority (88.7% and 90.7%) of the farmers in project and non-project areas respectively
acquire their land through inheritance. In project area, 10.7% farmers acquire land
through purchase while only 0.7% farmers rent land for production purpose. However, in
non-project area 8% farmers acquire land through purchase while only 1.3% farmers
acquire land through renting. This shows that, inheritance is the major source of land
acquisition by grain legume farmers and this is in conformity with findings of Kakwang
(2011)
4.1.7 Age of Grain Legume Farmers
Age refers to the number of years a person has lived. It is the length of time that a person
has lived or existed. It explained the years of the farmer at the time of the study.
Descriptive statistics in Table 3b revealed that majority (64.6%) of the farmers in the
project area falls within age bracket of 31 – 50 while 27.3% farmers falls between age
bracket of 50 – 60 respectively. In non-project, 67.3% legume farmers falls within age
bracket of 30 – 50 while 24.7% farmers falls within age bracket of 51 – 60. This is an
indication that majority of the farmers both in project and non-project area falls within
their active age. This might give grain legume farmers the opportunity for participation in
legume production which may results to increase sustainability of legumes production.
4.1.8 Household size of Grain Legume Farmers
Household size refers to the total number of individuals who live within and feed from
the same pot. According to the National Population Commission (NPC, 2006), these
individuals think of themselves as a unit. According to Ogunbile, (2002), household size
is the total number of individuals who live within and feed in the same house. Descriptive

47
statistics in Table 3b revealed that 52.7% farmers in the project area had household size
of 2 – 6 members while 34.7%) farmers had house hold size of 7 – 12. Only 1.3%
farmers in project area had house hold size of 17 – 20. In non-project area, 40% farmers
had house hold size between 7 – 12 while 28.7% farmers had house hold size between 1 –
6 members. The mean household size is 6 and 11 for project and non project area
respectively. This shows that legume farmers had responsibility of feeding their
dependent which might increase household expenses and on the other hand might provide
labour for the farming families.
4.1.9 Farm Size of the Farmers
Olayide (1982), reports that majority of Nigerian farmers were usually small-scale
farmers. Result in Table 3b shows that majority (48.7%) of the farmers in the project area
falls within farm size bracket of 1.9 – 3.1 while only 0.7% legume farmers had more than
5 hectare of land. In non-project area, 32.7% legume farmers falls within farm size of
between 1.5 – 2.3 while only 2.7% farmers falls within 4.2 – 5.0 hectare. The mean of the
farm size in the project area is 2.2 while in non-project area, the farm size mean is 2.59.
This shows that legume farm size of the legume farmers might be sufficient for legumes
production both family and commercial purposes.
4.1.10 Farming Experience of Grain legume Farmers
Descriptive statistics in Table 4 revealed that 34% farmers had farming experience of 28
– 38 years while only 2% had farming experience between 50 – 60 years in the project
area. In non-project area, 31.3% had farming experience between 16 – 25 years while
only 6% had farming experience between 46 – 55 years. Stanger, (2000) stressed a
positive relationship exists between years of experience in business and its performance.

48
The mean farming experience was 27 and 26.9 for project and non project area. Farming
experience might help farmers with vital information for increased legume production.
4.2 Factors That Influence Input Demand among Smallholder Farmers
Determinants of inputs demand among smallholder farmers were analyzed using multiple
regression analysis. The dependent variable included in the model is the quantity of
particular input (i.e fertilizer, improved seeds and chemicals) while the repressors include
price of input in naira, producers annual income, land size (ha) and distance to input
source (km). Table 4 below presents the multiple regression analysis for determinants of
inputs demand both in project and non-project area.

49
Table 4: Multiple Regression Analysis for Determinants of Input Demand
Variables Project area (150) Non-project area (150)
Fertilizers Seeds Chemicals Fertilizers Seeds Chemicals
Coeff. t-value Coeff. t-value Coeff. t-value Coeff. t-value Coeff. t-value Coeff. t-value
Price of inputs(NGN) -246.02 -2.145** -0.532 -3.106** 0.000 0.593n -0.013 -0.156* -0.0301 -0.430n 0.000 0.145n
Farm size (ha) 107.22 5.564* 0.313 2.353** 0.057 0.906n 8.553 1.613n 0.014 0.371n -0.007 -0.21*
Annual income(NGN) 81.19 4.57* 0.616 5.025* 3.057E-06 3.482* 0.000 -2.156n 0.260 1.049n 1.104E-06 1.185n
Distance to market (km) -32.03 -3.72* 0.208 3.721* -0.017 -0.041n -0.062 -0.005n -0.008 -0.289* -0.005 -0.961*
Constant 132.4n 0.558 -1.261 -1.71* 0.224 0.261 135.25 4.484 2.041 6.648 -0.023 -0.030
R2
32% 47% 44% 37% 49% 48%
R2 adjusted 29.3% 45% 35% 32.4% 39% 39.2%
F-value 42.91 15.77 16.11 14.31 10.33 17.52
Source: Field survey, 2015 *=10% significant, **= 5% significant, n=not significant

50
The variables included in the multiple regression analysis for determinants of inputs demand
include price of inputs, farm size (ha), average annual income and distance to input source (km)
respectively. The result of regression in Table 4 revealed the R2
is 32%, 47% and 44% for
fertilizer, seeds and chemical demand in project area while non-project area result revealed R2
of
37%, 49% and 48% for fertilizer, seeds and chemical respectively. This means that 32%, 47%,
44% and 37%, 49%, 48% of variations in soybean, cowpea and groundnut as dependent
variables in project area and non-project area were explained by the independent variables
included in the model. In project area with respect to fertilizer, the coefficients of farm size and
annual income were found to be positive and significant at 1% level of significance. This means
that unit increase in farm size and annual income leads to an increase in the quantity of fertilized
purchased among legume farmers. Assa M. et-al (2014) reported that increase in farm size and
annual income of smallholder farmers leads to an increase in quantity of fertilizer use in
production. The coefficient of price and distance to input source were negative and significant at
5% and 1% respectively. This means that, increase in price of fertilizer leads to decrease in
quantity demanded. Similarly, increase in distance to input source leads to decrease in quantity
demanded of fertilizer. Farmers use portion of their income for payment of transportation when
distance increases which ultimately decreases quantity of fertilizer purchase.
With respect to seed in project area, the coefficients of farm size and annual income were
positive and significant at 1% level of significance. This means that increase in farm size and
annual income of smallholder farmers leads to increase in quantity demanded of fertilizer. As
farm size and annual income of the farmers’ increases, it is possible for farmers to increase
quantity of seed in their production. This is in line with the findings of Alimi (2000), where he
stated that inadequate financial capital could impede the performance of farming activities and

51
also affect the use of agricultural inputs. However, coefficients of price were negative and
significant at 1%, meaning that increase in price of fertilizers reduces quantity demanded
proportionately. In non-project area with respect to seeds, the coefficient of farm size and annual
income were positive and non significant while coefficient of distance to input were negative but
not significance hence no explanation is needed. Coefficients of seed price were negative and
significant at 5% meaning that, increase in price of seeds leads to decrease in quantity purchase.
With respect chemicals in project area, the coefficient chemical price and farm size were positive
and not significant while coefficient of distance to agrochemical source were negative and also
not significant. In addition, the coefficient of annual income were tested positive and significant
at 1%, meaning that as farmers annual income increases, the quantity of chemicals demanded
also increases. This is true as summary of statistics for variables used in legume production
revealed price of agrochemicals as relatively high. In the control site, the result indicates that,
coefficient of price and annual income were positive and non significant while coefficient of
distance to chemical source were negative and also not significant. However, the coefficient of
farm size were negative but significant at 10% meaning that as farm size increases, the quantity
demanded of chemicals and other inputs among legume farmers decreases. This is probably due
to expensive nature of agrochemicals to the extent that farmers income cannot satisfy the
chemical requirement of large area of land. The distance to the nearest market has some
influence on farmers’ production decisions and adoption of agricultural technologies.

52
4.3 Adoption and Factors Influencing Adoption of Grain Legumes
Table 5, 6 revealed distributions of farmers based on awareness, adoption, adoption score while
Table 7 revealed logit regression result of factors influencing adoption of grain legumes
Table 5: Adoption of Grain Legumes Technology among farmers (n=150)
Variables Frequency Percentage
Adopters 135 90
Non-adopters 15 10
Total 150 100
Source: Field survey, 2015
Table 5 revealed adoption of grain legumes technology. In addition, 135 farmers equivalent to
90% adopted the technologies while only 15 farmers representing 10% do not adopt the legume
production. The result also indicated that majority (90%) of the farmers belongs to adopters
category of grain legumes production.
Table 6: Adoption Score of N2Africa Legumes Production Technology (n=150)
Adoption stages Improved
seeds
Inoculants Fertilizers
application
Spacing Agro-chemical
application
Awareness 100 100 100 100 100
Trial 94.4 0 88 74.67 58
Adoption 90 0 80.67 88.6 0.28
Totals 377 100 353 330 217
Adoption score 0.86 0.22 0.78 0.77 0.48
Grand mean adoption Score: 0.68
Source: Field survey, 2015
Table 6 shows distribution of farmers based on adoption of N2Africa legumes technologies. The
highest adoption score was 0.84 for planting of improved legume seeds introduced by N2africa.
The lowest adoption score was 0.22 for inoculants application because the inoculants are not
readily available in the market for farmers to purchase. The grand mean adoption score was 0.68;
meaning that 68% of the entire N2Africa legumes production technology was adopted by contact
farmers in the study area.
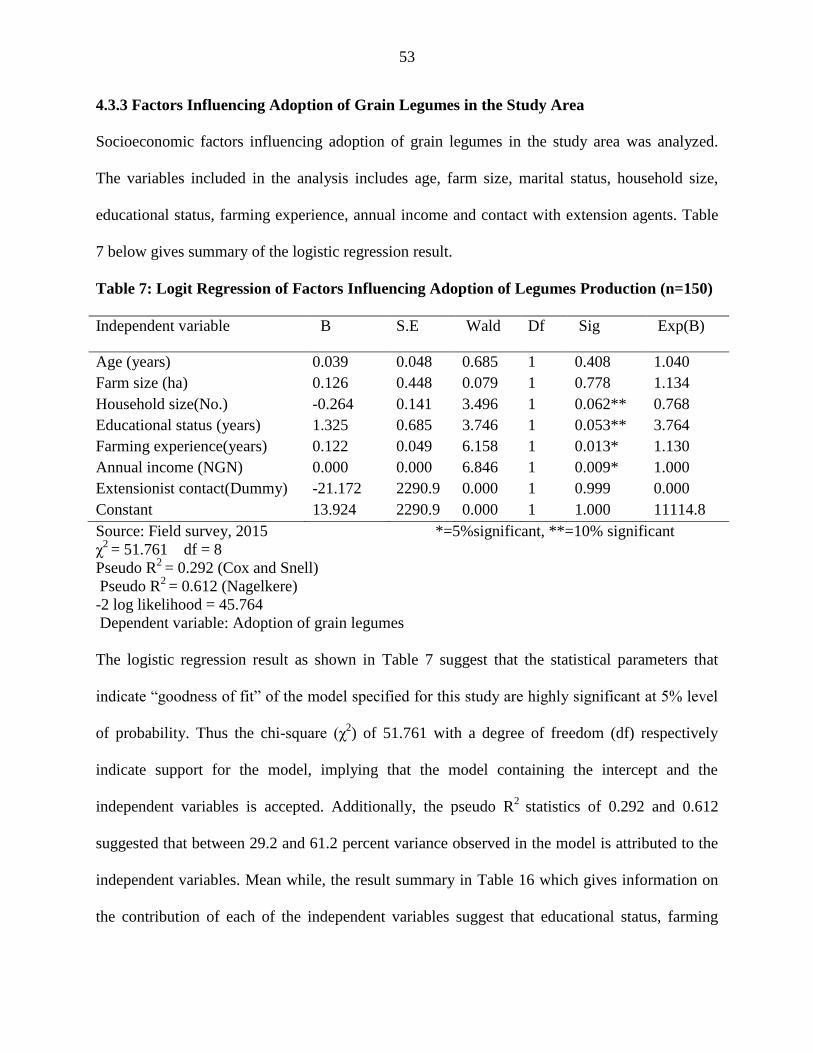
53
4.3.3 Factors Influencing Adoption of Grain Legumes in the Study Area
Socioeconomic factors influencing adoption of grain legumes in the study area was analyzed.
The variables included in the analysis includes age, farm size, marital status, household size,
educational status, farming experience, annual income and contact with extension agents. Table
7 below gives summary of the logistic regression result.
Table 7: Logit Regression of Factors Influencing Adoption of Legumes Production (n=150)
Independent variable B S.E Wald Df Sig Exp(B)
Age (years)
Farm size (ha)
Household size(No.)
Educational status (years)
Farming experience(years)
Annual income (NGN)
Extensionist contact(Dummy)
Constant
0.039
0.126
-0.264
1.325
0.122
0.000
-21.172
13.924
0.048
0.448
0.141
0.685
0.049
0.000
2290.9
2290.9
0.685
0.079
3.496
3.746
6.158
6.846
0.000
0.000
1
1
1
1
1
1
1
1
0.408
0.778
0.062**
0.053**
0.013*
0.009*
0.999
1.000
1.040
1.134
0.768
3.764
1.130
1.000
0.000
11114.8
Source: Field survey, 2015 *=5%significant, **=10% significant
χ2
= 51.761 df = 8
Pseudo R2
= 0.292 (Cox and Snell)
Pseudo R2
= 0.612 (Nagelkere)
-2 log likelihood = 45.764
Dependent variable: Adoption of grain legumes
The logistic regression result as shown in Table 7 suggest that the statistical parameters that
indicate “goodness of fit” of the model specified for this study are highly significant at 5% level
of probability. Thus the chi-square (χ2) of 51.761 with a degree of freedom (df) respectively
indicate support for the model, implying that the model containing the intercept and the
independent variables is accepted. Additionally, the pseudo R2
statistics of 0.292 and 0.612
suggested that between 29.2 and 61.2 percent variance observed in the model is attributed to the
independent variables. Mean while, the result summary in Table 16 which gives information on
the contribution of each of the independent variables suggest that educational status, farming

54
experience, annual income and household size are statistically significant at 5% level of
probability. Based on the result, increase in literacy level will most likely result in an increased
farmer’s level of adoption of N2Africa legume technology. This is in conformity with findings of
Imoh and Essien (2005) who reported that farmers' level of education influence adoption of
technology positively. This is possible as education is an investment in human capital which is
able to raise the skills and qualities of man, narrow his information gap and increase his
allocative abilities thereby leading to more production performance. Chukwuji (2006) reported
that education influences the adoption of practice in modern Agriculture.
Farming experience was also significant. The positive relationship between years of experience
and adoption implied that adoption of improved technologies tended to be accepted by
experienced farmers as they understand the importance of technologies in farming. This result
goes in line with findings of Bello M. Et-al (2011) as they discover farming experience as
variable that influence adoption of agricultural innovations. The more the farmers have
experience on farming practice the more likely they understand, accept and adopt new
innovations and vice versa. Age, in correlation with farming experience, has a significant
influence on the decision-making process of farmers with respect to risk aversion, adoption of
improved agricultural technologies, and other production related decisions (Amaza, 2007; 2009).
For annual income, the income of the farmers help them to purchase productive inputs as most of
the innovations left farmers after demonstration with responsibility of inputs provision for the
purpose of sustainability. Positive relationship between income and adoption implied availability
of income which enhances farmers' ability to purchase the inputs embodied in the new
technology and pay for hired labour needed for the use of these inputs and improved
management practices for greater productivity. (Bello, 2011)

55
With respect to significant of household size, it is possible that increase in household size may
lead to an increase in provision of labour requirement for the farming families. The number of
adult male and female as well as male and female child have greater role to play through
participation at various stage of production and this leads to decrease particularly expenditure on
hired or paid labour.
4.4 Average Costs and Returns Analysis of Legumes Production
Costs and returns analysis of legume production system were carried out using farm budgetary
techniques. The analysis were made for both project and non-project areas. The analysis focuses
on three major legumes (soybean, cowpea and groundnut) which are the mandate crops for
N2Africa in Nigeria. Table 8 below presents the cost and return analysis of legume production in
the study area.

56
Table 8: Profitability Analysis of Legumes Production
Variables Project area (150) Non-project area (150)
Soybean Cowpea Groundnut Soybean Cowpea Groundnut
Cost(N/kg) % Cost(N/kg) % Cost(N/kg) % Cost(N/kg) % Cost(N/kg) % Cost(N/kg) %
1. Cost
Seeds (kg) 4725.42 6.37 3819.78 5.17 4304.89 5.84 5742.40 7.25 4734.11 6.14 6765.22 8.27
Fertilizers (kg) 10715.00 14.45 11615.56 15.73 13255.56 17.99 7047.50 8.90 9203.33 11.94 11328.89 13.85
Agrochemicals (litre) 1531.00 2.07 1299.78 1.76 1125.56 1.46
Organic manure (kg) 588.89 0.80 1384.44 1.80
2. labour (mandays)
Land preparation 17292.50 23.32 14313.33 19.39 13663.33 18.54 20219.17 25.52 17333.33 22.48 18524.44 22.65
Planting 4214.17 5.68 4625.56 6.26 4114.44 5.58 4726.00 5.97 4926.67 6.39 4708.89 5.76
Fertilizer application 1851.00 2.50 1771.11 2.40 2738.89 3.72 1941.67 2.45 2244.44 2.91 2071.11 2.53
Weeding 17573.33 23.70 18533.73 25.10 18546.67 25.16 19223.73 24.27 18888.89 24.50 19880.00 24.31
Harvesting 16253.33 21.92 17271.11 23.39 17080.00 23.17 20319.17 25.65 17248.89 22.38 18513.33 22.64
Total variable cost (TVC) 74155.75 73838.85 73703.78 79219.64 77089.66 81791.88
3. Returns
Average yield (kg/ha) 1668.62 1506.67 1388.67 1052.50 1124.44 793.33
Average price (N/kg) 120.07 129.22 107.33 124.70 127.11 111.67
Gross revenue (N/ha) 200351.20 194691.90 149045.95 131246.75 142927.57 88591.16
Gross margin (GR - TVC) 126195.45 120853.05 75342.17 50027.11 65837.91 6799.28
Return to N invested 1.70 1.64 1.02 0.66 0.85 0.08
Source: Field survey, 2015

57
The variables cost components considered in the average cost and return analysis include seeds,
fertilizers, agrochemicals, organic manure, land preparation, planting, fertilizer application,
weeding and harvesting. The differences in the total variable cost production between project and
non-project farmers were attributed to the differences in cost of inputs and labour in the two
sites. Average cost and returns analysis in Table 8 shows that labour accounted for greater part of
the total variable cost incurred in both intervention and the control site. Labour cost in project
and non-project area were represented by 77.12% and 83.86% for soybean, 76.54% and 78.66%
for cowpea while labour cost of groundnut were represented by 76.17% and 77.89%
respectively. This is as a result of differences in location as labour cost differ from one
community to another. The average price in project and non-project area was N120.07/kg and
N124.70/kg for soybean, N129.22/kg and N127.11/kg for cowpea while groundnut average price
was found to be N107.33/kg and N111.67/kg in project and non-project area respectively. These
prices were used in estimating the revenue which form the basis for computation of gross margin
which measures the economic performance of enterprises in the two sites.
The analysis in Table 9 revealed that, the total cost of cultivating one hectare of soybean was
N74155.75 with gross revenue of N200351.20, thus making a gross margin of N126,195.45
while non-project site shows a total production cost of N79,219.64 with gross revenue of
N131,246.75 thus making a gross margin of 52,027.11 respectively. This shows that, soybean
farmers in project area has higher gross margin compared to the farmers from non-project area.
The highest gross margin obtained by project farmers can be attributed to the adoption of
N2Africa technologies in the project site while low gross margin in non-intervention area implies
farmers are still using local technologies.

58
However, the total cost of production for cowpea farmers in project area was N73838.85 and
gross revenue of N194691.22 with a gross margin of N120853.05 while non-project area cowpea
farmers had total cost of production of N77089.66 and gross revenue of N142927.57 with gross
margin of N65837.91 respectively. This finding goes in line with work of Usman and Fatima,
(2014) who reported that cowpea production is profitable among smallholder farmers in Zaria
local government, Nigeria. This result also indicate higher gross margin of cowpea in project
area compared to non-project area. This result is similar to the findings of Isah, Adebayo,
Muhammad and Offar (2013) that, cowpea production among smallholder farmers in Nigeria in
profitable. With respect to groundnut enterprise, the gross margin analysis show the total cost of
production for project farmers was NGN73703.70 and gross revenue of NGN149045.95, thus
making a profit/gross margin of NGN75342.17 while for non-project farmers, the total cost of
production was NGN81791.88 and gross revenue of NGN88.591.16 with a gross margin of
6799.28 respectively. The analysis further shows more return to Naira invested in project than
non-project area for soybean, cowpea and groundnut enterprise. Generally, the gross margin
analysis of the two sites shows N2Africa technologies play vital role in increasing smallholder
farmers’ productivity. Improved legume seeds, fertilizers and special production techniques
particularly planting, spacing and fertilizers application were provided by N2Africa in the project
area making farmers to realize higher output and profit.
4.5 Input-Output Relationship of Legume Production
Input-output relationship of legume production was analyzed using multiple regression. The
variables were the quantity of soybean, cowpea and groundnut output respectively while the
independent variables were fertilizer, quantity of seeds, hired labour, farm size, herbicides,

59
pesticides and family labour. The analysis were made for both project and non-project area.
Table 9 below presents the input-Output Relationship of Legume Production System.

60
Table 9: Regression Result for Input-Output Relationship of Legumes Production Variables Project area (150) Non-project area (150)
Soybean Cowpea Groundnut Soybean Cowpea Groundnut
Coefficient t-value Coefficient t-value Coefficient t-value Coefficient t-value Coefficient t-value Coefficient t-value
Quantity of seed (kg) -0.062 -0.025ns -15.252 -2.21** -0.024 -0.27ns 23.176 15.33* 21.159 15.65* 19.351 10.33*
Quantity of fertilizer 8.145 12.65* 12.634 13.70* 0.932 9.838* -0.841 -1.78***
-0.187 -0.62ns 0.611 1.95***
Total labour (mandays) -1.539 -0.65ns 1.104 1.217ns 0.247 1.656ns 1.393 1.357ns -0.627 -0.85ns -0.702 -0.43ns
Farm size (ha) 91.945 3.006** 2.210 0.054ns -0.029 -1.34ns 42.528 1.245ns 25.681 1.045ns -0.104 -1.28ns
Constant 654.10 2.308** -143.5 -0.14ns 0.630 1.64ns -325.18 -1.98***
80.826 0.636ns -79.033 0.34ns
R2
77.4% 84% 74.9% 82.9% 86.4% 74.4%
R2 adjusted 75.7% 82.4% 72.4% 81.7% 85.1 71.9%
F-value 47.07 53.33 29.16 66.70 63.66 29.13
Source: Field survey, 2015 *=10% significant, **= 5% significant, *** 1% significant, ns=not significant
61
The variables included in multiple regression analysis for input-output relationship in legume
production include quantity of seeds (kg), quantity of fertilizer (kg), amount of labour (mandays)
and farm size (ha). Multiple regression result in Table 9 revealed R2
of 74.4%, 84%, 74.9% for
soybean, cowpea and groundnut in project area while non-project area result shows R2
of 82.9%,
86.4% and 74.4% for soybean, cowpea and groundnut enterprise respectively.
For soybean production in project area, the coefficient of fertilizer and farm size were positive
and significant at 1% and 5% level of significance. This result conforms to findings of
Olurasanya, (2009) as discovered that, farm size has a significant positive contribution in
soybean production. This means that, increase in fertilizer and farm size leads to a proportionate
increase in soybean output among smallholder farmers in the project intervention area. In non-
project area, coefficients of seed were positive and significant at 1% level of probability. This
shows that, a unit increase in seeds leads to a corresponding increase in soybean output and this
goes in line with findings of Olurasanya, (2009). Also unit increase in fertilizers reduces soybean
output. This result shows element of fertilizer over utilization among soybean farmers in non-
project area. Coefficient of labour and farm size were positive but not significant, hence doesn’t
require further explanation.
With respect to cowpea in project area, the coefficient of seed was negative and significant at 5%
level of probability while coefficients of fertilizer were positive and significant at 1% level of
probability. This result is similar to the work of Adeola, (2009) where fertilizer and seed was
found to have a significant and positive contribution in cowpea production. This means increase
in quantity of seed leads to decrease in cowpea output while unit increase in quantity of fertilizer
result to an increase in cowpea output. In non-project are, the coefficient of farm size were

62
positive and not significant while coefficient of seed quantity is positive and significant at 1%
level of probability. This means increase in seed result to increase in cowpea output.
With respect to groundnut in project area, coefficient of fertilizer was positive and significant at
1% level of probability. This result shows that, unit increase in quantity of fertilizer result to
increase in groundnut output among farmers in the project area. This result conforms with
findings of Taphee, and Jongur (2014) that a unit increase in fertilizer leads to increase in
groundnut output. The coefficient of seed and farm size were negative. Similarly in non-project
area, quantity of fertilizer has a positive coefficient that is significant at 10% level of probability
which means unit increase in quantity of fertilizer leads to increase in groundnut output. Usman
and Fatima (2014) also reported that fertilizer increase in legume production has a positive and
significant influence.
4.6 Constraints Militating Input Demand and Adoption of Legumes Technology
This component present constraints militating against input demand and adoption of N2Africa
grain legumes technology. The constraints are presented in Table 10 and 11 below:
4.6.1 Constraints Militating Input Demand among Smallholder Farmers
Table 10 presents the constraints associated with input demand/supply among smallholder
legume farmers in the study area. The problems identified includes lack of inoculants, high cost
of fertilizers, improved seeds, and agro-chemicals, non-availability of some inputs, problems of
quality inputs, behaviour of middlemen, high distance to input source, frequent price increase,
low information on price and source of inputs and lastly late arrival of fertilizers. Table 10 below
presents summary of the constraints for both project and non-project area.

63
Table 10: Constraints Militating Input Demand among Smallholder Farmers
Constraints Project area (150) Non-project area (150)
Frequency % Ranking Frequency % Ranking
Lack of inoculants
High cost of fertilizers
High cost of improved seeds
High cost of agro-chemicals
Non-availability of inputs
Problems of quality inputs
Behaviour of middlemen
High distance to input source
Frequent price increases
Low information (price/source)
Late arrival of fertilizers
150
98
69
40
30
29
44
52
21
11
51
100
65.3
46
26.7
20
19.3
29.3
34.7
14
7.3
34
1st
2nd
3rd
7th
8th
9th
6th
4th
10th
11th
5th
...
70
89
48
34
19
63
15
33
18
53
...
46.7
59.3
32.7
26.7
12.7
42
10
22
12
35.3
...
2nd
1st
5th
6th
9th
3rd
7th
8th
10th
4th
Source: Field survey, 2015
Statistics from Table 10 revealed that lack of inoculants ranked first. This is due to non
availability of inoculants in the market. Majority of the farmers in project and non project area
consider high cost of fertilizer as constraint and ranked second among the major problems.
This is due to similarity in increase of fertilizer prices across the state. High cost of improved
seeds was ranked third in project area and first in non project area. This is due to many projects
promoted and farmers’ awareness on different sources on improved seed in the project area. Late
arrival of fertilizers was ranked 5th
and 4th
in project and non project area respectively. This is
clear as late fertilizer disbursement to farmers has been recorded. Distance to input source was
ranked 4th
in project area while 7th
in non project area. This is due to high distance of the project
area especially Doguwa and Tudun wada which make farmers accessibility to inputs difficult.
Low information on price and source of inputs was ranked last the problem. This is due to
farmers participation in cooperative and group activities in project and non project area.

64
4.6.2 Constraints Militating Against Adoption of Grain Legumes Production
Farmers both in project area identified problems with regards to grain legume production. The
major problems identified includes attack of pest and diseases, fragmented land holdings,
drought problems, attack by pastoralists, low production training, high cost of labour and lastly
low market price of output. Table 11 presents statistics of the constraints militating against
adoption of grain legume production of N2Africa in Kano state.
Table 11: Constraints Militating Against Adoption of Grain Legumes Production (n=150)
Problems Frequency* Percentage Ranking
Attack of pest and diseases
Fragmented land holdings
Drought problems
Attack by pastoralist
Low production training
High cost of labour
Low market price of output
94
44
91
27
19
56
89
62.7
29.3
60.7
18
12.7
37.3
59.3
1st
5th
2nd
6th
7rd
4th
3th
Source: Field survey, 2015 *(multiple response)
Descriptive statistics from Table 11 revealed that attack of pest and diseases were ranked first
(62.7%) while drought problems were ranked second (60.7%) for both project and non project
areas respectively. Pest and diseases might cause serious damage to legumes which might
subsequently decrease farmers productivity. Project area farmers ranked low market price of
output as third (59.3%) major constraint. This is due to accessibility problem to market and
probably bulkiness during harvest resulting to market glut. Low training on production
techniques of legumes was ranked the last (12.7%) constraint among farmers in the project area.
This is might be possible as farmers receive pre-season training on legumes production
especially planting rate, spacing, fertilizer requirement and application.

65
CHAPTER FIVE
5.0 SUMMARY, CONCLUSION AND RECOMMENDATIONS
5.1 Summary
The research analyzed determinants of inputs demand and adoption of grain legumes and
associated technologies of N2Africa in Kano state. Multi-stage sampling techniques consisting
purposive and random sampling were used in selection of 150 farmers each from project and
non-project area making a sample size of 300 farmers for the study. Descriptive statistics of the
farmers revealed that majority both in project and non-project areas possess similar socio-
economic characteristics in terms of gender, age, marital status, educational status, major source
of income and ownership structure of land except annual income, distance to input source and
household size respectively. There were also element of similarity between project and non
project areas in terms of contact with extension agents, awareness on input dealers and source of
market information.
Multiple regression result in Table 5 revealed the R2
is 32%, 47% and 44% for fertilizer, seeds
and chemical demand in project area while non-project area result revealed R2
of 37%, 49% and
48% for fertilizer, seeds and chemical respectively. This means that 32%, 47%, 44% and 37%,
49%, 48% of variations in soybean, cowpea and groundnut as dependent variables in project area
and non-project area were explained by the independent variables included in the model. In
project area with respect to fertilizer, the coefficients of farm size and annual income were found
to be positive and significant at 1% level of significance. This means that any increase farm size
and annual income leads to an increase in the quantity of fertilizer. The coefficient of price and
distance to input source were negative and significant at 5% and 1% respectively. This means
that, increase in price of fertilizer leads to decrease in quantity demanded.
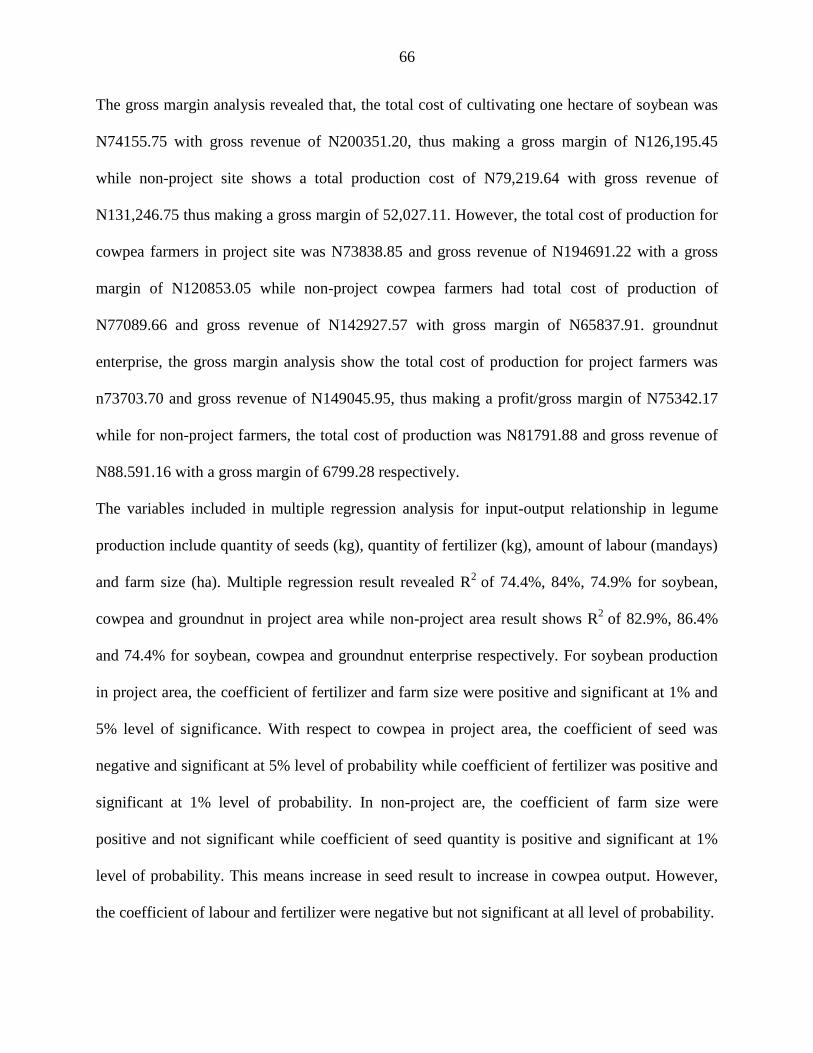
66
The gross margin analysis revealed that, the total cost of cultivating one hectare of soybean was
N74155.75 with gross revenue of N200351.20, thus making a gross margin of N126,195.45
while non-project site shows a total production cost of N79,219.64 with gross revenue of
N131,246.75 thus making a gross margin of 52,027.11. However, the total cost of production for
cowpea farmers in project site was N73838.85 and gross revenue of N194691.22 with a gross
margin of N120853.05 while non-project cowpea farmers had total cost of production of
N77089.66 and gross revenue of N142927.57 with gross margin of N65837.91. groundnut
enterprise, the gross margin analysis show the total cost of production for project farmers was
n73703.70 and gross revenue of N149045.95, thus making a profit/gross margin of N75342.17
while for non-project farmers, the total cost of production was N81791.88 and gross revenue of
N88.591.16 with a gross margin of 6799.28 respectively.
The variables included in multiple regression analysis for input-output relationship in legume
production include quantity of seeds (kg), quantity of fertilizer (kg), amount of labour (mandays)
and farm size (ha). Multiple regression result revealed R2
of 74.4%, 84%, 74.9% for soybean,
cowpea and groundnut in project area while non-project area result shows R2
of 82.9%, 86.4%
and 74.4% for soybean, cowpea and groundnut enterprise respectively. For soybean production
in project area, the coefficient of fertilizer and farm size were positive and significant at 1% and
5% level of significance. With respect to cowpea in project area, the coefficient of seed was
negative and significant at 5% level of probability while coefficient of fertilizer was positive and
significant at 1% level of probability. In non-project are, the coefficient of farm size were
positive and not significant while coefficient of seed quantity is positive and significant at 1%
level of probability. This means increase in seed result to increase in cowpea output. However,
the coefficient of labour and fertilizer were negative but not significant at all level of probability.

67
The logistic regression result suggest that the statistical parameters that indicate “goodness of fit”
of the model specified for this study are highly significant at 5% level of probability. Thus the
chi-square (χ2) of 52.07 with a degree of freedom (df) respectively indicates support for the
model, implying that the model containing the intercept and the independent variables is
accepted. Mean while, the result summary of logit regression result which gives information on
the contribution of each of the independent variables suggest that educational status, farming
experience, annual income and household size are statistically significant factors influencing
adoption of legumes technology while farm size, contact to change agents and age were not
significant. Major constraints faced by farmers with respect to input demand includes lack of
inoculants, high cost of fertilizers, improved seeds and agro-chemicals, non-availability of
inputs, problems of quality inputs, behaviour of middlemen, high distance to input source,
frequent price increase, low information (price/source), late arrival of fertilizers. Constraints
militating legumes production includes attack of pest and diseases, drought problems, attack by
pastoralist and low production techniques training.
5.2 Conclusion
The study concluded that both project and non-project area share element of similarities in terms
of some socio-economic variables. The study also concluded that, increase in prices of
agricultural inputs especially fertilizer, agrochemicals and to some extent seeds result to decrease
in quantity of those inputs purchased by farmers. Distance to input source has a negative effect
on quantity of inputs purchased by smallholder farmers particularly in project area. Farm size
and annual income of smallholder farmers also has relative influence on quantity of inputs
especially seeds and fertilizers.

68
It was also concluded that legume production is profitable but the gross margin in project area is
higher compared to non-project area. Based on this, legume farmers in project intervention area
have greater annual legume return hence having higher annual returns from legume enterprise..
This higher output that leads to higher return could be attributed to adoption of N2Africa
technologies among project farmers. There is complete absence of inoculants across both project
and non-project area. Despite the profit obtain from legume enterprises, farmers are faced with
certain inputs related problems which include high cost of inputs, non-availability of inputs, late
arrival of inputs and high distance to input source. Major problems affecting legume production
includes attack of pest and diseases, drought problems, in adequate production training and high
cost of labour.
5.3 Recommendations
Based on the findings of this study, the following recommendations are suggested:
1. There is the need for sustainable input supply policy that will ensure availability,
affordability and timely delivery of agricultural inputs for better legume production in the
study area.
2. Creation of public and private small and medium inputs outlets (enterprises) to cut the
impending distance that militate against farmers’ access to input is also important in the
study area.
3. Farmers should be encouraged to produce legume through special and adequate training
on production techniques of legumes including proper disease and pest management for
efficient productivity.
4. Planting of drought resistance legume varieties is also essential among grain legume
farmers in the study area.

69
5. Dialogue between gain legumes farmers and pastoralist should be promoted to resolve the
existing complicit in the affected areas.
6. Farmers should be encouraged to form cooperative societies to pool their resources
together to enable them to have access to improved farm inputs and to enhance the
accessibility to agricultural information and inputs.
7. Extension agents should enlighten farmers on proper farm resources allocation and
management especially efficient utilization of labour resources and fertilizers.
8. Investment in physical infrastructure, such as roads and modern markets facilities is very
essential. With respect to roads, rural feeder roads that link input and output markets to
farmers should be provided.
9. Market identification before production is also important among grain legume farmers.

70
REFERENCES
Abayomi, Y.A., J.O. Fadayomi., A. Babatola, G. Tian, (2001) Evaluation of selected legume
cover crops for biomass production: Dry season survival and soil fertility improvement in
a moist savannah location in Nigeria, Journal of African Crop Science 9 615-627.
Adinya, I.B (2001).“Factors influencing Labour Utilization in Small–Scale Cassava Production:
A Case Study Akwa Ibom State”, Unpublished M.Sc. Dissertation, University of Uyo,
Akwa Ibom State. pp1 – 69.
Adebayo, E.F., Moses, J.D. and Olawoye, H.U. (2010). Technical Efficiency of Women Farmers
in Adamawa State. Proceedings of the 24 National Conference of Farm Management
Association of Nigeria, Faculty of Agriculture, Adamawa State University, Mubi,
Nigeria, 11-14 October, 2010. pp. 267-272
Adeola, A. (2009) Productivity and Profitability Analyses of Cowpea Production in Kaduna
State. Advances in Applied Science Research, 2011, 2 (4):72-78
Adinya, B., Afu, S.M. and Ijoma, J.U. (2010).Economic Meltdown and Decline in Pineapple
Production: Determinant of production inefficiency of Pineapple-Based Alley Cropping
Practices in Cross River State, Nigeria. J. Anim. Plant Sci. 20(2):107-116.
Adinya, I.B., Kuye, O.O, Awoke, M.U., Ajayi, S., Ele, I.E., Ogbonna, K.I, Akpet, S.O, Agba,
A.O (2008).Production Function Analysis of Cassava Sole Cropping system in Akwa
Ibom State, Nigeria. Global. Journal of Pure and Appl. Sci. 14(1):13-17.
Agbaje, G.O, Ogunbodede, B.A; Makinde J.O(2002). Biological and economic efficiency of
maize and soybean intercrop patterns in rain forest and savanna areas of Nigeria. Moor
Journal of Agricultural Research. 3; 37-40
Ahmed, S., Rafay, A., Singh, R.K. & Verma, U.K. (2010). Response of groundnut varieties to
spacing. Indian Journal of Agronomy, 31(3):248-251
Ajala, S.O. (2005). A summary of the final Report Doubling Maize Production in Nigeria in two
Years; A Presidential Initiative (Nov, 2005 - Nov, 2007).
Ayinde, I.A, Okuneye, P.A., Momoh, S. and Aromolaran A.B. (2007): Socio economic factors
affecting insecticide use in cowpea production in Kano State, proceeding of the 9th
annual conference of the Nigeria Association of Agricultural Economists (NAAE), held
at AbubakarTafawaBalewa University, Bauchi, 5th
-8th
November, 2: 449-456.
Alimi, T. (2000). Resource-use Efficiency in Food production in Oyo State of Nigeria. Journal
of Agriculture and Environment, Vol. 1 pp.1–7. Usman Danfodio University, Sokoto.
Amaza, P.S., J.K. Olayemi, A.O. Adejobi, Y. Bila, and A. Iheanacho (2007). Baseline
socioeconomic survey report: agriculture in Borno State, Nigeria. IITA, Ibadan, Nigeria.
Amaza, P.S., T. Abdoulaye, Kwaghe, P. and Tegbaru, A (2009). Changes in household food
security and poverty status in PROSAB area of southern Borno State, Nigeria. IITA,
Ibadan, Nigeria.84 pp.

71
Amusa, N.A, A.A Adegbite (2006). The Major Economic Field Diseases of Cowpea in the
Humid Agro-Ecologies of South-Western Nigeria World Applied Science Journal, 1 (1):
12-18. Follow journal style.
Amsalu B., Kindie G. and Belay K. (2013) Determinants of Household Demand for and Supply
of Farm Labour in Rural Ethiopia. Australian Journal Of Labour Economics. Volume 16
• Number 3 • 2013 • pp 351 – 367
Armstrong, J. Scott (2012). "Illusions in Regression Analysis". International Journal of
Forecasting (forthcoming) 28 (3): 689. doi:10.1016/j.ijforecast.2012.02.001.
Assa, M., A. Mehire, K. Ngoma, E. Magombo and P. Gondwe (2014) Determinants of
Smallholder Farmers’ Demand for Purchased Inputs in Lilongwe District, Malawi:
Evidence from Mitundu Extension Planning Area. Middle-East Journal of Scientific
Research 19 (10): 1313-1318, 2014
Amoo B.A.G, (2005) Macroeconomic reform, agriculture and edible oil sector development in
Nigeria: Achievements, prospects and challenges in the post 1999 era, in: Proceedings of
the 19th Annual Conference of the Farm Management Association of Nigeria, Delta State
University, Asaba, Nigeria, pp. 16-25.
Brian, S.S and Sabine, L (2004). A handbook of statistical analysis using SPSS, Chapman and
Hll/ crc press company. Pp 10 – 35.
Bello M., Dauda S., Okwu O. J. (2011) Determinants for the Adoption of Farming Technologies
in Jenkwe Development Area of Nasarawa State, Nigeria. Journal of Environmental
Issues and Agriculture in Developing Countries, Volume 3 Number 1, April 2011
Chukwuji C.O.,Inoni O.E.,Ogisi O.D.,Oyaide W.J.(2006):A Quantitative Determination Of
Allocative Efficiency In Broiler Production In Delta State,Nigeria.Agriculturae
Carsky, J.S., J.G Kling (1997). Realization of maize yield potential on farmers fields-
possibilities and problems. In: B. Badu- Apraku, M.O. Akoroda M Ouedraogo, FM
Quins (eds.) (1995). Contributing to food self sufficiency: Maize researchand
development in West and Central Africa. Proceedings of a Regional Maize Workshop 29
May – 2 June 1995, IITA Cotonou, Benini Republic. PP 13-21.
David, S., Jim, H., and Daniel, C. (2013). Farm gross margin and enterprise planning guide.
Grain research and Development Corporation. Pp 1 – 8.
David A. Freedman, (2005). Statistical Models: Theory and Practice, Cambridge University
Press. Pp 11 – 51.

72
Ezeh, C.I., Onwuka., O.W. and . Nwachukwu I. N (2008) Correlates of Inorganic Fertilizer
Consumption Among Smallholder Farmers In Abia State, Nigeria. Journal of Agriculture
And Social Research (Jasr) Vol. 8, No.1, 2008
FAO (2011): Farming System and Poverty: Improving Farmers Livelihood a Changing World
Federal Ministry of Agriculture, Water Resources and Rural Development (FMA)
(1984) planning for adequate in raw materials for Food production in Nigeria "Agro
Agua Bulletin Vol. 1
Food and Agricultural Organization (FAO) (2004). FAO Statistics. Food and Agricultural
Organization, Rome, Italy. {http:www.apps.fao.org}
Feder, G., R.E. Just, and D. Zilberman. (1985). Adoption of agricultural innovations in
developing countries: a survey. Economic Development and Cultural Change 33: 255-
296.
FAO, Eradicating hunger: Moving from pilot projects to National programmes to meet the world
food summit goal, 2010, FAO Document Repository, http://www.FAO.org.
Food and Agriculture Organization (1997). Gender Role and Gender Relatives in Developing
Countries: FAO. Italy, Rome.
Fleck, H. (1981): Introduction to Nutrition. Macmillan Publishing Company Inc. New York pp
55 – 86.
G. A. Abu (2012) Comparative productivity under special crop programme in Benue State,
Nigeria: A case of project and non-project soybean growers. Journal of Cereals and Oil
seeds Vol. 3(4), pp. 48-55, December, 2012. Available online at
http://www.academicjournals.org/JCO
Gujarati, D.N. (2004). Basic Econometrics: fourth edition. Tata McGraw-Hill Publishing
Company Limited, New Delhi, pp: 580-625.
Haji, B. (2003). Adoption of Crossbred Dairy Cows in Arsi Zone: The Case of Tiyo and Lemu-
Bilbilo Woredas, Ethiopia.
Ibrahim, A.B., Zongoma, A. and Shettima, B.G (2006).Comparative Economic Analysis of
Adopters and Non-adopter of improved Rice Variety Among Farmers in Hauwul Local
Government Area of Borno State. A paper presented at 20th Annual National
Conference of Farm Management Association of Nigeria held at Forestry Research
Institute of Nigeria, Federal College of Forestry Jos, Plateau State 18th –21st Sept, 2006
pp. 268-272.
Idrisa, Y.L., Ogunbameru, B.O. and Shehu, H, (2012). Effects of adoption of improved maize
seed on household food security in Gwoza Local Government area of Borno state,
Nigeria

73
IFAD, (2009) Enabling Poor People to Overcome Poverty in Nigeria [Online], http://www.
ruralpovertyportal. org.
IFAD, Enabling Poor People to Overcome Poverty in Nigeria [Online], 2009, http://www.
ruralpovertyportal.org.
Isah, H.1., E. F. Adebayo, Muhammad Bala, Offar Gwandi (2013) Profitability of Sole Cowpea
Production in Gombi Zone Of Adamawa State Agricultural Development Programme,
Nigeria. American Journal of Advanced Agricultural Research (AJAAR) Isah, H, et al.,
Vol. 1, Issue. 1, pp.41-52, 2013
Jackline Bonabana-Wabbi, 2002. Assessing Factors Affecting Adoption of Agricultural
Technologies: The Case of Integrated Pest Management (IPM) in Kumi District, Eastern
Uganda
Kano state agricultural and rural development authority (KNARDA) Headquaters, kano – 2011
Bulletin
Katsa, M.K., A.A. Maku,( 2004) The potential of single-cell protein (SCP) as alternative source
of the protein, in: Proceedings of a Workshop of the Institute of Food Science and
Technology Middle-Belt Chapter, University of Agriculture, Makurdi, Nigeria, pp. 51-
62.
Modu Y, Alice J.P, Petu A.M, (2009). An Economic Analysis of Cowpea Production among
Women Farmers in Askira/Uba Local Government Area Borno State Nigeria. African
Journal of General Agriculture. Vol. 6, No. 1
Mukhtar, A.A. (2009). Performance of three groundnut (Arachis hypogaea L.) varieties as
affected by basin size and plant population at Kadawa. Ph.D. Dissertation Submitted to
post graduate school, Ahmadu Bello University, Zaria pp 173
Musa, Y.H., Vosanka, I.P., Inuwa, A and Mohammed, S. (2010) Economic Analysis of Cowpea
Production In Donga Local Government Area Of Taraba State, Nigeria. Journal of
Sciences and Multidisciplinary Research. Volume 2, December 2010. 2010 Cenresin
Publications
Meinzen-Dick, R., Knox, A., Place, F., & Swallow, B. (2002). Innovation in Natural Resources
Management: The Role of Property Rights and Collective Action in Developing
Countries.
Meinzen-Dick, R., Adato, M., Haddad, L., & Hazell, P. (2004). Science and Poverty: An
Interdisciplinary Assessment of the Impact of Agricultural Research.
National population commission (NPC) (2006). Briefing on the world population day in Abuja as
reported by The Guardian Newspaper, No.28, vol. 11885, july 12, 2011
Nweze, N.J (2002). Agricultural Production Economics: An Introductory Text AP Express
Publishers Limited, Nigeria.

74
Obilana, A.T., Fajemisin, J.M (1977). Methodology of improving maize varieties (Zea mays L.)
in Nigeria. Paper presented at the 3rd National Seed Improvement Course, August 15 –
September 16, 1977. Moor Plantation, Ibadan.
Ogunbile A.O., Tabo R. and Rahman S.A. (2002). Factors affecting adoption of ICSVIIII and
ICSV 400 sorghum varieties in Guinea and Sudan Savannah of Nigeria. The plant
scientist (3): pp 32-35.
Olayide, S. O. and Heady, E. O. (1982). Introduction to Agricultural Production Economics.
Ibadan: University Press. Pp 1 – 27.
Olukosi J. O., Isitor, S. U. and Ode, M. O. (2007). Introduction to Agricultural Marketing;
Principles and Application. 3rd Edition.G. U. Publisher, Abuja, Nigeria. Pp. 47 – 57.
Olorunsanya, E. (2009) Economic Analysis of Soybean Production In Kwara State, North
Central Nigeria Global Approaches to Extension Practice (GAEP), vol. 5, no. 2, 2009
Orebiyi, J.S., Benchendo, N. G. And Onyeka, U.P. (2007) Determinants of Contact Farmers
Adoption of Improved Cassava Production Technologies in Imo State, Nigeria
Panwal, E.F, Nweze, J.N, Banwar, J. (2006).Resource –Use and Productivity Among Rain-fed
and Irrigated Irishi Potato producers in Plateau State Nigeria. A paper Presented at 20th
Annual National Conference of Farm Management Association of Nigeria held at
Forestry Research Institute of Nigeria, Federal College of Forestry Bauchi, Plateau State
.18th -21st September, 2006. pp. 25-29.
Petu-Ibikunle, A.M., Abba-Mani. F., Odo. P.E., (2008) Determination of Rate and time of
Nitrogen Application on Cowpea variety in the Sudan Savannah zone. International
Journal of Academic focus series 1(1): 13-21.
Pindyck, S.R and Rubinfeld, L.D. (1998). Econometric models and economic forcasts, 4th
edition. New York: McGraw-Hill.
Pannell, D., G. Marshall, et al. (2006). "Understanding and promoting adoption of conservation
technologies by rural landholders." Australian Journal of Experimental
Agriculture 46(11): 1407 1424.
Richathofen, J.V., H. Pahl, T. Nemecek (2006,), Grain legumes for sustainable agriculture,
http://www.grainlegumes.com/.../economic...grain_legumes/grain_legumes_for_sustaina
ble_agriculture.
Rose Omelo et al (2012) IITA R4D review. Research to nourish Africa at 45 (1967 – 2012)
United Nations Development Program (1999).Human Development Report 1-10.
http://www.sciencewebpublishing.net/jacr
Rogers, E.M. 1995. Diffusion of Innovations. 4th ed. Free Press, New York.

75
Shaib, B, A Aliyu, J.S. Bakshi, (1997) Nigeria: National Agricultural Research Strategy Plan
1996-2010, Federal Ministry of Agriculture and Natural Resources, Abuja, Nigeria, p.
137.
Szyrmer, J., L.Boros, (2006) The production of grain legumes in Poland, ,
http://www.grainlegumes.com/grain legumes/the production of grain legumes in poland.
Stanger, A.M.J (2000), Home based business marginality: A review of home based business
performance and its determinant. School of commerce Research paper series 18(3):17
Solomon Asfaw, Bekele Shiferaw, Franklin Simtowe and Mekbib Gebretsadik Haile, (2011).
Agricultural technology adoption, seed access constraints and commercialization in
Ethiopia
Taru1 V. B., I. Z. Kyagya and S. I. Mshelia (2010) Profitability of Groundnut Production in
Michika Local Government Area of Adamawa State, Nigeria. Journal of Agri Sci, 1(1):
25-29 (2010)
Taphee G.B., and A.A.U. Jongur (2014) Productivity and Efficiency of Groundnut Farming in
Northern Taraba State, Nigeria. Journal of Agriculture and Sustainability ISSN 2201-
4357 Volume 5, Number 1, 2014, 45-56
Trichopoulou, A., Naska, A. and Costacou, T. (2002).Disparities in Food Habits across
Europe.Proceedings of the Nutrition Society 61: 553–558. Uwakah, C.T. (1983). “The role of Agricultural Extension in Agricultural Development in
Nigeria.”Proceedings of the Training workshop on Rural Agricultural Extension held at
NRCRI, Umudike, Pp. 29-37.
Versteeg, M.N., F. Amadji, A. Eleka, A. Gogan, D. Koudokpon, (1998) Farmers adaptability of
mucun fallowing and agro-forestry technologies in the coastal Savannah of Benin,
Agricultural Systems 56 269-287.
Voh, J.P. (1982). “A study of factors associated with the adoption of recommended farm practices in
the Nigerian Village’. Agricultural Administration.32 (9): 104 – 109.
Victor A. (2004). Pseudo maximum likelihood estimation of structural models involving fixed
point problems. Economic letters, 84(3): pp 335-340.
Ya’aishe M, Alice J. Putai and A. M. Petu-Ibikunle (2009) An Economic Analysis of Cowpea
Production among Women Farmers in Askira/Uba Local Government Area, Borno State
Nigeria. Afr. J. Gen. Agric. Volume 6, No. 1 (2010)
World Bank, Project Appraisal Document on a Proposed LOAN/CREDIT to Republic of Nigeria
for a Third National Fadama Development Project, Report, No. 39489-NG, 2007, pp. 19-
22.
World Bank (2011) Annual report on Agriculture. http://www .sciencewebpublishing.net/jacr
76
DEPARTMENT OF AGRICULTURAL ECONOMICS AND EXTENSION
FACULTY OF AGRICULTURE
BAYERO UNIVERSITY KANO
RESEARCH QUESTIONNAIRE
Dear Respondent;
I am a student of the above named institution from Department of Agricultural Economics and
Extension, Faculty of Agriculture conducting research on a topic titled “Determinants of Inputs
Demand and Adoption of Grain Legumes and Associated Technologies of N2africa in Kano
State, Nigeria”. Please, you are requested to respond accordingly as the information would be
use confidentially for academic purpose. Thanks.
MUHAMMAD HALLIRU
SPS/12/MEX/00006

77
Section A: Socioeconomic Characteristics of Farmers 1. L.G.A……………………Village…………………Questionnaire ID…………………….
2. Type of Village: a. Project site { } b. Control site { }
3. Name (Respondent)……………………………. Mobile No……………………………....
4. Crops: Legume:1)…………….2)……………..3)…………......Cereal:4)…………………
5. Sex a. Male { } b. Female { }
6. Marital status a. Single { } b. Married { } c. Divorced { } d. Widow { }
7. Household size…………………………………………………………………..
8. Household composition related to farm-plots defined in labour, consumption e.t.c
Respondent (start with
household
head)
Male=1
Female=2
Age
(yrs)
Occupation
1=farming
2=civil service
3=livestock rearing
4=trading
5=others(specify)
Farmingex
perience (yrs)
Education level
1=no formal education
2=primary education
3=secondary education
4=tertiary education
Labour participation
1=full time farmer
2=part-time farmer
3=not a farmer
4=others(specify)
Household head
9. Household total land(ha)
Asset name Number of hectares
Total cultivable land area
Total cultivated area
Total area fallow
Area planted with soybean
Area planted with cowpea
Area planted with groundnut
Area planted with cereals
10. Give detail routine of plots separately in the Table below(year 2014):
Plot variables Plot/values
Plot 1 Plot 2 Plot 3 Plot 4
Size (ha)
Irrigated/rain fed
Ownership
Cultivated last 3 years(yes/no)
Soil type

78
Distance home walking (hrs)
Main decision maker
2014 rainy season cultivated (yes, fallow, leased out, grazing)
Crop type 1
Variety crop type 1
Source seed crop type 1 variety 1(refer to code A)
Inter-strip cropped crop type 1, variety 1
Land size crop type 1, variety 1 (ha)
Planting date crop type 1, variety 1
Number of bags harvested (50kg) crop type 1, variety 1
Inputs used crop type 1, variety 1
Fertilizer inorganic
Type 1 of fertilizer inorganic
Amount used inorganic fertilizer type 1 crop type 1, variety 1 (kg)
Source fertilizer type 1, crop type 1, variety 1
Type 2 of fertilizer inorganic
Amount used inorganic fertilizer type 2 crop type 1, variety 1 (kg)
Source fertilizer type 2, crop type 1, variety 1(refer to code A)
Herbicide used crop type 1, variety 1
Manure used
Bags expected to harvest crop type 1 variety 1
Reasons for less bags harvested versus expected *
Inputs-seeds wanted to apply-use but did not for crop type 1, var. 1
Crop type 2
Variety crop type 2
Source seed crop type 2, variety 1(refer to code A)
Land size crop type 2 (ha), variety 1
Planting date crop type 2, variety 1
Number of bags harvested (50kg) crop type , variety 1
Inputs used crop type 2, variety 1
Fertilizer inorganic
Type 1 of fertilizer inorganic
Amount used inorganic fertilizer type 1 crop type 2, variety 1 (kg)
Source fertilizer type 1, crop type 2, variety 1
Type 2 of fertilizer inorganic
Amount used inorganic fertilizer type 2 crop type 2, variety 1 (kg)
Source fertilizer type 2, crop type 2, variety 1(refer to code A)
Herbicide used crop type 2, variety 1
Manure used
Bags expected to harvest crop type 2 variety 1
Reasons for less bags harvested versus expected*
Inputs-seeds wanted to apply-use but did not for crop type 2, var. 1
11. Did legume production increase in the last 2 – 3 years? a.Yes { } b. No { }
12. Average annual income (in Naira)……………………………………………………
13. Membership of cooperative society a. Member { } b. Non-member { }
14. If non-member, state reason(s)…………………………………………………………
15. If member, state name of the cooperative group………………………………………

79
16. Are those cooperatives functioning? a Yes { } b. No { }
17. If yes, state the functions………………………………………………………………
18. Agricultural information source a. Extension agent{} b. Media{} c. fellow farmers{}
19. Do you have contact to extension agent? Yes { } No { }
20. If yes, what is the frequency of your contact to extension agents?
Daily { } b. weekly { } c. Fortnightly { } d. Monthly { } d. others { }
21. Usefulness of contact: a. very useful { } b. useful { } c. not useful { } d. can’t tell { }
Section B: Input Demand among Smallholder Farmers
22. Awareness about input suppliers/dealers Aware { } Not aware { }
23. Are those input dealers available in your area Available { } Not available { }
24. Do you purchase inputs in your production? Yes { } No { }
25. State the input source, weather quantity meet demand and gap (if quantity not satisfied)
Inputs Source (code A) Meet qty demand (1=Yes, 2=No) if no (Input gap in kg)
Inoculants
Seeds
Fertilizers
Insecticides
Pesticides
Code A: 1=Research institutes 2=ADPs 3=open markets 4=Input companies 5=Agro dealers
6=Others (specify)
26. What is the distance to the input source (km)…………………………………….
27. Do you regularly have information on input prices a. Yes { } b. No { }
28. if yes indicate sources of your market information a. market visit { } b. media (TV/Radi)
{ } c. other farmers { } d. middlemen { } e. extension agents { } f. others { }
29. Willingness to order inputs through farmers group s/n Likeness to buy Certified inputs component
Inoculants Improved Seeds Fertilizers Pesticides Insecticides
1. Very likely
2. Likely
3. May be
4. Unlikely
5. Very unlikely
6. Don’t know
30. What is your opinion/hope on market price of inputs?
a. good market price { } b. not so good { } c. low market price { }
Section C: Awareness and Rate of Adoption of N2 African Technology among Farmers
31. Which of these technologies have you adopted on N2 Africa phase 1 Activities?
Are you aware
of this
Do you
try it
Do you
adopt it
If yes indicate
the year of

80
S/N Recommended Technology technology first adoption
Yes No Yes No Yes No
1 Soybean variety
2 Soybean Phosphorus Fertilizer and inoculant trial
3 Cowpea variety and phosphorus trial
4 G/nut variety trial
5 G/nut variety and phosphorus fertilizer trial
6 G/nut cropping system trial
7 Cowpea variety
8 Cowpea cereal strip/relay cropping trial
9 Inter-row spacing
10 Intra-row spacing
11 Agro-chemicals application
Section D: Input Utilization of Legume-cereal Production
32. What are the resources used in legume-cereal production?
Input 2013 2014 2015 Source
(code A) Qty used
in kg
Cost/unit
(N/kg)
Total
cost(N)
Qty used
in kg
Cost/unit
(N/kg)
Total
cost(N)
Quantity
Required(kg)
Inoculants
Fertilizers
S.S.P
N.PK
UREA
Manure
Compost
FYM
Seeds
Cowpea
Soybean
Groundnut
Cereal
Chemicals
Insecticide
Herbicides
Code A: 1=Research institutes 2=ADPs 3=open markets 4=Input companies 5=Agro
dealers 6=Others (specify)
33. Which kind of labour is used on the farm?
a) Family { } b. Hired { } c. Family and hired { }
34. Complete the Table regarding labour used in legume-cereal production (plot size):
Paid labour Family labour
S/n Operation No. of
labourers
No. of
hours/day
No. of
days spent
Unit cost
(N)
No. of
labourers
No. of hrs
spent/day
No. of
days spent
1. Land preparation
Adult male
Adult female
Children
2. Planting

81
Adult male
Adult female
Children
3. Fertappl (1st&2
nd )
Adult male
Adult female
Children
4. Weedng (1st&2
nd )
Adult male
Adult female
Children
5. Harvesting
Adult male
Adult female
Children
35. Do you own farm implements a. Yes { } b. No { }
36. If yes, provide the following information:
S/n Type Qty Unit cost (N) Years of purchase life span Total cost(N)
1. Hoe
2. Cutlass
3. Sprayer
4. Others
37. Did you borrow/hired any type of agricultural equipment this year? Yes { } No { }
38. If yes, specify the equipment below: s/n Type Source Purpose Condition of working Rate (N/ha)
1.
2.
3.
Condition: 1= Good, 2=Fair, 3=Poor
Source: 1=ADP, 2=Ministry, 3=LGA, 4=Private, 5=Others
39. Provide information on Legume-cereal harvested during the 2 years by Household.
Crops Variety 2013 2014
Area
(ha)
Production Area (ha)
Production
Quantity Unit (Code A) Quantity Unit (Code A)
Cowpea
Soybean
G/nut
Cereal
Code A: 1= kg, 2= Kwano, 3= 50kg Bag, 4= 100kg Bag, 5= Ton, 6= Other Unit (Specify)
40. Provide the following information on legume-cereal harvest (all plots) for this year: Crops Variety Total
output
(kg)
Qty sold
(kg)
Unit price
(N)
Total (N) Qty saved
as seed
(kg)
Qty stored
(kg)
Cosmpn
Qty(kg)
Gift Qty
(kg)
13 14 13 14 13 14 13 14 13 14 13 14 13 14 13 14
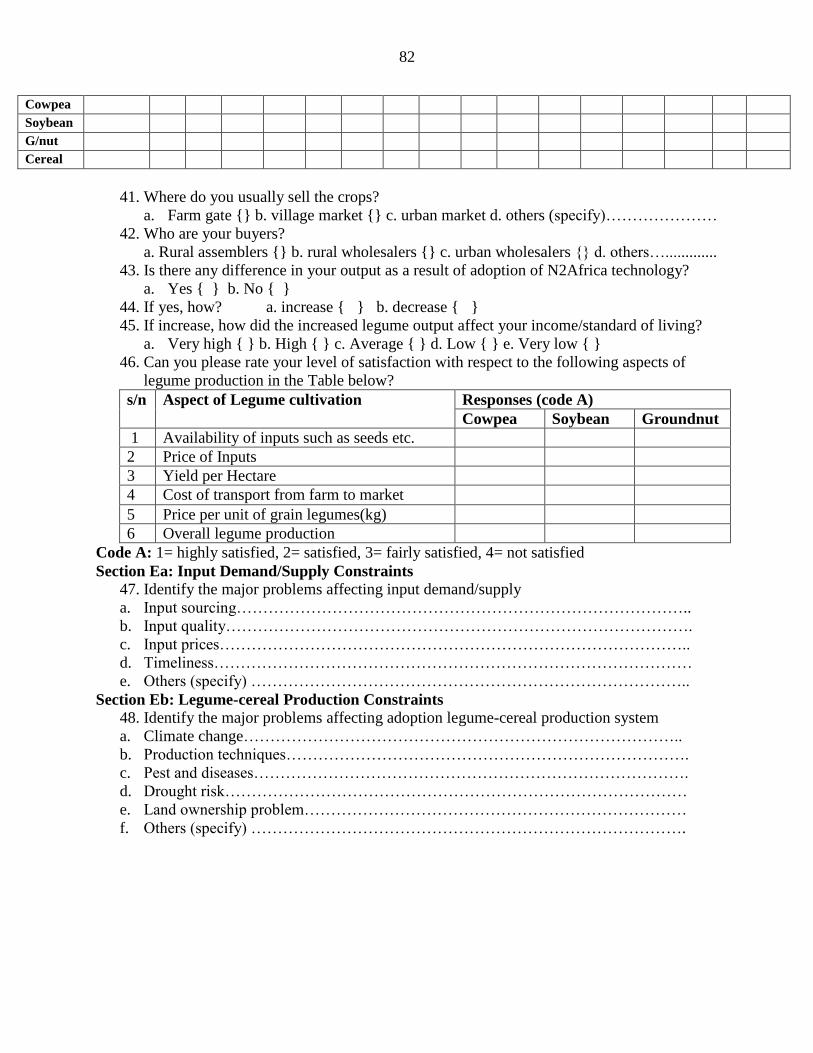
82
Cowpea
Soybean
G/nut
Cereal
41. Where do you usually sell the crops?
a. Farm gate {} b. village market {} c. urban market d. others (specify)…………………
42. Who are your buyers?
a. Rural assemblers {} b. rural wholesalers {} c. urban wholesalers {} d. others….............
43. Is there any difference in your output as a result of adoption of N2Africa technology?
a. Yes { } b. No { }
44. If yes, how? a. increase { } b. decrease { }
45. If increase, how did the increased legume output affect your income/standard of living?
a. Very high { } b. High { } c. Average { } d. Low { } e. Very low { }
46. Can you please rate your level of satisfaction with respect to the following aspects of
legume production in the Table below?
s/n Aspect of Legume cultivation Responses (code A)
Cowpea Soybean Groundnut
1 Availability of inputs such as seeds etc.
2 Price of Inputs
3 Yield per Hectare
4 Cost of transport from farm to market
5 Price per unit of grain legumes(kg)
6 Overall legume production
Code A: 1= highly satisfied, 2= satisfied, 3= fairly satisfied, 4= not satisfied
Section Ea: Input Demand/Supply Constraints
47. Identify the major problems affecting input demand/supply
a. Input sourcing…………………………………………………………………………..
b. Input quality…………………………………………………………………………….
c. Input prices……………………………………………………………………………..
d. Timeliness………………………………………………………………………………
e. Others (specify) ………………………………………………………………………..
Section Eb: Legume-cereal Production Constraints 48. Identify the major problems affecting adoption legume-cereal production system
a. Climate change………………………………………………………………………..
b. Production techniques………………………………………………………………….
c. Pest and diseases……………………………………………………………………….
d. Drought risk……………………………………………………………………………
e. Land ownership problem………………………………………………………………
f. Others (specify) ……………………………………………………………………….


