Determinants of University participation in EU R&D Cooperative Projects * by Aldo Geuna MERIT, University of Limburg First Draft: February 1995 This Draft: April, 1996 * The useful comments and suggestions of Cristiano Antonelli, Anthony Arundel, Alfonso Gambardella, Paul David, Ed Steinmueller and Katy Wakelin are gratefully acknowledged, as well as the financial support of the European Union Human Capital and Mobility Program, Contract Nr. ERB4050PL930320.
Transcript
Determinants of University participation in EU R&D Cooperative Projects
*
by
Aldo Geuna
MERIT, University of Limburg
First Draft: February 1995
This Draft: April, 1996
* The useful comments and suggestions of Cristiano Antonelli, Anthony Arundel, Alfonso Gambardella, Paul David,Ed Steinmueller and Katy Wakelin are gratefully acknowledged, as well as the financial support of the EuropeanUnion Human Capital and Mobility Program, Contract Nr. ERB4050PL930320.
For the development of international scientific collaboration see among others Luukkonen et al. (1992). 1
For the continuation of cooperation after the end of the project see AXION (1995). 2
For the reasons of this choice see Section 3.3
1
1. Introduction
In the course of implementing the succession of Framework Programmes EU's research
and development policy has advanced in budgetary scope. An enlarged number of institutions
are taking part in R&D cooperative projects funded by the European Commission. In the Third
Framework Programme the institutions classified under the label of Higher Education Institutions
(HEIs), almost exclusively universities, are the largest single type of institution in terms of the
number of participations.
The increasing participation of HEIs in each successive Framework carries important
consequences both for the funding structure of universities and for the process of network
formation and internationalization of research. Consider, for example, the situation in the UK.
When we compare funding for each university from European Community sources and from
research grants and contracts of the Research Councils in 1992-1993, we find that, on average,
European Community funds are 21% of Research Councils funds, but for about 10% of the
institutions they represents more than 50%. When we look at indicators of the dynamics of
knowledge production, they show a more internationalized process, reflecting the
internationalization of network structure. Framework Programmes represent a suitable vehicle1
to develop or reinforce linkages for a more extensive European Research network. Thus, the
participation in EU R&D cooperative projects may have important impacts on the future research
potentialities of the participants . 2
The purpose of this paper is to study which are the factors that influence university
participation in EU R&D cooperative projects. In particular, we analyse the relevance for
university participation of: a) the characteristics and behaviour of the universities, b) the
behaviour of the funding agency, and c) the un-intended consequences of the selection
mechanisms for allocating funds. The unit of analysis can vary from the most disaggregate level
of the research group to the entire institution. For the present study, we develop a cross country
analysis at the university level. To generate an unbiased unalysis, the availability of information3
on the reference population is extremely important. In our case is possible to consider the totality
of recognized European universities as the total population. We constructed a data-set including
the total population of European universities. On the top of institutional information we gathered
the number of times each university took part in a R&D cooperative project in the First, Second
and Third Framework Programmes. On the basis of this original data-set, we formulate an
See for example Dasgupta and David (1994), David (1994), Arora, David and Gambardella (1995).4
The Community reimburses up to 50% of project actual costs to companies or research institutes, and to5
universities and other higher education establishments it reimburses the 100% of additional costs.
See Commission of the European Communities, 1992, EC Research Funding. A guide for Applicants. 6
2
empirical model to test for the relevance of different factors on both the probability of joining
a EU R&D project and the actual number of participations in projects.
This study has to be understood in the framework of the analysis of resource allocation
criteria. Together with the papers of Gambardella and Garcia-Fontes, and Garcia-Fontes and4
Geuna published in this collection, it represents the first output of a larger research programme
for understanding the institutional mechanisms and resource allocation criteria characterizing
publicly financed research.
The paper is organized as follows. In Section 2 we discuss the increasing participation
of HEIs in cooperative R&D projects of the Community Framework Programmes. In Section 3,
after the presentation of the unit of analysis and the description of the data-set, we introduce the
factors that may influence university participation in EU R&D projects. The econometric model
and the interpretation of the results are offered in Section 4. Finally, in Section 5 policy
implications and conclusive remarks are put forward.
2. HEI participation in Community Programmes
Recent efforts of the European Union to establish a targeted programme for improving
industrial competitiveness through the mechanism of funded research officially began with the
First Framework Programme (1984-1987). The Framework was set up with the goal of
strengthening strategic areas of European competitiveness. The mechanisms selected for the
Framework included a) funding the R&D effort of private firms, research institutes, higher
education institutes in the strategic areas, and b) attempting to allocate funding to stimulate the5
formation of research networks spanning organizational and national boundaries. With the
Second Framework Programme (1987-1991) the Community decided to use the Framework as
"..the basis and instrument of European research and technology policy....thus providing a clear
structure for long term overall objectives". A comprehensive political strategy on technology,6
enjoying equal status with other key Community policy areas, was set. The Third Framework
Programme (1990-1994) is characterized by the regrouping of activities around only three
strategic areas with 15 separate programmes and by the reinforcement of the aim of convergence
As is clearly stressed in Commission of the European Communities (1992; p.11), "...where projects are evenly7
matched in qualitative terms, preference will be given to projects involving participants from technologically lesswell developed regions."
3
among the member states of the EU. Lastly, the Fourth Framework Programme (1994-1998)7
pursues the guide lines of the previous one, putting more emphasis on the consistency between
Sources: Commission of the European Communities (1994). It includes activities that were not encompassed in the other Frameworks.*
In the course of implementing the succession of Frameworks, EU's research and
technological development policy has advanced in budgetary scope, as is illustrated in Table 1,
and has developed a few key goals. In particular, the total budget of the Fourth Framework is
more than three times that of the first in nominal value. Moreover, in the last ten years the main
aims of EU's research and technological development policy have been clearly defined. Of
particular importance are the following three (CEC, 1992; p.8):
i) Stimulus to "cross-border cooperation, coordination, and mobility between industry and
science" to realize a scientific and technological cohesion among the European countries;
ii) Support to "basic research...for which medium-sized companies frequently do not have the
necessary personnel or capital";
iii) Harmonization of "research and technology into the concept of completing the single internal
market in Europe".
For the Third Framework Programme the figure refers to circa the 85% of the contracts.8
4
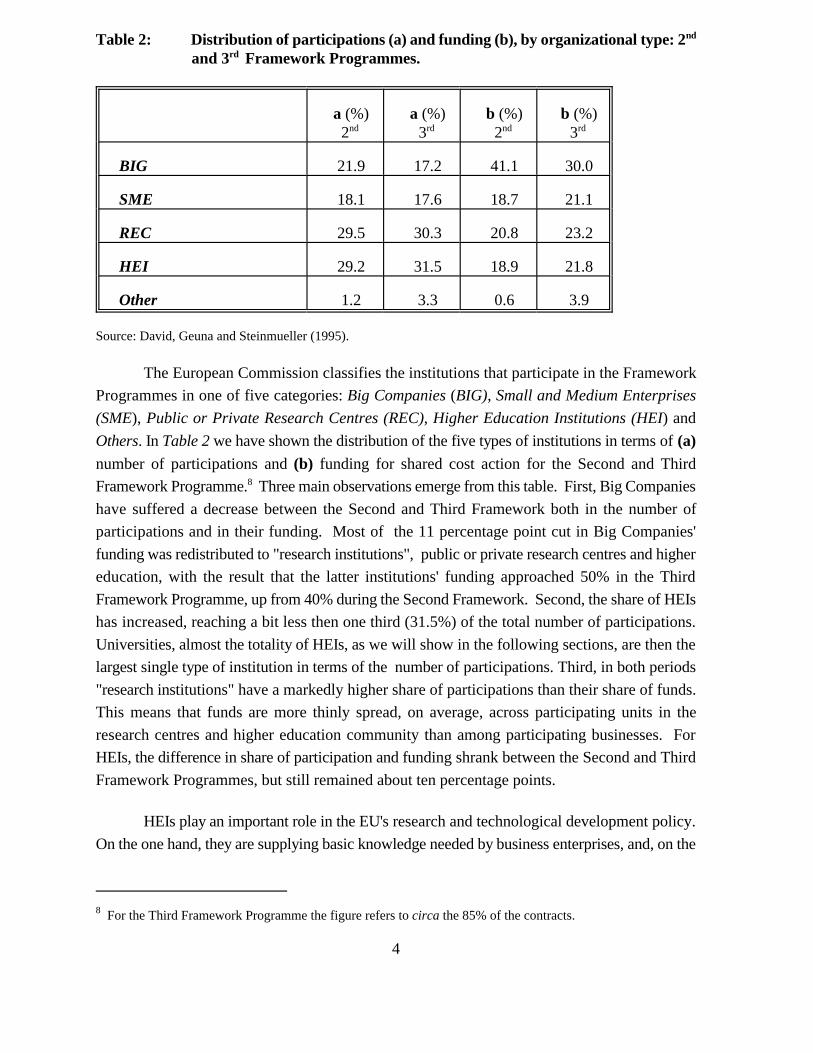
Table 2: Distribution of participations (a) and funding (b), by organizational type: 2nd
and 3 Framework Programmes.rd
a (%) a (%) b (%) b (%)2 3 2 3nd rd nd rd
BIG 21.9 17.2 41.1 30.0
SME 18.1 17.6 18.7 21.1
REC 29.5 30.3 20.8 23.2
HEI 29.2 31.5 18.9 21.8
Other 1.2 3.3 0.6 3.9
Source: David, Geuna and Steinmueller (1995).
The European Commission classifies the institutions that participate in the Framework
Programmes in one of five categories: Big Companies (BIG), Small and Medium Enterprises
(SME), Public or Private Research Centres (REC), Higher Education Institutions (HEI) and
Others. In Table 2 we have shown the distribution of the five types of institutions in terms of (a)number of participations and (b) funding for shared cost action for the Second and Third
Framework Programme. Three main observations emerge from this table. First, Big Companies8
have suffered a decrease between the Second and Third Framework both in the number of
participations and in their funding. Most of the 11 percentage point cut in Big Companies'
funding was redistributed to "research institutions", public or private research centres and higher
education, with the result that the latter institutions' funding approached 50% in the Third
Framework Programme, up from 40% during the Second Framework. Second, the share of HEIs
has increased, reaching a bit less then one third (31.5%) of the total number of participations.
Universities, almost the totality of HEIs, as we will show in the following sections, are then the
largest single type of institution in terms of the number of participations. Third, in both periods
"research institutions" have a markedly higher share of participations than their share of funds.
This means that funds are more thinly spread, on average, across participating units in the
research centres and higher education community than among participating businesses. For
HEIs, the difference in share of participation and funding shrank between the Second and Third
Framework Programmes, but still remained about ten percentage points.
HEIs play an important role in the EU's research and technological development policy.
On the one hand, they are supplying basic knowledge needed by business enterprises, and, on the
5
other hand, they are benefitting from gaining access to complementary expertise and
instrumentation in Big Companies' R&D laboratories. Moreover, for HEIs, participation in a
Framework project means not only access to EU funding, but also the opportunity to interact
with industry and other research organizations in the formation of new, high quality research
networks. This is extremely important, especially for those countries with lower scientific and
technological resources, because it enables such countries to overcome the constraints imposed
by the small size of their research community.
Table 3: Collaborative links involving HEI and REC, by Framework.
Organization type 2 Framework 3 Framework nd rd
HEI REC HEI REC
HEI 25.6% 36.0% 29.8% 42.4%
REC 36.7% 28.6% 40.6% 28.5%
BIG 19.6% 18.5% 14.8% 14.1%
SME 16.6% 15.4% 12.1% 12.1%
Other 1.5% 1.5% 2.7% 3.1%
Source: David, Geuna and Steinmueller (1995).
In Table 3 we have shown the evolution of collaborative links by organization type for
HEIs and RECs. In moving from the Second to the Third Framework programmes, the number
of HEIs' links with other HEIs and with research centres, both increased. 29% of their links are
still with industrial partners. The number of links are affected by the increasing numbers of HEIs
and RECs participating in the framework. Despite this increase, university-industry
collaborations remain important in the Third Framework. When we consider the total number of
collaborative links, we can identify three relevant groups. First, the industrial group --i.e.
collaborative links BIG-BIG, SME-SME and BIG-SME-- with about 30% and 19% of the links
in the Second and Third Frameworks respectively. Second, the research group --i.e.
collaborative links HEI-HEI, REC-REC and HEI-REC-- which have not only the largest but also
an increasing share of links, circa 39% and 50%. Third, the hybrid group --i.e. collaborative links
across the institutions of the two previous groups-- with about 30% and 27% of the links
respectively. The cooperation between "research institutions" and industry, characteristic of the
hybrid group, although decreasing is nonetheless significant part of the picture.
Finally, we have looked at the EU contractual funding across different programmes for
HEIs. On the one hand, when we consider the share distribution for each programme by type of
We do not take into account the programmes under the heading Improvements To European Scientific And9
Technological Cooperation due to their specific character.
Only Environment, among the programmes of the previous group, receives in absolute terms a relevant share of10
funds (16%).
As the Fourth Framework Programme pursues the guide lines of the previous one and as we can presume11
consistency in the policy behaviour of the Commission one may expect that the trend will be confirmed.
Impact and unintended effects of EU funding upon the allocation of national public and private research funding12
going to higher education institutions --i.e. university departments-- in UK are discussed in David, Geuna andSteinmueller (1995; pp. 32-42).
6
participant we identify a group of programmes in which HEI have about 50% of the funds. They
are Step/Epoch, Bridge and Science And Technology For Development, in the Second9
Framework, and Environment, Marine Science And Technology, Biotechnology and Life
Sciences And Technologies For Developing Countries, in the Third Framework. On the other
hand, when we focus on the share distribution for each type of participant by programme the
previous group of university-oriented programmes loses importance. The two industrially-
oriented programmes, Esprit and Brite-Euram, and their continuations under the Third
Framework Programme, are always the most important sources of HEI funding. 10
At the end of the Third Framework Programme HEIs are the largest single type of
institution in terms of the number of participations. They have developed collaborative links
especially with other research institutions, taking nonetheless part in an important number of
projects with industrial partners. Finally, although they are the dominant player in a few
Framework Programmes particularly oriented towards HEIs, they are also present with a relevant
share in the industrially-oriented programmes.
The previous analysis enables us to highlight four main observations. First, if the
financial trend of the Third Framework Programme is continued in the Fourth Framework
Programme, the distribution of funds by type of participant will tend to become homogeneous11
across the groups. Second, the increasing share of HEI, within a Framework Programme
characterized by a growing budget, implies a more important impact of EU funds on the higher
education finance system. In particular, in a period of budget cuts, restructuring and
internationalization of the European higher education system, the availability of a new
competitive source can have extremely important consequences. Third, the growing budget of12
the Framework Programme represents a vital opportunity for institutions in countries with little
resources to overcome the constrains imposed by the small size of the national research
community. Forth, in the course of the three Framework Programmes HEI have developed
varied ways to draw upon the EU funds. They have joined cooperative project that range from
grant to university consortia for basic research to university/industry cooperation in market-
oriented research.
We do not take into account Luxembourg. 13
The class new universities refers to the 39 UK Polytechnics and Colleges that have been granted university status14
in 1992-93. As they were mainly teaching institutions, it is important to differentiate them from the other UKuniversities.
7
Having stated that, it becomes crucial to understand why some universities and other post
secondary education institutions are taking part with different frequency in cooperative projects
within the EU Framework Programme. In the next section, after the presentation of the unit of
study and the description of the data-set, we shall focus our analysis on the understanding of the
determinants of university participation in EU R&D cooperative projects. Then, in Section 4,
we shall estimate an econometric model for university participation.
3. University participation in EU R&D cooperative projects
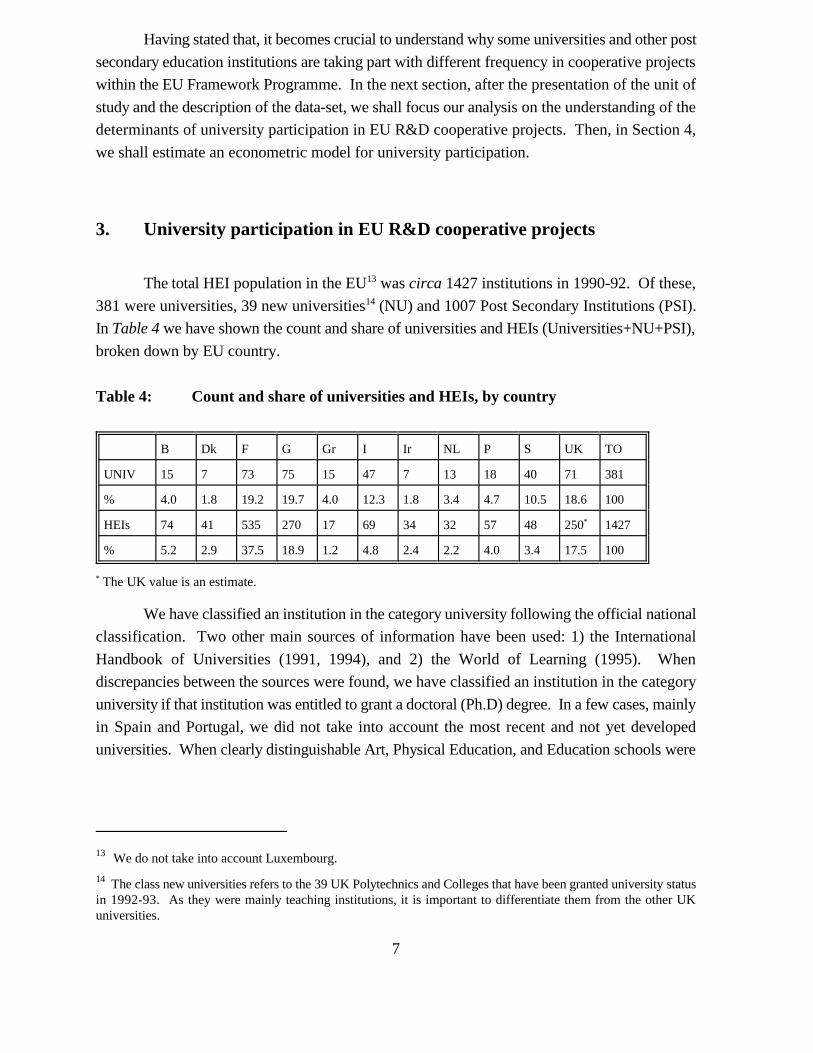
The total HEI population in the EU was circa 1427 institutions in 1990-92. Of these,13
381 were universities, 39 new universities (NU) and 1007 Post Secondary Institutions (PSI).14
In Table 4 we have shown the count and share of universities and HEIs (Universities+NU+PSI),
broken down by EU country.
Table 4: Count and share of universities and HEIs, by country
We have classified an institution in the category university following the official national
classification. Two other main sources of information have been used: 1) the International
Handbook of Universities (1991, 1994), and 2) the World of Learning (1995). When
discrepancies between the sources were found, we have classified an institution in the category
university if that institution was entitled to grant a doctoral (Ph.D) degree. In a few cases, mainly
in Spain and Portugal, we did not take into account the most recent and not yet developed
universities. When clearly distinguishable Art, Physical Education, and Education schools were
In most of the countries this schools are not included in the university category. In the few cases in which they15
have university status, we chose to exclude them.
8
excluded. The three institutions Universitair Centrum Antwerpen, Universitaire Faculteiten15
Sint-Ignatius te Antwerpen and Universitaire Instelling Antwerpen have been subsumed under
the hat of the University of Antwerp. Finally, to calculated the number of UK universities we
have made use of information of the Universities' Statistical Record. The resulted value of 73 is
due to fact that the University of Cambridge and the University of Oxford are considered as one
institution, the University of London is subdivided into 22 colleges, and the three institutions
Manchester Business School, Manchester University and UMIST have been subsumed in the
University of Manchester.
In Europe there is no standardization on the definition of PSI and University. In the
different countries these terms carry varying connotations. However, in all the EU countries, the
institutions that have been granted the university status went through a national selection process
that can be considered more stringent then the one for the granting the PSI status. Therefore, this
category can be considered more homogeneous. Moreover, large part of PSIs are mostly teaching
oriented institutions, then not involved in research. Those that are involved in research are
generally more oriented towards regional or national type of networking. Only when their
scientific research quality is extremely high they are trying to access the EU funding system.
Thus, in the following analysis we shall focus our attention only on universities.
The ideal unit of analysis to understand university participation in EU R&D project would
be the research group/research centre that applied for EU founds. This information is currently
not available at the cross country level. Although less informative, we have decided that was
worthwhile to analyse university participation in EU R&D cooperative projects at the aggregate
level of the university. Clearly, this unit of analysis has a dimensional bias. Large universities
tend to have more research groups and consequently tend to participate more in EU projects.
Nonetheless, we think that, given the dimension, other factors such as scientific research quality,
geographical localization, scientific orientation are useful to explain the participation in EU
projects. Moreover, the analysis at the institutional level has independent justifications. First,
although the literature on R&D cooperation emphasises the centrality of the research group, we
believe that, particularly in this special case of international cooperation, the identity of the
institution --i.e. Cambridge University versus De Montfort University-- plays an important role.
In particular, because the funding agency --i.e. the European Commission-- is not perfectly
informed, the institutional reputation or "the name" of the institution becomes a substitute for
missing information on specific researchers or research groups. Second, to develop an
international cooperation with a well known university means also to originate positive image
externalities for the institution involved. The literature recognizes in the augmented image and
See for example Malerba et al. (1991).16
9
prestige due to the link one of the main incentives for a cooperation. Then, again, the institution16
itself comes to the fore. Third, taking the university as unit of analysis enables us to have
information on the total population --i.e. both the universities that have joined EU R&D projects
an the ones that did not have taken part in them-- and consequently our analysis will not have any
selection bias. Forth, from a methodological point of view, the macro analysis at the institution
level enables us to draw the background picture of this particular area of R&D cooperation. In
future research, the micro analysis at the research group level will be carried out on the basis of
the results of the current work.
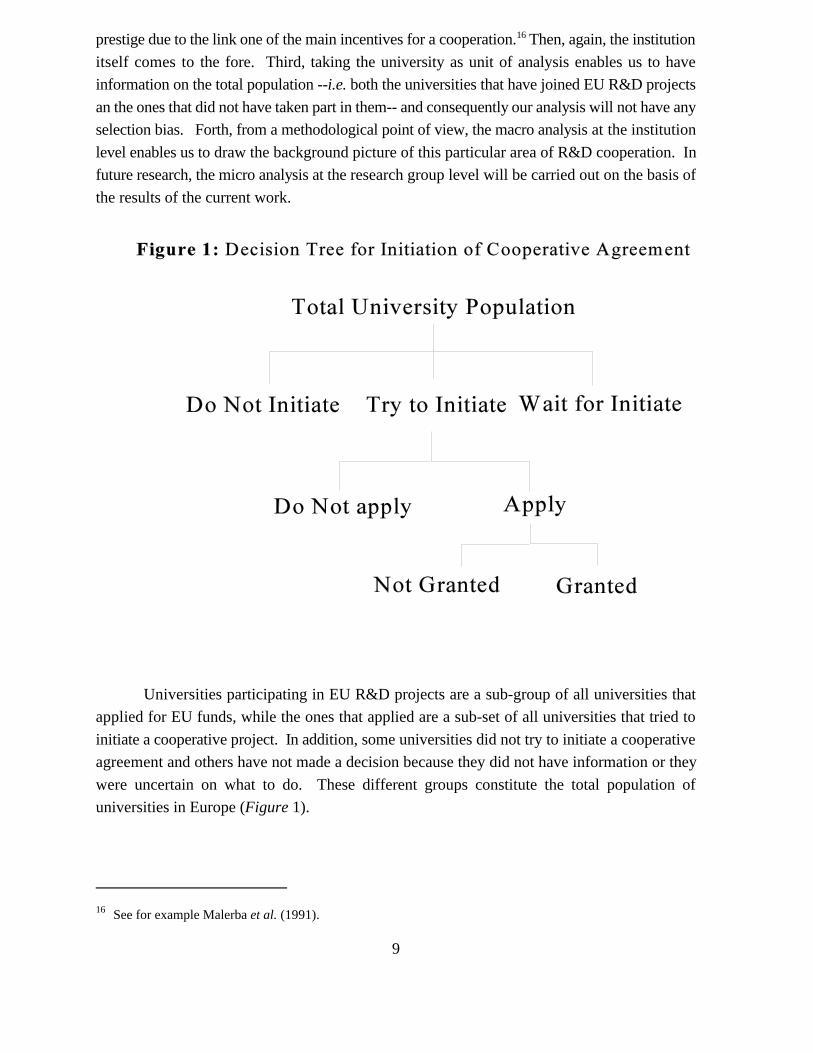
Universities participating in EU R&D projects are a sub-group of all universities that
applied for EU funds, while the ones that applied are a sub-set of all universities that tried to
initiate a cooperative project. In addition, some universities did not try to initiate a cooperative
agreement and others have not made a decision because they did not have information or they
were uncertain on what to do. These different groups constitute the total population of
universities in Europe (Figure 1).
In both the Second and the Third Framework the research concerned with information and communications17
technologies was under the supervision of DG XIII, therefore it is not included in the data set. Some other smallprogrammes directed by DG VI, DG XIII and DG XIV are not included too. Still, about 55% - 60% of the fundswere administered by DG XII therefore, even if biased, we have a quite relevant sample.
The number of researchers includes the totality of full-time academic staff plus, when present, 50% of part-time18
academic staff.
For the analysis of all the problems connected with the data collection see CEC (1994; pp.38-40). Special19
mention must be made of the peculiar role played by hospitals. Their weight in the presence count is not just over-estimated because of the effect of co-authorship, it is also often unclear whether they are linked to the university ornot. Then in some cases the publication is counted as university and other as hospital. This varies among theEuropean countries due to the widespread institutional variety.
10
At present, we have gathered the data concerning the universities that have been involved
in a R&D project (granted), and the total university population. The analysis of this information
will enable us to highlight some of the factors affecting university participation in cooperative
projects within the EU Framework Programme.
We obtained the original data from the DG XII - i.e. Directorate-General Science,
Research and Development-- of the European Commission. They refer only to shared-cost
actions funded by the DG XII under the First, Second and Third Framework Programmes.17
However, the data for the First Framework Programme are not complete because the database
of the DG XII has been created only after the end of the programme, then only a part of the data
concerning the First Framework Programme have been stored in it. Moreover, the information
for the Third Framework Programme is only up to 15/3/1994. For each university we were
provided with geographical information and with the Number of Contract Partner Links. The
latter represents the number of times a HEI has been involved in a R&D project. That is to say,
the number of participations for each institutions No time or programme information were
released to us. The database constructed in this way comprises 330 universities, they represent
86% of the total population of European universities.
For the total population of European universities, on the top of the geographical
information and of the number of times a university has been involved in a EU R&D project
(PART), we have gathered the following data:
NRES: The number of researchers in 1992. Used as a proxi for the dimension of the18
universty.
PUBS: The number of papers published by a scholar associated to a specific institution
in 1993. In the case of one author the count is one, while in the case of co-19
For humanities and social sciences there exists the specific Social Science SCI which, however, we have not20
utilized. Thus, these data are biased to the detriment of institutions with humanity or social science department.However, under the first three Framework Programmes only a minor part of the budget was indirectly committedto socio-economic studies, so that we do not consider this a serious weakness for purposes of the present analysis.
11
authorship the count is equal to the number of the authors. The data source is the
Science Citation Index, CD-ROM version 1993, ISI. 20
RATIO: The ratio between the number of publications and the number of researchers
(PUBS/NRES). Used as a proxi for the scientific research quality of the
university.
FIELDS: The scientific fields in which the institution grants a doctoral degree. These are
converted into a categorical variable to classify the institutions in relation to their
scientific field orientation.
NEWOLD: The institutions' founding year. This has been turned into a categorical variable
to classify the institutions in relation to their historical age.
Table 5: Descriptive statistics for the main variables (TP=Total Population;P=Participants; NP=Non-Participants).
Var Mean Std. dev Min Max
TP P NP TP P NP TP P NP TP P NP1 2 3 1 2 3 1 2 3 1 2 3
* Estimate value; 371 valid cases; 326 valid cases; 45 valid cases. Ten cases have been excluded due to missing 1 2 3
data.
In Table 5 we have shown the descriptive statistics for the four continuous variables. 326
universities (four cases have been excluded due to missing data) have participated from a
minimum of 1 time to a maximum of 420 times in a cooperative project. They have participated
on average in 56 projects. The high Kurtosis (5.536) and the positive Skewness (2.130), together
with the high standard deviations (66) and large difference between Min and Max, indicate
concentration in the values. Moreover, as the first three quartiles have respectively values 10,
32 and 78 we can describe the population of universities participating in EU R&D projects as
composed by a large number of institutions with few participations and a small group of
institutions involved in a large number of cooperative agreement. Similar observations can be
done when we look at the other three variables. Finally, when we compare the descriptive
statistics of the total population with the one of participants and non-participants, small positive
The two towns are only 120 kilometres one from the other. 21
12
differences are present in the participants' distribution, while important negative differences
characterize the non-participants' distribution.
To control for other effects than dimension, scientific research quality and country fixed
effects, we have gathered information on the scientific orientation of the university, and on the
age -- i.e. period of establishment-- of the universities.
The widespread institutional variety of the European university system has always
constrained the value of international comparisons. For example, the Rheinish-Westphalian
Technical University in Aachen, Germany has few things in common with the Eindhoven
Technical University in Eindhoven, The Netherlands. The former has faculties like philosophy21
and education, while the latter is a engineering school. The same kind of diversity can be found
between the Italian and the UK Polytechnics. Here we want to suggest a way to classify the
different type of European universities. Starting from the fact that the requirements for the
doctoral degree are approximately standardised among the EU countries, we have classified the
institutions according to the scientific fields in which they grant the Ph.D degree. In particular,
taking into account the OECD classification for scientific fields --i.e. Agriculture, Medicine,
Natural Sciences, Engineering, Social Sciences and Humanities-- we have created 28 categories.
Six for the universities Mono-discipline, which grant the doctoral degree in only one scientific
field. All the six classes are relvant. Fifteen for the universities Bi-discipline, which grant the
doctoral degree in two scientific fields. Only nine of them include some institutions. Seven for
the universities Multi-discipline. In this latter group are included all the institutions that award
doctoral degree in three or more scientific fields. To better classify these universities we have
controlled for the presence of Engineering, Medicine and Natural Sciences. We have then
subdivided the group in seven categories. All of them are relevant.
For each institution we have collected the founding year. Then, we have subdivided this
variable in four categories. First, New University (NU, 146 institutions), all the institutions
established after 1945. Second, Modern University (MU, 32 institutions), that includes the
institutions created between 1900 and 1945. Third, Nineteenth Century University (NCU, 77
institutions), as the name indicates, the ones founded between 1800 and 1900. Finally, Old
University (OU, 126 institutions) that includes all the universities that have been founded before
1800.
In the following Section, we shall develop an econometric model that tests the relevance
for university participation in EU R&D projects of: a) the characteristics and behaviour of the
universities, b) the behaviour of the funding agency, and c) the un-intended consequences of the
For the discussion of the creation of barrier to entry in the context of selection of publicly founded R&D project22
see Geuna (1995; pp.12-14) { ME LO LASCI METTERE O PENSI CHE SIA TROPPO !!!!} For evidences onthe phenomena in the UK context see Pike and Charles (1995; pp.20-21)
See Cragg (1971) for the original specification of the two equation model.23
13
selection mechanisms. In particular, we shall examine the importance of the following four
factors. First, as the large universities tend to have more research groups and, consequently, tend
to have more participations in EU R&D cooperative projects, the dimensional distribution of the
total population of European universities influences the skewness of the participations'
distribution. Second, the existence of important differences in scientific research quality and the
presence of cumulative and self-reinforcement mechanisms can explain why only a small number
of universities have a large number of participations. Third, the priorities of the EU research and
development policy, especially for what it concerns cohesion policy and technology orientation,
determine in a crucial way the frequency of the participations' distribution. Fourth, the diffusion
of information about how, were and when to apply for EU funds has taken a relatively long
period of time. For some institutions there has been a localization and information advantage,
that translated into a "first entry advantage" has enabled the creation of barrier to entry. Thus,22
early entrants in the system tend to have a larger number of participations.
4. An econometric test of the determinants of university participation
The aim of the regression analysis developed in the following is to test the relevance of
dimension, scientific research quality, and other fixed factors on university participation in EU
R&D projects. In particular, the analysis of the estimates shall enable to infer the impact on the
selection process of the behaviour and characteristics of the universities, the behaviour of the
European Commission and the presence of un-intended effect of the selection criteria.
As the number of participations (PART) takes values between 0 and 420, the OLS
regression is not a suitable estimation procedure. Two different approaches can be can be used.
One is a Tobit model with number of participations as censored dependent variable. The other
is two equation model, where the first specification is a Probit model with a binary dependent
variable which takes the value 1 when the university has a participation, and 0 when it does not,
and the second equation is a Truncated regression model for the non-limit observations --i.e. for
the number of participations greater than zero. The advantage of the two equations model is that
enables to separate the analysis of the participation or not in a project from the analysis of the
multi-participation. The two alternative approaches can be tested against each other. The23
double specification can be tested as the unrestricted model against the restricted Tobit model.
The 8 dummies for scientific fields orientation are the result of a re-categorization of the original classification24
in 22 classes given by the variable FIELDS.
The dummy variables for The Netherlands, Denmark and Natural&Medicine universities are not included in Eq.25
2 because the related universities have always probability 1.
14
In the Tobit model (Eq. 1) we regress the dependent variable number of participations
(PART) on the independent variables number of researchers (NRES), and ratio between number
of publications and number of researchers (RATIO). The first independent variable measures
the dimension of the university, while the second is used as a proxy for the scientific research
quality of the institution We assume a loglinear relation. Dummy variables (DCOUNTRY) for
national fixed effects and control dummy variables (DSCIFIELD) for scientific fields are24
included. In the Probit model (Eq. 2) the dependent variable Y is the probability of being
involved in a project, which takes the value 1 when the university has a participation, and 0 when
it does not. The same set of independent variables are used. In the Truncated regression model25
(Eq. 3) only the universities that have participated in at least one EU R&D project are considered.
The dependent variable P is the number of participations and is recorded only when it is greater
than zero. The independent variables are the ones used in the previous two equations. As in the
Tobit model we assume a loglinear relation. The equation (1), (2) and (3) are then formulated
as:
(1) ln (1-PART) = " + $ ln NRES + $ ln RATIO + 3 $ DCOUNTRY + 1 2 i=1..n i i
+ 3 $ DSCIFIELD + 0 j=1..m j j 1
where n = number of countries = 10 and m = scientific fields categories = 8.
(2) Y = * + ( ln NRES + ( ln RATIO + 3 ( DCOUNTRY +1 2 i=1..n i i
+ 3 ( DSCIFIELD + 0j=1..m j j 2
where Y = 1 if PART > 0 and Y = 0 if PART = 0; n = number of countries = 9 and
m = scientific fields categories = 7.
(3) ln (1-P) = . + µ ln NRES + µ ln RATIO + 3 µ DCOUNTRY + 1 2 i=1..n i i
+ 3 µ DSCIFIELD + 0j=1..m j j 3
15
where P is observed only when PART > 0; n = number of countries = 10 and
m = scientific fields categories 8.
Taking equation (1) as the restricted model, and equations (2) and (3) together as the
unrestricted model we have used a likelihood ratio test (LLR) to decide which specification we
should use. As LLR is equal to 136.66, using a Chi-squared test with 21 degrees of freedom, the
Tobit model was rejected at 99% probability.
16
Table 7: Estimation results.
VAR Tobit Restricted Probit Restricted TruncatedProbit Truncated
Non linear Probit. Dependent variable: Binary. Number Obs. 371.
Non linear Truncated regression. Dependent variable: Positive number of participations. Number Obs. 326.
Coefficient significance between brackets. Marginal effects have the same significance of coefficients.
The Probit model correctly predicts 90% of the outcomes.26
See for example Commission of the European Communities (1992; p.10).27
The reference country is United Kingdom 28
17
The results of our estimation are shown in Table 7. In the Probit equation the scientific26
research quality of the institution has a positive and significant effect on the probability of taking
part in a EU R&D cooperative project. While, the dimension of the university is not significant.
None of the dummy variables for country fixed effect have a significant value. Finally, only the
dummy that refers to mono-discipline and bi-discipline institutions focused on Social Sciences
and Humanities has a negative and significant value. These results highlight that the probability
of taking part in a cooperative project financed by the European Commission depends primarily
on the scientific research quality of the university. This is consistent with the results of Arora,
David and Gambardella (1995), which showed that, in the case of publically-funded R&D
projects, the scientific reputation of the research group, and in particular its weighted number of
past publications, is the main factor influencing the probability of being selected. Moreover,
these results confirm that the European Commission acted consistently with its stated policy
objectives of awarding research founds on grounds of quality. 27
When we analyse the estimation for the Truncated regression model, important
differences in the influence and significance of the explanatory variables are present. Both
dimension and scientific research quality have positive and significant coefficients. Consistent
with our expectations, the size effect --i.e large universities tend to have more research groups
and consequently tend to participate more in EU R&D projects-- has an important positive
impact on the number of participation. Nonetheless, given the dimension, institutions with
higher scientific research quality are involved in more projects. Thus, while the probability of
being granted depends primarily on the scientific research quality of the university, the
participation in R&D projects is effected by the dimension of the institution, and, given its
dimension, by its scientific research quality.
Major country fixed effect are present in the Truncated regression model. They can be28
subdivided in three sub-groups. First, the dummy variables for France, Germany, Italy and Spain
have negative significant values. Given "size" and "quality", the universities of these countries
had a lower number of participations. This can be explained looking at the administrative and
bureaucratic structure of their national university system. In predominantly public financed
systems the novelty of a competitive financing process has constrained the propensity to
participate in EU R&D projects. Although their university systems have a high quality, they are
extremely bureaucratic and they are not used to external cooperation and competitive fund
raising. Moreover, in particular in the case of France and Italy, a large portion of research is
In the last Council Regulation 93/2081/EEC Greece, Ireland and Portugal are still included as entire country in29
the less-favoured regions.
We have estimated also other more detailed specifications. The coefficients of the institutions focused on30
medicine was sometimes significant and negative, indicating the presence of a over-estimation of the scientificresearch quality of these institutions (see note 19 for the discussion of the reasons). Also due to the small numberof institutions with this characteristics, the test for the restricted against unrestricted specification did not allow toreject the null hypothesis. Thus, we chose the 8 dummy specification.
18
realized in public research organizations --e.g. the CNRS (F), the CNR (I) and other public
research centres-- thus the research intensity of the university system tends to be lower than in
other countries. Second, the dummy variable for Ireland has positive and significant values.
Other factors being equal, this indicates that Irish universities had an advantage in the
participation. This advantage is the result of the policy objectives of the European Commission.
As we highlighted in Section 2, since the First Framework Programme, technological and
economical convergence among the member states of the EU is a major policy aim. Especially
from the Third Framework Programme a clear technological cohesion policy has been developed.
Projects involving partners from less-favoured regions tend to be preferred to projects of the29
same quality but without member from less-developed regions. Some results show that probably
the cohesion policy has also a positive influence on the participation of Greek universities, while
the statistical evidence does not support the same conclusion for Portuguese universities. Third,
the dummy variable for Belgium has a positive and significant value. This indicates that, given
dimension and scientific research quality, Belgian institutions succeeded in having a larger
number of participations. A possible explanation is connected with the fact that the diffusion of
information about how, were and when to apply for EU funds has taken a relatively long period
of time. Thus, Belgian university, exploiting the localization and information advantage, entered
early in the system and, consequently, they developed a "first entry advantage" that has enabled
the creation of "barrier to entry" to the disadvantage of later comers.
We have used the dummy variable for scientific field to control for the bias inherent in
the way we collected the number of publications and to control for the different propensity in
publishing. In the chosen specification, the technology oriented institutions have positive and
significant values. The high value of their coefficients, on the top of the control meaning, may30
also indicate the existence of an advantage for technology oriented universities. However, with
the available date, no conclusive observations can be made.
We also tested a set of specification to account for fixed effect from the founding period
of the university. We used four dummies for the founding year as proxies for the reputation
effect --i.e. the older the university, the higher the reputation. Even if some evidences of a
positive coefficient for the modern universities were found, the test for the restricted against the
unrestricted specification rejected the latter.
19
The results of the estimations of the two equation model presented above point to the
existence of important difference in the significance of the factors when they are used to explain
the probability of joining a EU R&D project or when they are used to explain the actual number
of participations. The quality of the university, and not other factors, influences the probability
of participation. The different frequency in participation is, instead, effected by: a) the
characteristics and behaviour of the university --e.g. dimension and scientific research quality,
bureaucratization and propensity towards competitive fund raising, b) the behaviour of the
European Commission --e.g. cohesion policy, and c) the un-intended consequences of the
selection mechanisms --e.g. the creation of barriers to entry by early entrants.
5. Conclusions
A growing share of the income of European universities is generated through research
grants and contracts from both national agencies and the EU. In a context of increasing
internationalization of the research process and of rising importance of the research network, the
participation in EU R&D cooperative projects becomes an issue of crucial importance.
This paper is a first attempt to examine in a systematic way the determinants of university
participations in EU R&D projects. In doing this, we studied a original data-set describing the
totality of European universities in terms of institutional characteristics and number of
participations in projects of the three Framework Programmes of the European Commission. An
econometric model was developed to test for the relevance of different factors on both the
probability of joining a EU R&D cooperative project and the actual number of participations in
projects.
Some evidence has been found to support the idea that scientific research quality
influences both the probability of joining a EU R&D project and the number of times an
institution has participated in projects, while the research dimension has a positive influence only
on the latter. Given dimension and scientific research quality of the university, other factors are
important to explain the different frequency in participation. First, the bureaucratization and the
lack of practice in competitive found raising of the university system may have a negative
influence on the propensity to take part in EU R&D cooperative projects. Second, the existence
of techno-economic convergence aims for the Framework Programmes tends to advantage the
participation of institutions localized in less-favoured regions. Third, due to the un-intended
consequences of the selection mechanisms the early entrance in the system tend to have
advantages in the repeated participations.
For the discussion of scientific paradigms and research programs see respectively Kuhn (1970) and Lakatos31
(1970).
20
Similarly to the results of Gambardella and Garcia-Fontes (1996), our estimations point
to the existence of a trade-off in the allocation of research founds. On the one hand, the
importance given to the scientific research quality originates, through the effect of cumulative
and self-reinforcement mechanisms, a repeated selection of a minority of high research quality
institutions. This tends to maximise short-term research outcomes. On the other hand, longer
term goals are perused when, following the guidelines of cohesion policy, universities in less-
favoured regions have a priority advantage in the participation. In this way, especially in the case
of university research, positive knowledge spillovers may increase the research capabilities of
those regions.
Finally, if the consequences of a selection based on the "quality principle" are reinforced
by what we called the first entry advantage, a second important trade-off should be consider.
On the one hand, the characteristic of repeated selection may tend to reinforce the dominant
research strategies (scientific paradigms and research programs), limiting research variety, and
consequently decreasing the probability of scientific innovation. On the other hand, the31
standardization of scientific knowledge enables an increase communication, and consequently
a rise in the value of current science.
In the context of a policy perspective, a better understanding of the two trade-off and of
the interactions between them is needed. When more detailed information on the participations
is made available by the Commission, a systematic empirical analysis, on the model of the one
developed in this paper, will enable to highlight what might be the policy implications of the
resource allocation criteria.
References
Arora, A., David, P.A. and Gambardella, A., 1995, Reputation and Competence in Publically-
Funded Science: Estimating the Effects of Accumulating Knowledge on Research Group
Productivity, presented to NBER Summer Workshop on Industrial Organization, Cambridge MA,
July.
AXION, 1995, The Impact of EC R&D Policy on the European Science and Technology
Community 1987-1991 2 Framework Programme. National Impact Studies Synthesis, Studynd
conducted on behalf of the European Commission, forthcoming.
21
Commission of the European Community, 1994, The European Report on Science and
Technology Indicators 1994, Report EUR 15897 EN.
Commission of the European Community, 1992, EC Research Funding. A guide for Applicants.
Cragg, J., 1971, Some Statistical models for Limited Dependent Variables with Application to
the Demand for Durable Goods, Econometrica, 39:829-844.
Dasgupta, P. and P.A. David, 1994, Toward a New Economics of Science, Research Policy
23:487-521.
David, P.A., 1994, Positive Feedbacks and Research Productivity in Science: Reopening Another
Black Box, in Economics and Technology, O. Granstraad, ed., Amsterdam: Elsevier Science
Publishers.
David, P.A., Geuna, A. and W.E. Steinmueller, 1995, Additionality as a Principle of European
R&D Funding, A Study carried out for the STOA Programme of the European Parliament,
MERIT's Research Memoranda 2/95-012.
Geuna, A., 1995, University Participation in Community Programmes: How Does the Selection
Process Work?, MERIT’s Research Memoranda 2/95-002.
International Association of Universities, 1991, 1994, International Handbook of Universities,
Stockton Press.
Kuhn, T.S., 1970, The structure of Scientific Revolutions, 2nd ed., University of Chicago Press,
Chicago.
Lakatos, I., Falsification and the Methodology of Scientific Research Programmes, in Criticism
and the Growth of Knowledge, I. Lakatos and A. Musgrave, eds., Cambridge University Press,
Cambridge.
Luukkonen, T., O. Persson and G. Sivertsen, 1992, Understanding Patterns of International