Page 1
Determinants that Influence Citizen's Usage of Different E-Government Services: A Malaysian Case Study
MUSLIMIN WALLANG Bachelor of Public Management (Hons), MSc.
A thesis submitted for the degree of Doctor of Philosophy at
The University of Queensland in 2018
School of Social Science
Page 2
ii
Abstract
For the past two decades, e-government has become a part of government’s development
programmes throughout the world. With the availability of e-government, public services can
be accessed 24 hours a day, 7 days a week. Governments have put a lot of resources into
implementing e-government platforms. Technology adoption scholars have paid serious
attention towards understanding the factors that influence citizens’ usage of online services.
However, despite the enormous research efforts that have been put forth and the use of e-
government services that has been examined widely, e-government services offered by the
government agencies often remain underutilised. Malaysia has successful cases of
implementing e-government services. However, a recent study about e-government adoption
in Malaysia indicated that it was growing slowly with a low rate of adoption. Moreover, several
studies also found that citizens were more likely to use e-information services than e-payment
services, even with both services were offered online in the same webpage. As such, it is
reasonable for this study to understand the reasons e-information usage was higher compared
to e-payment services in e-government services.
Evidence demonstrates that the Unified Theory of Acceptance and Use of Technology
(UTAUT) conceptual model has been successfully employed to explain technology adoption
by citizens. Furthermore, the predictors in these models have been validated by prior studies in
various settings. By considering a variety of types and levels of e-government services, the
present study is significant in that it examines the citizens’ attitudes towards different e-
government system use. Thus, this study was conducted with the aim to identify the predictor
factors in the usage of different e-government services and functions by: i) examining the main
factors that influence usage of different e-government services (i.e., income tax, property tax,
and traffic fines); and ii) identifying the factors leading to the usage between e-informational
and e-payment services.
This study involved two stages. First, interviews with participants that had used government
online services were undertaken as a scoping study to get opinion about citizens’ attitudes about
using e-government services. After using a template analysis, five factors were identified to be
relevant in the Malaysian context: Relative Advantage; Effort Expectancy; Social Influence;
Perceived Trust; and Perceived Risk. Following from the scoping study, the UTAUT model
was modified for this study.
Page 3
iii
The second stage involved a web-based survey to collect data from 294 Malaysian citizens in
Selangor who had used at least one e-government service in the past two years. As the main
objective of this study was to identify the factors associated with technology use, multiple
linear regressions were utilised. Statistical software package STATA version 14 was used to
analyse the relationship between the predictors and the outcome variables. As the main
objective of this study was to identify the drivers of technology adoption, regression analyses
were utilised. As the study involved six different e-government services, the research findings
provided varied results according to the type of services.
This study confirmed that Effort Expectancy was found to be the most common factor
associated with e-government usage for all services under study. This implied that the ease of
use and easy to learn of e-services was found to be relevant reasons for citizens to use the
service. The findings also show that Perceived Risk was consistently associated with e-services
usage, and indicating that this factor was also common in explaining the citizens’ usage on e-
government services. Finally, as the newest service, the traffic fines system use was associated
with Social Influence and Relative Advantage factors, indicating that peers’ opinions and
citizens perceived on the benefits of the online service are important to attract citizens to use
the online service.
In addition, research findings identified differences in drivers between e-information and e-
payment services. For e-information, Effort Expectancy and Perceived Risk were identified as
dominant factors associated with the citizen’s usage for both type of e-services. While, Relative
Advantage and Social Influence were also identified to be associated with traffic fines services.
For e-payment services, interestingly, the effect of the factors that influenced the citizens’
usage of e-government services were slightly different with e-information service. Besides the
Effort Expectancy and Social Influence factors, Relative Advantage also was found to be
associated but in selected e-services.
The current study has significant empirical and practical contributions. Empirically, it
contributes to the body of knowledge as this study provides a model that explains the different
determinants of different e-services usage by citizens. Further, by integrating the UTAUT
model with new constructs retrieved from a scoping study, a variation of citizens’ usage in
different settings of systems were identified. As practical implications, the research identified
the main determinants leading to users to adopt e-government services. Furthermore, due to
Page 4
iv
limited resources, it is crucial for governments in developing countries to understand the
important determinants that lead to the usage of e-government services.
Page 5
v
Declaration by author
This thesis is composed of my original work, and contains no material previously published or
written by another person except where due reference has been made in the text. I have clearly
stated the contribution by others to jointly-authored works that I have included in my thesis.
I have clearly stated the contribution of others to my thesis as a whole, including statistical
assistance, survey design, data analysis, significant technical procedures, professional editorial
advice, and any other original research work used or reported in my thesis. The content of my
thesis is the result of work I have carried out since the commencement of my research higher
degree candidature and does not include a substantial part of work that has been submitted to
qualify for the award of any other degree or diploma in any university or other tertiary
institution. I have clearly stated which parts of my thesis, if any, have been submitted to qualify
for another award.
I acknowledge that an electronic copy of my thesis must be lodged with the University Library
and, subject to the policy and procedures of The University of Queensland, the thesis be made
available for research and study in accordance with the Copyright Act 1968 unless a period of
embargo has been approved by the Dean of the Graduate School.
I acknowledge that copyright of all material contained in my thesis resides with the copyright
holder(s) of that material. Where appropriate I have obtained copyright permission from the
copyright holder to reproduce material in this thesis.
Page 6
vi
Publications during candidature
Wallang, M., Henman, P., & Gillingham, P. (2015). Different patterns of usage of e-
government services: A preliminary study. In C. Adams (Ed.), 15th European Conference on
eGovernment, ECEG (pp. 436–442). University of Portsmouth, Portsmouth, United Kingdom.
Publications included in this thesis
Wallang, M., Henman, P., & Gillingham, P. (2015). Different patterns of usage of e-
government services: A preliminary study. In C. Adams (Ed.), 15th European Conference on
eGovernment, ECEG (pp. 436–442). University of Portsmouth, Portsmouth, United Kingdom.
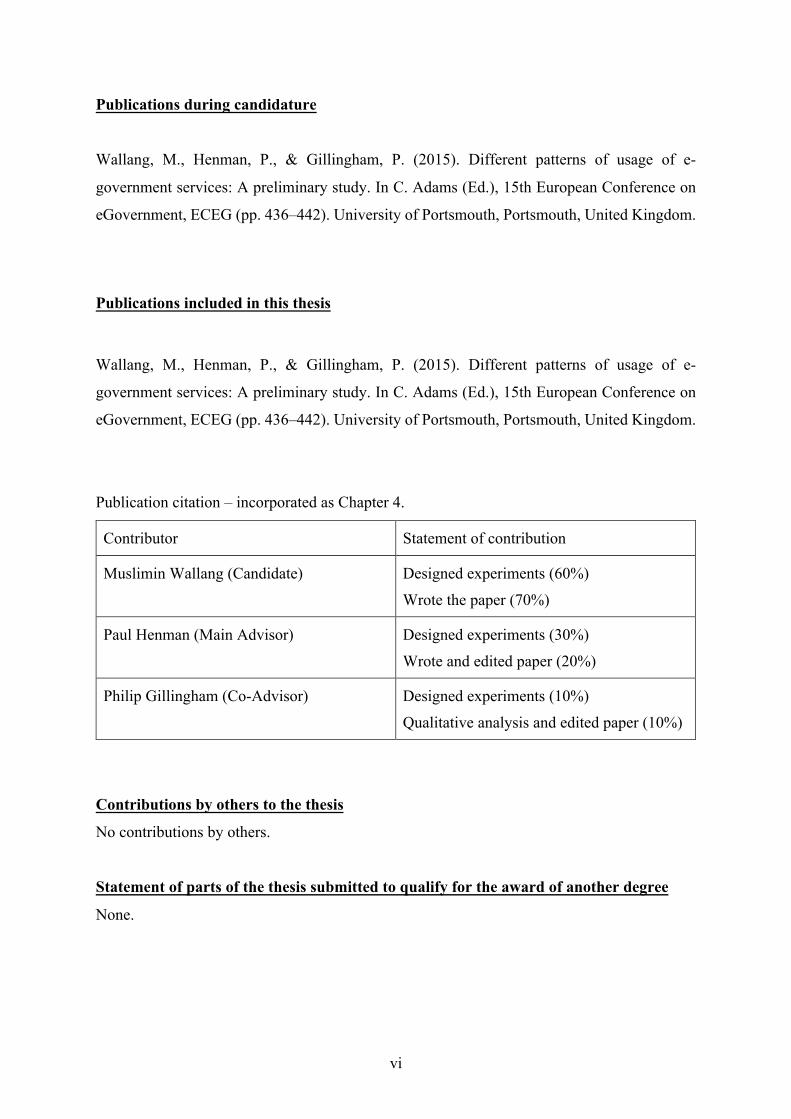
Publication citation – incorporated as Chapter 4.
Contributor Statement of contribution
Muslimin Wallang (Candidate) Designed experiments (60%)
Wrote the paper (70%)
Paul Henman (Main Advisor) Designed experiments (30%)
Wrote and edited paper (20%)
Philip Gillingham (Co-Advisor) Designed experiments (10%)
Qualitative analysis and edited paper (10%)
Contributions by others to the thesis
No contributions by others.
Statement of parts of the thesis submitted to qualify for the award of another degree
None.
Page 7
vii
Acknowledgements
Allhamdulillah, I am thankful to Allah Almighty, for the blessing, health, wisdom and strength
that He gave to me during my PhD journey. First and foremost, I would like to extend the
highest gratitude to my advisory teams, where I believed without their support, patient and
continuously encouraging me to working hard, I may not have reached this point. From the
bottom of my heart, I would like to express my highest appreciation to my principal supervisor,
Associate Professor Paul Henman, for his insights, unwavering commitment, guidance, advise,
the believe he always with me, was very patient, understanding and supportive during my
difficult moments, and always said, your dream will come true. Appreciation also goes to my
second supervisor Dr. Philip Gillingham, for the constructive research input particularly on the
qualitative part, as well as for advice on the final draft. My deepest appreciation also goes to
my third advisor, Dr. Walter Forrest, for his generous and patient to review and comment on
the quantitative analysis, as well as suggesting solutions to the research related problems. I will
always remember, been given to met and worked with these intellectual persons as a precious
moment into my entire life.
I would like to dedicate this thesis to my late father, Wallang Aming and mother - Haliza Tanca
for their endless supports, prayers and patient. Highest gratitude is also extended to my beloved
brothers and sister – Halinda, Jasmin and Zaenal – I owe you as you have sacrificed everything
to take care of our parents during my study.
I take the opportunity to express gratitude and appreciation to the Malaysia Ministry of Higher
Education and University Utara Malaysia, for providing me scholarship and non-financial
support. I would like to acknowledge the postgraduate team in School of Social Science, UQ
for their assistance and support during my study. Special thanks to my fellow at the School of
Social Sciences, UQ – Tim Graham, Rino Nugroho, and Aneqa Farwa– who have always
provided support, interest and advice to my thesis.
I would like to acknowledge my fellow UUM Colleagues – Deputy Vice Chancellor, College
of Law Government & International Studies (COLGIS), Dean School of Government, Head of
Department, Prof. Dr. Che Sobry Abdullah, Dr. Mohd Dino Khairri Shariffuddin, Assoc. Prof.
Dr. Azman Yasin, Assoc. Prof. Dr. Zaheruddin Ghazali, Assoc. Prof. Dr. Ahmad Martadha
Mohamed, Dr. Shamsuritawati Sharif, Zamalik Hasan and all colleagues in the School of
Government – for your encouragement, prayer and support.
Page 8
viii
I also indebted to all my participants for their support and willingness to spend their time to
take part in this study. My sincere gratitude also goes to the Inland Revenue Board of Malaysia
(IRBM) especially to Mr. Azizul for providing me the valuable data to support this study.
Special thanks to my fellow friends in Malaysia – SJB group members – Azam, Hairul, Halimi,
Umai, Amir, Tuyie, Khairulzubairi – Thank you for the supports, helps, joy and laughter we
shared through these years.
Saving the best word for the last, to my dearest wife – Erny Erawaty Amran; “your love, your
prayers and your supports help me to overcome all the challenges and hard times”. Your smiles
and laughter made me forgot how pain I am when I am down. Again, I still remember, you are
the most happiness person when I got an offer letter from UQ and from deep of my heart, thank
you very much for your patient and willingness to join me on this challenging journey. Dear
beloved wife, I was touched, that you’ve sacrificed your personal and your career development
for the sake of your husband. Thank you dear and will love you always.
To all my beloved sweethearts – Muhammad Fareez Hakim, Ammar Hakim, Hadiff Hakim,
Zariff Hakim and Afrina Safiyyah - I admitted, back from the school, I am tired, exhausted and
stressful. I am thankful to have all of you. Because of your smiles, I am strong and become
fearless. Your happiness gives me strength to strive to complete this study.
I dedicated this thesis to my family!
Page 9
ix
Keywords
E-government, determinants, information, technology, adoption, usage, behavioural, UTAUT,
citizens, Malaysia
Australian and New Zealand Standard Research Classifications (ANZSRC)
ANZSRC code: 160509, Public Administration, 50%
ANZSRC code: 080609, Information System Management, 30%
ANZSRC code: 160808, Sociology and Social Studies of Science and Technology 20%
Fields of Research (FoR) Classification
FoR code: 1605, Policy and Administration, 50%
FoR code: 0806, Information Systems, 30%
FoR code: 1608, Sociology, 20%
Page 10
x
Table of Contents
Abstract ...................................................................................................................................... ii
Acknowledgements .................................................................................................................. vii
Table of Contents ....................................................................................................................... x
List of Figures ......................................................................................................................... xiv
List of Tables ........................................................................................................................... xv
List of Abbreviations used in the Thesis ................................................................................ xvii
Chapter 1 : Introduction ............................................................................................................. 1
1.1 Background of Study ....................................................................................................... 1
1.2 Problem Statement ........................................................................................................... 2
1.3 Scope of the Study ........................................................................................................... 4
1.4 Research Objectives ......................................................................................................... 6
1.5 Contribution of the Study................................................................................................. 6
1.6 An Overview of E-government in Malaysia .................................................................... 7
1.7 Thesis Outline ................................................................................................................ 10
1.8 Chapter Summary .......................................................................................................... 11
Chapter 2 : Literature Review .................................................................................................. 12
2.1 Introduction .................................................................................................................... 12
2.2 Definition of E-government ........................................................................................... 12
2.3 Types of E-government .................................................................................................. 13
2.4 E-Government Maturity Models .................................................................................... 15
2.5 Conceptual Models of Technology Adoption ................................................................ 19
2.5.1 Theory of Reasoned Action (TRA) ......................................................................... 19
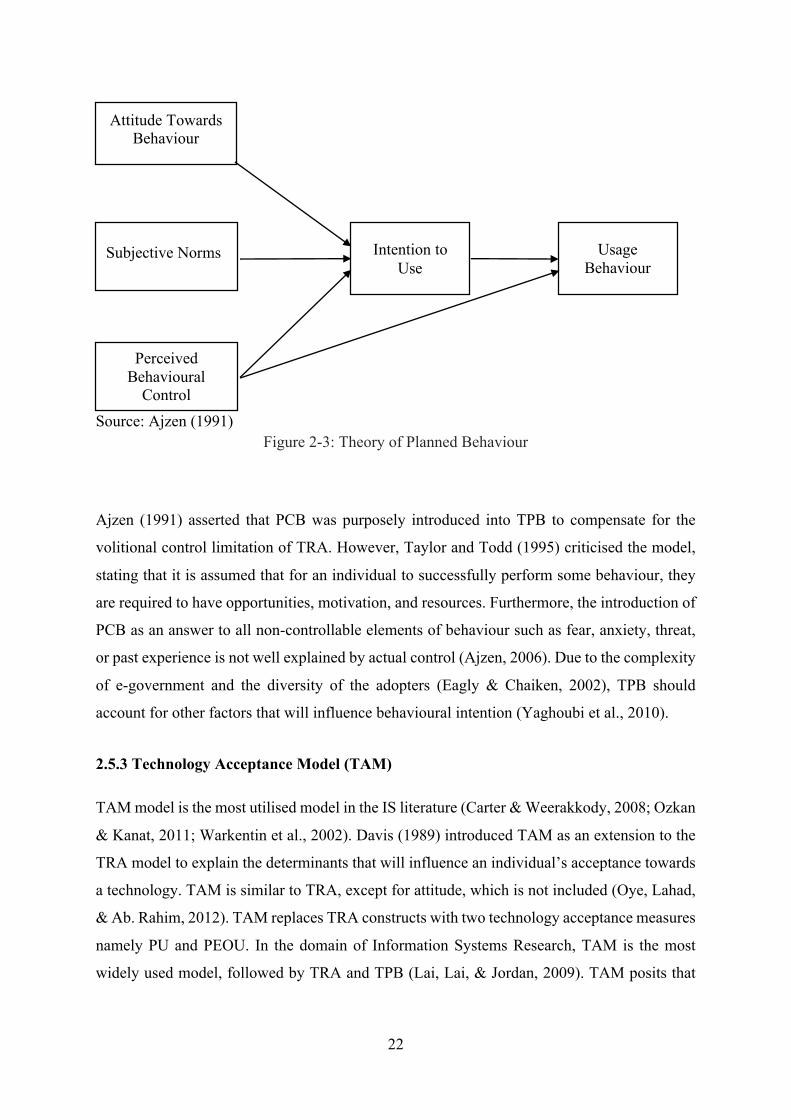
2.5.2 Theory of Planned Behaviour (TPB) ...................................................................... 21
2.5.3 Technology Acceptance Model (TAM) .................................................................. 22
2.5.4 Diffusion of Innovations (DOI) .............................................................................. 24
2.5.5 Unified Theory of Acceptance and Use of Technology (UTAUT) ........................ 25
2.6 Variables in Models of Use ............................................................................................ 31
2.7 E-government Research Applying the UTAUT Model ................................................. 32
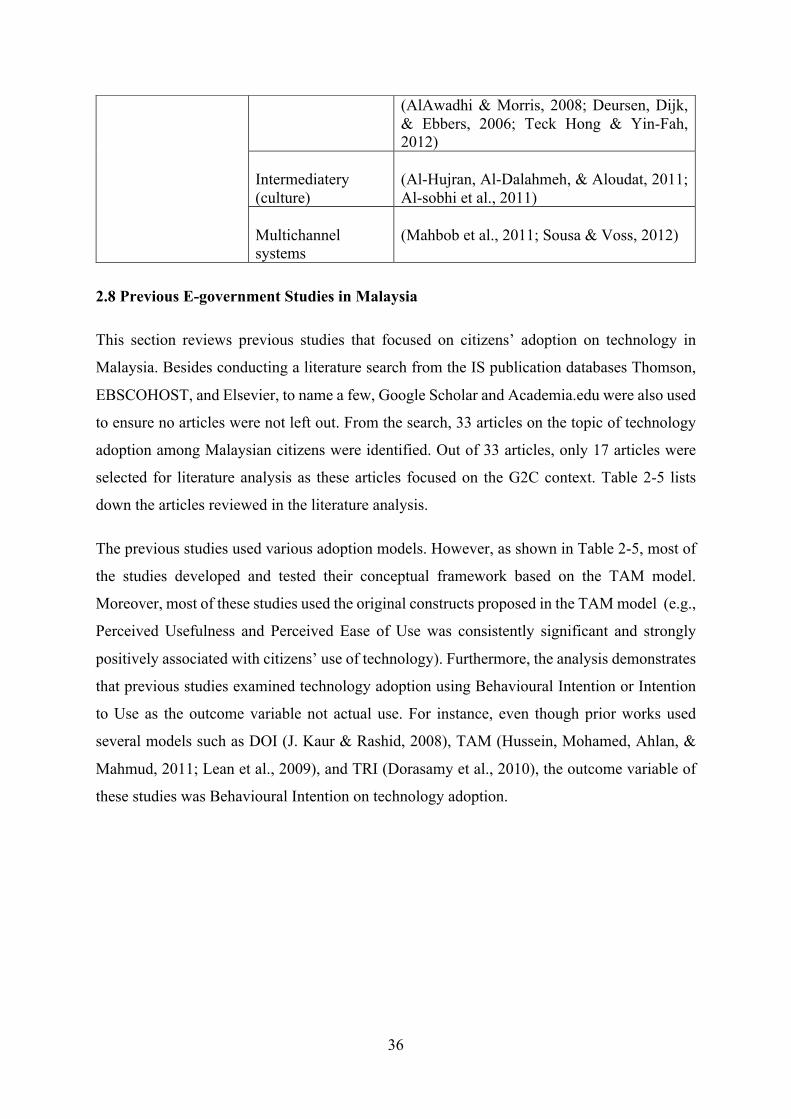
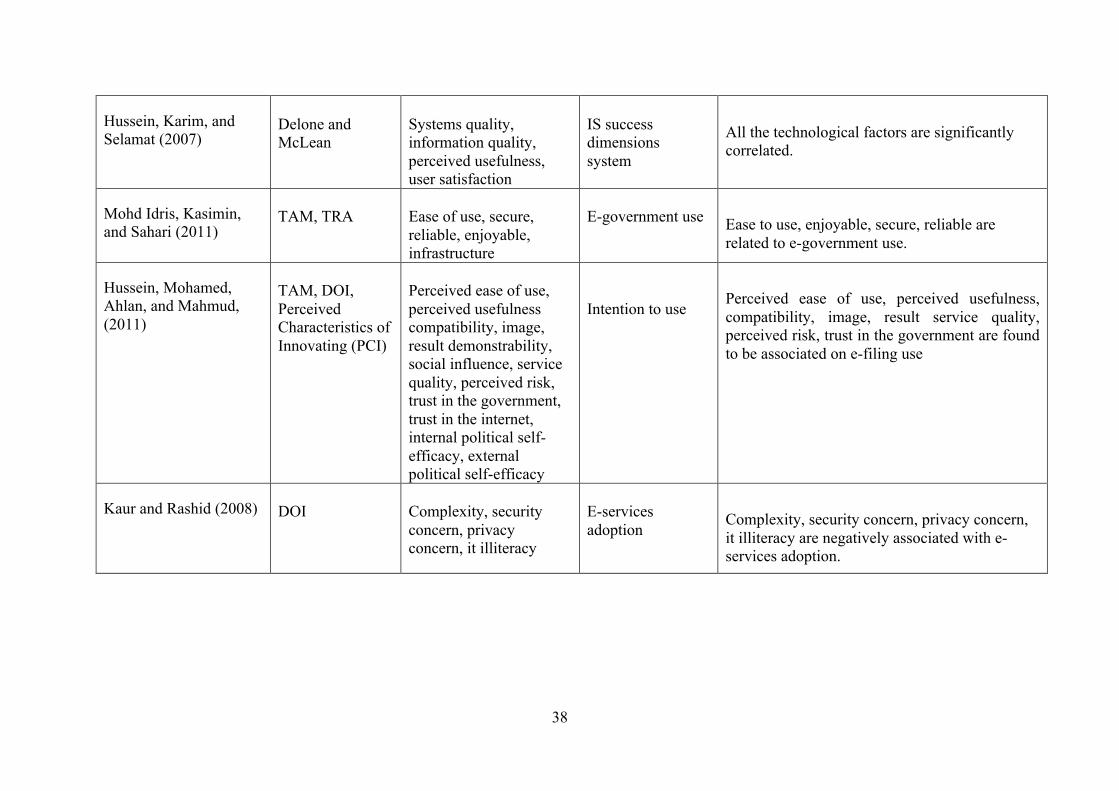
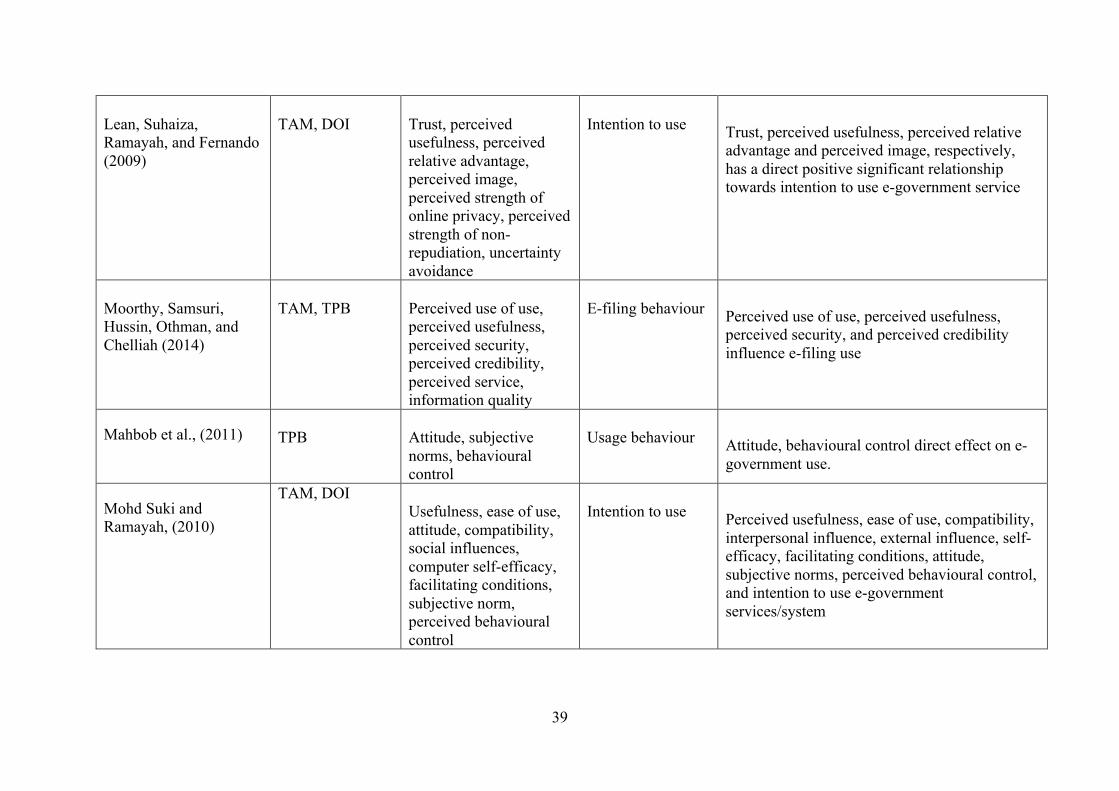
2.8 Previous E-government Studies in Malaysia ................................................................. 36
2.9 Limitations in Previous Studies ..................................................................................... 41
Page 11
xi
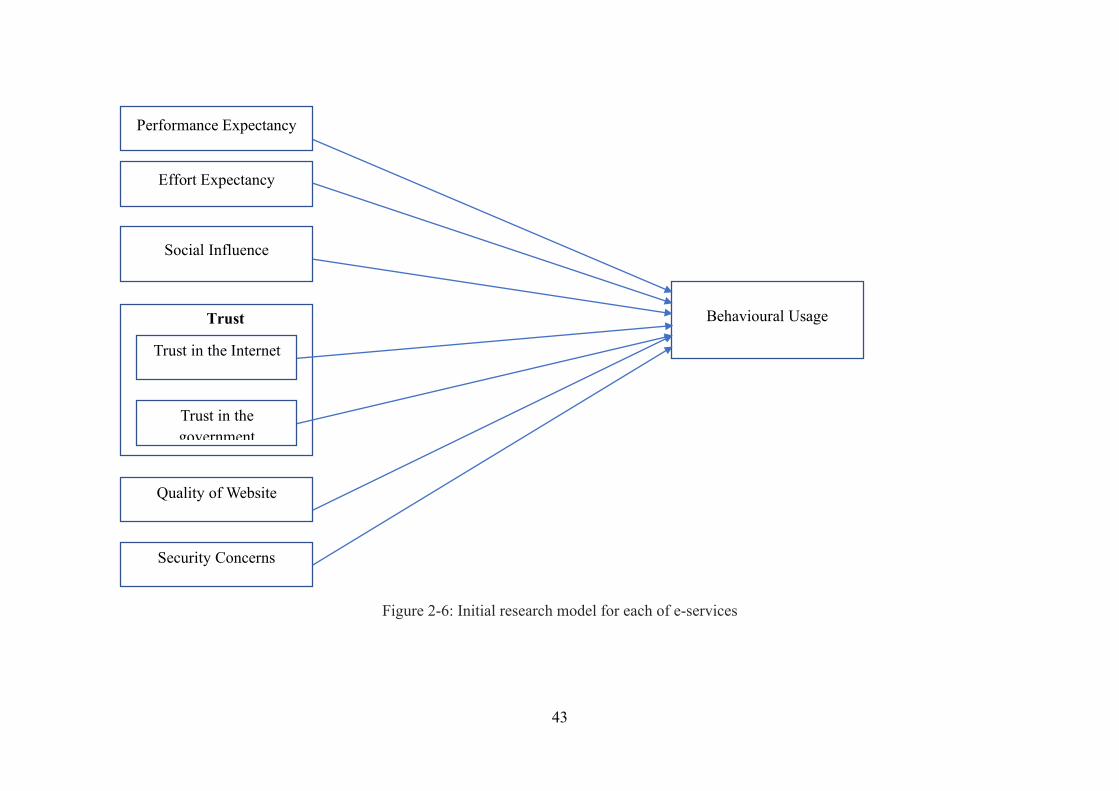
2.10 Conceptual Framework ................................................................................................ 41
2.11 Chapter Summary ........................................................................................................ 44
Chapter 3 : Methodology ......................................................................................................... 45
3.1 Introduction .................................................................................................................... 45
3.2 Research Site .................................................................................................................. 45
3.2.1 Local Authority’s Property Tax E-assessment System ........................................... 45
3.2.2 Federal Government’s Traffic Fine E-payment System ......................................... 47
3.2.3 Federal Government’s Income Taxation E-filing System ...................................... 47
3.3 Research Process ............................................................................................................ 48
3.4 Selection and Justification of Research Methodology ................................................... 49
3.4.1 Stage One: A Scoping Study ....................................................................................... 50
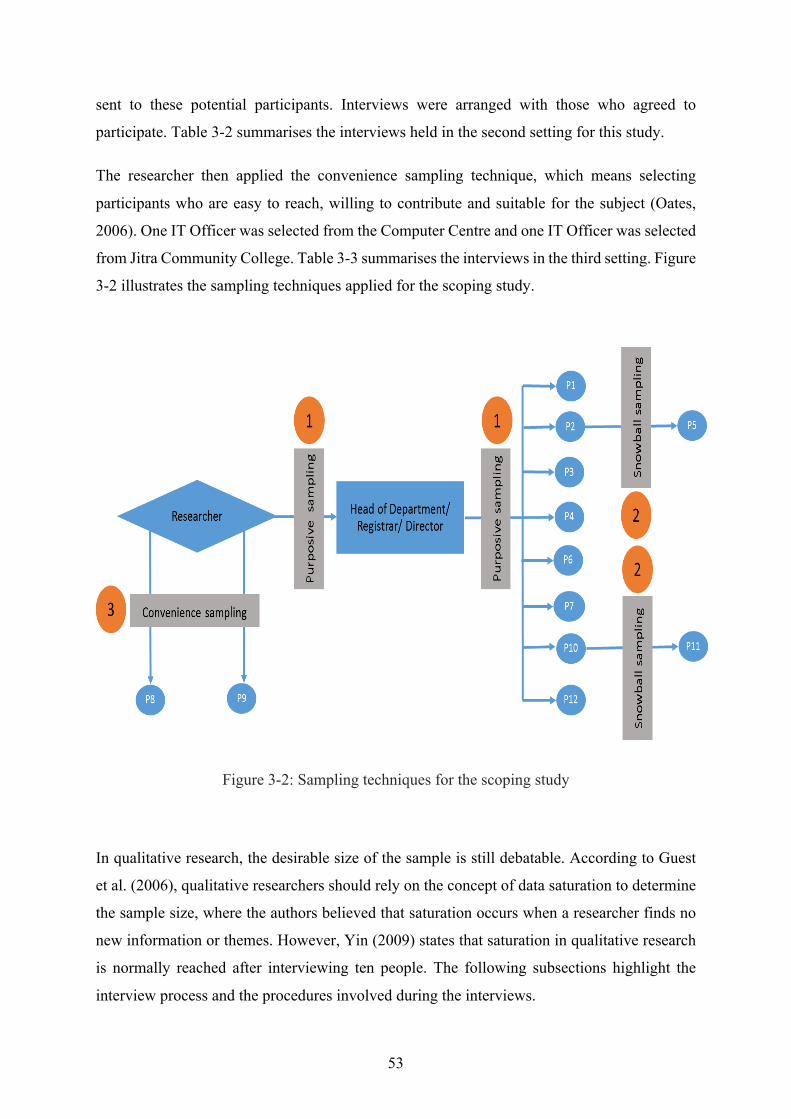
3.4.1.1 Sampling and Recruitment ................................................................................... 51
3.4.1.2 Interviews ............................................................................................................. 54
3.4.1.3 Data Analysis Approach ...................................................................................... 55
3.4.1.4 Application of Data Analysis Approach .............................................................. 57
3.4.1.5 Qualitative Research Quality Evaluation ............................................................. 58
3.4.1.6 Ethical Considerations ......................................................................................... 60
3.4.2 Stage Two: Online Survey .......................................................................................... 61
3.4.2.1 Sampling and Recruitment ................................................................................... 61
3.4.2.2 Survey Design and Measurement Development .................................................. 63
3.4.2.3 Data Analysis Approach ...................................................................................... 64
3.4.2.4 Reliability and Validity ........................................................................................ 64
3.4.2.5 Ethical Considerations for the Survey ................................................................. 65
3.5 Chapter Summary .......................................................................................................... 66
Chapter 4 : Scoping Study ....................................................................................................... 67
4.1 Introduction .................................................................................................................... 67
4.2 Main Findings ................................................................................................................ 67
4.2.1 Relative Advantage ................................................................................................. 67
4.2.2 Effort Expectancy ................................................................................................... 69
4.2.3 Social Influence ...................................................................................................... 71
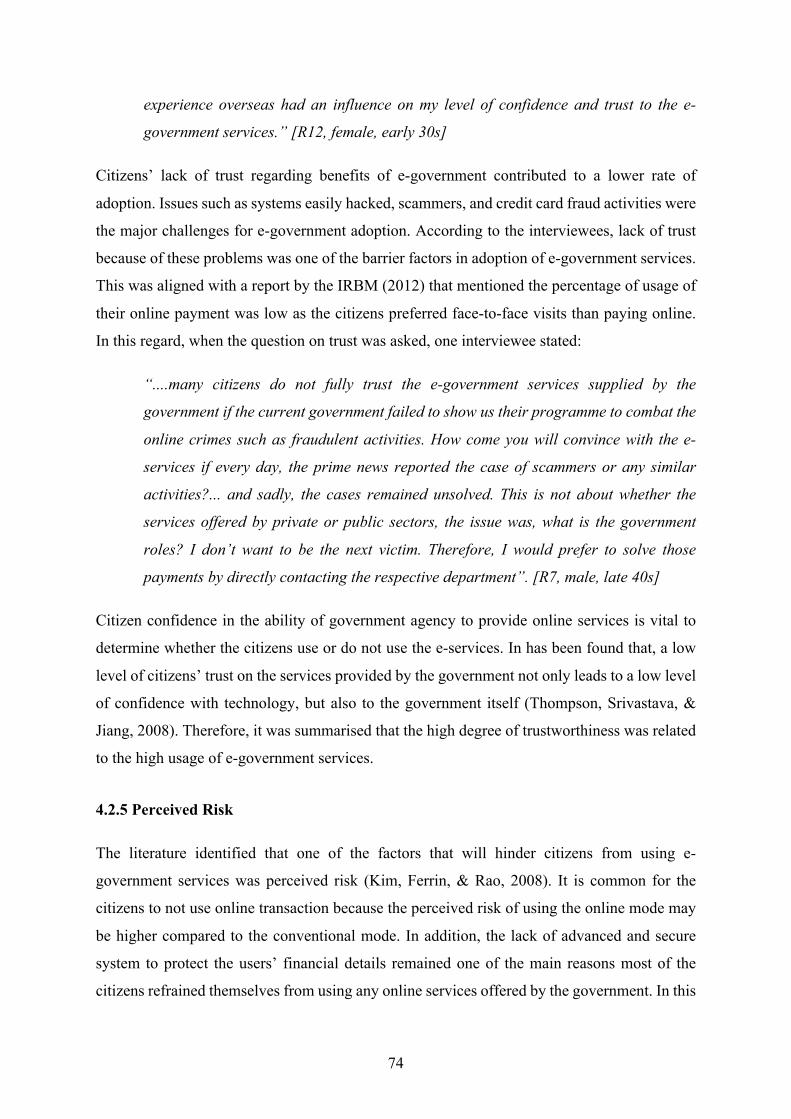
4.2.4 Perceived Trust ....................................................................................................... 73
4.2.5 Perceived Risk ........................................................................................................ 74
4.3 Implications of the Scoping Study ................................................................................. 76
Page 12
xii
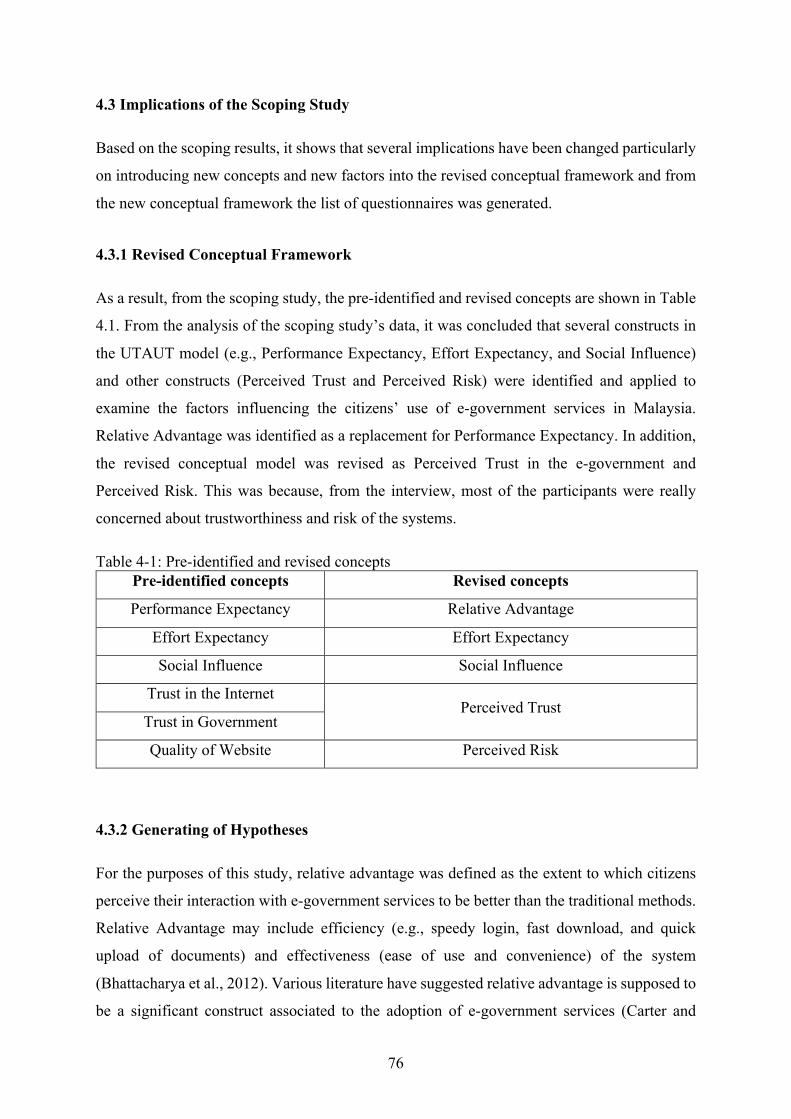
4.3.1 Revised Conceptual Framework ............................................................................. 76
4.3.2 Generating of Hypotheses ....................................................................................... 76
4.4 Chapter Summary .......................................................................................................... 81
Chapter 5 : Data Analysis ........................................................................................................ 82
5.1 Introduction .................................................................................................................... 82
5.2 Development of Measurement of Survey Items ............................................................ 82
5.3 Questionnaire Development ........................................................................................... 88
5.4 Response Rate and Data Coding .................................................................................... 89
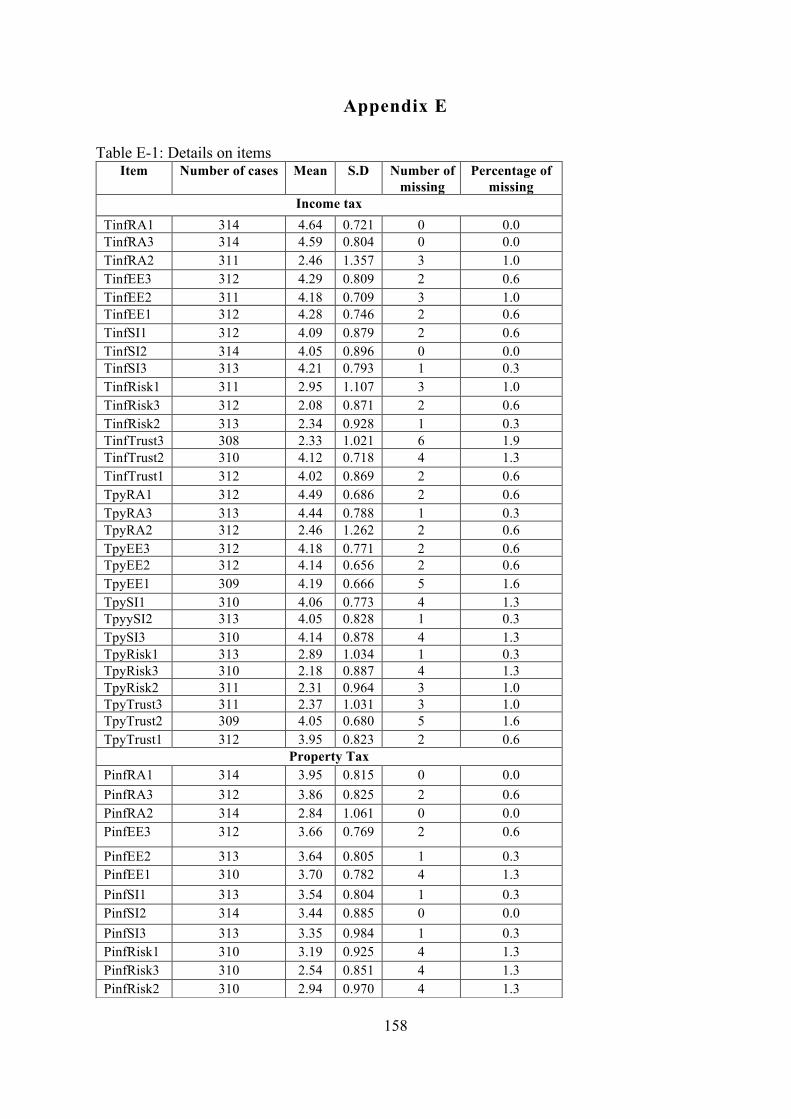
5.5 Missing Data .................................................................................................................. 89
5.6 Demographic Profiles of Respondents ........................................................................... 90
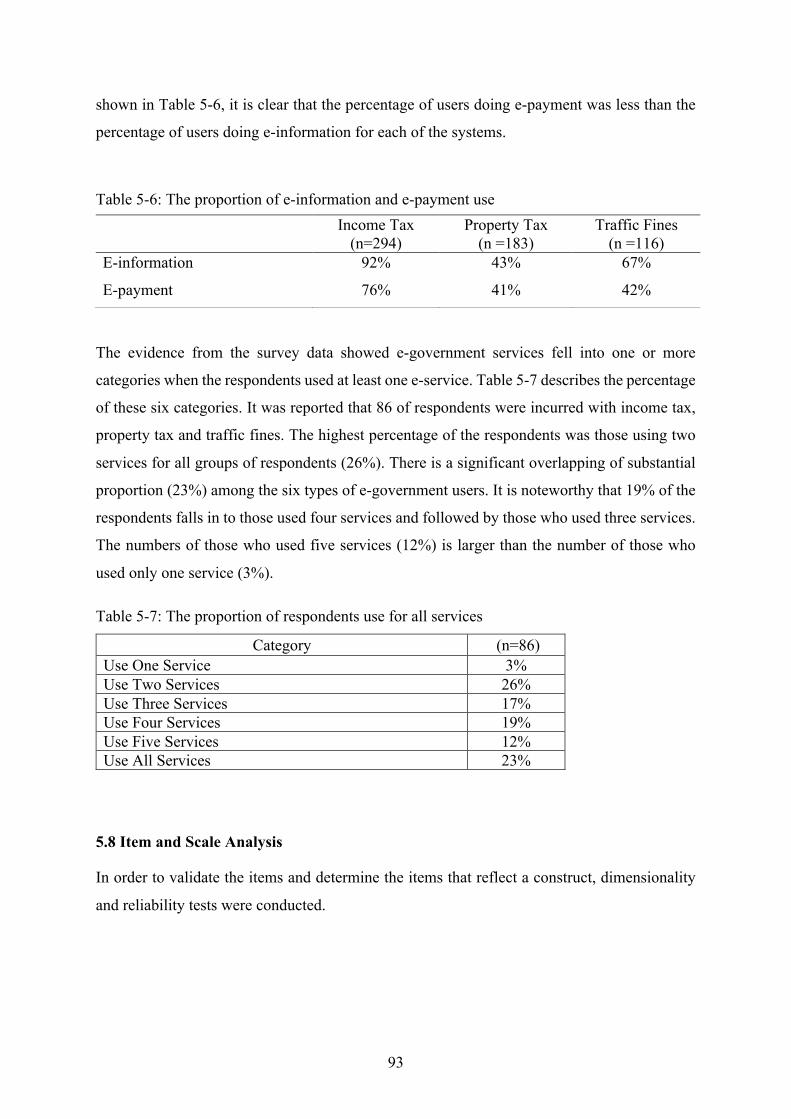
5.7 Frequency of Usage and Non-usage of E-Services by System ...................................... 92
5.8 Item and Scale Analysis ................................................................................................. 93
5.8.1 Dimensionality ........................................................................................................ 94
5.8.2 Reliability ................................................................................................................ 95
5.9 Exploratory Factor Analysis .......................................................................................... 95
5.10 Multicollinearity Test ................................................................................................... 98
5.11 Multivariate Analysis: Logistic Regression Analysis Results ..................................... 98
5.11.1 Income Tax System Use ....................................................................................... 99
5.11.2 Property Tax System Use .................................................................................... 101
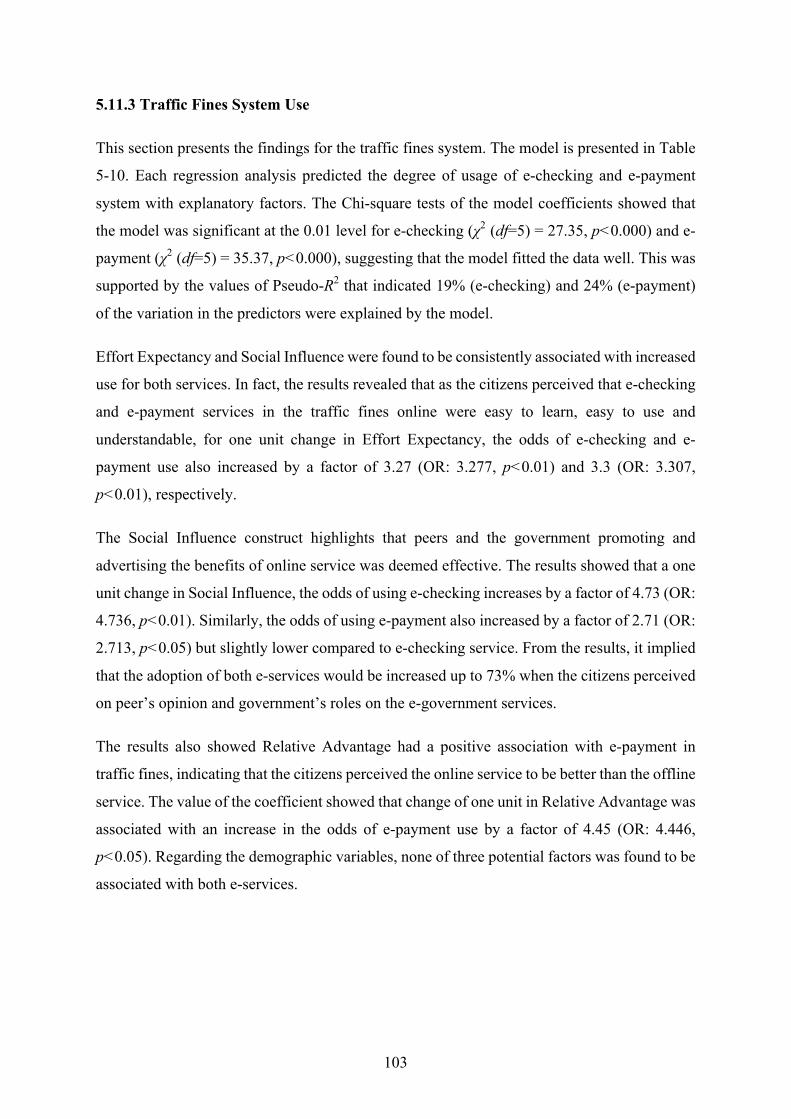
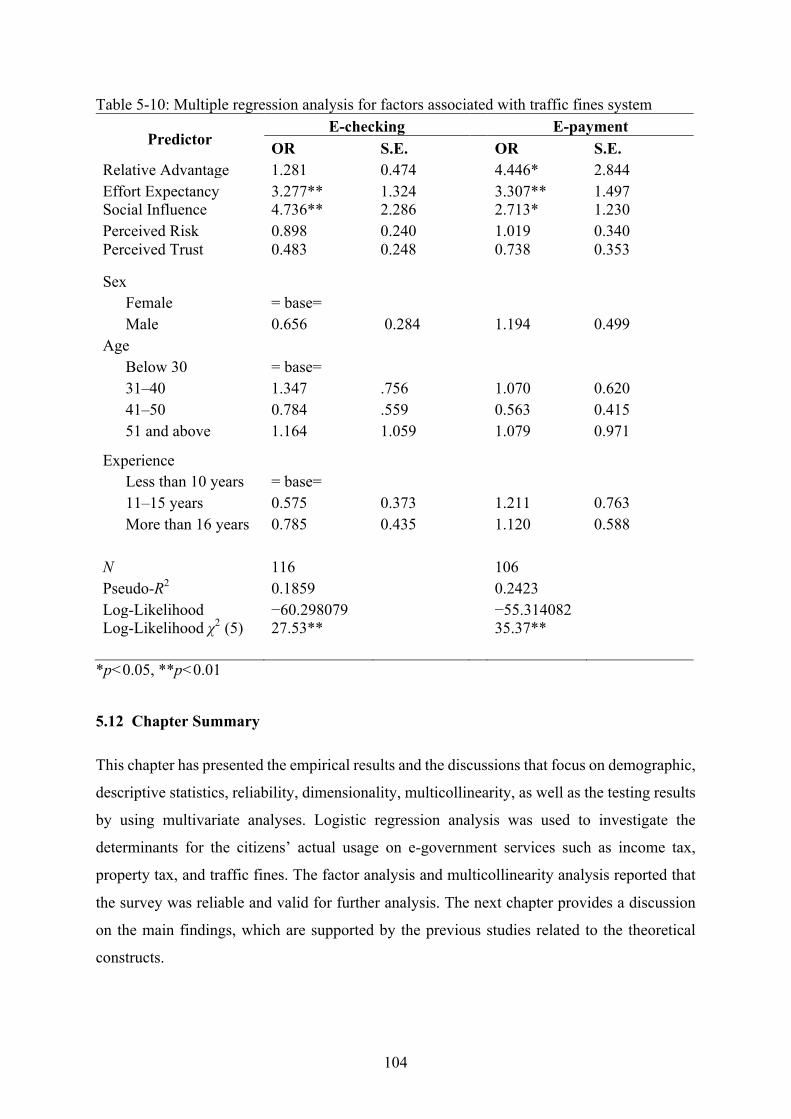
5.11.3 Traffic Fines System Use .................................................................................... 103
5.12 Chapter Summary ..................................................................................................... 104
Chapter 6 : Discussion and Conclusion ................................................................................. 105
6.1 Introduction .................................................................................................................. 105
6.2 Discussion on the Survey Findings .............................................................................. 105
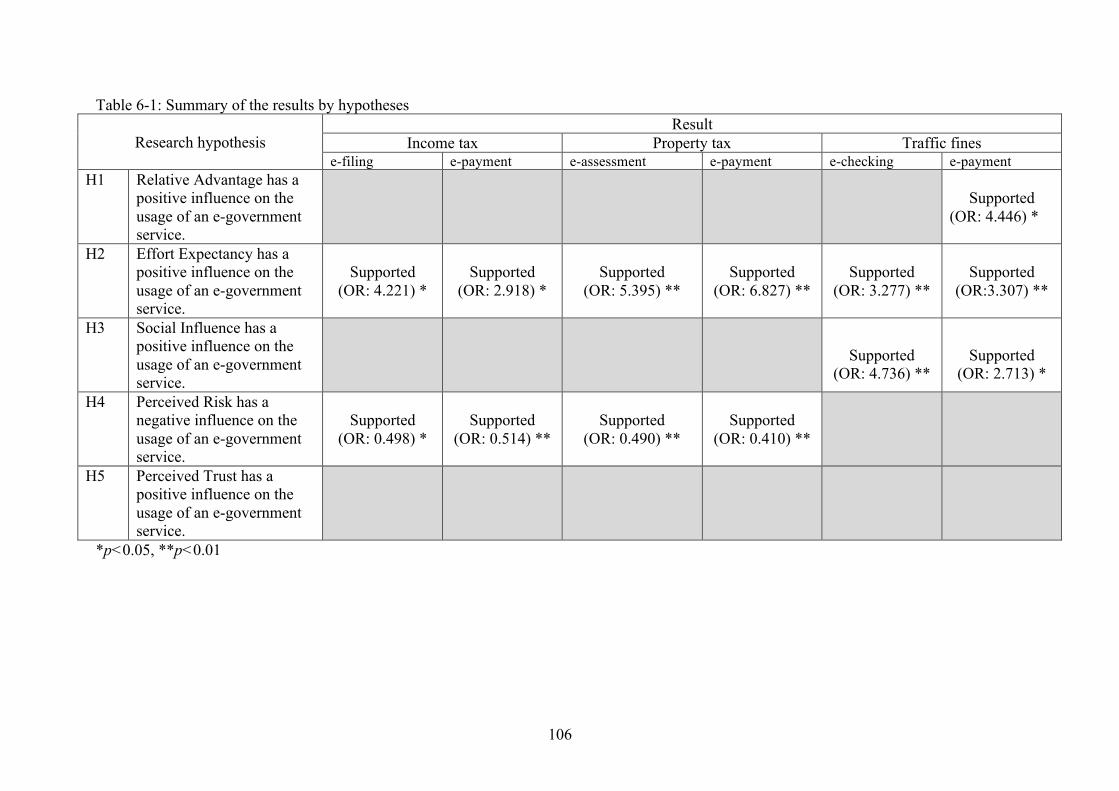
6.2.1 Drivers of E-government Use ............................................................................... 107
6.2.2. Level of E-information Versus E-payment Services. .......................................... 114
6.3 Implications of the Study ............................................................................................. 117
6.3.1 Academic Implications ......................................................................................... 117
6.3.2 Practical Implications ............................................................................................ 119
6.4 Limitations of the study ............................................................................................... 120
6.5 Future Studies .............................................................................................................. 121
Page 13
xiii
References .............................................................................................................................. 122
Appendix A ............................................................................................................................ 143
Appendix B ............................................................................................................................ 145
Appendix C ............................................................................................................................ 146
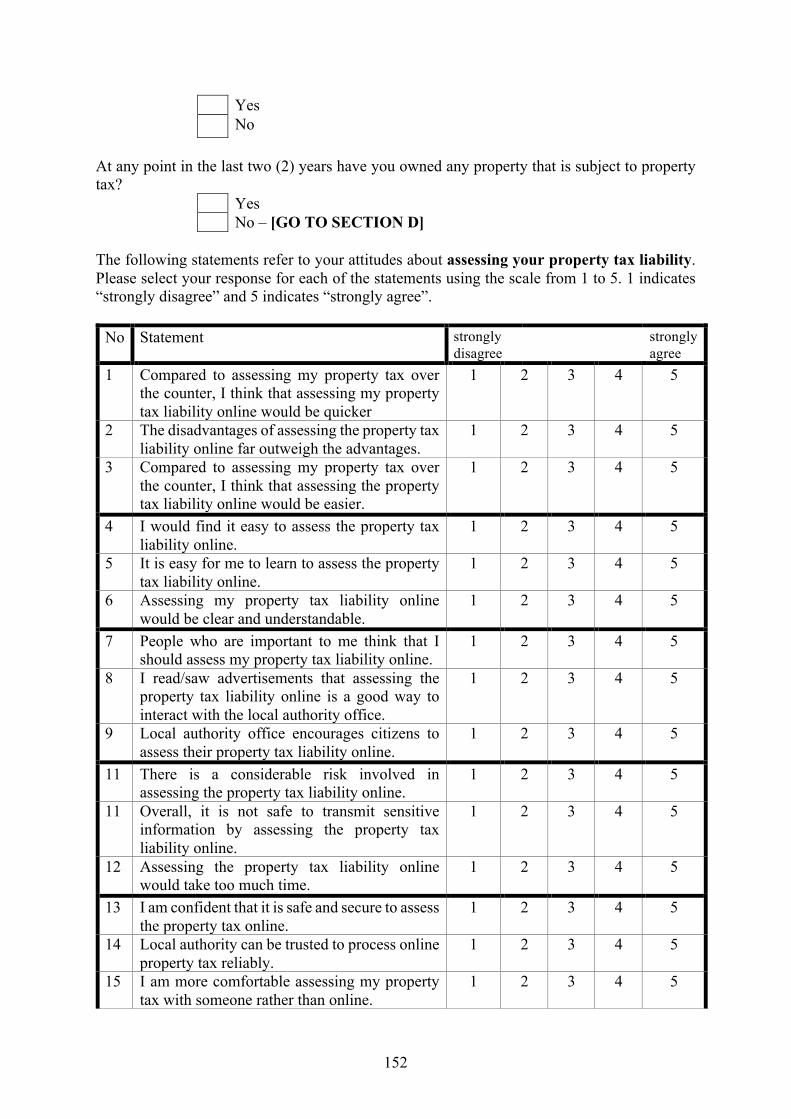
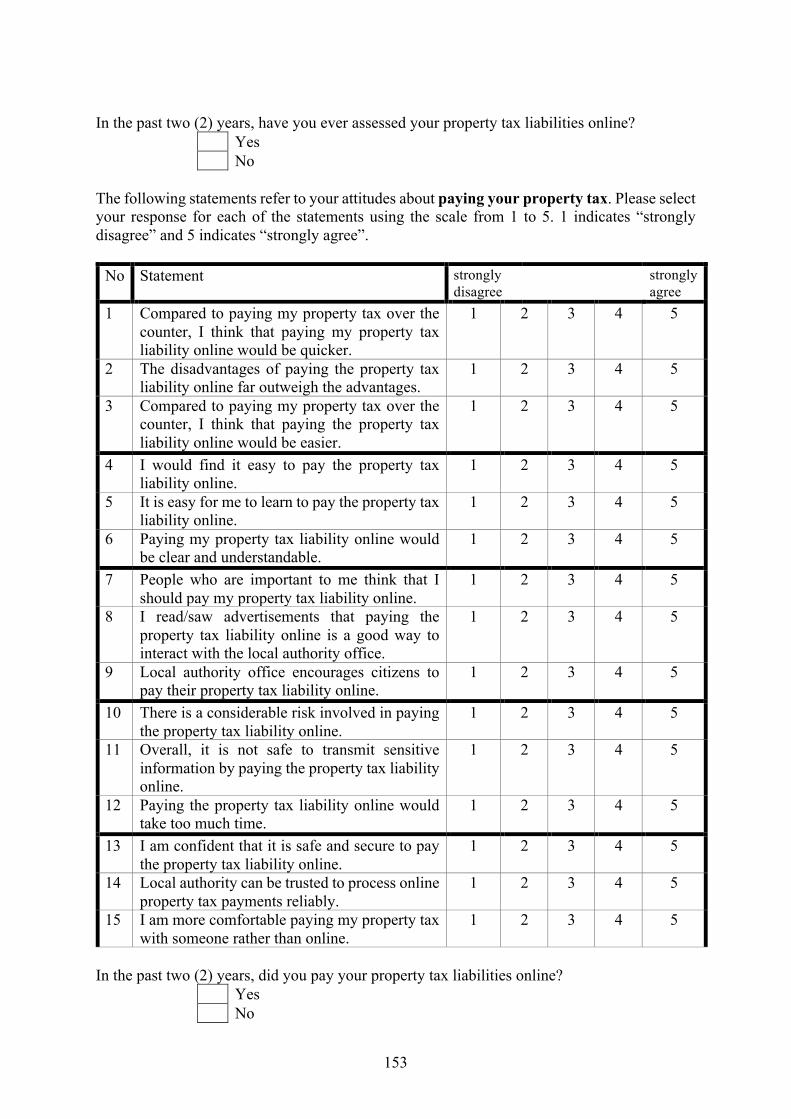
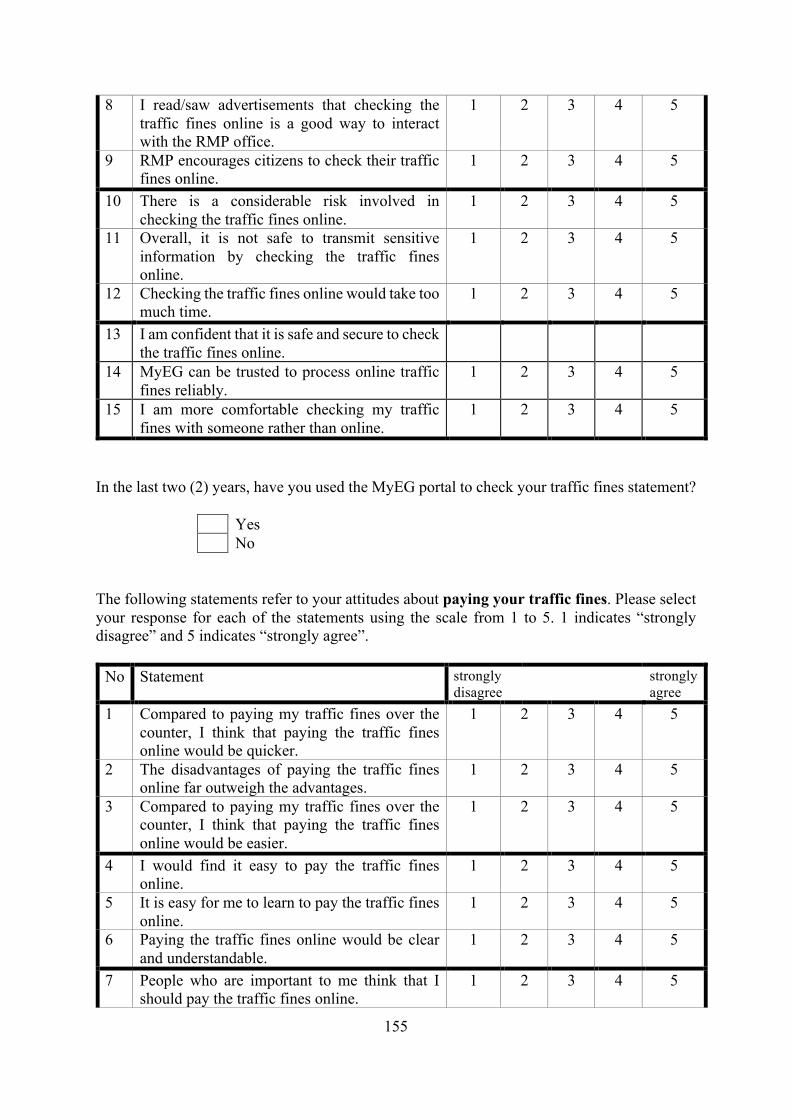
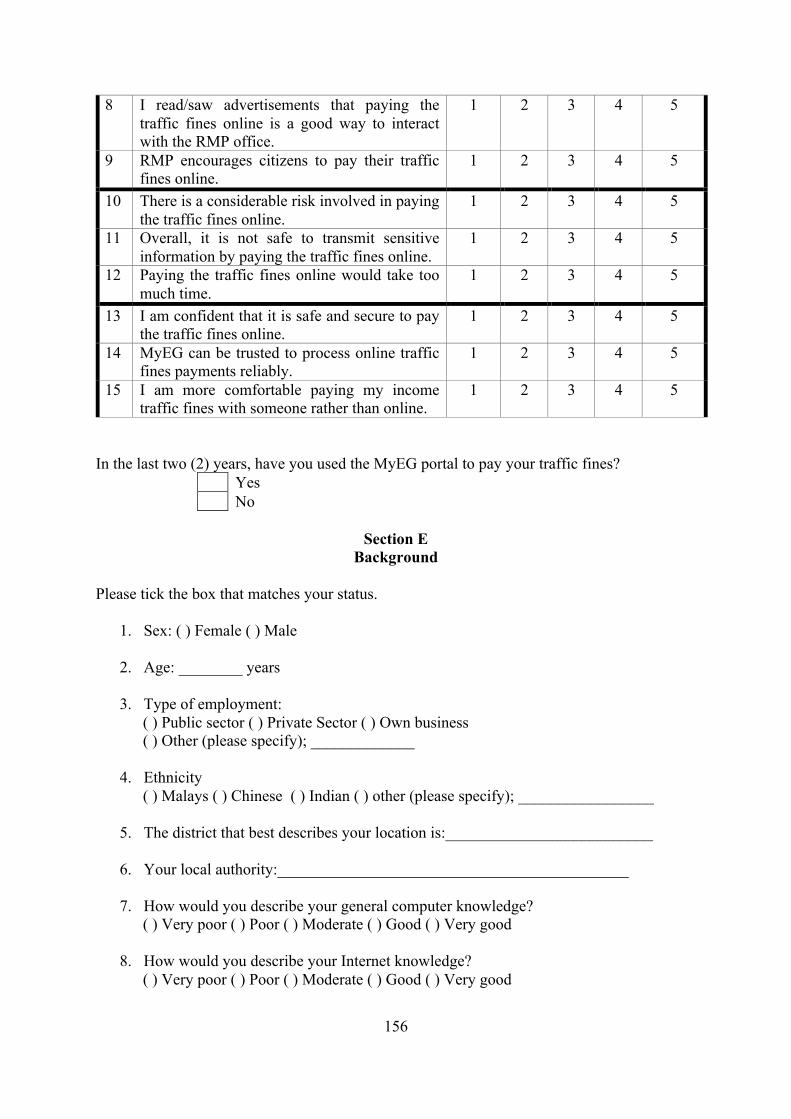
Appendix D ............................................................................................................................ 147
Appendix E ............................................................................................................................ 158
Appendix F............................................................................................................................. 160
Appendix G ............................................................................................................................ 162
Appendix H ............................................................................................................................ 163
Appendix I ............................................................................................................................. 164
Page 14
xiv
List of Figures
Figure 2-1: E-government maturity model .............................................................................. 18
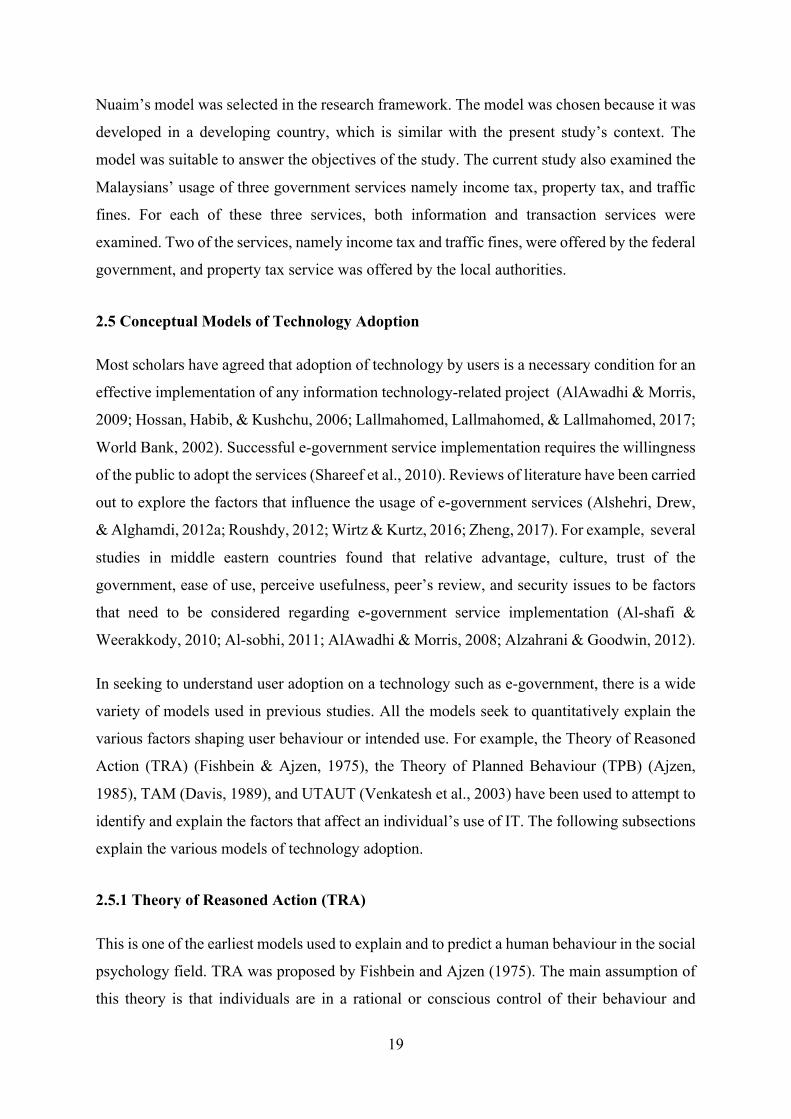
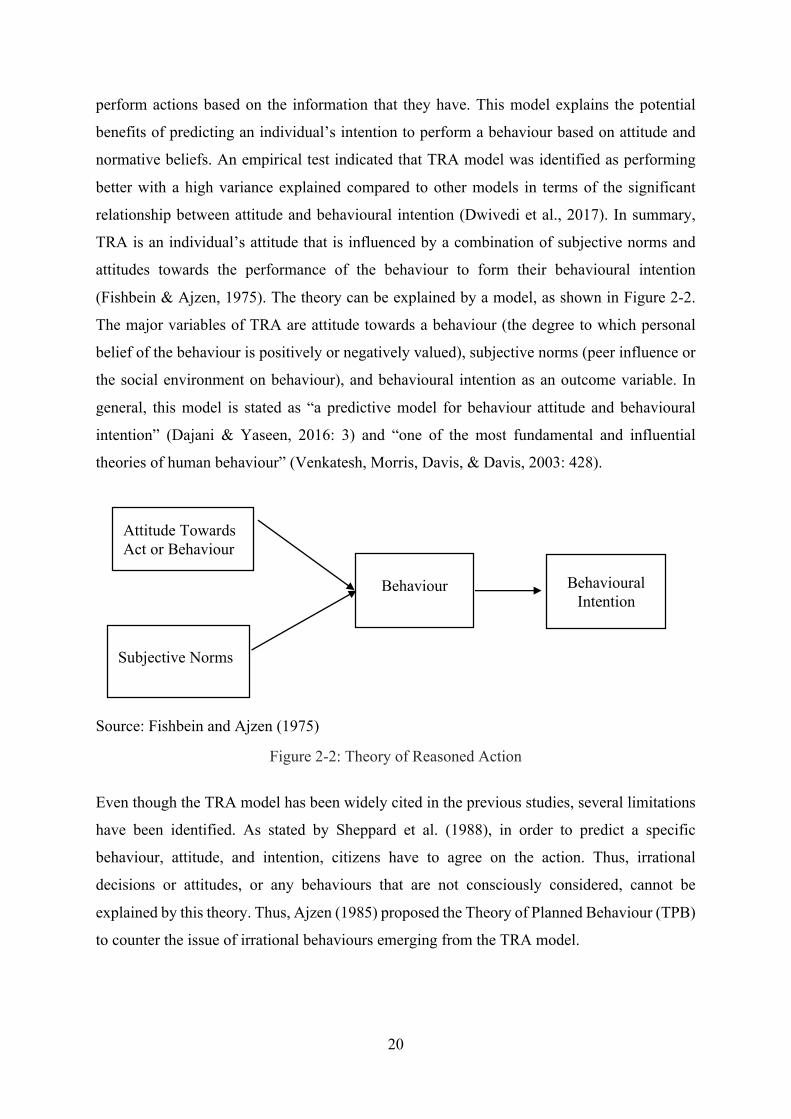
Figure 2-2: Theory of Reasoned Action .................................................................................. 20
Figure 2-3: Theory of Planned Behaviour ............................................................................... 22
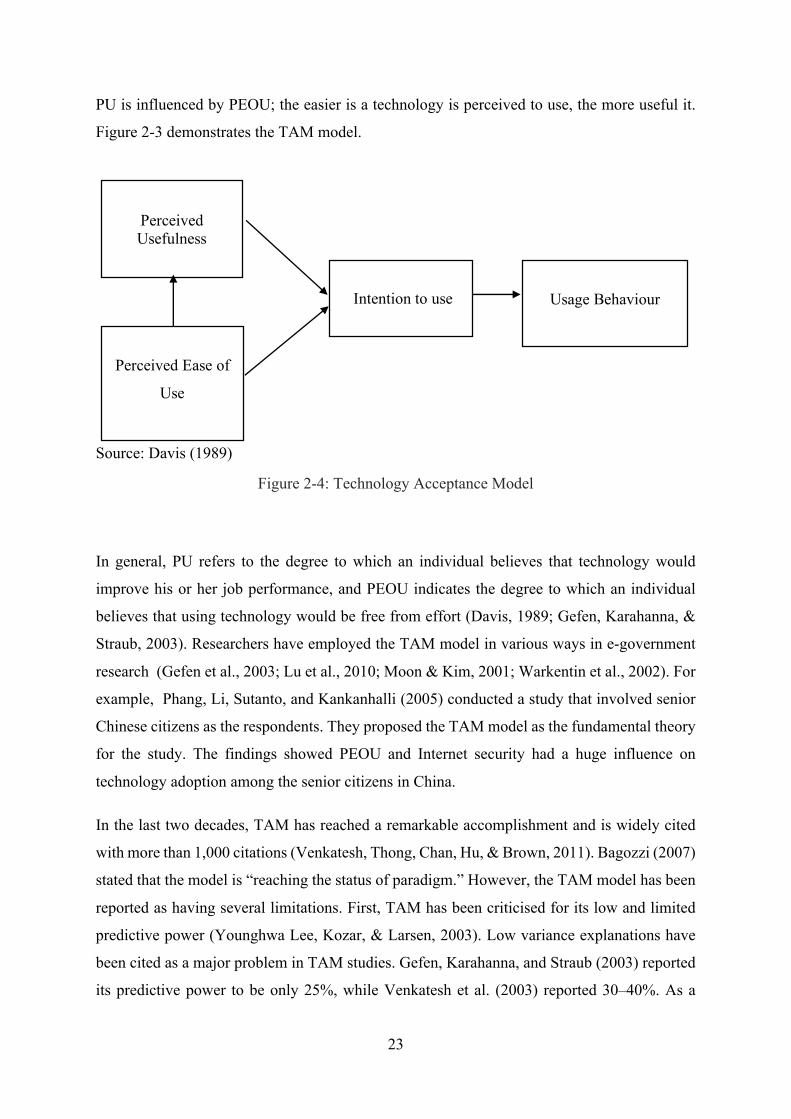
Figure 2-4: Technology Acceptance Model ............................................................................ 23
Figure 2-5: Unified Theory of Acceptance and Use of Technology ....................................... 26
Figure 2-6: Initial research model for each of e-services ........................................................ 43
Figure 3-1: Research procedures………………………………………..……………………49
Figure 3-2: Sampling techniques for the scoping study ........................................................... 53
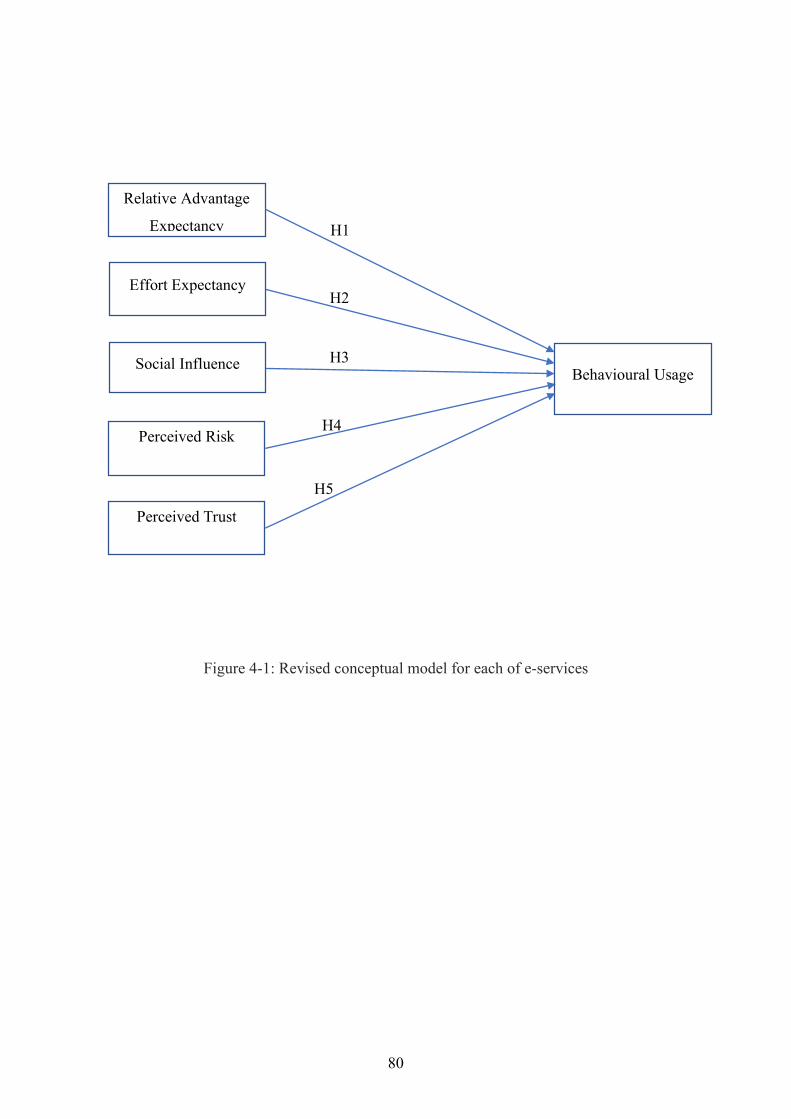
Figure 4-1: Revised conceptual model for each of e-services…………….………..…...……81
Figure 5-1: Reverse scoring in a 5-point scale ......................................................................... 89
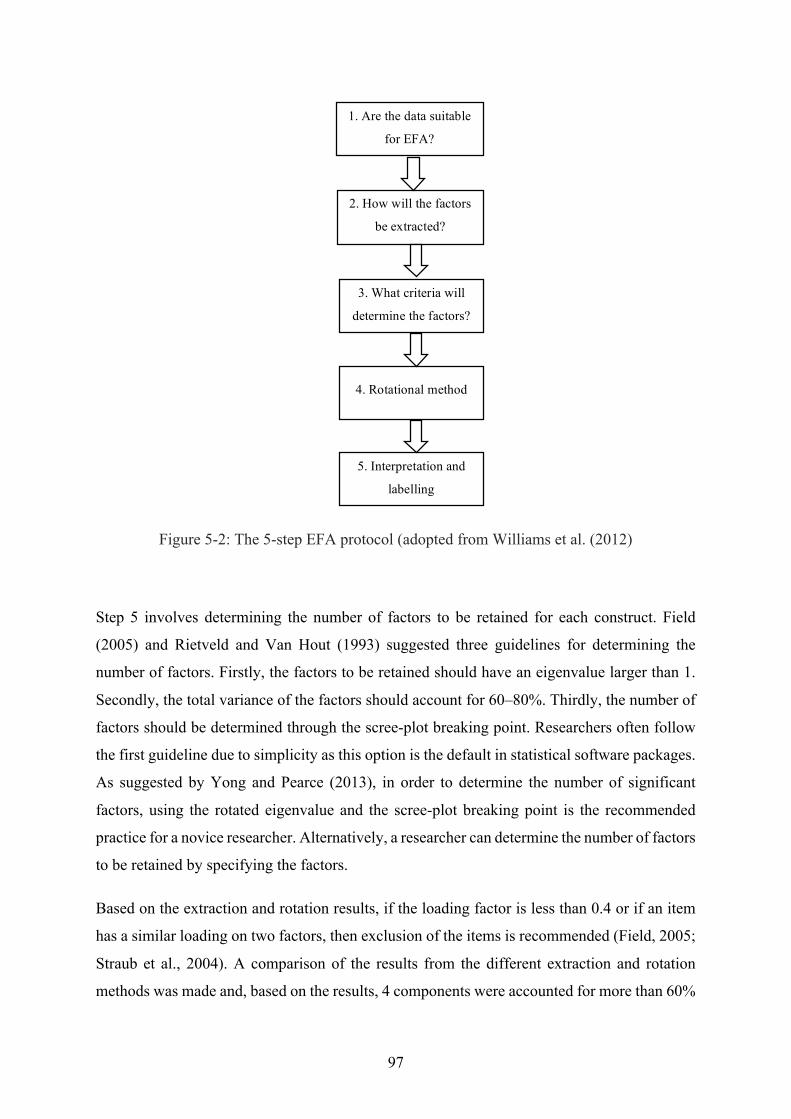
Figure 5-2: The 5-step EFA protocol (adopted from Williams et al. (2012) ........................... 97
Page 15
xv
List of Tables
Table 1-1: List of pilot projects of the electronic government flagship application .................. 9
Table 2-1: Summary of models for phases in e-government implementation ......................... 17
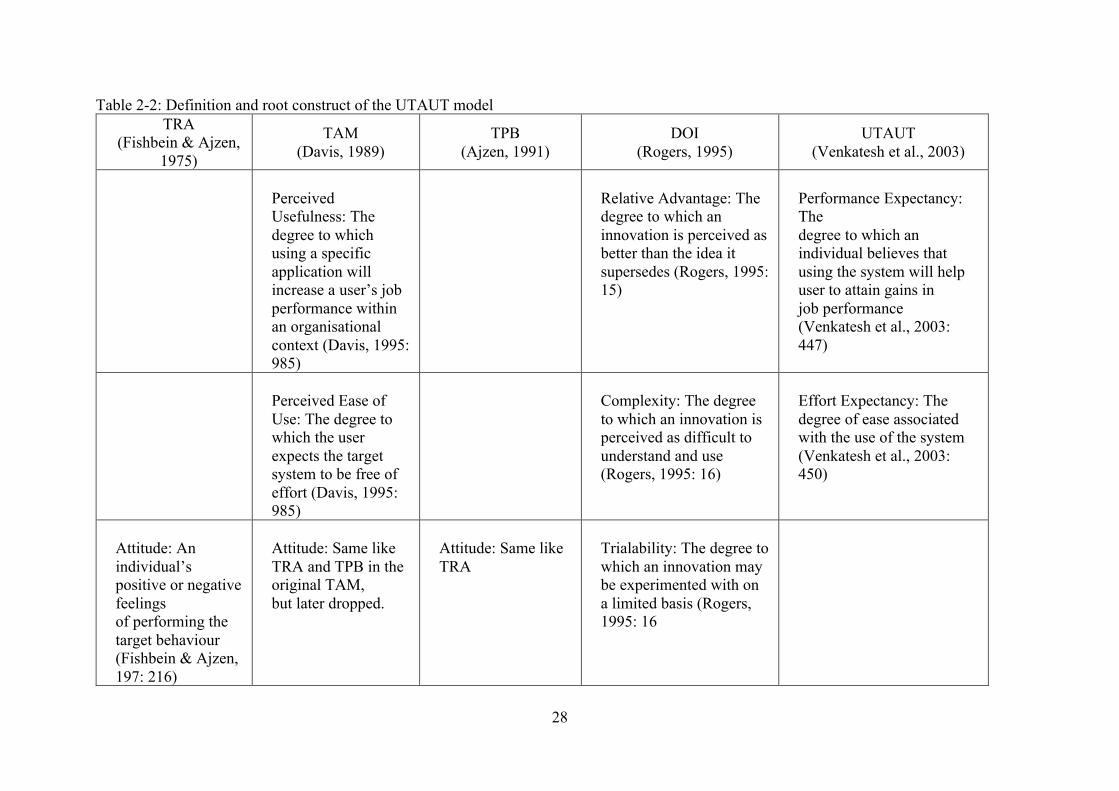
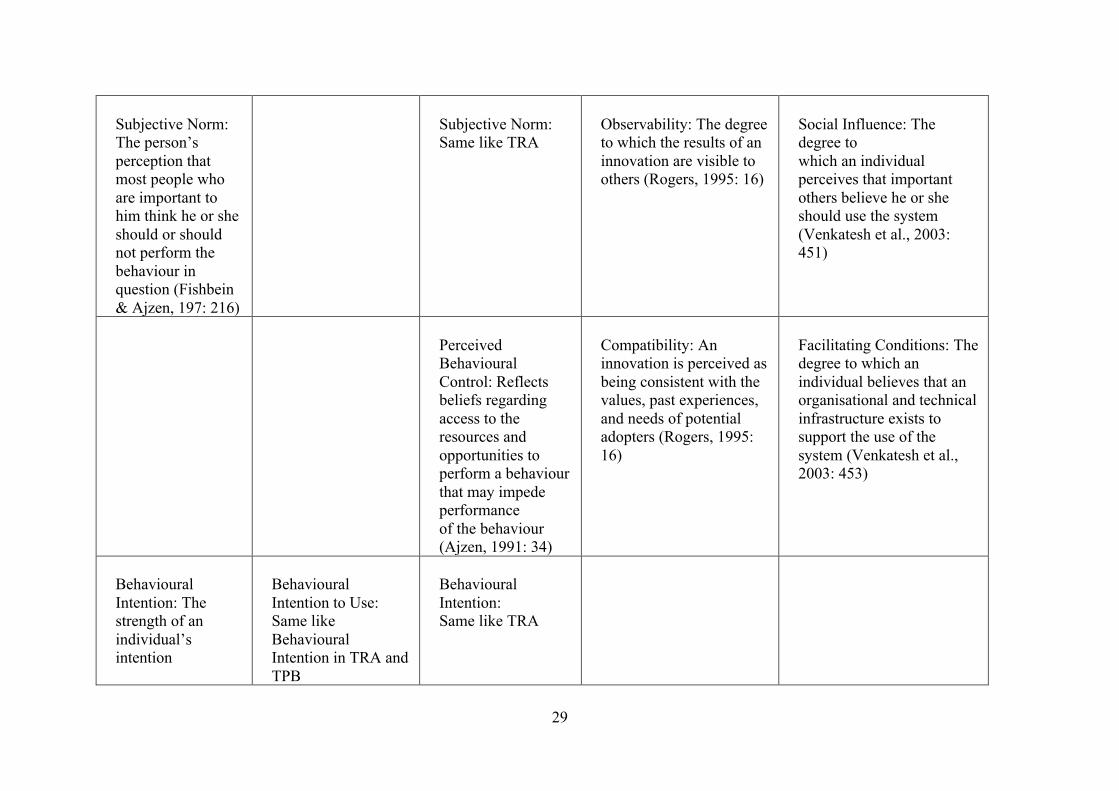
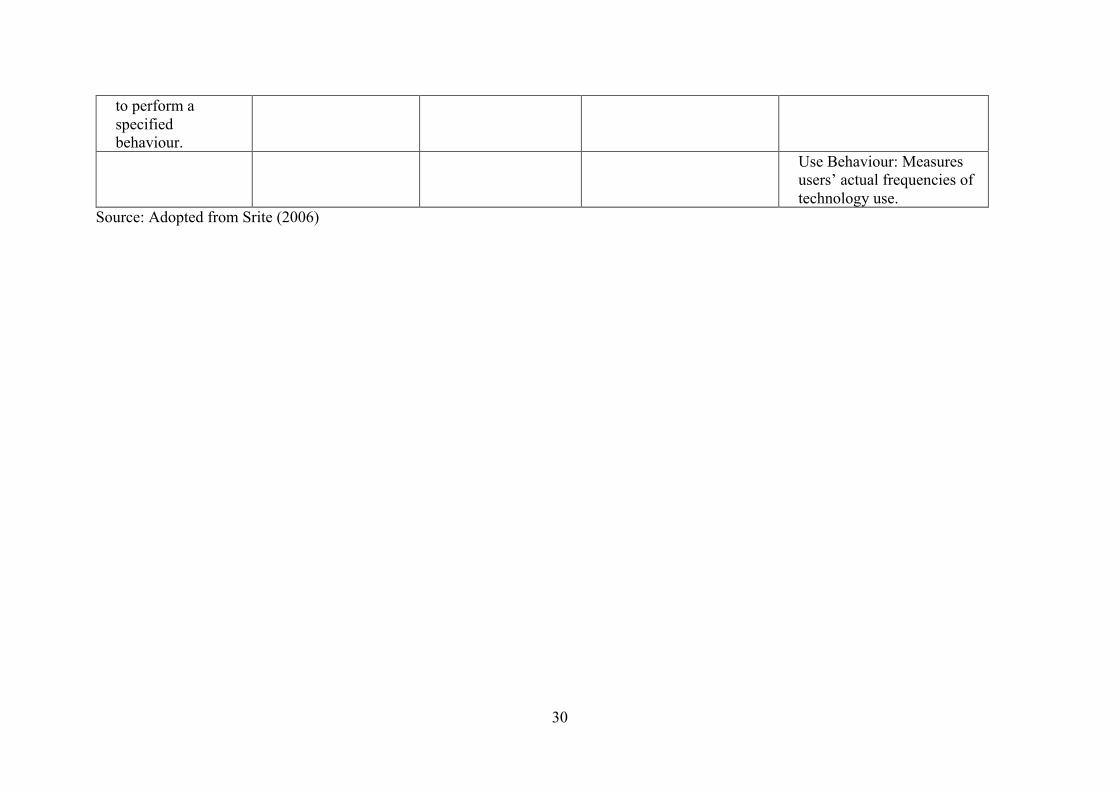
Table 2-2: Definition and root construct of the UTAUT model .............................................. 28
Table 2-3: List of constructs in the technology adoption model ............................................. 31
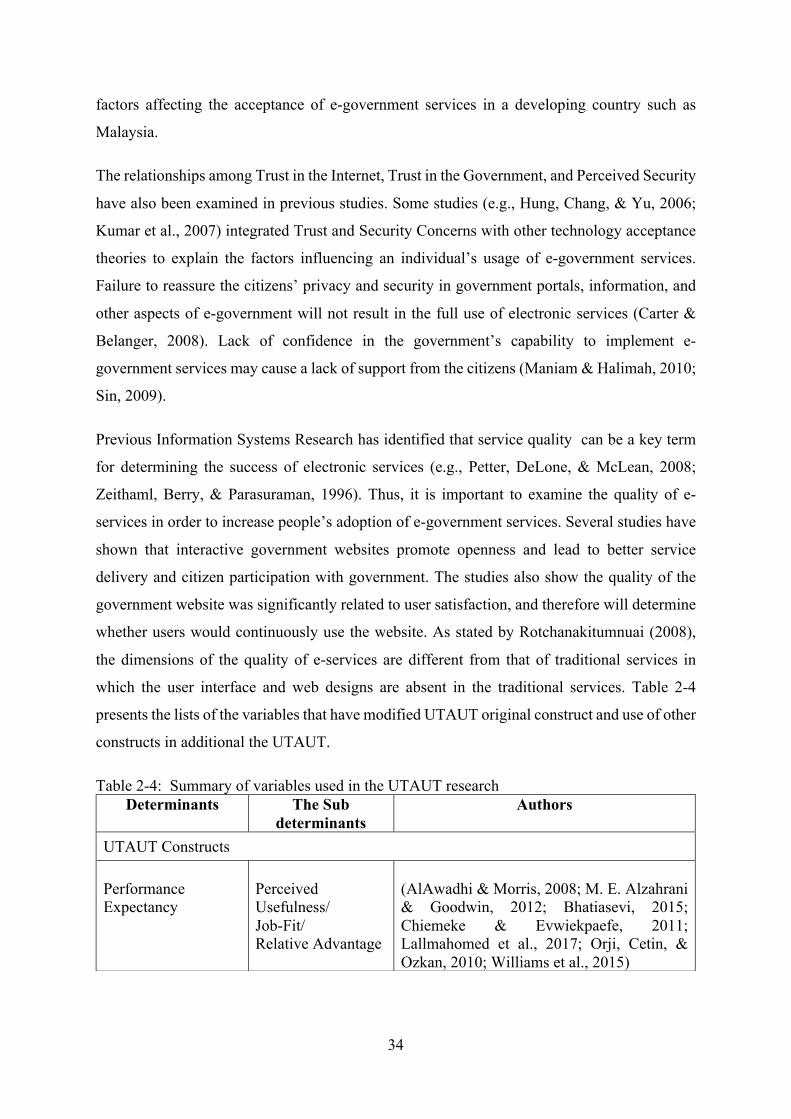
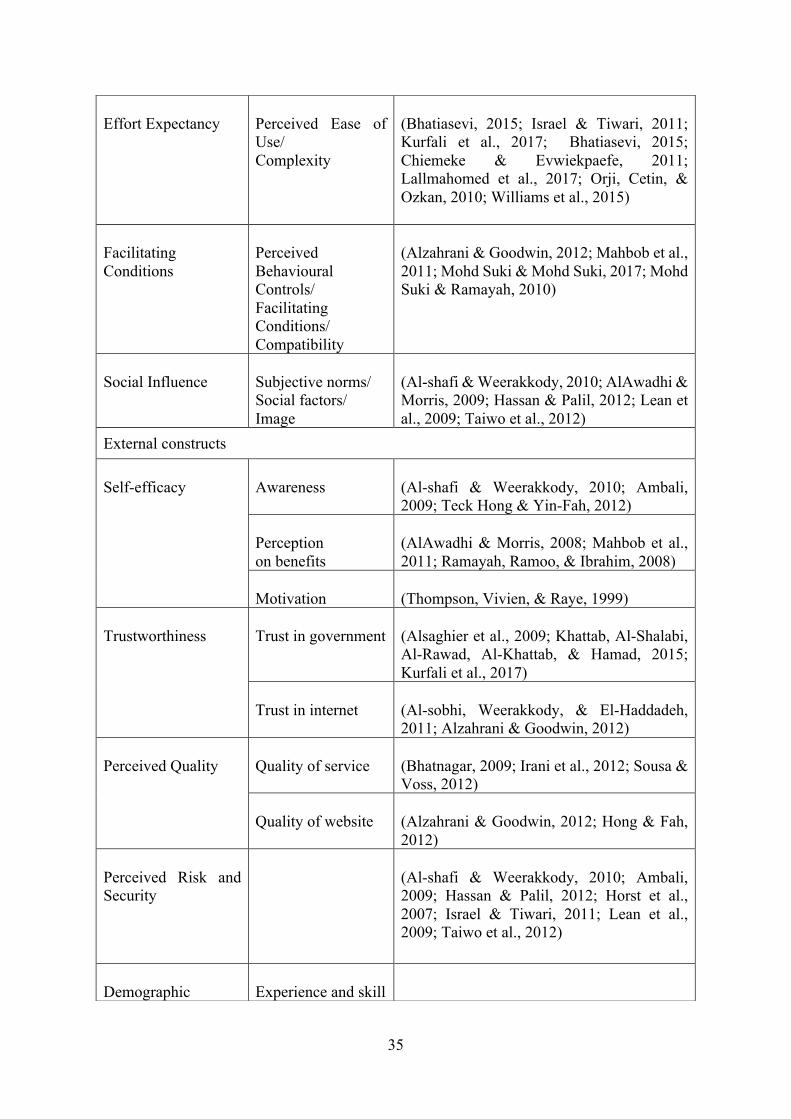
Table 2-4: Summary of variables used in the UTAUT research ............................................ 34
Table 2-5: Summary of articles related to the technology adoption in Malaysia .................... 37
Table 3-1: First setting for the study ........................................................................................ 52
Table 3-2: Second setting for the study ................................................................................... 52
Table 3-3: Third setting for the study ...................................................................................... 52
Table 3-4: The priori themes .................................................................................................... 57
Table 4-1: Pre-identified and revised concepts ........................................................................ 76
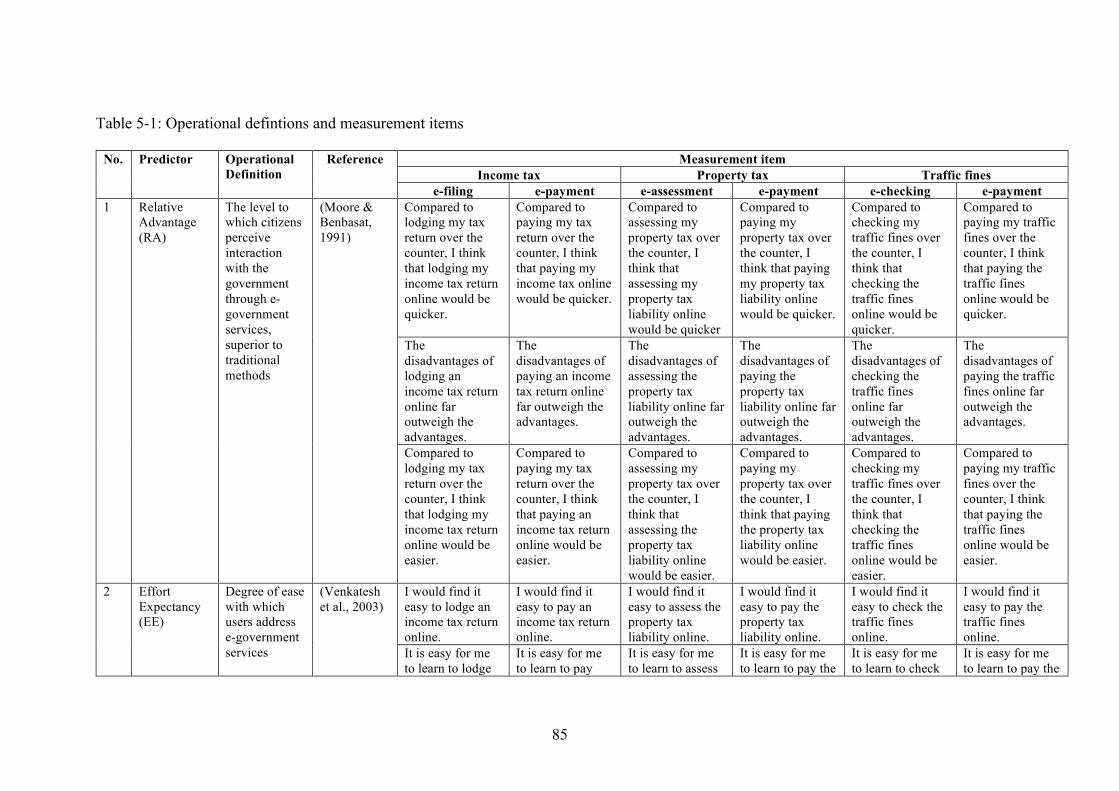
Table 5-1: Operational definitions and measurement items…………….……………………86
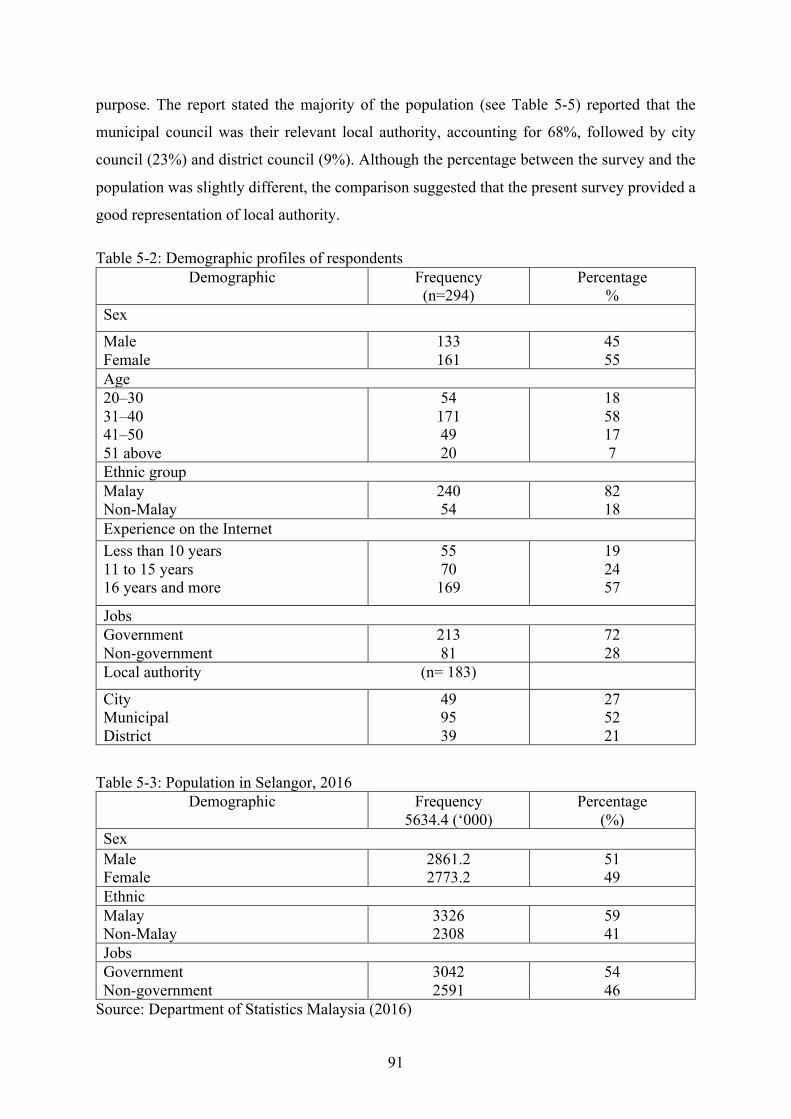
Table 5-2: Demographic profiles of respondents ……………………………….....................91
Table 5-3: Population in Selangor, 2016 ……………………………………………………..91
Table 5-4: Population by age in Selangor, 2016 …………………………………..…………92
Table 5-5: Population by local authority in Selangor, 2016 …………………..……………...92
Table 5-6: The proportion of e-information and e-payment use ..……………………………93
Table 5-7: The proportion of respondents use for all services .………………………………93
Table 5-8: Multiple regression analysis for factors associated with income tax system ...... 100
Table 5-9: Multiple regression analysis for factors associated with property tax system .….102
Page 16
xvi
Table 5-10: Multiple regression analysis for factors associated with traffic fines system ....104
Table 6-1: Summary of the results by hypotheses ................................................................. 106
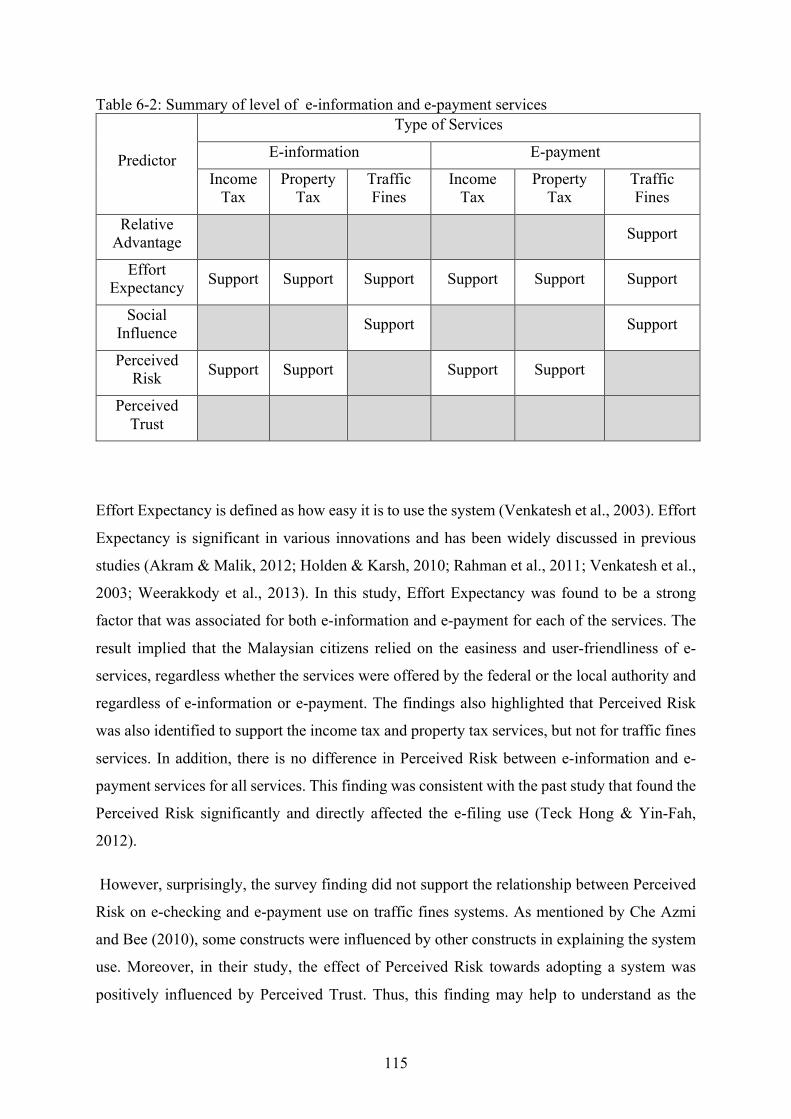
Table 6-2: Summary of e-information and e-payment level of services ............................... 115
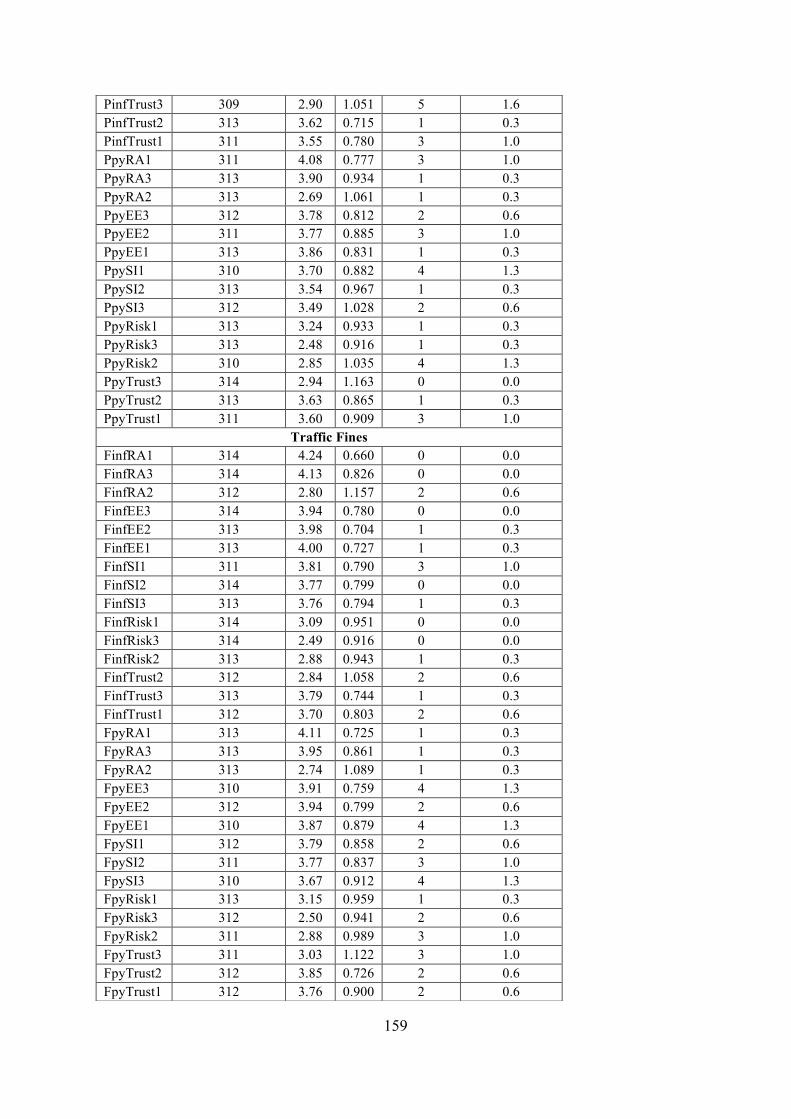
Table E-1: Details on items .................................................................................................... 158
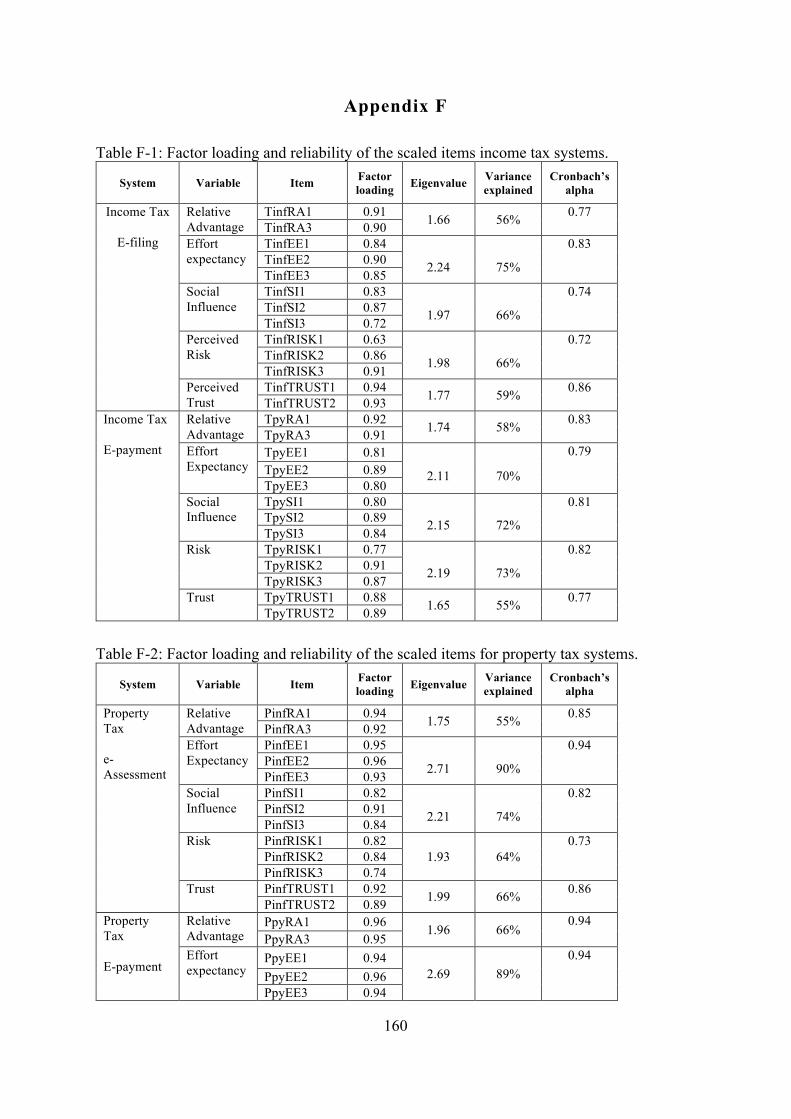
Table F-1: Factor loading and reliability of the scaled items income tax systems. ............... 160
Table F-2: Factor loading and reliability of the scaled items for property tax systems. ........ 160
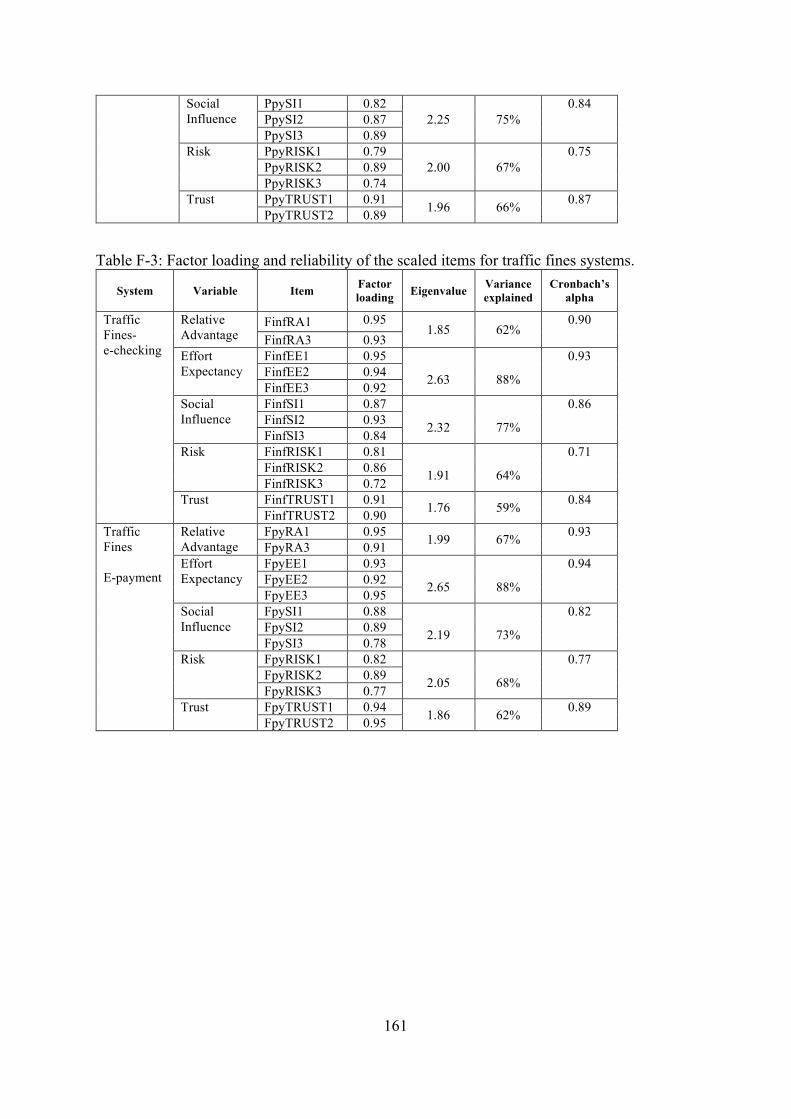
Table F-3: Factor loading and reliability of the scaled items for traffic fines systems. ........ 161
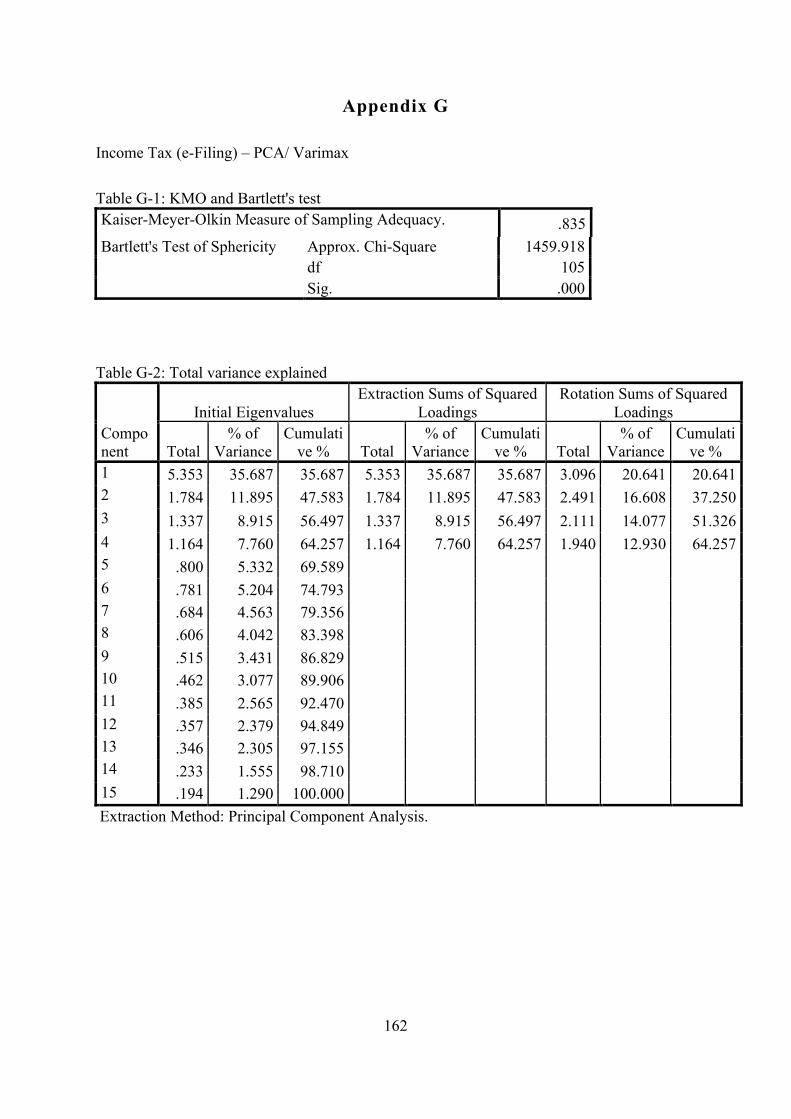
Table G-1: KMO and Bartlett's test ....................................................................................... 162
Table G-2: Total variance explained ...................................................................................... 162
Table H-1: Multicollinearity test – Actual usage on information .......................................... 163
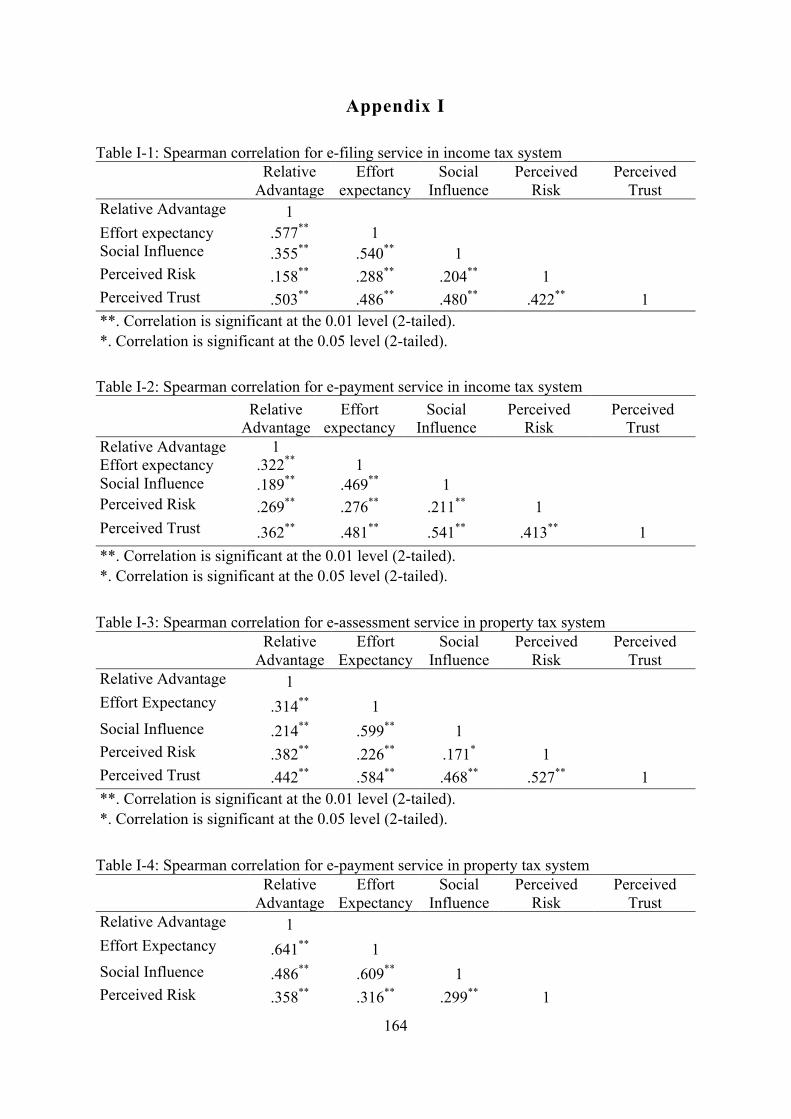
Table I-1: Spearman correlation for e-filing service in income tax system ........................... 164
Table I-2: Spearman correlation for e-payment service in income tax system ...................... 164
Table I-3: Spearman correlation for e-assessment service in property tax system ................ 164
Table I-4: Spearman correlation for e-payment service in property tax system .................... 164
Table I-5: Spearman correlation for e-checking in traffic fines system ................................ 165
Table I-6: Spearman correlation for e-payment in traffic fines system ................................. 165
Page 17
xvii
List of Abbreviations used in the Thesis
AVE
DOI
: Average Variance Extracted
: Diffusion of Innovations
e-government : Electronic Government
G2B : Government to Business
G2C : Government to Citizen
G2G : Government to Government
ICT : Information Communication and Technology
IRBM : Inland Revenue Board of Malaysia
IS : Information System
MAMPU
MAR
MSC
MyEG
NHMRC
: Malaysian Administative Modernization and Management Planning Unit
: Missing at Random
: Multimedia Super Corridor
: E-Government Services Portal
: The National Health and Medical Research Council
OPCRS
PAF
PCA
SLGGA
TAM
: Online Permanent Account Number Card Registration System
: Principal Axis Factoring
: Principal Component Analysis
: Smart Local Government Governance Agenda
: Technology Acceptance Model
TPB : Theory of Planned Behaviour
TRA : Theory of Reasoned Action
UMEGA
UN
: Unified Model of E-Government Adoption
: United Nations
UNASPA : The United Nations and American Society for Public Administration
UTAUT : Unified Theory of Acceptance and Use of Technology
UUM : Universiti Utara Malaysia
Page 18
1
Chapter 1 : Introduction
1.1 Background of Study
E-government has become a part of governments’ development programmes throughout the
world. The term “e-government” describes the use of electronic information and
communication technologies (ICTs) to support government operations and to interact with
citizens through “government to citizen” (G2C) initiatives (Wang & Liao, 2008; Scholl, 2003;
World Bank, 2007), to provide services to businesses through “government to business” (G2B)
initiatives (Brown & Brudney, 2004; United Nations, 2005; Seifert & Petersen, 2002), and to
achieve more efficient operations between government agencies through “government to
government” (G2G) initiatives (Carter & Belanger, 2005; Seifert, 2008; Fang, 2002). With the
availability of e-government, online public services can be accessed 24 hours a day, 7 days a
week. Despite the e-government still being in its infancy, this topic has become popular and
attracted the attention of many scholars, political leaders, and policy makers around the world
(Chen, Chen, Huang, & Ching, 2006). Several potential benefits of e-government have been
identified in the literature, including increasing a citizen-centric engagement (Alsaghier, Ford,
Nguyen, & Hexel, 2009), improving access to public services (Heath, 2000), and increasing
citizen confidence in government services (Warkentin, Gefen, Pavlou, & Rose, 2002).
Previous studies have reported that there are similar usage patterns by citizens on e-government
adoption in developing and developed countries (Dada, 2006; Shareef, Archer, Sharan, &
Kumar, 2010). The consistency between the results of these studies shows how important it is
for governments to build a reliable, user-friendly, and secure system. Thus, the number of
governments that use e-government applications for delivering their services has increased
rapidly regardless of federal, state, or local authority level. Indeed, improving the efficiency
and effectiveness of government services is the top agenda for every government agency, as
well as to ensure citizens’ adoption of e-government services for a greater return for the huge
investment outlaid by government. However, the adoption of these e-government services by
the public is often slow and the services underutilised (Mohd Idris, 2016; Mohsin & Raha,
2007; Weerakkody, Dwivedi, Brooks, Williams, & Mwange, 2007). The issue of whether the
citizens will embrace new technological procedures and initiatives taken by the government is
a question of both academic and practical nature. Since the factors that influence citizens’
actual usage of different e-government settings have not been well understood, this dissertation
Page 19
2
aims to contribute to e-government research by understanding the determinants that influence
citizens’ usage of different types of e-government services.
In Malaysia, several ICT master plans have been introduced by the Malaysian government to
prepare for the transformation of public services to e-services. Among the master plans are the
Eighth Malaysia Plan (2001–2005), the Knowledge-based Economy Master Plan (2002–2010),
the Public Sector ICT Master Plan (2003), and the Ninth Malaysia Plan (2006–2010). These
initiatives have positioned Malaysia as one of the top five developing countries on the e-
readiness index (WASEDA, 2012), one of the top ten Asian countries on the e-government
index, and fortieth among the 193 member countries of the United Nations (United Nations,
2014). Malaysia is grouped among the 25 emerging leaders in the e-government development,
close behind the top 20 developed countries. Moreover, in some contexts, Malaysia performs
better compared to some developed countries. For example, the Internet penetration rate in
Malaysia is considered high (60.7%), higher than both Italy (58.4%) and Greece (53%) (United
Nations, 2012). Therefore, if the Malaysian government is really concerned about their
investment on IT-related expenditure, they need to implement e-government projects carefully
to avoid implementation failure and wasted resources.
1.2 Problem Statement
Governments have put a lot of effort and money into implementing e-government platforms as
well as to meet the increasing expectations of citizens (Horst, Kuttschreuter, & Gutteling,
2007). Many government agencies have realised the importance of using the Internet as a
medium to improve their services to the public (Sheridan & Riley, 2006), and Malaysia is not
an exception to this trend. Initially, digitising documents and moving to paperless government
operations were a key to an e-government initiative. Through e-government, most services are
available online and can be accessed at any time. Malaysia has shown successful cases of
implementing e-government services whereby income tax payments and declarations can be
accessed electronically through e-filing (Rotchanakitumnuai, 2008).
Scholars have asserted that the success of government to citizen e-services depends on strong
demand and support from citizens (Aldrich, Bertot, & McClure, 2002; Luna-Reyes & Gil-
Garcia, 2011; Parajuli, 2007), while several other authors mentioned that the benefits of e-
government depend on the number of citizens that use the services (Ebrahim & Irani, 2005;
Hung, Chang, & Yu, 2006; Mohsin & Raha, 2007; Warkentin, Gefen, Pavlou, & Rose, 2002).
Page 20
3
However, despite all the efforts and predicted benefits, e-government services offered by
government agencies often remain underutilised by most citizens (Mahbob, Nordin, Salman,
Sulaiman, & Abdullah, 2011; Weerakkody et al., 2007). In fact, previous studies have shown
that citizens did not utilise e-government services fully, even in the countries that are leading
in the UN’s e-government rankings, such as Australia and the UK (Mohd Idris, Kasimin, &
Sahari, 2011). A study about e-government adoption in Malaysia indicated that e-government
use by the citizens was growing, but at a slow pace (Mohd Idris et al., 2011; Mohsin & Raha,
2007) and a low rate of adoption failed to reach the targeted critical mass (Siti Hajar, 2016).
Although the use of e-government services by citizens has been widely examined, the
differential usage of e-government services by the citizens has not yet been examined in the
one study. Detection of the factors that hinder to the use of e-government services is important
for the improvement of e-government adoption. Dorasamy, Marimuthu, Raman and Kaliannan
(2010) studied the adoption of e-filing in Malaysia, focusing on the Klang Valley1. The
researchers surveyed a small sample of randomly selected taxpayer citizens. Based on the TAM
and DOI models, the findings revealed to in order to attract users to use e-filing, it was not
enough to develop a useful system without taking care of the behavioural part of the users.
Therefore, this present study was conducted with the aim to identify the main determinants
influencing citizens’ usage of e-government, besides the overall aims to optimise the successful
implementation of e-government and to ensure the resources and costs were not expended in
vain.
A key challenge in the implementation of e-government in developing countries is not merely
the technology. Instead, the success of e-government is also determined by whether citizens
use the services or not (Gautrin, 2004; Kumar, Mukerji, Butt, & Persaud, 2007). Therefore, in
recent years, many scholars have conducted studies to understand how and why users utilise
electronic commerce (e-commerce) services (Al-zoubi, Thi, & Lim, 2011; Faruq Muhammad
Abubakar & Ahmad, 2013; Nurdin, Stockdale, & Scheepers, 2011). A study reported visiting
the counter to get government services was more preferred and was still a practice in
developing countries (Alshawi & Alalwany, 2009). Several studies on G2C found that people
1 Klang Valley is an area with the most extensive and fast-growing Internet coverage in Malaysia
(MAMPU, 2007).
Page 21
4
were more likely to use e-information services than e-transaction services; they were satisfied
to get information from the Internet, but were reluctant to use it for more advanced processes
such as paying bills and taxes (Alateyah, Crowder, & Wills, 2012; Gauld & Goldfinch, 2006).
In Malaysia, a study by Mahbob et al. (2011) showed that people were more satisfied with
manual methods when dealing with the government agencies. In addition, the authors also
found the respondents used e-government to check summonses for driving violations, but not
to make payments. Similarly, the Inland Revenue Board of Malaysia (2012) reported that the
collection of fines over-the-counter (US$3.4 million) was more than the online method
(US$118, 253). As such, it is reasonable for the government to understand the reasons e-
information usage was higher compared to e-payment services in almost all the e-government
services, which is what this study will investigate.
The literature demonstrates that conceptual models of technology acceptance, including the
Technology Acceptance Model (TAM) and the Unified Theory of Acceptance and Use of
Technology (UTAUT), have been employed to explain technology adoption by citizens
(Alawadhi & Morris, 2008; Al-Sobhi et al., 2009; Wu, Tao & Yang, 2008; Yu, 2012).
However, as suggested by and more recently by Rana and colleagues (Dwivedi et al., 2017;
Rana & Dwivedi, 2015; Rana, Dwivedi, Lal, Williams, & Clement, 2017; Rana, Dwivedi, &
Williams, 2013; Rana, Dwivedi, Williams, & Weerakkody, 2016; Williams, Nripendra,
Dwiyedi, & Banita, 2011) further work should be conducted beyond the boundaries of these
existing models, as additional factors and integrated models may lead to a better understanding
of usage behaviour. For this study, the UTAUT model was adopted as an initial theory to
examine the citizens’ usage of e-government services but was extended through a scoping study
for new drivers of adoption. In this regard, the current study aimed to fill this gap by integrating
the UTAUT model with several other factors that were identified from the technology adoption
literature in order to provide a more complete picture of the factors influencing the adoption of
e-government services. An intensive review of the literature was unable to locate any studies
that have developed the technology use model based on different e-government services. This
study was therefore conducted to examine the factors determining the citizens’ usage of
different e-government services in Malaysia.
1.3 Scope of the Study
Public service delivery through e-government involves demand (citizen) and supply
(government) to be successful. Previous studies have shown that each side can face obstacles
Page 22
5
and challenges that may impede the success of e-government (Ebrahim & Irani, 2005; Lam,
2005; Roushdy, 2012). Poor infrastructure that leads to a digital divide, limited finance, poor
data systems and capability, as well as a lack of skilled personnel have been identified as among
the barriers from the supply side (Heeks, 2006). On the demand side, most of the limitations
are related to issues of user satisfaction (Islam, Muhd Yusuf, Yusoff, & Johari, 2012),
perceived risk and trust (Alomari, Sandhu, & Woods, 2010; Carter & Bélanger, 2005) and lack
of awareness (Mahbob et al., 2011).
This study focuses on understanding citizens’ differential usage of different e-government
services. For the purpose of this study, technology adoption by a citizen is defined as the use
of the particular technology that supports the process of using public services (Yavuz, 2010).
Meanwhile, technology is defined as any Internet-based service (either on computer or mobile
phone) that can be used to interact with the government. The United Nations (2008) identifies
five stages of the e-government maturity index. These stages include (i) emerging, (ii)
enhanced, (iii) interactive, (iv) transaction, and (v) connected. The first stage is a basic form of
e-government that provides information on official government websites. The government
agencies provide policies that relate to the public-government engagement on the second stage.
The third stage involves two-way communication where citizens communicate electronically,
for example, with the valid user ID. Through a portal, the citizens can make a request and check
their traffic fines. At this stage, the government agency also provides downloadable forms to
obtain information concerning the citizens’ needs. In the fourth stage, both citizens and
government are involved in online transactions. In the last stage, different levels of government
agencies are connected and integrated through a single website or an e-government portal.
However, in order to explain the different models of e-government implementation, the current
model presents five phases in the growth of e-government, namely web presence, one-way
interaction, two-way interaction, transaction, and service integration (Al-Nuaim, 2011).
Based on Al-Nuaim’s model, the two-way interaction and the transaction phases were chosen
to examine the different usage of e-government by the citizens. Thus, the level of e-government
involved in this study refers to the interactive (information) and transaction (payment) services.
The study involved studying these two service modes in three service areas. Two of the service
area were offered by the federal government (income tax and traffic fines), and the third service
(property tax) was offered by the local authorities. As the objective of this study was to identify
the key factors associated with citizens’ different use of e-government services, the main
Page 23
6
criterion was that the respondents were currently using or had used any e-government services
in the last two years. Therefore, the people who had not used any e-government services were
excluded.
1.4 Research Objectives
The study empirically tested the factors determining e-government usage on different types of
services in Malaysia. In this study, possible factors that drove e-government usage were
initially derived from the UTAUT model. These factors were then expanded to include several
factors widely discussed in the technology adoption literature, based on a scoping study.
More specifically, the research objectives were as follows:
1. To examine the key factors that influence citizens’ use of different types of e-
government services (i.e., income tax, property tax, and traffic fine).
2. To extend the understanding of the factors that influenced the different use of e-
government level of services (information and payment).
Based on the objectives mentioned above, the following research questions were considered:
1. What are the factors associated with citizens’ usage of various e-government systems
(i.e., income tax, property tax, and traffic fines)?
2. What are the factors associated with citizens’ usage of different types e-government
process (i.e., information versus payment)?
1.5 Contribution of the Study
This study is significant in terms of its contribution to the theoretical and practical perspectives.
At the heart of this research is a model that seek to understand and predict e-government use
by the citizens, UTAUT. Many scholars agree that the existing theories on technology adoption
have successfully contributed to the understanding on e-government use (Al-shafi &
Weerakkody, 2010; Lu, Huang, & Lo, 2010; West, 2004; Yaghoubi, Kord, & Shakeri, 2010).
However, typically these models only deal with predictions of a single e-government service
and do not compare different systems, and thus do explain the variations of usage in e-
government services (Al-shafi & Weerakkody, 2010; Hung et al., 2006; Rahman, Jamaludin,
Page 24
7
& Mahmud, 2011; Yu, 2012). To fill this gap, this study contributes to e-government literature
by addressing the drivers of citizens’ different usage of different e-government services. In
general, the findings of this study will shed light on the reasons citizens choose to use some e-
government services and not others. Additionally, by identifying the key elements associated
with the citizens’ usage on e-government services, such as Relative Advantage, Effort
Expectancy, Social Influence, Perceived Trust, and Perceived Risk, it can assist respective
government agencies as they solicit and operate the e-government services. Indeed, by
considering a wide range of types and levels of e-government services, the findings from this
study are expected to contribute to the existing literature on technology adoption.
In addition, the findings of this study will also have practical implications for e-government
design and deployment particularly for the Malaysian government. The study is likely to
identify the main determinants leading to users’ decisions making to adopting different e-
government services. As stated before, the adoption rate of e-government services in most
developing countries is very low. Thus, by identifying these main determinants, it could bring
out a new dimension in the e-government implementation. Most governments of the developing
countries have limited resources, and thus the success of e-government is a must for them to
ensure that these resources are allocated and spent wisely and needlessly wasted.
1.6 An Overview of E-government in Malaysia
The Internet was introduced in Malaysia in 1987 by the Institute Malaysia Microelectronic
Systems (MIMOS). With the National Information Technology Council (NITC), MIMOS is
responsible to ensure that the national ICT agenda can be implemented successfully (Salman,
2011). MIMOS plays major roles in the formulation and operation of the Malaysian ICT
initiative, which is to establish in the country the innovative use of ICT and to accelerate
Malaysia’s growth to become a developed nation by 2020. The Multimedia Super Corridor
(MSC) was launched in 1996 to ensure that this goal can be achieved. In general, the
implementation of MSC is divided into three phases from 1996 to 2020.
In the first phase (1996–2003), MSC was successfully created, and it focused on attracting a
core group of world-class companies. As a result, five cyber-cities were developed with more
than 1,000 companies and 22,000 jobs created with a total worth of RM6 billion, and seven
flagship MSC applications were also launched. These applications were Electronic
Government, Multipurpose Smart Card, Smart School, Telehealth, R&D group, e-business,
Page 25
8
and Technopreneur Development. In the second phase (2004–2010), MSC focused on
government agencies being more interactive, enhancing local ICT industry, increasing the use
and adoption of innovative domestic ICT products and services, as well as giving priority to at
least four or five intelligent cities that will be linked to the cities around the world. In the third
phase (2011–2020), it is expected that there will be 12 intelligent cities that will be linked to
the global information superhighway. The public will be transformed into a knowledge-based
society, and Cybercourt Justice will be established.
In the 1980’s, the Malaysian government introduced a public-sector reform to improve its
efficiency and effectiveness. Consequently, the use of ICT in the public sector in Malaysia has
grown rapidly. According to Moon and Norris (2005), the reform of public services has become
synonymous with the Internet. As a result, many local authorities have seen this scenario as a
part of the new wave in the public-sector reform (Lapsley & Pallot, 2000). Initiatives including
Privatisation, Total Quality Management, Malaysia Incorporated, Customer Charter, ISO 9000
Quality Management Standard, and Online Service have substantially increased the public
sector in Malaysia in terms of the quality of services. Public sector reform in Malaysia has been
influenced by American and European practices (Hazman Shah & Kaliannan, 2008).
The path towards Vision 2020 and developed nation status by 2020 has been demonstrated in
the five-year Malaysia Plan and the ten-year Perspective Plan (OPP). Economic development
is seen as the main catalyst in determining the success of Vision 2020. Therefore, the
government aims to use ICT as the key factor to maximise the capabilities of the public sector.
The government has also launched the Public Sector ICT Strategic Plan to ensure that the ICT
initiatives taken will be in line with the Public Sector ICT Vision. For this purpose, the
government has introduced various several of ICT plans such as those found in the Eighth
Malaysia Plan (2001–2005), Knowledge-based Economy Master Plan (2002–2010), Public
Sector ICT Master Plan (2003), and the Ninth Malaysia Plan (2006–2010) (Abdullah Hazman
& Kaliannan, 2008).
The vision of the Malaysian government is to build e-government initiatives to serve the
citizens better and to lead towards the new knowledge-based economy. The vision focuses on
delivering services from government to citizens and enabling the government to become more
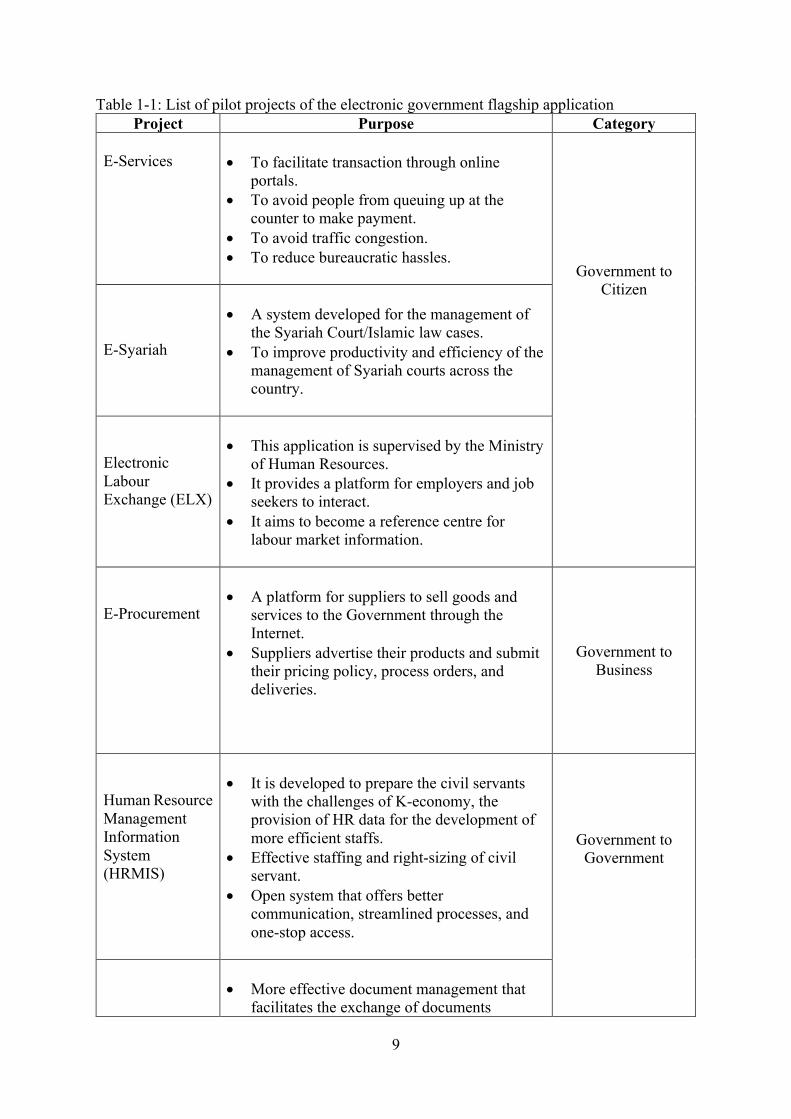
efficient in serving the public needs. There are seven pilot projects of the Electronic
Government Flagship Application as presented in Table 2-6.
Page 26
9
Table 1-1: List of pilot projects of the electronic government flagship application Project Purpose Category
E-Services
• To facilitate transaction through online
portals. • To avoid people from queuing up at the
counter to make payment. • To avoid traffic congestion. • To reduce bureaucratic hassles.
Government to Citizen
E-Syariah
• A system developed for the management of
the Syariah Court/Islamic law cases. • To improve productivity and efficiency of the
management of Syariah courts across the country.
Electronic Labour Exchange (ELX)
• This application is supervised by the Ministry
of Human Resources. • It provides a platform for employers and job
seekers to interact. • It aims to become a reference centre for
labour market information.
E-Procurement
• A platform for suppliers to sell goods and
services to the Government through the Internet.
• Suppliers advertise their products and submit their pricing policy, process orders, and deliveries.
Government to Business
Human Resource Management Information System (HRMIS)
• It is developed to prepare the civil servants
with the challenges of K-economy, the provision of HR data for the development of more efficient staffs.
• Effective staffing and right-sizing of civil servant.
• Open system that offers better communication, streamlined processes, and one-stop access.
Government to
Government
• More effective document management that
facilitates the exchange of documents
Page 27
10
Generic Office Environment (GOE)
between public agencies, with emphasis on secure and traceable documents.
• It is completely web-based and has been developed according to government requests.
Project Monitoring System
• Online system that controls the entire
progress of national programmes/projects. • The government will monitor the
implementation of the project for approval of implementation, mid-term review, and completion.
• As a platform to exchange ideas and to demonstrate the best practice models in project implementation.
Source: Malaysian Administrative Modernisation and Management Planning Unit (1997)
1.7 Thesis Outline
This thesis is organised into six chapters. Chapter 1 begins with the background and the scope
of the research. The problem statements of the study are then presented. It was followed by the
objectives and research questions of the study. Finally, the contributions of the research are
then explained.
Chapter 2 provides the literature review. It first discusses the conceptualisation of e-
government usage. At the heart of this body of research is a conceptual model that seeks to
understand the citizens’ use of e-government services. From the extant literature, several
variables are also identified as possible predictors of e-government services in Malaysia. The
actual usage of e-government service is considered to be the dependent variable, while other
factors identified are deemed as the independent variables. The chapter ends with an initial
conceptual framework for the study.
In Chapter 3, the research design is discussed. The study involved two stages: a scoping study
and a survey. In order to better understand the context of how Malaysian citizens determine
their use of different types of e-government services, a scoping study was undertaken. The
purposes of the scoping study were to get a clear picture of the issues under investigation and
to assess if the current issues covered in the literature about usage and non-usage of e-
government services were adequately addressed in the Malaysian context. Interviews were
conducted with twelve participants who had recently used any e-government services. The
findings were taken in the second stage, and the regression analysis was used for testing the
Page 28
11
proposed predictors. The chapter also presents the ethical consideration of both of data
collection procedures.
In Chapter 4, the results of the scoping study are outlined and discussed. A template analysis
was employed to analyse the interview data. This technique was used because it provided a
way to manage unorganised data for discovering the themes in the data and to show potential
matching up of participants’ views. Based on the results of the scoping study, the constructs
from the UTAUT model that were consistent with the interview are reported in this chapter.
This discussion was followed by reporting new constructs identified, namely Perceived Risk
and Perceived Trust. Also, the findings were then used to revise the conceptual model and then
used to generate the survey instruments in the second stage.
In Chapter 5, the revised model was then tested and validated by using a statistical analysis of
responses from the online survey. The statistical analysis was conducted using multivariate
regression analysis to identify the major factors associated with the outcome variables for all
six e-services. The chapter ends with an overview of the survey results, and all the research
questions and hypotheses were addressed.
Lastly, discussion of the findings is provided in Chapter 6. The empirical and practical
contributions are presented. The chapter also highlights the limitations of this study. The
guidelines for the future study are also provided in this final chapter.
1.8 Chapter Summary
This chapter has outlined the foundation for this study. First, it explained the background of
the study. The problem statement and scope of the study were then presented. The research
objective and questions are clearly identified. The potential contribution to the theoretical and
practical perspectives were addressed, and the thesis outline was described briefly. Next
chapter presents the existing literature review in order to understand the drivers that influence
citizen’s use of different e-government services.
Page 29
12
Chapter 2 : Literature Review
2.1 Introduction
The present study examined the factors that influence an individual’s use of different e-
government services. Therefore, it is necessary to understand the concept and context of e-
government, how the government operates, and the reaction of the citizens towards the delivery
of the services.
This chapter is divided into twelve main sections. The first section provides a definition of e-
government and it was followed by an overview of the e-government concept and the context
of e-government. This is followed by an overview of the maturity of e-government services.
Section 2.5 discusses the conceptual models of technology adoption. This section explains the
models that are widely used by the studies in the information system field. Section 2.6
elaborates the variables that are frequently used in previous studies. The studies applying the
UTAUT model are discussed in Section 2.7. Section 2.8 presents the previous e-government
studies conducted in Malaysia. This section discusses the underpinning models and constructs
that are regularly used to explain technology adoption in Malaysia. The following section
elaborates e-government practice in Malaysia. Finally, the last section summarises the chapter.
2.2 Definition of E-government
A research on electronic government, or simply “e-government”, is still relatively new and thus
the term “electronic government” is sometimes confusing. According to Bhatnagar (2004),
there is no one commonly accepted definition for the term. However, it could be said that the
definitions vary depending on the perspective of the person who defines the term. In general,
the term e-government can be defined as follows:
• The use of electronic information and communication technologies (ICTs) by the
government to support government operations, to transform relations with citizens, to
provide services to businesses, and to upgrade government operations within
government agencies (Carter & Belanger, 2005); or
Page 30
13
• The interaction with citizens using multiple channels2 of electronic information
technology (IT) tools to allow the public to get easy access to the government agencies
(World Bank, 2009); or
• The use of technology by government agencies to build a network structure for
electronic service delivery where efficiency and transparency could be priority (Yildiz,
2007).
More broadly, e-government is also seen as a technology that allows the government agencies
to share data and decision making. This technology challenges traditional approaches in service
delivery and the role of government (Chadwick & May, 2003). In a similar manner, e-
government initiatives all over the world endeavour to integrate information and
communication technologies to transform the delivery of government services to their
stakeholders, citizens, and intergovernmental agencies by improving the quality of services,
accountability, and efficiency.
Although there are various definitions of e-government, for the purposes of this study, the term
“e-government” refers to the delivery of government services via the Internet, in an effort to
improve the interaction between government and citizens.
2.3 Types of E-government
The type of e-government is determined by the actors that are involved in relation to the
government. Three main categories are identified in the literature, namely Government to
Citizen (G2C), Government to Government (G2G), and Government to Business (G2B).
G2C involves the ability of government and citizen to communicate efficiently using electronic
methods. G2C invlove putting government services online (Alateyah et al., 2012), so they can
be quickly accessed and payments made fast (Chang, Wang, & Yang, 2009). Citizens can also
be informed about government laws, regulations, policies, and services faster (Kardaras &
Papathanassiou, 2008). One of the design aims of G2C is to facilitate citizens’ interactions with
the government via a one-stop centre where all the government websites can be accessed
2 The term “channel” refers to the medium that the citizens use to interact with the government, such as
the Internet, phone call, and physical facilities (counter).
Page 31
14
through a central website or portal. A study on one of the Malaysian e-government flagships
involved citizens from various demographics, and showed the government portal was
perceived as a useful one-stop centre (Yahya, Nadzar, & Abd Rahman, 2011). Similarly,
www.gobenefits.gov, which is an American single-point government website, was found to be
successful in facilitating the procedure for driving licence renewals for the citizens (Pizzella,
2005). G2C initiatives have been linked with several facilities such as driving licence renewals,
tax payments, paying for parking tickets, job applications, paying taxes, paying traffic fines,
health and hospital information, provision of extensive information on education, security, and
interaction with elected members.
G2B is about the interaction between the government and the business community in a web
environment. G2B applications relate to registering business, renewing licences, downloading
application forms, transactions online, and paying taxes and e-procurement. This interaction
allows governments to purchase items and to pay invoices in a simple way and helps the
government to conduct a business with private agencies (Evans & Yen, 2006).
G2G refers to internal interaction between government agencies. The main objective of this
category is to integrate the collaboration and coordination among central, state, and local
governments and agencies. The interaction allows the government agencies to improve their
efficiency by eliminating redundancy and duplication of tasks. For example, an
intergovernmental collaboration among different governments in homeland security agencies
provides a quick response system when dealing with the crime scene (Evans & Yen, 2006).
The introduction of electronic government is also seen as a driver to improve the services that
involve the interactions among the government, citizens, and businesses. According to
Abdullah Hazman Shah and Kaliannan (2008), ICT is seen as a medium to improve the method
of service delivery. Simultaneously, it will improve information flows and processes within
the government agencies as well as to improve the quality of development, coordination, and
enforcement of policies.
Among the different types of e-government categories, the present study focused on the G2C
interactions. Citizens’ willingness to adopt e-government is considered the most influential
factor for the success of e-government implementation. A study by the UN Survey (2010)
showed the failure of e-government in most Southern Asian countries was caused by the low
adoption by citizens. Similarly, even though 72% of respondents were aware of the existence
of the Pakistan’s e-government web portal, most of the citizens chose face-to-face contact with
Page 32
15
the government to make transactions (Rehman, Esichaikul, & Kamal, 2012). Izatun (2008) also
reported the disappointing number of e-filing users after the e-government facility was
launched two years previously in Malaysia. Ambali (2009) asserted that despite an aggressive
campaign by the IRBM in promoting their e-filing service, the findings showed that the
government agencies needed to make sure the services were useful, easy, and friendly as well
as guaranteed the security of these services. These findings are similar to statistical reports on
low usage of e-government services, and they seem to be consistent with the findings by other
e-government research in developing countries (Alshawi & Alalwany, 2009; Mahbob, Nordin,
Salman, Sulaiman, & Abdullah, 2011). Therefore, as the aim of the present study was to
identify the main factors influencing an individual’s decision making towards using e-
government, this study provided important insights into the G2C interactions. In addition, the
present study also limited its scope to the information and transactional levels of services while
interacting with the government.
2.4 E-Government Maturity Models
There is a body of work that classifies the implementation of e-government into several stages
based on the level of sophistication or functionality of the e-government service (Layne & Lee,
2001; World Bank, 2009). However, there is no definite number of stages involved due to the
different approaches taken by researchers. For example, an enhanced stage is reported only by
the United Nations (2005) to explain the development of governmental services, while an e-
democracy stage is mentioned only by Siau and Long (2005) in their model.
The maturity models of e-government can be divided into two phases, before 2005 and after
2005 (Makoza, 2013). In the first phase, models developed only have four stages, whereas
those developed in the second phase have more than four stages. The maturity models have
been discussed by Gartner (2000) in his four-phase model. To measure the government’s
progress on e-government initiatives, the model involves a four-stage maturity model of e-
government defined as follows: �
1. The first stage is web presence. At this stage, the web site is static and used to provide
basic information to the citizen. �
2. The second stage is interaction. This stage features tools for an interaction with the
stakeholders, such as search engines, documents downloading, and emails. �
Page 33
16
3. The third stage is transaction. At this stage, the user can perform online transactions
completely, such for buying and selling purposes. �
4. The fourth stage is transformation. At this stage, the processes are integrated and
personalised. �
According to Layne and Lee (2001), there are four major stages of the e-government maturity
index, specifically (i) cataloguing, (ii) transaction, (iii) vertical integration, and (iv) horizontal
integration. In the early stages, the governments only set up their initial website with a limited
purpose (e.g., sharing the information). The second stage involves transaction activities where
both citizens and government engage in electronic transactions. The third stage is characterised
by integrations with different agencies in a government (i.e., federal, state, and local
authorities) whereas in stage four, the integrations occur internally in government agencies.
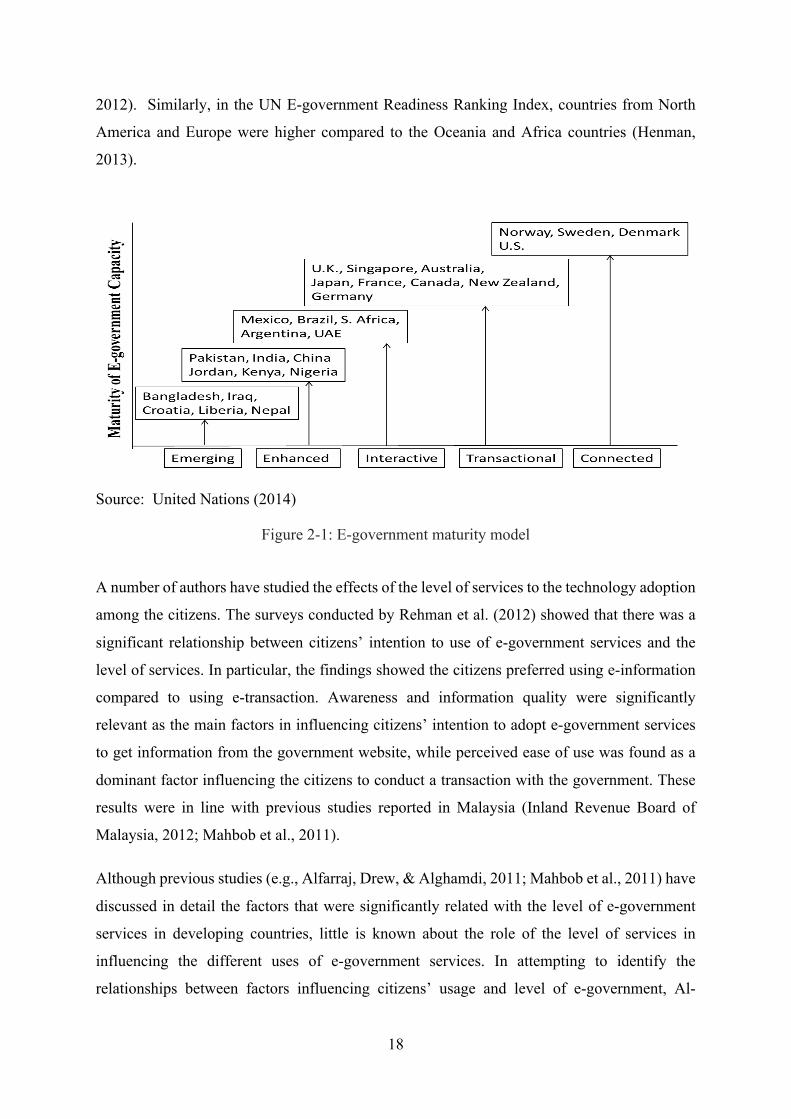
The United Nations (2014) identified five stages of the e-government maturity index. These
stages include (i) emerging, (ii) enhanced, (iii) interactive, (iv) transaction, and (v) connected.
The first stage is a basic form of e-government where the government provides information on
official government websites. In the second stage, the government enhance the service by
providing information on policies that are related to a public-government connection. The third
stage involves two-way communication where citizens communicate electronically, such as
making a simple request through emails. In this stage, the government also provides
downloadable forms as one of the initiatives to obtain information concerning the citizens’
needs. In the fourth stage, both the citizens and the government are involved in online
transactions. Income tax payment and driving licence renewals are among the examples of this
stage. At the last stage, different levels of government agencies are connected and integrated
through a single website or e-government portal. Another model is developed by Siau and Long
(2005), which has following the e-government development stages: web presence; interaction;
transaction; transformation; and e-democracy.
A recent study by Al-Nuaim (2011) highlighted five phases of e-government. The model is
based on the e-government services in the Saudi Arabia. The findings highlighted the serious
problems faced by the Saudi government in developing an e-government. The five stages of e-
government development are defined as follows:
1. The first stage is web presence. At this stage, information is published online. �
Page 34
17
2. The second stage is one-way interaction. At this stage, each service contains offline
services, such as offline forms and information services.
3. The third stage is two-way interaction. At this stage, many services are available online
such as online forms. The users can download and fill out the form online and submit
it to the respective authority.
4. The fourth stage is transaction. At this stage, the users can conduct secure transactions
like payments and tax filling.
5. The fifth stage is integration. At this stage, the services provided by different
government agencies are integrated.
Based on the maturity models, it can be concluded that the models mainly highlight three
common levels namely, presence, interaction, and transaction. Table 3 presents the grouping
of the maturity stages according to their focus.
Table 2-1: Summary of models for phases in e-government implementation Model Phase 1 Phase 2 Phase 3 Phase 4 Phase 5
Gartner’s Model (2000)
Web Presence
Interaction Transaction Transformation -
Layne and Lee (2001)
Catalogue Online
Transactional Vertical
Integration Horizontal -
The 5 Stage United Nations (2014)
Emerging Enhanced Presence
Interactive Transactional Inter-
governmental Network
Siau and Long (2005)
Web Presence
Interaction Transactional Transformation E-Democracy
Al-Nuaim (2011)
Web Presence
One-Way Interaction
Two-Way Interaction
Transactional Service
Integration
Based on the models, in general, most of the developed countries are in transaction or
connected stages, where Scandinavian countries such as Sweden and Norway are leading the
way in providing their citizens with the highest level of connected services (United Nations,
Page 35
18
2012). Similarly, in the UN E-government Readiness Ranking Index, countries from North
America and Europe were higher compared to the Oceania and Africa countries (Henman,
2013).
Source: United Nations (2014)
Figure 2-1: E-government maturity model
A number of authors have studied the effects of the level of services to the technology adoption
among the citizens. The surveys conducted by Rehman et al. (2012) showed that there was a
significant relationship between citizens’ intention to use of e-government services and the
level of services. In particular, the findings showed the citizens preferred using e-information
compared to using e-transaction. Awareness and information quality were significantly
relevant as the main factors in influencing citizens’ intention to adopt e-government services
to get information from the government website, while perceived ease of use was found as a
dominant factor influencing the citizens to conduct a transaction with the government. These
results were in line with previous studies reported in Malaysia (Inland Revenue Board of
Malaysia, 2012; Mahbob et al., 2011).
Although previous studies (e.g., Alfarraj, Drew, & Alghamdi, 2011; Mahbob et al., 2011) have
discussed in detail the factors that were significantly related with the level of e-government
services in developing countries, little is known about the role of the level of services in
influencing the different uses of e-government services. In attempting to identify the
relationships between factors influencing citizens’ usage and level of e-government, Al-
Page 36
19
Nuaim’s model was selected in the research framework. The model was chosen because it was
developed in a developing country, which is similar with the present study’s context. The
model was suitable to answer the objectives of the study. The current study also examined the
Malaysians’ usage of three government services namely income tax, property tax, and traffic
fines. For each of these three services, both information and transaction services were
examined. Two of the services, namely income tax and traffic fines, were offered by the federal
government, and property tax service was offered by the local authorities.
2.5 Conceptual Models of Technology Adoption
Most scholars have agreed that adoption of technology by users is a necessary condition for an
effective implementation of any information technology-related project (AlAwadhi & Morris,
2009; Hossan, Habib, & Kushchu, 2006; Lallmahomed, Lallmahomed, & Lallmahomed, 2017;
World Bank, 2002). Successful e-government service implementation requires the willingness
of the public to adopt the services (Shareef et al., 2010). Reviews of literature have been carried
out to explore the factors that influence the usage of e-government services (Alshehri, Drew,
& Alghamdi, 2012a; Roushdy, 2012; Wirtz & Kurtz, 2016; Zheng, 2017). For example, several
studies in middle eastern countries found that relative advantage, culture, trust of the
government, ease of use, perceive usefulness, peer’s review, and security issues to be factors
that need to be considered regarding e-government service implementation (Al-shafi &
Weerakkody, 2010; Al-sobhi, 2011; AlAwadhi & Morris, 2008; Alzahrani & Goodwin, 2012).
In seeking to understand user adoption on a technology such as e-government, there is a wide
variety of models used in previous studies. All the models seek to quantitatively explain the
various factors shaping user behaviour or intended use. For example, the Theory of Reasoned
Action (TRA) (Fishbein & Ajzen, 1975), the Theory of Planned Behaviour (TPB) (Ajzen,
1985), TAM (Davis, 1989), and UTAUT (Venkatesh et al., 2003) have been used to attempt to
identify and explain the factors that affect an individual’s use of IT. The following subsections
explain the various models of technology adoption.
2.5.1 Theory of Reasoned Action (TRA)
This is one of the earliest models used to explain and to predict a human behaviour in the social
psychology field. TRA was proposed by Fishbein and Ajzen (1975). The main assumption of
this theory is that individuals are in a rational or conscious control of their behaviour and
Page 37
20
perform actions based on the information that they have. This model explains the potential
benefits of predicting an individual’s intention to perform a behaviour based on attitude and
normative beliefs. An empirical test indicated that TRA model was identified as performing
better with a high variance explained compared to other models in terms of the significant
relationship between attitude and behavioural intention (Dwivedi et al., 2017). In summary,
TRA is an individual’s attitude that is influenced by a combination of subjective norms and
attitudes towards the performance of the behaviour to form their behavioural intention
(Fishbein & Ajzen, 1975). The theory can be explained by a model, as shown in Figure 2-2.
The major variables of TRA are attitude towards a behaviour (the degree to which personal
belief of the behaviour is positively or negatively valued), subjective norms (peer influence or
the social environment on behaviour), and behavioural intention as an outcome variable. In
general, this model is stated as “a predictive model for behaviour attitude and behavioural
intention” (Dajani & Yaseen, 2016: 3) and “one of the most fundamental and influential
theories of human behaviour” (Venkatesh, Morris, Davis, & Davis, 2003: 428).
Source: Fishbein and Ajzen (1975)
Figure 2-2: Theory of Reasoned Action
Even though the TRA model has been widely cited in the previous studies, several limitations
have been identified. As stated by Sheppard et al. (1988), in order to predict a specific
behaviour, attitude, and intention, citizens have to agree on the action. Thus, irrational
decisions or attitudes, or any behaviours that are not consciously considered, cannot be
explained by this theory. Thus, Ajzen (1985) proposed the Theory of Planned Behaviour (TPB)
to counter the issue of irrational behaviours emerging from the TRA model.
Attitude Towards Act or Behaviour
Behaviour Behavioural Intention
Subjective Norms
Page 38
21
2.5.2 Theory of Planned Behaviour (TPB)
TPB is an extension of TRA that explains and predicts a variety of intentions and behaviours.
Ajzen (1991) empirically demonstrated TPB was more applicable than TRA, with a clear
theoretical framework to understand and predict an individual’s behaviour particularly in
technology adoption. In fact, the TPB differs from the TRA by introducing the perceived
behavioural control (PBC) component (Ajzen, 1991). PBC is held to influence both intention
and behaviour that will influence the behaviour directly or interactively. The TPB suggests that
behaviour can be explained by behavioural intention, which is influenced by attitude,
subjective norms, and perceived behavioural control (Ajzen, 1991). The studies based on the
TPB model have been widely employed in various contexts such as user’s behaviour towards
e-services (Lu et al., 2010), continual behaviour towards smart parking (Kianpisheh, Mustaffa,
Mei Yean See, & Keikhosrokiani, 2011) and electronic commerce (Yaghoubi et al., 2010).
Moreover, a meta-analysis study that investigated the applicability of the model to the e-
government research indicated that the TPB model was more established compared to other IS
acceptance theories (Rana, Dwivedi, & Williams, 2013). The difference as TPB focuses on
perceived behavioural control that influences both intention and behaviour (see Figure 2-4).
Perceived behavioural control (PCB) is an individual’s perception as to whether they believe
they can perform a particular behaviour or not (Ajzen, 1991). For example, in the context of e-
government services, PCB is defined as whether or not an individual believes they could use
the e-government service to successfully participate and engage in an interaction with the
government.
Page 39
22
Source: Ajzen (1991) Figure 2-3: Theory of Planned Behaviour
Ajzen (1991) asserted that PCB was purposely introduced into TPB to compensate for the
volitional control limitation of TRA. However, Taylor and Todd (1995) criticised the model,
stating that it is assumed that for an individual to successfully perform some behaviour, they
are required to have opportunities, motivation, and resources. Furthermore, the introduction of
PCB as an answer to all non-controllable elements of behaviour such as fear, anxiety, threat,
or past experience is not well explained by actual control (Ajzen, 2006). Due to the complexity
of e-government and the diversity of the adopters (Eagly & Chaiken, 2002), TPB should
account for other factors that will influence behavioural intention (Yaghoubi et al., 2010).
2.5.3 Technology Acceptance Model (TAM)
TAM model is the most utilised model in the IS literature (Carter & Weerakkody, 2008; Ozkan
& Kanat, 2011; Warkentin et al., 2002). Davis (1989) introduced TAM as an extension to the
TRA model to explain the determinants that will influence an individual’s acceptance towards
a technology. TAM is similar to TRA, except for attitude, which is not included (Oye, Lahad,
& Ab. Rahim, 2012). TAM replaces TRA constructs with two technology acceptance measures
namely PU and PEOU. In the domain of Information Systems Research, TAM is the most
widely used model, followed by TRA and TPB (Lai, Lai, & Jordan, 2009). TAM posits that
Attitude Towards Behaviour
Intention to Use
Usage Behaviour
Subjective Norms
Perceived Behavioural
Control
Page 40
23
PU is influenced by PEOU; the easier is a technology is perceived to use, the more useful it.
Figure 2-3 demonstrates the TAM model.
Source: Davis (1989)
Figure 2-4: Technology Acceptance Model
In general, PU refers to the degree to which an individual believes that technology would
improve his or her job performance, and PEOU indicates the degree to which an individual
believes that using technology would be free from effort (Davis, 1989; Gefen, Karahanna, &
Straub, 2003). Researchers have employed the TAM model in various ways in e-government
research (Gefen et al., 2003; Lu et al., 2010; Moon & Kim, 2001; Warkentin et al., 2002). For
example, Phang, Li, Sutanto, and Kankanhalli (2005) conducted a study that involved senior
Chinese citizens as the respondents. They proposed the TAM model as the fundamental theory
for the study. The findings showed PEOU and Internet security had a huge influence on
technology adoption among the senior citizens in China.
In the last two decades, TAM has reached a remarkable accomplishment and is widely cited
with more than 1,000 citations (Venkatesh, Thong, Chan, Hu, & Brown, 2011). Bagozzi (2007)
stated that the model is “reaching the status of paradigm.” However, the TAM model has been
reported as having several limitations. First, TAM has been criticised for its low and limited
predictive power (Younghwa Lee, Kozar, & Larsen, 2003). Low variance explanations have
been cited as a major problem in TAM studies. Gefen, Karahanna, and Straub (2003) reported
its predictive power to be only 25%, while Venkatesh et al. (2003) reported 30–40%. As a
Perceived Usefulness
Usage Behaviour Intention to use
Perceived Ease of
Use
Page 41
24
consequence, the low explanatory power of TAM contributes to the low descriptive richness
and leads researchers to draw simple conclusions (Plouffe, Julland, & Vandenbosch, 2001).
Although the TAM model shows comprehensiveness in explains the relationship between
constructs and user behaviour, the low explanatory power inherent in the model has led to
inconsistent results.
The second shortcoming of TAM is the inconsistent relationship among the variables. Sun and
Zhang (2006) claimed the inconsistent results had made researchers question the
generalisability of this model across different contexts. Furthermore, Sun and Zhang (2006)
agreed moderating factors may be introduced to explain this inconsistency. Previous studies
also urge the inclusion of some moderating factors such as gender, education, job, experience,
age and voluntariness of use (Akram & Malik, 2012; Venkatesh et al., 2003). Srite (2006)
indicates there are external variables that influence technology adoption, variables which are
missing in TAM and lead to inconclusive results.
The third shortcoming of TAM model is related to the type of respondent. Some studies used
university students as their respondents (Gefen et al., 2003; Lee, Kozar, & Larsen, 2003), and
the use of this type of respondents will deteriorate the generalisability of the findings.
Furthermore, using students as subjects is inappropriate to reflect the real working environment
(Lee et al., 2003). Thus, this present study targeted the actual users as the respondents to help
improve the generalisability of the findings.
Finally, even though the behavioural usage is stated as among the predictors, most of previous
studies that used TAM model were merely focused on or measured a behavioural intention.
Therefore, the accuracy of the TAM model in predicting the citizens’ actual usage behavioural
on technology adoption is questioned (Dajani & Yaseen, 2016).
2.5.4 Diffusion of Innovations (DOI)
Another popular model on technology adoption is Diffusion of Innovation (DOI) developed by
Rogers (1995). This theory seeks to explain adoption of an innovation over time. DOI classifies
five groups of adopters namely innovators, early adopters, early majority, late majority, and
laggards (Rogers, 1995). A considerable number of IS research on technology adoption works
were performed using this model (Hussein, Mohamed, Rahman Ahlan, & Mahmud, 2011;
Lean et al., 2009; Rana et al., 2013). Most of these studies agreed that if the citizens perceived
Page 42
25
that the technology was consistent on its benefit, they would be more certain about the expected
benefits of the technology (Lean et al., 2009). DOI consists of four factors that have positive
impacts to the technology adoption, namely Relative Advantage (the degree to which an
innovation is perceived as better than the idea it supersedes), Compatibility (the degree to
which an innovation is perceived as consistent with the existing values, past experiences, and
needs of potential adopter), Trialability (the degree to which an idea can be experimented with
on a limited basis), and Observability (the degree to which the results of an innovation are
visible). There is also one negative impact on the adoption of innovations namely Complexity
(the degree to which an innovation is seen by the potential adopter as being relatively difficult
to use and understand) (Rogers, 1995).
Like other models, DOI has been widely used and integrated into other models to investigate
the factors that influence the citizens’ adoption in technology (Carter & Bélanger, 2005; Lean
et al., 2009). Lean et al. (2009) integrated the TAM and DOI models as a framework to
investigate the factors leading to the citizens’ intention to use technology. They included only
Relative Advantage and Complexity in their research model as both constructs were
significantly associated with behavioural intention towards e-government use. The Complexity
construct in the DOI model is often considered to be like that of PEOU in the TAM model
(Holden & Karsh, 2010) and effort expectancy in the UTAUT model (Venkatesh et al., 2003).
Therefore, based on this argument, they included only Relative Advantage and compatibility
in their research model. Sang, Lee, and Lee (2010) also claimed Complexity in DOI and PEOU
in TAM were similar, thus their study only included Relative Advantage and Compatibility,
while DOI theory was taken as their fundamental theory.
2.5.5 Unified Theory of Acceptance and Use of Technology (UTAUT)
Venkatesh et al. (2003) created the UTAUT model to present a more complete picture of the
acceptance towards technology compared to the previous models. UTAUT emerges from eight
previous models, which have been discussed frequently in the Information Systems Research
literature. Several authors have asserted that the UTAUT model is suitable, valid, and reliable
in understanding on user adoption on e-government (Kurfali, Arifoğlu, Tokdemir, & Paçin,
2017; Taiwo, Mahmood, & Downe, 2012). Although most of the previous studies used and
integrated the TAM, TRA, and TPB models to explain technology acceptance among people,
none of these models is better than the UTAUT model in terms of explanatory power. In
Page 43
26
particular, the UTAUT model, as explained by Venkatesh et al. (2003), has an explanatory
power of almost 70% to predict the technology adoption.
Source: Venkatesh et al. (2003)
Figure 2-5: Unified Theory of Acceptance and Use of Technology
As shown in Figure 2-5, the UTAUT model contains four key constructs: Performance
Expectancy (the degree to which a user believes that using the e-government service will help
them attain gains in job performance); Effort Expectancy (the degree of how ease a user
perceives the e-government services); Social Influence (the degree to which a person perceives
their important others believe they should use e-government services); and Facilitating
Conditions (the degree to which organisational or technical infrastructures exist to support the
use of the e-government services). These are held to effect to the behavioural intention that
leads to the actual use behaviour (Venkatesh et al., 2003). These predictors contain a number
of similarities with other theories, as shown in Table 2-2 where similar ideas are on each row.
Even though this model has a high explanatory power, it also has several shortcomings in terms
of missing factors. According to Bagozzi (2007), the UTAUT model is a well-established
theory to explain the acceptance of technology, but the model has also left out several important
independent variables such as perceived trust on technology, perceived risk, and quality. An
empirical review of the literature has found that the citizens’ decision to use or not to use e-
government services is influenced by several factors that are excluded in the UTAUT model
Page 44
27
(AlAwadhi & Morris, 2008; Rana, Dwivedi, & Williams, 2015; Rana, Williams, Dwivedi, &
Williams, 2012).
Page 45
28
Table 2-2: Definition and root construct of the UTAUT model TRA
(Fishbein & Ajzen, 1975)
TAM (Davis, 1989)
TPB (Ajzen, 1991)
DOI (Rogers, 1995)
UTAUT (Venkatesh et al., 2003)
Perceived Usefulness: The degree to which using a specific application will increase a user’s job performance within an organisational context (Davis, 1995: 985)
Relative Advantage: The degree to which an innovation is perceived as better than the idea it supersedes (Rogers, 1995: 15)
Performance Expectancy: The degree to which an individual believes that using the system will help user to attain gains in job performance (Venkatesh et al., 2003: 447)
Perceived Ease of Use: The degree to which the user expects the target system to be free of effort (Davis, 1995: 985)
Complexity: The degree to which an innovation is perceived as difficult to understand and use (Rogers, 1995: 16)
Effort Expectancy: The degree of ease associated with the use of the system (Venkatesh et al., 2003: 450)
Attitude: An individual’s positive or negative feelings of performing the target behaviour (Fishbein & Ajzen, 197: 216)
Attitude: Same like TRA and TPB in the original TAM, but later dropped.
Attitude: Same like TRA
Trialability: The degree to which an innovation may be experimented with on a limited basis (Rogers, 1995: 16
Page 46
29
Subjective Norm: The person’s perception that most people who are important to him think he or she should or should not perform the behaviour in question (Fishbein & Ajzen, 197: 216)
Subjective Norm: Same like TRA
Observability: The degree to which the results of an innovation are visible to others (Rogers, 1995: 16)
Social Influence: The degree to which an individual perceives that important others believe he or she should use the system (Venkatesh et al., 2003: 451)
Perceived Behavioural Control: Reflects beliefs regarding access to the resources and opportunities to perform a behaviour that may impede performance of the behaviour (Ajzen, 1991: 34)
Compatibility: An innovation is perceived as being consistent with the values, past experiences, and needs of potential adopters (Rogers, 1995: 16)
Facilitating Conditions: The degree to which an individual believes that an organisational and technical infrastructure exists to support the use of the system (Venkatesh et al., 2003: 453)
Behavioural Intention: The strength of an individual’s intention
Behavioural Intention to Use: Same like Behavioural Intention in TRA and TPB
Behavioural Intention: Same like TRA
Page 47
30
to perform a specified behaviour. Use Behaviour: Measures
users’ actual frequencies of technology use.
Source: Adopted from Srite (2006)
Page 48
31
2.6 Variables in Models of Use
In general, every model comprises several predictors to explain the outcome variables. Some
models explain the relationship between predictors and outcome variables with mediator and
moderator variables. For example, TAM highlights the role of intention to use as a mediator to
influence the relationship between predictors and outcome, which is actual use. Table 2-3
summarises the predictors, outcomes, mediators, and moderators of selected technology
adoption models.
Table 2-3: List of constructs in the technology adoption model Model Predictors Moderators Mediators Outcomes
TRA
Attitude, Subjective Norm
- -
Behavioural Intention
TAM
Perceived Usefulness, Perceived Ease of Use, Attitude
-
Intention to Use
Use Behaviour
TPB
Attitude, Subjective Norm, Perceived Behavioural Control
- -
Behavioural Intention
DOI
Relative Advantage, Compatibility, Complexity, Trialibility, Observability
- -
Behavioural Intention
UTAUT
Performance Expectancy, Effort Expectancy, Social Influence, Facilitating Conditions
Gender, Age, Experience, Voluntariness
Behavioural Intention
Use Behaviour
Page 49
32
Besides the higher explanatory power compared to other models, the decision to use the
UTAUT as the base model was based on the claim by AlAwadhi and Morris (2009) that the
UTAUT model provides a more complete picture of the acceptance and use of technology than
any models, particularly in the developing country (Kurfal, Arifoğlu, Tokdemir, & Paçin,
2017). Based on the explanation on technology adoption models in Section 2.5, this study used
three constructs (Performance Expectancy, Effort Expectancy, and Social Influence) in the
UTAUT model to examine the relationship between predictors and actual use behaviour on e-
government services. As the study examined the factors influencing the citizens’ use behaviour
on technology (G2C), Facilitating Conditions were dropped as the variable was only suitable
in an organisational setting that deals with the technical and software assistance (Yahya et al.,
2011). In addition, the moderator namely voluntariness of use was also dropped as this study
only focused on registered users of income tax online service (e-filing) who had used any e-
government services in the past two years. This approach was in line with previous studies
where the authors claimed that e-government services were offered in voluntary (AlAwadhi &
Morris, 2009) and as a registered users for particular e-services (e.g. e-filing), the voluntariness
of use is not significant (Al-Gahtani, Hubona, & Wang, 2007). However, as this present study
also investigated the user’s behaviour on local authority property tax services (e-assessment
and e-payment), the type of local authority was added.
2.7 E-government Research Applying the UTAUT Model
A number of studies have investigated the adoption of e-government services using the
UTAUT model. This model has been cited in wide areas of studies such as tax payment, e-
learning, and mobile technology, focusing on variety of user groups (for instance students,
general users, and government servants). The academic journal database Thomson Scientific
Web of Science showed a total of 870 citations to the UTAUT model. In addition, the model
was cited almost 5,000 times since it was introduced in 2003 (Williams, Nripendra, & Dwivedi,
2015).
In seeking to understand the factors affecting the adoption of e-government by citizens, a
review of extant literature indicated several critical factors (Table 2-4). For example, a survey
was conducted on 249 students in Kuwait to examine the factors influencing citizens’ adoption
on e-government services (AlAwadhi & Morris, 2009). The findings showed that Performance
Expectancy, Social Influence, and effortlessness of the e-services were significantly correlated
with an increase of usage. Similar results were also found when the UTAUT model was taken
Page 50
33
as a fundamental framework to investigate the factors driving citizens to use e-government
services in Iraq (Faaeq, Alqasa, & Al-Matari, 2015).
The adoption of e-government services among the citizens in the UAE (AL-Athmay, Fantazy,
& Kumar, 2016) focused on the role of the quality of the website in influencing the adoption
of e-government portal. The findings revealed that all the UTAUT constructs except the Social
Influence had a significant effect towards the citizens’ usage. In addition, the study also found
when the quality of the government portal website was high, usage numbers increased.
Lallmahomed, Lallmahomed, and Lallmahomed (2017) investigated the factors leading to the
use of eGov service in Mauritius. The cross-sectional survey involving 247 citizens showed
that Performance Expectancy and Perceived Value were positively related to Behavioural
Intention. In addition, trust and computer self-efficacy had a significant relationship with the
Behavioural Intention towards using e-government services.
Although UTAUT has been cited by a large of number of studies, a meta-analysis study by
Williams et al. (2011) found that research that used UTAUT model were driven by many
external variables. The finding showed out of 43, only 16 studies that used the UTAUT model
as a guiding theory fully utilised the original constructs. As mentioned by Venkatesh, Morris,
Davis, and Davis (2003: 471), “it is possible that we may be approaching the practical limits
of our ability to explain individual acceptance and usage decisions in organizations.” Hence,
many scholars have integrated or modified the original UTAUT model with other acceptance
models or constructs. According to Alzahrani and Goodwin (2012) and Rahman, Jamaludin,
and Mahmud (2011), an integrated model is necessary to suit the particular context of the study.
Alzahrani and Goodwin (2012) did some modification and revision on the UTAUT model to
suit with the local culture to gain a better understanding of e-government acceptance in Saudi
Arabia. They suggested that trust and privacy should be included as additional factors in the
UTAUT model particularly to explain the factors influencing technology adoption in
developing countries. In addition, the authors also claimed that the original constructs
developed from the UTAUT model may not suit all circumstances, and this shortcoming will
lead to further research. Furthermore, from the critical review on previous research that applied
the UTAUT model and discussed the capabilities of the UTAUT model in developing countries
(Dwivedi et al., 2017; Faaeq et al., 2015; Lean et al., 2009; Rana & Dwivedi, 2015; Rana et
al., 2013), the researcher believed that the UTAUT model would be the best base model to be
adopted for this study in order to explore and investigate the UTAUT constructs and additional
Page 51
34
factors affecting the acceptance of e-government services in a developing country such as
Malaysia.
The relationships among Trust in the Internet, Trust in the Government, and Perceived Security
have also been examined in previous studies. Some studies (e.g., Hung, Chang, & Yu, 2006;
Kumar et al., 2007) integrated Trust and Security Concerns with other technology acceptance
theories to explain the factors influencing an individual’s usage of e-government services.
Failure to reassure the citizens’ privacy and security in government portals, information, and
other aspects of e-government will not result in the full use of electronic services (Carter &
Belanger, 2008). Lack of confidence in the government’s capability to implement e-
government services may cause a lack of support from the citizens (Maniam & Halimah, 2010;
Sin, 2009).
Previous Information Systems Research has identified that service quality can be a key term
for determining the success of electronic services (e.g., Petter, DeLone, & McLean, 2008;
Zeithaml, Berry, & Parasuraman, 1996). Thus, it is important to examine the quality of e-
services in order to increase people’s adoption of e-government services. Several studies have
shown that interactive government websites promote openness and lead to better service
delivery and citizen participation with government. The studies also show the quality of the
government website was significantly related to user satisfaction, and therefore will determine
whether users would continuously use the website. As stated by Rotchanakitumnuai (2008),
the dimensions of the quality of e-services are different from that of traditional services in
which the user interface and web designs are absent in the traditional services. Table 2-4
presents the lists of the variables that have modified UTAUT original construct and use of other
constructs in additional the UTAUT.
Table 2-4: Summary of variables used in the UTAUT research Determinants The Sub
determinants Authors
UTAUT Constructs Performance Expectancy
Perceived Usefulness/ Job-Fit/ Relative Advantage
(AlAwadhi & Morris, 2008; M. E. Alzahrani & Goodwin, 2012; Bhatiasevi, 2015; Chiemeke & Evwiekpaefe, 2011; Lallmahomed et al., 2017; Orji, Cetin, & Ozkan, 2010; Williams et al., 2015)
Page 52
35
Effort Expectancy
Perceived Ease of Use/ Complexity
(Bhatiasevi, 2015; Israel & Tiwari, 2011; Kurfali et al., 2017; Bhatiasevi, 2015; Chiemeke & Evwiekpaefe, 2011; Lallmahomed et al., 2017; Orji, Cetin, & Ozkan, 2010; Williams et al., 2015)
Facilitating Conditions
Perceived Behavioural Controls/ Facilitating Conditions/ Compatibility
(Alzahrani & Goodwin, 2012; Mahbob et al., 2011; Mohd Suki & Mohd Suki, 2017; Mohd Suki & Ramayah, 2010)
Social Influence
Subjective norms/ Social factors/ Image
(Al-shafi & Weerakkody, 2010; AlAwadhi & Morris, 2009; Hassan & Palil, 2012; Lean et al., 2009; Taiwo et al., 2012)
External constructs Self-efficacy
Awareness
(Al-shafi & Weerakkody, 2010; Ambali, 2009; Teck Hong & Yin-Fah, 2012)
Perception on benefits
(AlAwadhi & Morris, 2008; Mahbob et al., 2011; Ramayah, Ramoo, & Ibrahim, 2008)
Motivation
(Thompson, Vivien, & Raye, 1999)
Trustworthiness
Trust in government
(Alsaghier et al., 2009; Khattab, Al-Shalabi, Al-Rawad, Al-Khattab, & Hamad, 2015; Kurfali et al., 2017)
Trust in internet
(Al-sobhi, Weerakkody, & El-Haddadeh, 2011; Alzahrani & Goodwin, 2012)
Perceived Quality
Quality of service
(Bhatnagar, 2009; Irani et al., 2012; Sousa & Voss, 2012)
Quality of website
(Alzahrani & Goodwin, 2012; Hong & Fah, 2012)
Perceived Risk and Security
(Al-shafi & Weerakkody, 2010; Ambali, 2009; Hassan & Palil, 2012; Horst et al., 2007; Israel & Tiwari, 2011; Lean et al., 2009; Taiwo et al., 2012)
Demographic
Experience and skill
Page 53
36
2.8 Previous E-government Studies in Malaysia
This section reviews previous studies that focused on citizens’ adoption on technology in
Malaysia. Besides conducting a literature search from the IS publication databases Thomson,
EBSCOHOST, and Elsevier, to name a few, Google Scholar and Academia.edu were also used
to ensure no articles were not left out. From the search, 33 articles on the topic of technology
adoption among Malaysian citizens were identified. Out of 33 articles, only 17 articles were
selected for literature analysis as these articles focused on the G2C context. Table 2-5 lists
down the articles reviewed in the literature analysis.
The previous studies used various adoption models. However, as shown in Table 2-5, most of
the studies developed and tested their conceptual framework based on the TAM model.
Moreover, most of these studies used the original constructs proposed in the TAM model (e.g.,
Perceived Usefulness and Perceived Ease of Use was consistently significant and strongly
positively associated with citizens’ use of technology). Furthermore, the analysis demonstrates
that previous studies examined technology adoption using Behavioural Intention or Intention
to Use as the outcome variable not actual use. For instance, even though prior works used
several models such as DOI (J. Kaur & Rashid, 2008), TAM (Hussein, Mohamed, Ahlan, &
Mahmud, 2011; Lean et al., 2009), and TRI (Dorasamy et al., 2010), the outcome variable of
these studies was Behavioural Intention on technology adoption.
(AlAwadhi & Morris, 2008; Deursen, Dijk, & Ebbers, 2006; Teck Hong & Yin-Fah, 2012)
Intermediatery (culture)
(Al-Hujran, Al-Dalahmeh, & Aloudat, 2011; Al-sobhi et al., 2011)
Multichannel systems
(Mahbob et al., 2011; Sousa & Voss, 2012)
Page 54
37
Table 2-5: Summary of articles related to the technology adoption in Malaysia Authors Underpinning
theory Determinant constructs Outcome
constructs Findings
Pitchay Muthu Chelliah, Thurasamy, Alzahrani, Alfarraj, and Alalwan (2016)
DOI
Relative advantage, ease of use, compatibility, visibility, image result demonstrability
Intention to use e-licensing
Ease and use and visibility, relative advantage and visibility/observability have significant relationship with employees’ intention to use e-licensing
Che Azmi and Bee (2010)
TAM
Perceived usefulness, perceived ease of use, perceived risk
Behavioural intention
Perceived usefulness, perceived ease of use and perceived risk to influence e-filing use.
Dorasamy, Marimuthu, Raman, and Kaliannan, (2010)
TAM, DOI and Technology Readiness Index
Perceived usefulness, perceived ease of use, perceived readiness, complexity
Behavioural intention
Perceived usefulness, perceived readiness, complexity significantly associated with e-filing use.
Eze, Goh, Ling, and Lee (2011)
TAM
Perceived usefulness, perceived ease of use, security, internet infrastructure, reliability, convenience
Intention to use
Security, internet infrastructure, reliability, convenience have significant relationship with intention to use e-government services
Hong and Fah (2012)
TAM, UTAUT
Effort expectancy, performance expectancy, perceived risk, personal innovativeness, web self-efficacy, social influences
Intention to use
Effort expectancy, performance expectancy, social influence and web self-efficacy were statistically significant determinants of e-filing adoption.
Page 55
38
Hussein, Karim, and Selamat (2007)
Delone and McLean
Systems quality, information quality, perceived usefulness, user satisfaction
IS success dimensions system
All the technological factors are significantly correlated.
Mohd Idris, Kasimin, and Sahari (2011)
TAM, TRA
Ease of use, secure, reliable, enjoyable, infrastructure
E-government use
Ease to use, enjoyable, secure, reliable are related to e-government use.
Hussein, Mohamed, Ahlan, and Mahmud, (2011)
TAM, DOI, Perceived Characteristics of Innovating (PCI)
Perceived ease of use, perceived usefulness compatibility, image, result demonstrability, social influence, service quality, perceived risk, trust in the government, trust in the internet, internal political self-efficacy, external political self-efficacy
Intention to use
Perceived ease of use, perceived usefulness, compatibility, image, result service quality, perceived risk, trust in the government are found to be associated on e-filing use
Kaur and Rashid (2008)
DOI
Complexity, security concern, privacy concern, it illiteracy
E-services adoption
Complexity, security concern, privacy concern, it illiteracy are negatively associated with e-services adoption.
Page 56
39
Lean, Suhaiza, Ramayah, and Fernando (2009)
TAM, DOI
Trust, perceived usefulness, perceived relative advantage, perceived image, perceived strength of online privacy, perceived strength of non-repudiation, uncertainty avoidance
Intention to use
Trust, perceived usefulness, perceived relative advantage and perceived image, respectively, has a direct positive significant relationship towards intention to use e-government service
Moorthy, Samsuri, Hussin, Othman, and Chelliah (2014)
TAM, TPB
Perceived use of use, perceived usefulness, perceived security, perceived credibility, perceived service, information quality
E-filing behaviour
Perceived use of use, perceived usefulness, perceived security, and perceived credibility influence e-filing use
Mahbob et al., (2011)
TPB
Attitude, subjective norms, behavioural control
Usage behaviour
Attitude, behavioural control direct effect on e-government use.
Mohd Suki and Ramayah, (2010)
TAM, DOI Usefulness, ease of use, attitude, compatibility, social influences, computer self-efficacy, facilitating conditions, subjective norm, perceived behavioural control
Intention to use
Perceived usefulness, ease of use, compatibility, interpersonal influence, external influence, self-efficacy, facilitating conditions, attitude, subjective norms, perceived behavioural control, and intention to use e-government services/system
Page 57
40
Taiwo, Mahmood, and Downe (2012)
UTAUT
Performance expectation. peer influence, trust belief, risk
Behavioural intention
Performance expectation, peer influence, trust belief and risk taken propensity are significant in predicting behavioural intention to adopt e? government.
Yahya, Nadzar, and Abd Rahman (2011)
UTAUT
Performance expectancy, effort expectancy, social influence, information quality, system quality
Intention to use
Performance expectancy, effort expectancy, social influence, and information quality have positive relationship on using e-Syariah
Kianpisheh, Mustaffa, Mei Yean See, and Keikhosrokiani (2011)
UTAUT
Performance expectancy, subjective norm, perceived usefulness, perceived ease of use
Behavioural intention
Performance expectancy, subjective norm, perceived usefulness, perceived ease of use significantly associated with smart parking system
Page 58
41
2.9 Limitations in Previous Studies
From the literature review above, several limitations can be identified. First, a large portion of
previous studies in e-government were conducted and tested for a single service (Bhuasiri, Zo,
Lee, & Ciganek, 2016; Che Azmi & Bee, 2010; Kumar, Mukerji, Butt, & Persaud, 2007;
Lallmahomed, Lallmahomed, & Lallmahomed, 2017; Mohd Suki & Mohd Suki, 2017;
Moorthy, Samsuri, Hussin, Othman, & Chelliah, 2014; Pitchay, Ramayah, Alzahrani, Alfarraj,
& Alalwan, 2016; Rufín, Medina, & Figueroa, 2012). Thus, by using six different e-services,
the present study will investigate the applicability of constructs to the different e-services in
one study for the same population group simultaneously.
Second, most of the studies investigated Intention to Use as an outcome variable to identify
success factors on technology adoption. Even though the UTAUT model proposes Behavioural
Use as a dependent variable, the number of studies that used this construct is low (Al-Qeisi,
2009; Bhatiasevi, 2016; Mei-Ying, Pei-Yuan, & Yung-Chien, 2012; Williams et al., 2011;
Yahya, Nadzar, & Abd Rahman, 2011), and a meta-analysis study has shown that only 13
studies had partially or fully used all the constructs in the UTAUT model as a guiding
framework (Rana et al., 2013). Intention to use is not the same thing as actual use. A focus on
the latter provides a better understanding of drivers of e-services use.
Finally, a considerable volume of previous studies in Malaysia (see Table 2-5) focused on IS
success by using the TAM model, while the number of studies that used the UTAUT model
was limited. Thus, as the UTAUT model was claimed to have a higher accuracy to predict the
adoption compared to other models, this study tested the e-government adoption among the
Malaysian citizens.
2.10 Conceptual Framework
This study investigated the factors associated with citizens’ use of different e-government
services. For that purpose, a range of factors that may explain the citizens’ use or non-use of
specific e-government services were identified from the literature. Many studies have
integrated several models to understand citizens’ use of technology. The empirical studies by
Chang et al. (2005) in Taiwan and Phang et al. (2005) in Singapore revealed trust was a major
factor that influenced a person’s intention to use e-government services. Yet, when using
UTAUT as the fundamental theory, these studies indicated security and privacy indirectly
Page 59
42
influenced a person’s trust in the Internet in the two developed countries. In Malaysia, a study
by Lean et al. (2009) proposed a model that was generated from several models to understand
the intention of people to use e-government services. Besides Perceived Usefulness, Relative
Advantage, and image, the findings also showed that trust has a significant relationship with
adoption of e-government services among the users. Besides trust, the initial conceptual
framework also included quality of website and security as these factors were identified as the
major factors that influenced technology adoption particularly in developing countries (Eze et
al., 2011; Kaur & Rashid, 2008; Nugroho, 2015). Figure 2-6 displays the initial conceptual
framework that incorporates the factors derived from the UTAUT model, as well as trust in the
government and the trust in the Internet, security concerns, and quality of the website that may
be expected to be associated with citizens’ use of e-government services. As the study involved
six services, the model was also repeated six times to represent the service accordingly.
Page 60
43
Figure 2-6: Initial research model for each of e-services
Performance Expectancy
Behavioural Usage
Quality of Website
Social Influence
Effort Expectancy
Trust
Security Concerns
Trust in the Internet
Trust in the government
Page 61
44
2.11 Chapter Summary
This chapter has presented an overall background on the concept, context, and maturity level
of e-government. In addition, as discussed in Section 2.10, the Malaysian government are
actively and progressively adopting several new technologies that will possibly enhance the
G2C relationship. This chapter has also addressed some models and theories that are related to
the technology adoption, as well as the previous studies implemented in Malaysia. Finally,
from this literature review, three gaps have been identified. First, it is clear that most of the
previous studies were developed with a single e-service. Second, most of the previous studies
that used by the UTAUT model used Intention to Use as a dependant variable, instead of
Behavioural Usage. Third, the number of studies that used the UTAUT model in Malaysia is
still limited.
Page 62
45
Chapter 3 : Methodology
3.1 Introduction
Creswell (2003) points out the important questions that researchers should ask when choosing
the appropriate methodology for their research. Researchers need to understand the reasons
they should choose one approach over the other in designing a study, as different
epistemologies have different methodologies (Creswell, 2003: pp. 3). The purpose of this
chapter is to explain the methodology used in this study. The first section explains the research
site, followed by a discussion on the research process in Section 3.3. Section 3.4 describes the
justification of the selection method. The data collection sources are explained in Section 3.5.
This section also explains in detail the first stage of study in which the general drivers of
technology adoption was confirmed from interviews, and after which a revision of the
conceptual model was proposed. This stage was then followed by the second stage of the data
collection, an online survey to statistically analyse predictors of e-service use. This chapter
ends with the explanation on documents and field notes as other methods of the data sources.
3.2 Research Site
This study sought to understand the main factors associated with citizens’ usage of the various
e-government services in Malaysia. Three service areas were focused on, namely income
taxation, property taxation, and traffic fines, and in each service area, two types of e-services
were considered, namely e-information and e-payment. Two of the systems were operated by
the federal government (namely, income tax by the Inland Revenue Board, and traffic fines by
the Royal Malaysian Police). The third system (property tax) was operated by local authorities.
3.2.1 Local Authority’s Property Tax E-assessment System
The local government, or local authority, is the lowest level in the system of government
in Malaysia after the federal and state governments. Being the government’s lowest tier, local
authorities play an important role in creating a positive relationship with the public. Local
government has responsibility for providing various basic utility services, such as housing,
drainage, water supply and land assessments, city planning, healthcare services, cleanliness,
disease control, traffic system management, public transportation, city beautification,
Page 63
46
licensing, and security (Cheema & Hussein, 1978). The federal government’s Ministry of
Housing and Local Government plays a role in monitoring the practices of local governments
in Malaysia.
There are currently 145 local authorities in Malaysia (including Sabah and Sarawak), and they
are divided into cities, municipalities, and districts. Cities often refer to the administrative
centres of the state, having a population of more than 500,000 people. City Councils are
expected to have strong financial resources with annual revenues exceeding RM100 million
and be capable to spend it. Municipalities have populations greater than 150,000 people and
annual revenue of more than RM20 million. Other than service providers, municipalities also
ensure that it has industrial activities, businesses, and tourism to further boost employment
opportunities. In other words, municipalities have a big role to provide spaces and opportunities
to business by promoting growth investment and commercialisation activities. District councils
are rural areas with less than 150,000 people and annual incomes of below RM20 million. All
types of local authorities perform the same roles and responsibilities.
As stressed by the former Minister of Housing and Local Government of Malaysia, all the local
authorities must have functional websites and should include at least e-complaints, e-
submission, e-tax, e-collection, and e-licensing (Daily Express Online, 2003). In addition, the
launching of Smart Local Government Governance Agenda (SLGGA) that requires all local
governments in Malaysia to provide their services online also seems a good initiative by the
government to ensure the local authorities provide their services by using the current
technologies. On top of that, the local authorities should also optimise the utilisation of their
websites to disclose as much information as possible to their community. Therefore, besides
the facilities to apply business/industrial license, waste management, and public cleaning
service and providing public facilities and reservation, most of the local authorities also provide
assessment tax as their main revenue. Assessment tax is a local tax imposed for ownership and
occupation of rateable holding situated within a council’s area of jurisdiction. Through their
official websites, the assessment tax service is offered in two modes, e-assessment and e-
payment. As registered users, the citizens may obtain their annual assessment tax information
through e-assessment service, and for e-payment, the tax payment can be made online through
the same website portal. The official website portals are maintained and monitored on their
own and are different from a local authority to another. For example, Petaling Jaya City Council
official portal can be assessed at http://www.mbpj.gov.my/en/citizens/e-services, while Alor
Page 64
47
Setar City Council can be reached at http://www.mbas.gov.my/en. However, as an option, the
citizens can also request and pay their property taxes at the local government office counters
on weekdays. Thus, the citizens have a choice to transact with the local authorities over the
counter or online.
3.2.2 Federal Government’s Traffic Fine E-payment System
In 2010, the government launched My e-Government (MyEG) as a one-stop portal for
Malaysians to deal with any kinds of government-related services. This portal facilitates the
communication between citizens and government agencies. Most of the federal government’s
online services are provided through MyEG, which provides an access to various government
agency’s services in one website. Through the MyEG portal, a citizen can perform transactions
and check for details on services such as traffic fines, driving license renewal, auto insurance
renewal, and road tax renewal. Traffic fines are managed by the Royal Malaysian Police (RMP)
under the Ministry of Home Affairs. Under the RMP services, the citizens can use RMP
Summons Information Inquiry (e-checking) and RMP Summons Service (e-payment) service.
E-checking refers to the service that allows the citizens to obtain general and personal
information about their traffic fines, while e-payment service allows the citizen to pay their
traffic fines online. The MyEG portal can be accessed via www.myeg.com.my and
www.eservices.com.my. Even though the services are offered online, equivalent offline
services are also available over the counter or through phone calls to the nearby police stations.
3.2.3 Federal Government’s Income Taxation E-filing System
The taxation e-filing system in Malaysia was launched in 2006 and is monitored by the Inland
Revenue Board of Malaysia (IRBM). During its early implementation, the taxpayers were
required to provide an e-signature (digital certificate), MyKad (Malaysian Identification Card),
and transaction details in order to use the e-filing service. E-filing refers to the submitting of
tax forms electronically as an alternative to the manual, paper-based method. Initially, the
objectives of the e-filing system were to facilitate tax compliance and to allow citizens to
conduct transactions through the Internet. By assessing the service, e-filing will automatically
calculate the total payable tax. Once the processes are successful, a notification of transaction
will be sent immediately. E-filing transaction has many benefits. IRBM claims that this service
does not only allow the citizens to submit their tax forms through the Internet, but it also offers
the service in a highly secure website. In addition, taxpayers could file the tax return
Page 65
48
conveniently thus saving the cost and time. Moreover, e-filing reduces the delivery and printing
costs for an estimate of RM8.17 million (Islam et al., 2012).
E-filing is an effective way of tax filing method, and the number of users and uses increases
yearly. In 2007, a total of 50,000 tax returns were received online, scoring 25% response rate
from 200,000 forms that were downloaded from https://ez.hasil.gov.my/CI/. In 2012, 2.1
million taxpayers filed their income tax form through this system (IRBM, 2012), and the tax
value collected increased rapidly from RM56.8 billion in 2005 to RM74.7 billion in 2007 (The
Star Online, 2007). These figures show that by employing the e-filing, the IRBM did their job
well to increase their revenue. Some initiatives have also been taken by the IRBM to improve
their online services. For example, in order to encourage citizens to pay their income tax online,
collaboration with the local banks has been undertaken. This initiative allows the citizens an
access to their bank account through the IRBM website, and payment can be done without
logging in to their respective bank.
3.3 Research Process
This study used a two-stage research design. In the first stage, this study embarked on a scoping
study in order to get a clear picture of the issues under investigation and to refine the conceptual
model prior to a survey in the second stage. Initially, several general ideas were identified from
a review of the extant literature in the related fields of study in order to understand citizens’
use of e-government services. The scoping study was undertaken to identify and to confirm the
presence of the constructs in the proposed conceptual framework and to identify any new
constructs. Figure 3.1 presents an overview of the research procedures conducted in this study.
As illustrated in Figure 3.1, the study commenced by identifying the research problems. In
general terms, the research problem was generated after reviewing and analysing the topics
related to e-government usage in Malaysia. Based on a review of the extant literature, it was
concluded that further investigation was necessary in order to determine the main factors
influencing an individuals’ usage of different e-government services in Malaysia.
Page 66
49
Source: Adopted from Hashim (2012)
Figure 3-1: Research procedures
During the literature review phase, attention was paid to the relevant theories and findings in
previous studies. Based on the extant literature and theories from related fields of research, an
initial conceptual framework was formulated (see Figure 2-6). A scoping study was undertaken
to further develop and refine the initial conceptual framework as well as to identify new
constructs as appropriate. The constructs used in the present study were measured using scales
established in previous studies (as discussed in Chapter 5). However, as this study was focused
on six particular Malaysian e-government services, changes were made to the items in order to
make sure they clearly reflected the context and objectives of the study. The next section
presents the selected methodology for this research and provides justifications for their
selection.
3.4 Selection and Justification of Research Methodology
Each method has its own strengths and weaknesses that vary based upon the topic the
researcher wants to discuss. In other words, a research methodology is determined by
answering the research objectives and research question of the study (Creswell, 2009).
Determining the correct research methodology is crucial because it is closely related with the
Review
Model
Define Research Problem
Review Concepts
Conceptual Framework
Online Survey
Verifying- Validity & Reliability
Questionnaire Development
Scoping Study
Research Design
Thesis Documentation
Interpret Data
Hypotheses Testing
Analyses
Page 67
50
conduct of rigorous research (May & Pope, 1995; Bluhm et al., 2011) and the quality of the
research results (Creswell, 2009).
At the initial stage, a scoping study was undertaken to identify the key elements of the
constructs in the initial UTAUT framework as well as to identify any new constructs. The
results of the scoping study phase are discussed in detail in Chapter 4.
At the second stage, this study adopted a quantitative approach. As the present study aimed to
gather numerical evidence of e-government use in Malaysia, a quantitative research design
incorporating an online survey method was identified as the appropriate approach (Nulty,
2008). This approach is useful to study the relationships between variables (Malhorta &
Galletta, 1998). Based on the research questions and objectives of the present study, the
appropriate type of investigation used was a cross-sectional study in which the data were
gathered at one point in time. The results of the quantitative phase of this study are discussed
in detail in Chapter 5. The next section discusses the sources of data and outlines the steps
taken in the selection of the data sources.
3.4.1 Stage One: A Scoping Study
A scoping study (or scoping review) is an increasingly popular approach to understand the
research context, and is very popular in the field of health research (Davis, Drey & Gould,
2009). Previous studies (e.g. Rumrill, Fitzgerald & Merchant, 2010; Grant & Booth, 2009;
Levac, Wishart, Missiuna, & Wright, 2009, Levac, Colquhoun & O’Brien, 2010) defined a
scoping study as a procedure for summarizing a selection of evidence as a way to convey the
breadth and depth of a field. According to Mays, Roberts and Popay (2001), a scoping study is
a process to mapping the key concepts that underpin a research topic, supported by key sources
of evidence, it is suitable where the topic area is complex or has not been reviewed
comprehensively before. At a general level, a scoping study is suitable when there is a need;
(1) to identify what we know and what we do not know of a phenomenon (Anderson et al.,
2008); (2) to provide conceptual clarity about a specific topic (Davis et al., 2009); (3) to clarify
a complex concept and refine subsequent research inquiries; and (4) to do a preliminary
assessment on the concepts underpinning the research area (Arksey & O’Malley, 2005), used
as the basis for a next stage of research (Daudt, van Mossel, & Scott, 2013).
Page 68
51
A scoping study was conducted to assess if current issues covered in the literature about usage
and non-usage of e-government services were adequately addressed in the Malaysian context.
Although previous studies (e.g., Iyer, Baqir, & Vollmer, 2006; United Nations Report, 2008;
Gauld, Graya, & McComba, 2009; Mosse & Whitley, 2009) show that currently e-government
has been implemented in developed countries, it is possible that the previous studies have
overlooked some contextual factors that are uniquely relevant for Malaysia. The aim of the
scoping study was to get feedback and opinions about citizens’ actual experiences of using e-
government services from Malaysian citizens.
Face-to-face in-depth interviews were used for this scoping study (Markus & Lee, 1999;
Maxwell, 1996) and twelve participants with various professions and job backgrounds were
involved. Open-ended questions focusing on the general factors that influence a citizen’s
adoption on e-government use was asked during the interviews. This method provides in-depth
views into the experience of participants.
3.4.1.1 Sampling and Recruitment
As the objective of this study was to identify the key factors associated with citizen’s use of e-
government services, the main criterion for the scoping study was that the participant was
currently had used any e-government services in the last two years. Therefore, people who had
not used any e-government services were excluded from the scoping study.
Due to financial and time constraints, the interviews were conducted at one public university
in Malaysia, Alor Setar Community College and Jitra General Hospital. The recruitment
process started with the researcher sending a notification email about this research, an
invitation letter and the interview guide to several Heads of Department who then forwarded
to their staff. Prior to the interview guide was sent to the potential participants for their
reference. However, in many cases, the order of the questions was changed during the
interviews according to the topics raised by the interviewees. In order to get sufficient numbers
of participants, a snowball and convenience sampling technique was also used.
Malaysian citizens belong to three main ethnic groups, namely, Malays (67.4%), Chinese
(24.6%) and Indian (7.3%), with a small percentage belonging to other ethnic groups (0.7%).
Based on the list of potential participants retrieved from the invitation email responses, the
researcher carefully selected the participants in order to ensure the number of participants was
Page 69
52
reflected gender and ethnic diversity. Of the twelve participants in the scoping study, seven
were male and five were female. In terms of ethnicity, the sample was Malay (6), Chinese (4)
and Indian (2) participants. All the respondents had at least a diploma certificate, a tertiary level
of education. The interviews were conducted in January 2013. Table 3-1 summarises the
interviews held in the first setting for this study.
Table 3-1: First setting for the study Organisation Public University
Unit/ Department Schools, Registrar, University Health Centre & Computer Centre
Participants
P1, P2, P3, P4, P6,
P7,P10, P12
1 Senior Lecturer, School of Accountancy
1 Assoc. Prof, School of Computing
1 Lecturer, School of Multimedia Technology & Communication
1 Lecturer, School of Economic, Finance & Banking
1 Dentist, University Health Centre
1 Senior Official, Registrar’s Office
1 Tutor, School of Law
1 Senior Officer, Computer Centre
Table 3-2: Second setting for the study Organisation Jitra General Hospital and Jitra Community College
Unit/ Department Pharmacy and Engineering Department
Participants
P5, P11
1 Pharmacist, Pharmacy Unit
1 Lecturer, Department of Mechanical Engineering
Table 3-3: Third setting for the study Organisation Jitra Community College & University
Unit/ Department Computer Centre
Participants
P8, P9
1 IT Officer, Jitra Community College
1 IT Officer, UUM
At the end of interviews in the first setting, the researcher also asked the participants if they
had colleagues who had used e-government services. This technique is called snowball
sampling, whereby participants recommend other potential participants who are familiar with
the researcher’s subject (Oates, 2006). Invitation emails along with the interview guides were
Page 70
53
sent to these potential participants. Interviews were arranged with those who agreed to
participate. Table 3-2 summarises the interviews held in the second setting for this study.
The researcher then applied the convenience sampling technique, which means selecting
participants who are easy to reach, willing to contribute and suitable for the subject (Oates,
2006). One IT Officer was selected from the Computer Centre and one IT Officer was selected
from Jitra Community College. Table 3-3 summarises the interviews in the third setting. Figure
3-2 illustrates the sampling techniques applied for the scoping study.
Figure 3-2: Sampling techniques for the scoping study
In qualitative research, the desirable size of the sample is still debatable. According to Guest
et al. (2006), qualitative researchers should rely on the concept of data saturation to determine
the sample size, where the authors believed that saturation occurs when a researcher finds no
new information or themes. However, Yin (2009) states that saturation in qualitative research
is normally reached after interviewing ten people. The following subsections highlight the
interview process and the procedures involved during the interviews.
Page 71
54
3.4.1.2 Interviews
Data was gathered through semi-structured interviews to investigate the topic in this study. The
interviews were face-to-face and semi-structured. This enabled the participants to answer the
questions and provide information with no limitations, while maintaining focus on their
personal experience of e-government usage. Semi-structured interviews allow a researcher to
seek information about a specific answer and to ask further questions that need more
elaboration.
The purpose of the interviews in the scoping study was two-fold. First, the interviews provided
a holistic view of the actual e-government usage among Malaysian citizens. As suggested by
Wu (2012), a holistic picture of the study has to be drawn earlier before the researcher proceeds
or determines the constructs that will be the focus of the study. Second, the themes and codes
generated from the interviews would help the researcher in the next phase of the research
design, namely, the questionnaire design phase.
An interview guide was used to ensure the conversations were focused on the main topics, to
collect the information needed, and to ensure consistency in asking the same basic set of
questions to all participants. With the guide, the researcher was able to get detailed information
from the participants concerning the e-government topic and the key factors affecting e-
government in Malaysia. Interviews also enable a researcher to investigate the personal
experiences and feelings of the participants in depth (Rubin & Babbie, 2008).
The interview guide (see Appendix A) was largely based on concepts identified in the initial
model (see Figure 2.6) namely the UTAUT model (Venkatesh et., 2003; AlAwadhi & Morris,
2009), trust in government (Rehman et al., 2012), website quality and perceived risk (Alsaghier
et al., 2009). The interview guide was used as a guideline for the conversation rather than as a
rigid interview protocol. The key questions for the general use of online government services
included: “In the past two years, what online government services have you used?” and “When
deciding whether to use an online government service, what key factors do you take into
account?”. For trust and perceived risk, the questions included: “Do you believe that online
government websites are trustworthy and that your data is secure? Why?”, “Do you believe
that people around you are important in influencing your behaviour on online government
services usage?” How and why?”. In order to gain information about the different types of
usage and the reasons for using the e-service, the key questions included: “If you are using
Page 72
55
another method to deal with a government agency, what is the method?”, “Why are you using
it?” and “Apart from the e-services mentioned above, are there any online government services
that you have used?”, “Why did you choose the system?”.
The duration of the interview sessions was from 45 minutes to one hour. At the beginning of
the interview, the researcher asked the interviewee for permission to use the tape recorder. Two
interviewees refused and the rest were tape-recorded. During the interviews, another important
issue that researchers must consider is the need to remain focused on the topic and be objective.
The quality of qualitative data depends on the researcher’s ability to maintain focus on the topic
(Levy, 2006). In many cases, the interviewees were excited to share their personal experiences
and shared personal information that they may not have been comfortable sharing through other
media.
All the interviews were conducted in Malay. However, some IS-related terminologies in
English were used in some of the interviews. The recorded interviews were transcribed by the
researcher. For the un-recorded interviews, the researcher wrote down any significant
information provided by the participants during the interviews.
The transcribed interviews were translated into English by the researcher. A copy of both
interview transcripts (Malay and English) was sent to two officers at the UUM School of
Modern Languages for feedback. Alterations to the transcripts were made based on their
comments. In order to maintain confidentiality, the participants’ name, position or any other
identifying information was extracted prior to sending the transcripts. These actions were taken
to reduce bias and increase the research reliability and validity (Barnes, Stuart & Vidgen, 2006;
Barnes, 2011) .
3.4.1.3 Data Analysis Approach
In order to analyse the data, the researcher employed the template analysis proposed by King
(2008). This technique was used because it provides a way to manage an unorganised dataset
in order to discover the relationships in the data and match up the participants’ views (King,
2008). King (2008) presents the seven major steps involved in the template analysis technique
as follows:
Page 73
56
1. Define the a priori themes.
2. Transcribe the interviews and familiarise with the data.
3. Produce an initial template by carrying out initial coding of the data by either attaching
a code to prior identified theme or by modifying an existing theme or even developing
a new one.
4. Group the themes that have been identified in the transcripts into a smaller number of
higher-level codes that illustrate broader themes (categories) in the data. Researchers
can use computer-aided qualitative data analysis software for this purpose.
5. Develop the initial template by applying it to all the interviews transcripts.
6. Use the final template to assist in interpreting and writing up the research findings.
7. Carry out quality checks at one or more of the coding stages.
This technique fitted well with this study for three particular reasons. First, the template offered
a meaningful way to organise the data according to the themes. For this reason, this technique
was appropriate with this study as it helped discover the relationships in the data and facilitated
an explanation of the various experiences of the participants in reference to the factors
influencing e-government use. This approach differs from inductive coding (Stewart &
Shamdasani, 1990). Even though the purpose of both techniques is to condense and categorise
data into themes relevant to the research objectives, inductive coding does not enable
researchers to categorise data into existing codes that emerge from the theories.
Second, the template analysis fitted well with this study because the analysis started with pre-
defined themes discovered from a review of several theories in the literature, followed by
conducting interviews and finally end up with initial coding (King, 2008).
Third, the chosen approach for analysing the data relied on several factors such as the limited
time and the purpose of the study (Lacey & Luff, 2009). As stated by King (2008), template
analysis does not require long periods of time compared to other techniques (e.g., grounded
theory) and therefore was suitable for the researcher’s limited time.
In detail, the following sections illustrate how the researcher has applied each of the above
proposed steps in the analysis of the collected data.
Page 74
57
3.4.1.4 Application of Data Analysis Approach
This section describes the step-by-step application of the template analysis approach for the
analysis of the data collected in the interviews.
Step 1: Define the priori themes
The researcher identified the themes in the existing literature about the use and non-use of e-
government services, particularly in reference to the technology acceptance models such as the
Theory of Reasoned Action (TRA) (Fishbein & Ajzen, 1975), the Theory of Planned Behaviour
(TPB) (Ajzen, 1985), the Technology Acceptance Model (Davis, 1989), and the UTAUT
(Venkatesh et al., 2003). Table 3-4 presents the priori themes that were identified from the
technology acceptance models in the literature, as outlined in the previous chapter (see Figure
2-4).
Table 3-4: The priori themes 1. Performance Expectancy
2. Effort Expectancy
3. Facilitating Conditions
4. Social Influence
5. Trust in the Internet
6. Trust in the government
7. Quality of Website
8. Security Concerns
Step 2: Transcribe the interviews and become familiar with the data
In this step, the process of transcribing the interviews in a Word document was completed.
Translation then took place. The documents were prepared in the Malay language. The
researcher completed the process of transcribing all the interviews in Malay, the language in
which the interviews were conducted. In addition, data analysis occurred in the Malay
transcripts, with only relevant excerpts translated for reporting. The transcripts were reviewed
several times in order to become familiar with the content and to identify important aspects or
issues related to e-government usage in Malaysia.
Page 75
58
Step 3: Carry out initial coding of the data
In this step, the researcher identified the codes for meaningful analytical units by dividing,
indexing and segmenting the data according to the interview transcript. Taylor-Powell and
Renner (2003) suggest that researchers can choose to base the coding on the question or topic
or on the case, individual or group in the analysis process. In this study, it was decided to
analyse the transcripts by individual, in order to understand how each question was answered
by the participant. This helped the researcher to identify the initial code of the data and decide
whether to attach the code to a pre-identified theme, to modify an existing theme, or even to
develop a new one.
Step 4 and Step 5: Group the themes and develop the template
Initial coding was done in Step 3, from which the template was generated. Therefore, Steps 4
and 5 were applied at earlier stages of the analysis.
Step 6: Use the produced template to assist in interpreting and writing up the research
findings
The results of the scoping study were discussed in detail in Chapter 4.
Step 7: Carry out quality checks at one or more of the coding stages
In order to ensure the quality of the coding results, and before embarking on the online survey,
the researcher carefully checked the credibility and generalisability of the research findings.
As explained by Graneheim and Lundman (2004), the credibility of research findings is about
how well the themes and categories are covered in the textual data and whether any relevant
data has been excluded. By applying line-by-line coding as a fundamental step in analysing the
data, the researcher ensured that all the relevant data was all covered.
3.4.1.5 Qualitative Research Quality Evaluation
In order to evaluate the validity and reliability of qualitative data, it is essential that a researcher
understands the terminologies such as internal validity, external validity, reliability and
objectivity which are popularly used in quantitative research. New terminologies are
sometimes introduced to reconceptualise the evaluation of qualitative data using new labels
(Denzin & Lincoln, 2005: pp. 19-20). For example, Lincoln and Guba (1985) propose the use
Page 76
59
of credibility, dependability, transferability and confirmability as new labels to evaluate
qualitative research. As this scoping study was designed for interpretative qualitative research,
Lincoln and Guba's (1985) labels of qualitative research were adopted.
Credibility in qualitative research demonstrates that the study was conducted properly and the
subject was correctly identified. Credibility in research can be strengthened by using data
triangulation, prolonged engagement, peer review and by asking the interviewees to check and
comment on the interview transcripts (Halaweh, 2012). As mentioned earlier, the objective of
the scoping study was to identify the initial factors in e-government usage based on individuals’
experiences. Therefore, with the application of several criteria, the selection of participants was
purposely carried out to best meet the research objectives.
Transferability or generalisability in qualitative research, that is, whether or not the results are
applicable to other situations, contexts and groups, is debatable (Dick & Swepson, 1997; Levy,
2006; Strauss & Corbin, 1998). Some scholars argue that it is not possible to generalise the
result of qualitative research because such research is a process of understanding and
interpreting an individual case (Janesick, 1993) and, in some circumstances, it deals with
sensitive and deep insights into the complex topic that was studied (Conboy, Fitzgerald, &
Mathiassen, 2012). Transferability in a qualitative study is defined as how applicable the
procedures and findings are to another context and group (Graneheim & Lundman, 2004). Dick
and Swepson (1997) claim that generalisability in qualitative research could be possible in the
sense that the research procedures employed in one study could be applied by other researchers
in diverse settings, leading to similar results and findings. This chapter described in detail the
procedures that were followed in the scoping study, from defining the research question and
objectives, selecting the research paradigm and design, and choosing the data analysis method.
These systematic procedures can be used as a guide for other researchers who are interested in
a similar topic; if applied, those studies might obtain the same results (Halaweh, 2012). This
scoping study identified Perceived Trust and Perceived Risk that are relevant to the Malaysian
context; if another study applies these procedures to research set in Malaysia or a developing
country, it could produce the same results or extend this study’s outcomes to new concepts.
For example, Halaweh (2012) illustrates how the systematic process in research that involves
two different approaches to qualitative analysis offers strong methodology and can be
replicated by future researchers.
Page 77
60
Dependability refers to how a researcher has managed their research, including the creation of
a written record of how they prepared the interview data for the final interpretation of the
textual data. Boejie (2010) claims these procedures are essential in determining the quality of
the research as the researcher is able to explain the reasons for every step taken during the
research process. Furthermore, proper procedures enable future researchers to repeat the work
and gain the same results (Shenton, 2004). Therefore, this chapter explained in detail how the
scoping study was conducted and justified all the decisions made supported by figures, tables
and appendices. The interviews were only done after approval from the School Ethics
Committee was obtained.
Confirmability shows that the findings and results were genuinely gathered from the data. By
doing so, a researcher has to show the steps taken and the concepts and categories that emerged
from the raw data, establishing that the findings are the result of the ideas and experiences of
the interviewees and not of the researcher’s predispositions (Shenton, 2004). Murphy and
Yielder (2010) state that confirmability is about whether or not the findings can be tested and
verified by other researchers.
3.4.1.6 Ethical Considerations
Before the interview was conducted, ethical approval was sought and granted from the School
of Social Work and Human Services Research Ethics Committee, University of Queensland
(clearance number SWASH2014/1) and shown in Appendix B. This study follows the ethical
guidelines published by the National Health and Medical Research Council (NHMRC). A
number of procedures were adopted to ensure participants’ informed consent. Participants were
informed of their right to withdraw from the research and to decline to answer questions at any
time. Also, they will remain anonymous at all times and other forms of identification will not
be evident. Therefore, the procedures undertaken during the data collection would pose no
potential risks to the participants.
To ensure the confidentiality of the data, participant’s personal information was not included
in any of the findings (Bulmer, 1982). As suggested by Stake (1995) an agreement on
boundaries and limits should be presented in the early stage of interview. The interviews were
handled in a professional manner in that the researcher established standard interview
guidelines and the interviews were conducted in a location convenient to the participants. The
Page 78
61
confidentiality of the participants was a priority for the research. All data (softcopy and
hardcopy) were kept in a locked cabinet or password-protected in the researcher’s laptop.
3.4.2 Stage Two: Online Survey
The purpose of stage two was to test the revised model obtained from the scoping study by
using a quantitative research approach. For that purpose, a web-based survey was utilised as
this method can be used to survey a large number of people (Elling, Lentz, de Jong, & van den
Bergh, 2012; Umbach, 2005). Furthermore, a web-based survey can also help to reduce the
number of incomplete responses and has the advantages in terms of speed and accuracy in the
data collected. The data can be automatically inserted into spreadsheets, databases, or any
statistical software. These steps not only save time and money, but also reduce human error,
particularly in data entry and coding. The methods in which the data in the second stage were
collected and analysed are described in the following subsections.
3.4.2.1 Sampling and Recruitment
A good sampling frame is defined by how closely the selected participants represent the larger
population of interest. Understanding the sample’s characteristics allows a researcher to
generalise the sample to represent the population (Sekaran, 2003).
The Malaysian tax office (IRBM) was used to recruit the participants due to its ownership of
the e-filing database. As mentioned earlier, the main objective of this study was to understand
the main determinants influencing citizens’ usage of different e-government service. The target
population of this study was Internet users with an experience of using e-government services.
Therefore, the inclusion criterion for the respondents in this study was those with an experience
in using at least one of the e-government services (i.e., personal taxation, property tax, and
traffic fines). From this criterion, which was set based on the actual usage or the users’
experience, the different usage of services could be identified. It was reasoned that if the users
had used the e-filing system, they were likely to have used other e-government systems such
as e-payment for paying a property tax and traffic fines.
The respondents for the online survey in the present study were recruited from Selangor. This
state was selected for several reasons, including it has the highest population in Peninsular
Malaysia, it has the highest rate of participation in the labour force, the population was having
Page 79
62
a high computer literacy, and their e-government services were well-established among the
local authorities (Department of Statistic, 2010). Moreover, the 2014 Household Use of the
Internet Survey reported that Selangor had the highest percentage of broadband subscriptions
and the second highest Internet penetration rate in the country (Malaysian Communications
and Multimedia Commission, 2015). Given the study’s focus on property tax, which is based
on local government, there was a need to consider the local authorities covered by the study.
In general, Selangor comprises seven Local Planning Authorities, namely, Shah Alam City
Council, Petaling Jaya City Council, Subang Jaya Municipal Council, Klang Municipal
Council, Selayang Municipal Council, Ampang Jaya Municipal Council, and Kajang
Municipal Council. Importantly, at the time of this study, all the Selangor local authorities
provided online transaction and information services and had offered payment, complaint and
information services since 2008 (Ministry of Housing and Local Government, Malaysia, 2008).
Therefore, all these factors made Selangor a suitable setting for this study.
The sampling method used in this study was random purposive sampling. According to Lean,
Suhaiza, Ramayah, and Fernando (2009), the purposive sampling method is useful for
situations where the researcher is dealing with several situations such as the need to get a right
target according to the context of the study, to get a sample quickly, and when the list of the
population cannot be obtained due to confidentiality.
Since such databases are strictly confidential and highly protected, an invitation to participate
in the survey was distributed by the IRBM. This method was used in Malaysian tax research
by Idawati and Pope (2011). The IRBM randomly selected potential respondents from its
database and sent the survey invitations by email. The invitation provided the website link to
the questionnaire.
There is no agreement in the literature regarding the minimum number of participants as a
sample size. The larger the sample size, the lower is the error in generalising to the population
(Comreyv & Lee, 1992; Kline, 1994; Saunders, Lewis & Thornhill, 2009). However, some
scholars disagree with this assumption because it is not supported by any empirical evidence
(MacCallum, Widaman, Zhang & Hong, 1999). Roscoe (1975) suggests that the appropriate
sample size should be between 30 and 500. Other researchers suggest that 100 is an appropriate
minimum number of samples (Gorsuch, 1983; Kline, 1994). However, as a rule of thumb, Hair,
Black, Babin and Anderson (2009) explain that the sample size should exceed 200 in most
situations. In the present study, the gatekeeper was asked to distribute 1,000 questionnaires, to
Page 80
63
ensure that a minimum number of 200 respondents would be achieved. According to the
Department of Statistics Malaysia (2014), the number of workers registered in Selangor was
2.8 million (N) people. Hence, 1,000 (n) people were randomly selected through a systematic
random sampling technique.
The online survey was kept open for 30 days. SurveyMonkey.com claims that response rates
increase from 25% on Day 1 to 79% on Day 31. Despite the various advantages of using an
online survey method, Wright (2006) points out that online surveys face the problem of a low
level of cooperation from respondents, which can lead to low response rates. Thus, it was
decided that, as suggested by Dillman (2007), the online survey would be extended to another
14 days, if the response rate was low.
SurveyGizmo.com is a provider of web-based survey services and this study employed
SurveyGizmo.com for the data collection. This package was selected because it makes it easy
to manage the data. The SurveyGizmo.com package comes in Microsoft Excel format and
allows the data to be transferred to STATA simultaneously. The SurveyGizmo.com package is
also available at a reasonable price.
3.4.2.2 Survey Design and Measurement Development
The actual constructs and measurement items were developed following the scoping study. As
suggested by Straub (1989), a researcher is advised to use previously validated instruments
especially when employing survey methods. Therefore, in the questionnaire distributed in this
study, the researcher adopted the previously validated constructs in the information systems
field. The wording of each item in the questionnaire was modified to fit the context of the actual
usage or users’ experience (see Chapter 5, Section 5.1 for details).
The questionnaire comprised five sections. Section A of the survey explained the purpose of
the study and explained that the respondent’s identity would be anonymous. Sections B, C and
D involved questions relating to each of the three service areas investigated in the study
namely; income tax, property tax and traffic fines. As such, each section used the same set of
questions and consistent structure, but modified for each service area. As the current study
examined six different e-government services, the lists of questions were repeated, but
modified for each e-service. All the independent variables were measured using Likert scale
from 1 to 5, with 1 indicating “strongly disagree” and 5 indicating “strongly agree”.�However,
Page 81
64
the measurement items for the outcome variable, namely use of e-service, were developed as a
dichotomous variable. The details about the survey design are provided and discussed in
Chapter 5.
3.4.2.3 Data Analysis Approach
The quantitative analysis of the data was completed in two steps. First, a univariate data
analysis was used to describe the sample characteristics on the basis of frequency distributions.
This method of analysis assessed the representativeness of the respondents’ demographic and
socioeconomic characteristics (e.g., age, gender, education, job, and ethnicity).
Regression analysis was conducted next. This test is a statistical technique that explores the
relationship between independent and dependent variables (Pallant, 2007). In this study, as the
dependent predictors were in an ordinal scale, a logistic regression was chosen. As the main
objective of this study was to examine the relationship between predictor variables (Relative
Advantage, Effort Expectancy, Social Influence, Perceived Risk, and Perceived Trust) and
usage behaviour, regression analyses were done to analyse each e-government service in order
to identify the factors associated with technology use. Further details about the stage two,
including the survey respondents and data analysis, findings and demographic data are
provided in Chapter 5.
3.4.2.4 Reliability and Validity
The validity of a questionnaire can be assessed by testing its content validity and construct
validity (Straub, Boudreau & Gefen, 2004; Templeton, Lewis & Snyder, 2002). Content
validity refers to the degree to which the measured items represent the dimensions of the
construct. Normally, content validity is assessed through the previous literature and reviewed
by experts (Straub et al., 2004). In this study, as the questions were designed in English and
the targeted research participants were Malaysians, the questions were translated to Malay. The
items were reviewed and validated by two academic staff at the School of Education and
Modern Language, University Utara Malaysia and two staff at the Public Relation Office
(Foreign Language Section), University Utara Malaysia. This step is important to ensure the
items used plain language, avoided double-barrelled questions, ensured the items were clear
and unambiguous, and ensured the items correctly represented the dimension of the constructs.
Page 82
65
Construct validity is the degree to which a tool accurately measures the constructs. According
to Straub (1989), a construct is valid if there is a high correlation among the measures within
the same construct and low correlation with the measures in different constructs. Construct
validity can be assessed by discriminant validity and convergence validity. Discriminant
validity is tested to validate that the constructs measured are not correlated with other
constructs. As suggested by Hair et al., (2009), the discriminant validity can be measured by
comparing the average variance extracted (AVE) value with the squared inter-scale correlations
of the construct. A higher AVE value compared to the squared inter-scale correlations of the
construct means that the discriminant validity has been met (Hair et al., 2009). On the other
hand, convergent validity is tested to verify that the two constructs that should be related are in
fact related. Convergent validity can be estimated using factor loadings and the reliability
coefficient. The AVE value should be at least 0.5 to ensure that the validity of the convergence
is achieved (Fornell & Larcker, 1981).
Further, all the items in the independent constructs were tested using Cronbach’s Alpha in order
to examine the internal consistency. The result indicated that the internal consistency of the
items was more than 0.60, more than satisfactory level as suggested by Churchill (1979).
Factor analysis provides the dimensionality of items, determining the number of factors to be
retained for each construct and reveals the variables that belong to a particular factor (Costello
& Osborne, 2005; Field, 2005). Among the available types of factor analysis, the principal
component analysis (PCA) and principal axis factoring (PAF) methods are the most favoured
for contemporary research (Fabrigar, Wegener, MacCallum, & Strahan, 1999; Field, 2005;
Yong & Pearce, 2013). In the present study, the entire dataset was analysed separately via the
PCA and PAF extraction methods, followed by both orthogonal (varimax and aquamax) and
oblique (direct oblimin and promax) rotation.
3.4.2.5 Ethical Considerations for the Survey
As explained above, the study involved the IRBM as the recruiting organisation. A formal
meeting was held in December 2013 at the IRBM between the researcher and the relevant
IRBM officer. During the meeting, the researcher explained the purpose of the study. The main
concern expressed by IRBM was the level of confidentiality for the survey participants. The
researcher explained that the questionnaire would be distributed by IRBM on behalf of the
researcher. This procedure would ensure that the respondents’ confidentiality would be
Page 83
66
maintained. In addition, each survey would include a cover letter that explained the purpose of
the study and outlined the instructions for completing the survey. The cover letter also
explained that participation in the study was on a voluntary basis, and the respondents were
free to withdraw from the study at any time. On the basis of these approaches, IRBM agreed to
cooperate in the dissemination of the survey. Ethical clearance was obtained from the School
of Nursing, Midwifery and Social Work Research Ethics Committee (clearance number
SWASH2015/1) (Appendix C).
3.5 Chapter Summary
This chapter has justified the research paradigm selected in this study and discussed the
research process and the justification for the methodology chosen. In addition, the chapter has
also explained the scoping study and the online survey employed as the main methods for
collecting the data. An overview of the e-government services involved in this study has also
been explained in this chapter. Next, the approaches used to develop the revised conceptual
framework are explained in the next chapter, and the how the survey was developed and
administered is explained in Chapter 5 in detail.
Page 84
67
Chapter 4 : Scoping Study
4.1 Introduction
This chapter discusses in detail the findings of the scoping study. The aim of the scoping study
was to identify the key issues associated with citizen’s usage of e-government services. The
main findings obtained from the interviews and analysed using a template analysis are
explained in Section 4.2. The results were then used to assess the applicability of the constructs
proposed in the initial model (see Figure 2.6). In addition, the subsections elaborate and
confirm the constructs that will be used to revise the model. The implications of the scoping
study such as revision of the conceptual model and development of the hypotheses are
explained in subsections 4.3.1 and 4.3.2. Finally, Section 4.4 presents the summary of the
chapter.
4.2 Main Findings
Based on the procedures and stages in the data collection and the data analysis as outlined in
Section 3.4.1.3, the following key findings emerged from the scoping study.
4.2.1 Relative Advantage
In the initial model, performance expectancy was proposed as one of the constructs to measure
how technology enhances user performance. Although some researchers treat relative
advantage and performance expectancy as the same (e.g., Carter & Bélanger, 2005;Venkatesh,
Morris, Davis & Davis, 2003), they should be measured differently because of the conceptual
distinctions between the two constructs. Relative advantage is defined as citizen’s belief that a
new system has benefits above and beyond the current system (Carter & Weerakkody, 2008),
while performance expectancy is defined as the degree to which user perceives that using
particular technology would improve their job performance (Venkatesh et al., 2003). In this
study, the current systems referred to offline services in the areas of income tax, property tax
and traffic fines. Based on the distinction, previous studies have shown that relative advantage
is a suitable construct with which to discuss the citizen’s usage of e-government systems
(Bhattacharya, Gulla & Gupta, 2012; Carter & Bélanger, 2005; Lean, Suhaiza Zailani,
Ramayah& Fernando, 2009). This indicates that higher level of perceived Relative Advantage
is associated with higher level of usage of acceptance on e-government services. This implies
Page 85
68
that the citizen will increasingly use the online service the more benefits it is perceived to offer
compared to the traditional ways. Participants explained that the online service was very useful
and superior compared to the traditional method (e.g. counter service).
“I find e-government services [income tax system] are useful… I think using e-
government services increases the effective use of my time… as well as… in handling
my e-government tasks… to me, as a busy man… I would prefer to interact with the
government through online.” [R8, male, early 40s]
As evident from the previous study, providing automated applications (e.g. automated
calculator and integration with online banking) on the government websites has been identified
in the literature as a factor that will attract people to use e-government services (Casaló,
Flavián, & Guinalíu, 2007). As the citizen perceived that e-filing service offered by the current
technology, one of the participants mentioned that by using the automated system on the
income tax website she was able to complete her needs quickly.
“…in e-filing system [income tax website], it is very helpful and efficient because there
was an automated tax calculation application…I just simply put the data required, and
in few seconds the system pops out with the accurate amount, I clicked the payment
button to pay and it is done, and for sure no more counter service after this.” [R11,
female, early 30s]
Another respondent recommended government authorities to also create an integrated
application or system with the private sector, especially the financial sector, in order attract
more citizens to use their services. This is very useful for senior citizen to complete their needs
without attending the counter. One of the senior citizen expressed this opinion:
“Used online payment [for property tax] because there is a link from the banking
system on their website. With this link, I am happy to pay my annual property tax as I
don’t need to go to the counter anymore… as it happened back in 90s. Just click and
done. Therefore, all government agencies have to consider this collaboration as a must
… to integrate their systems with other bodies of financial sectors.” [R6, male, early
50s]
Nowadays, collaboration with other agencies is became a common practice. G2B has brought
a new dimension to the government to deliver their services. For example, the public-private
Page 86
69
partnership in the e-Seva project in India has changed the way the service delivery by the
Andhra Pradesh government (World Bank, 2009). Through the project, most of the government
online services were managed and offered by a one-stop centre. It was very helpful as the
citizens could do many tasks in one visit. Similarly, Bhoomi Project in Karnataka India also
showed that a collaboration between the government and the private agency allowed the land
title to be obtained within 15 minutes, unlike the previous system that took a week (Bhatnagar,
2004).
The scoping study data indicated that most of the participants were more likely to refer
indirectly to the concept of relative advantage rather than performance expectancy. Therefore,
performance expectancy in this study was replaced by relative advantage as this was more
consistent with the respondents’ rationale for using e-services.
4.2.2 Effort Expectancy
In UTAUT, Effort Expectancy is defined that a citizen perceives e-government service is to be
easy to use (Venkatesh et al., 2003). A vast review of the literature asserted that effort
expectancy is one of the major factors that related to the technology adoption (Venkatesh et al,
2003; Davis et al, 1989). When the ease of using the e-government services was raised, most
participants agreed that the e-government services offered such a benefit to their daily tasks.
The beneficial aspects of the e-government services were expressed very clearly by many
participants in this study. Ease of use, convenience, and saving time were among the reasons
the participants preferred the e-government services. Most of the participants perceived that
these factors made them prefer the convenience of accessing government services online, as
expressed in the following statements:
“Very pleased with it [e-filing on the income tax system] and it is easy to perform the
task. Generally, I used it to get the information on the amount that has to be paid. I like
it because time-saving, convenient, the information is complete and accurate, current
and always updated.” [R4, female, late 30s]
“Used it [e-assessment on the property tax system] for getting information on the
amount of property tax to be paid. Also, to update information if required.” [R1, male,
late 40s]
Page 87
70
The result is aligned with several studies that confirmed a positive relationship between effort
expectancy and e-government usage. A study by Wu, Tao, and Yang (2007) showed that effort
expectancy significantly influenced the citizen’s usage of 3G mobile telecommunication in
Taiwan. Similarly, Effort expectancy has also been shown to be the main predictor of the
intention to adopt e-filing among Malaysians (Hassan & Palil, 2012; Teck Hong & Yin-Fah,
2012).
Effort Expectancy was found to be a vital factor for some of the participants to use the e-
government. But, the respondents were reluctant to use other e-services because of several
reasons such as poor reliability of the system and complex website content. For example, one
of the participants was reluctant to use transactional online service because of his bad
experience previously when dealing with another government agency. He said:
“I know about the online service [e-payment on the property tax system] and for sure I
am aware with its benefits such time-saving convenience but not using it due to the past
experience. During the road tax renewal that cost me a lot of time because I have to
spent more time to find what I am looking on their website. It’s difficult for me as I need
to settle it quickly…I appreciated what they did to make their website looks nice, with
full of animations, colourful, but you have to remember, we are not a tourist... I log to
your website because I have to do so and please make is easy to the user… ”[R7, male,
late 40s].
The statements by the participants indicated that they found using the current technology was
convenient, particularly to complete their daily tasks. The respondents also revealed that this
technology was significantly related to the citizens continued use of e-government services as
long as the service was well-maintained and all the information was updated. Previous research
identified frequently updated of the website as the key factor in e-government usage (Ghani &
Said, 2010). These findings were also congruent with other e-government study in the
developing countries (Rehman et al., 2012; Rokhman, 2011). For example, Ease of Use was
found to be a significant factor that influenced the citizen to use the transaction service provided
by the Pakistan Ministry of Railways (Rehman et al., 2012).
Page 88
71
4.2.3 Social Influence
For the purposes of the present study, Social Influence referred to the degree to which the
citizen believes that others believe he or she should use e-government services. Hence, in
relation to this study, citizen’s beliefs regarding Social Influence were expected to have a
positive relationship with the actual usage of e-government services.
One important issue that most participants mentioned was that peer influence was positively
significant in determining their usage of e-government services. When the participants in the
present study were asked about the influence of peers on their e-government usage, most of
them agreed that the influence of friends, family and colleagues was a factor that encouraged
them to use e-government services. The following two excerpts are typical examples of the
views explained by several participants:
“At first, I did not use the online system because of the bad experience of using other
systems previously; the website is incomplete, not updated, and doubtful over its data
security. However, one day during my lunch, my friend mentioned about the benefits of
e-payment service [property tax] that recently provided by the local authorities. After
that, I had tried and until today, I have not missed to pay my property tax through
online.” [R12, female, early 30s]
“Previously, I believed that I could explore the system [traffic fines] with my own effort.
However, it takes time to use it. Then, finally I asked my family members who were
familiar with that system, based on his help, everything done quickly and I am not
hesitating to use it in for the next year.” [R3, female, late 50s]
A study by AlAwadhi and Morris (2009) found that the influence of peers on the intention to
use technology has a greater impact than the influence of other groups (e.g. employer or
government agency). However, when the participants were asked about other factors that had
a major impact on their usage, especially their use of different e-government services, they
mentioned advertising and the government’s role as a service provider. Having experienced
clear instructions from the government service provider about how to use e-services, one of the
participants believed that this effort had encouraged her to use e-government services.
Page 89
72
“Instruction is clear, easy to follow step by step… I and most of my friends… were
mostly influenced by the instruction given by IRBM [income tax office] which
encourages the use of e-filing.” [R6, male, early 50s]
Furthermore, other participants in this study mentioned that the government could potentially
encourage citizens to use e-government through their tax education programs3:
“The usage is mostly influenced by the instruction given by IRBM during their tax
education program to my office, which encourages not just me, but most of my friends
really keen to use e-filing.” [R5, female, early 40s]
Most of the participants agreed that their use of e-government services depended mostly on the
government’s initiatives in promoting the services. As mentioned by one of the participants,
they did not know about an e-government system until they saw the advertisements on
television:
“As a new user… I believed… my intention to use e-government services were
influenced by advertising through the electronic media and newspaper and absolutely
I used MyEG for the first time after watching the advertisement on TV.” [R11, female,
early 30s]
One of the participants suggested that the government should conduct a promotion through
greater collaboration with the private sector. The interviewee stated:
“People should see the online system [income tax system] as an opportunity to change
the life style towards a more technologically savvy community. However, first of all, I
think the government should focus more on promoting their e-services… not just only
through the government owned mass media, but also through private owned mass
media (e.g. ASTRO, TV3 -Pay-per view channels).” [R7, male, late 40s]
Therefore, besides the peers’ influence, advertisements and the government’s role were also
identified as key factors of Social Influence. This finding is similar to the finding by Norazah
3Tax education programmes are designed as wide-scale activities where the main purpose is to provide
instructions, exposure and awareness to the employers and taxpayers.
Page 90
73
Mohd Suki and Ramayah (2010) who reported that external social influence and
interpersonal/peer social influence have positive relationships with e-government usage among
citizens.
4.2.4 Perceived Trust
An important issue about e-government implementation particularly in the developing
countries is trust (Al-Adawi, Yousafzai & Pallister, 2005; Pavlou, 2003; Welch, Hinnant &
Moon, 2005). The concept of trust has been studied extensively in many fields, particularly in
technology adoption. Moreover, several models were also proposed to explain the trust in e-
government (Horst et al., 2007; Warkentin et al., 2002). However, as mentioned by Gilbert,
Balestrini, and Littleboy (2004), the concept of trust in e-government is not clear as it depends
on the object that it involves. Hence, several studies were specifically related the trust in e-
government with several objects such as; e-government website (C. W. Tan, Benbasat, &
Cenfetelli, 2008), online tax filing and payment system (Hung et al., 2006), internet and state
government (Carter & Bélanger, 2005) and information quality and service quality (Teo,
Srivastava, & Jiang, 2008). For the purpose of this study, trust in e-government is related to
the trust on service providers (Carter & Bélanger, 2005; Horst et al., 2007; Welch et al., 2005).
Hence, as the government is the provider of the services, citizen perceptions of trust on the
government are essential for trust in e-government (Papadopoulou, Nikolaidou, & Martakos,
2010).
In the scoping study interviews, the participants showed a generalised sense of trust in e-
government services. The participants stated that their good experiences with the services made
them feel confident in the online services provided by the current government. As mentioned
by the participants, they trusted online services because they had been using the systems for
several years and had never experienced any failure. They said:
“I used online services for almost 3 years… never encountered any problem during the
transaction… so… any services provided through the Internet by the government are
reliable.” [R5, female, early 40s]
“I was in the UK for almost 4 years. At that time, I never thought about any issues on
online services because I really trust them. When I come back to Malaysia, I still used
e-government services [e-payment on property tax system] and I could say, my
Page 91
74
experience overseas had an influence on my level of confidence and trust to the e-
government services.” [R12, female, early 30s]
Citizens’ lack of trust regarding benefits of e-government contributed to a lower rate of
adoption. Issues such as systems easily hacked, scammers, and credit card fraud activities were
the major challenges for e-government adoption. According to the interviewees, lack of trust
because of these problems was one of the barrier factors in adoption of e-government services.
This was aligned with a report by the IRBM (2012) that mentioned the percentage of usage of
their online payment was low as the citizens preferred face-to-face visits than paying online.
In this regard, when the question on trust was asked, one interviewee stated:
“....many citizens do not fully trust the e-government services supplied by the
government if the current government failed to show us their programme to combat the
online crimes such as fraudulent activities. How come you will convince with the e-
services if every day, the prime news reported the case of scammers or any similar
activities?... and sadly, the cases remained unsolved. This is not about whether the
services offered by private or public sectors, the issue was, what is the government
roles? I don’t want to be the next victim. Therefore, I would prefer to solve those
payments by directly contacting the respective department”. [R7, male, late 40s]
Citizen confidence in the ability of government agency to provide online services is vital to
determine whether the citizens use or do not use the e-services. In has been found that, a low
level of citizens’ trust on the services provided by the government not only leads to a low level
of confidence with technology, but also to the government itself (Thompson, Srivastava, &
Jiang, 2008). Therefore, it was summarised that the high degree of trustworthiness was related
to the high usage of e-government services.
4.2.5 Perceived Risk
The literature identified that one of the factors that will hinder citizens from using e-
government services was perceived risk (Kim, Ferrin, & Rao, 2008). It is common for the
citizens to not use online transaction because the perceived risk of using the online mode may
be higher compared to the conventional mode. In addition, the lack of advanced and secure
system to protect the users’ financial details remained one of the main reasons most of the
citizens refrained themselves from using any online services offered by the government. In this
Page 92
75
study, perceived risk is defined as a citizen’s belief about the potential uncertain negative
outcomes from the e-government service use (Kim et al., 2008).
In general, perceived risk is related to the faults caused by the technological errors (e.g.,
duplicate purchase and an incomplete payment due to the Internet failure) and low security of
an online transaction (Kim et al., 2008). In the present study, it was clear that, for most of the
participants, the use of e-government services was influenced by their perception on the
security of the e-services. This view was expressed by an interviewee as follows:
“I know about that particular service such as payment the traffic fines and renew the
driving licence, through online [Royal Malaysian Police Summonses alert], but I think
that the website is quite complex and I felt insecure. Importantly, I am still doubtful
over the level of security provided by the service provider.” [R10, female, early 50s]
Although some participants were aware of the technological safeguards (e.g., data encryption
and authentication mechanisms), some of the participants mentioned that they still feared that
someone could steal their financial information during the online transaction, especially if a
large amount of money was involved. For example, one participant commented on the risk in
the current technologies for online transactions. But, he said he would continue using any e-
government service as long as the systems were reliable:
“For small amount… yes, I’ll do it online… but… I’m a bit cautious in making
transactions when involving a large amount of money… but... as long as government
concerns about their Internet security, well maintained, and good protection… for me…
that’s enough to make the Internet safe and reliable to transact with e-government
services.” [R7, male, late 40s]
Therefore, perceived risk was significantly related to users’ decision on e-government usage.
It was thus clear that the citizen’s perception on risk was an essential factor to be included in
the proposed model as it could be expected that this factor would positively influence the actual
usage of e-government services.
Page 93
76
4.3 Implications of the Scoping Study
Based on the scoping results, it shows that several implications have been changed particularly
on introducing new concepts and new factors into the revised conceptual framework and from
the new conceptual framework the list of questionnaires was generated.
4.3.1 Revised Conceptual Framework
As a result, from the scoping study, the pre-identified and revised concepts are shown in Table
4.1. From the analysis of the scoping study’s data, it was concluded that several constructs in
the UTAUT model (e.g., Performance Expectancy, Effort Expectancy, and Social Influence)
and other constructs (Perceived Trust and Perceived Risk) were identified and applied to
examine the factors influencing the citizens’ use of e-government services in Malaysia.
Relative Advantage was identified as a replacement for Performance Expectancy. In addition,
the revised conceptual model was revised as Perceived Trust in the e-government and
Perceived Risk. This was because, from the interview, most of the participants were really
concerned about trustworthiness and risk of the systems.
Table 4-1: Pre-identified and revised concepts Pre-identified concepts Revised concepts
Performance Expectancy Relative Advantage
Effort Expectancy Effort Expectancy
Social Influence Social Influence
Trust in the Internet Perceived Trust
Trust in Government
Quality of Website Perceived Risk
4.3.2 Generating of Hypotheses
For the purposes of this study, relative advantage was defined as the extent to which citizens
perceive their interaction with e-government services to be better than the traditional methods.
Relative Advantage may include efficiency (e.g., speedy login, fast download, and quick
upload of documents) and effectiveness (ease of use and convenience) of the system
(Bhattacharya et al., 2012). Various literature have suggested relative advantage is supposed to
be a significant construct associated to the adoption of e-government services (Carter and
Page 94
77
Belanger, 2005; Gilbert et al., 2004; Shareef et al., 2007). In another study, Sang, Lee, and Lee
(2010) believed that using e-government among the teachers would enhance their efficiency in
gathering information and in interacting with the government agencies. The positive and
significant impacts of Relative Advantage on behavioural usage towards the e-government
services have been examined in a number of studies (Lean et al., 2009; Rana et al., 2013).
Similarly, Relative Advantage was identified as a significant factor affecting intention to use
e-government (e-licensing) service in Penang, Malaysia (Pitchay et al., 2016). Meanwhile,
Rana et al. (2013) found a relatively weak though significant influence of Relative Advantage
on adoption intention among the OPRGS users in India. Based on the interviews, it was
confirmed that the participants were highlighted more on Relative Advantage as their perceived
that the e-government services were much better than previous method of service delivery. It
is worth to mentioned that perceived relative advantage had a direct positive relationship with
technology usage; the more unfriendly or inaccessible the e-government service, the lower the
intention to use the service. Hence, this study hypothesised that:
Hypothesis 1: Relative Advantage has a positive influence on the usage of an e-government
service.
In the UTAUT model, effort expectancy is the consistent factor recognised by scholars to
explain the citizen’s use of technology (AlAwadhi & Morris, 2008; Al-shafi & Weerakkody,
2010; Carter & Bélanger, 2005; Israel & Tiwari, 2011; Kumar, Mukerji, Butt & Persaud, 2007;
Warkentin, Gefen, Pavlou & Rose, 2002). The scoping study result found a positive correlation
between Effort Expectancy and e-government usage. In this study, the participants were
pleased with e-government services as long as the online services provide are easily to access,
convenience and frequently updated. These features encourage users to continue their adoption
and could potentially enhance their usage on e-services (Kumar et al., 2007). One example is
the initiative taken by the Brazilian Government to provide a Citizen Service Centre
(government portal) in shopping malls where citizens could renew their driving licenses and
passports and collect birth certificates (Bhatnagar, 2002). This study hypothesised that:
Hypothesis 2: Effort Expectancy has a positive influence on the usage of an e-government
service.
Social influence has been discussed in the literature as a direct determinant of behavioural
intention ( Mohd Suki & Ramayah, 2010; Oye, Iahad & Ab. Rahim, 2012; Yu, 2012).
Page 95
78
Similarly, previous studies that examined e-government usage in developing countries
(Alshehri, Drew, & Alghamdi, 2012; Mei-Ying et al., 2012; Rana, Dwivedi, Lal, Williams, &
Clement, 2017; Teck Hong & Yin-Fah, 2012) have empirically demonstrated that behavioural
intention towards e-government use was influenced directly by peer’s feedback. They provided
an evidence of the significant effect of SI on e-services usage. It has been noted that the more
the positive feedback by peers’, the more likely the citizens would adopt the e-services
(Andersen et al., 2010; Kurfali et al., 2017; Tan & Leby Lau, 2016). Similarly, a study by Rana
and Dwivedi (2015) found that Social Influence was the significant predictor of behavioural
intention towards the OPCRS system in India. The study showed that influence from
colleagues, friends, and family members enhanced an individual’s understanding on the
technology, but also influenced their intention to use it. Based on the interviews, most of the
participants agreed that social influence by peers and government would be one of the factors
influencing their usage. Hence, this study hypothesised that:
Hypothesis 3: Social Influence has a positive influence on the usage of an e-government
service.
Citizens’ trust leading adoption on use of e-government services. Citizens confidence in the
ability of the government to provide a good service is imperative for attract to the e-government
use. Failure to ensure the privacy and security of personal information in government portals
will hinder the provision of fully electronic services (Bélanger & Carter, 2008). Based on the
interviews, it was identified that the citizen trust is depends on how the government deal with
the fraudulent crimes. An increasing lack of confidence in the government’s ability to
implement online services may cause a lack of support among citizens. Hence, in this study,
the same relationship was expected to occur, with the citizen’s usage of e-government services
based on the extent to which he or she trusted the service. Thus, this study hypothesised that:
Hypothesis 4: Perceived Trust has a positive influence on the usage of an e-government service.
The G2C relationship requires governments to provide high quality of protection to the user’s
personal details that fulfil citizens’ expectations or demands. Horst et al., (2007) and Khattab
et al., (2015) found that the perceived risk factor was commensurate with user satisfaction with
e-government services. Perceived Risk has also been found to be an important factor in
explaining technology non-use by citizens (Belanger & Carter, 2008; Karavasilis, Vrana, &
Zafiropoulos, 2016; Moodley & Govender, 2016). Furthermore, in the context of e-commerce,
Page 96
79
Perceived Risk was identified to be negatively significant in influencing intention to use of
internet banking (Al-Qeisi & Al-Abdallah, 2013). Previous studies (Bélanger & Carter, 2008;
Hussein et al., 2011; Khattab et al., 2015) found that the higher the level of Perceived Risk, the
less likely the citizens were to use e-government, and the construct was identified as one of the
significant constructs in the context of e-government research (Rana et al., 2013). Similarly, a
new Unified Model of E-government Adoption (UMEGA) extended the UTAUT model by
adding Perceived Risk as a specific construct (Dwivedi et al., 2017). In Malaysia, Perceived
Risk was found to be negatively and significantly associated with MyEPF service among the
taxpayers (Alateyah et al., 2012). During the scoping study phase, when asked about the risk
on e-government services, most of the participants mentioned that this factor was one of the
factors that influenced their usage of e-government services. Hence, this study hypothesised
that:
Hypothesis 5: Perceived Risk has a negative influence on the usage of an e-government service.
The revised conceptual framework of Figure 2.4 is shown in Figure 4-1. It is noteworthy to
mention, as the study involved six e-government services, the model was repeated six times to
test the hypotheses developed according to the services.
Page 97
80
Figure 4-1: Revised conceptual model for each of e-services
H4
Relative Advantage
Expectancy
Effort Expectancy
Behavioural Usage Social Influence
Perceived Risk
Perceived Trust
H2
H5
H3
H1
Page 98
81
4.4 Chapter Summary
This chapter has discussed the analysis approach employed for the interview data. The chapter
has also presented the main findings from the template analysis. In relation with the results, the
revised conceptual framework has also been presented and discussed in this chapter. Finally,
the hypotheses have been developed based on the revised conceptual framework.
Page 99
82
Chapter 5 : Data Analysis
5.1 Introduction
This chapter presents the findings of the online survey. As described in the previous chapters,
this study analysed the usage and the attitudes towards usage of six e-government services
offered by different government agencies. As the survey items were identified and generated
based on the revised conceptual framework (Figure 4-1), the development of measurement
items, and the survey format are first described, followed by the sections that describe data
coding, and missing data. Sections 5.6 and 5.7 present the descriptive statistical analysis of the
demographic data of the respondents and the frequency of usage of e-government services. The
subsequent sections discuss the dimensionality and reliability in order to get reliable data. The
factor analysis results used to assess the relationship of items to constructs are discussed in
Section 5.9. Finally, multivariate regression analysis as results identify the major factors
associated with the outcome variables (i.e., actual usage of e-government information and
transaction services for income tax, property tax, and traffic fines). This chapter closes with a
summary of the results.
5.2 Development of Measurement of Survey Items
Survey measurement items were identified based on the constructs in the revised conceptual
model (as discussed in Chapter 4). As suggested by Straub (1989), a researcher is advised to
use previously-validated instruments especially when employing survey methods. Therefore,
the questionnaire in this study largely adopted previously-validated constructs in the
information systems field, but modified for the current study context.
The measurement items for the outcome variable, namely use of e-service, were developed as
a dichotomous variable. E-government studies in the literature vary in the use of scales to
measure e-government usage. For example, Calista, Melitski, Holzer, and Manoharan (2010)
and West (2004) used a dichotomous variable to measure the user’s evaluation of e-government
websites. Similarly, in a study investigating the usage of multiple-purpose e-services, Nam
(2014) measured the dependent variable by aggregating binary variables (1 for “Yes” or 0 for
“No”). This method of measurement for e-government adoption has also been used in
developing countries (Rokhman, 2011). In this study, to measure the use of e-filing services in
income tax, the question was “In the past two (2) years, did you lodge your income tax return
Page 100
83
online?” similarly, the question for e-payment in income tax services was “In the past two (2)
years, did you pay your income tax bill online?”. The details on the measurement scales for
income tax services are provided in Table 5-1.
Each construct was measured by three items (see Appendix D). The items were categorised as
existing and new predictors. The existing constructs in this study were Relative Advantage
(RA), Effort Expectancy (EE) and Social Influence (SI). Measurement items for existing
predictors were adopted from the well-established, the Unified Theory of Acceptance and Use
of Technology (UTAUT) model. While the new predictors that were discovered from the
scoping study and were added to the framework were Perceived Risk (RISK) and Perceived
Trust in e-government (TRUS). In the current study, the design of the measurement scales of
RA was based on the established measurements developed by Moore and Benbasat (1991). For
example, to measure RA, they provided several items such as “Using a PWS enables me to
accomplish tasks more quickly” and “Using a PWS improves the quality of work I do”. For the
purposes of the present study, the wording of each item in the survey was modified to fit the
context of the actual usage or user’s experience. For example, the item to measure the
accomplishment of tasks quickly in the e-filing system was “I think that lodging my income
tax return online accomplishes the task more quickly”, was repeated as “I think that paying my
income tax return online accomplishes the task more quickly” for the e-payment section.
Meanwhile, the measurement items for EE and SI were adopted from the works by Venkatesh,
Morris, Davis, and Davis (2003) and Mohd Suki and Ramayah (2010). Both of these studies
were selected as guidelines. The study by Venkatesh et al. was the original version of the
UTAUT model, and the study by Mohd Suki and Ramayah was chosen because it was
implemented in Malaysia and was helpful in designing the survey as the study had the same
context with this doctoral study.
While, new predictors, are those items that were discovered from the scoping study and were
added as new predictors in the conceptual model. New constructs have been measured and
validated by previous studies in the IS field (Alsaghier et al., 2009). The interview results
revealed two predictors that might influence the citizens’ usage on e-government services. In
this doctoral study, risk is defined as users’ concern about possible negative consequences on
using an e-service, while trust in e-government is defined as the degree of citizens’ belief that
the word, promise, verbal or written statement of the government can be relied upon (Rotter,
Page 101
84
1967). To measure the Perceived Risk and Perceived Trust predictors, items from (Alsaghier
et al., 2009) were utilised.
The measurement items to measure Perceived Trust in e-filing included: “I am confident that
it is safe and secure to lodge an income tax return online”, “IRBM can be trusted to process
online tax returns reliably” and “I am more comfortable lodging my income tax return with
someone rather than online”. Meanwhile for the Perceived Risk construct, the measurement
items for the e-filing system were “There is a considerable risk involved in lodging an income
tax return online”, “Overall, it is not safe to transmit sensitive information by lodging an
income tax return online” and “Lodging an income tax return online would take too much
time”. All the independent variables were measured using Likert scale from 1 to 5, with 1
indicating “strongly disagree” and 5 indicating “strongly agree”.
Page 102
85
Table 5-1: Operational defintions and measurement items
No. Predictor Operational Definition
Reference Measurement item Income tax Property tax Traffic fines
e-filing e-payment e-assessment e-payment e-checking e-payment 1 Relative
Advantage (RA)
The level to which citizens perceive interaction with the government through e-government services, superior to traditional methods
(Moore & Benbasat, 1991)
Compared to lodging my tax return over the counter, I think that lodging my income tax return online would be quicker.
Compared to paying my tax return over the counter, I think that paying my income tax online would be quicker.
Compared to assessing my property tax over the counter, I think that assessing my property tax liability online would be quicker
Compared to paying my property tax over the counter, I think that paying my property tax liability online would be quicker.
Compared to checking my traffic fines over the counter, I think that checking the traffic fines online would be quicker.
Compared to paying my traffic fines over the counter, I think that paying the traffic fines online would be quicker.
The disadvantages of lodging an income tax return online far outweigh the advantages.
The disadvantages of paying an income tax return online far outweigh the advantages.
The disadvantages of assessing the property tax liability online far outweigh the advantages.
The disadvantages of paying the property tax liability online far outweigh the advantages.
The disadvantages of checking the traffic fines online far outweigh the advantages.
The disadvantages of paying the traffic fines online far outweigh the advantages.
Compared to lodging my tax return over the counter, I think that lodging my income tax return online would be easier.
Compared to paying my tax return over the counter, I think that paying an income tax return online would be easier.
Compared to assessing my property tax over the counter, I think that assessing the property tax liability online would be easier.
Compared to paying my property tax over the counter, I think that paying the property tax liability online would be easier.
Compared to checking my traffic fines over the counter, I think that checking the traffic fines online would be easier.
Compared to paying my traffic fines over the counter, I think that paying the traffic fines online would be easier.
2 Effort Expectancy (EE)
Degree of ease with which users address e-government services
(Venkatesh et al., 2003)
I would find it easy to lodge an income tax return online.
I would find it easy to pay an income tax return online.
I would find it easy to assess the property tax liability online.
I would find it easy to pay the property tax liability online.
I would find it easy to check the traffic fines online.
I would find it easy to pay the traffic fines online.
It is easy for me to learn to lodge
It is easy for me to learn to pay
It is easy for me to learn to assess
It is easy for me to learn to pay the
It is easy for me to learn to check
It is easy for me to learn to pay the
Page 103
86
an income tax online.
income tax online.
the property tax liability online.
property tax liability online.
the traffic fines online.
traffic fines online.
Lodging my tax return online would be clear and understandable.
Paying my tax return online would be clear and understandable.
Assessing my property tax liability online would be clear and understandable.
Paying my property tax liability online would be clear and understandable.
Checking the traffic fines online would be clear and understandable.
Paying the traffic fines online would be clear and understandable.
3 Social Influence (SI)
Users’ perception of significant others requiring them to use e-government
(Mohd Suki & Ramayah, 2010) (Taylor & Todd, 1995)
People who are important to me think that I should lodge my income tax return online.
People who are important to me think that I should pay my income tax bill online.
People who are important to me think that I should assess my property tax liability online.
People who are important to me think that I should pay my property tax liability online.
People who are important to me think that I should check the traffic fines online.
People who are important to me think that I should pay the traffic fines online.
I read/saw advertisements that lodging an income tax return online is a good way to interact with the income tax office.
I read/saw advertisements that paying an income tax online is a good way to interact with the income tax office.
I read/saw advertisements that assessing the property tax liability online is a good way to interact with the local authority office.
I read/saw advertisements that paying the property tax liability online is a good way to interact with the local authority office.
I read/saw advertisements that checking the traffic fines online is a good way to interact with the RMP office.
I read/saw advertisements that paying the traffic fines online is a good way to interact with the RMP office.
IRBM encourages citizens to lodge their income tax return online.
IRBM encourages citizens to pay their income tax online.
Local authority office encourages citizens to assess their property tax liability online.
Local authority office encourages citizens to pay their property tax liability online.
RMP encourages citizens to check their traffic fines online.
RMP encourages citizens to pay their traffic fines online.
4 Perceived Risk (RISK)
Users’ felt uncertainty regarding possible negative consequences of using a product or service
(Alsaghier et al., 2009)
There is a considerable risk involved in lodging an income tax return online.
There is a considerable risk involved in paying an income tax bill online.
There is a considerable risk involved in assessing the property tax liability online.
There is a considerable risk involved in paying the property tax liability online.
There is a considerable risk involved in checking the traffic fines online.
There is a considerable risk involved in paying the traffic fines online.
Overall, it is not safe to transmit sensitive information by
Overall, it is not safe to transmit sensitive information by
Overall, it is not safe to transmit sensitive information by
Overall, it is not safe to transmit sensitive information by
Overall, it is not safe to transmit sensitive information by
Overall, it is not safe to transmit sensitive information by
Page 104
87
lodging an income tax return online.
paying an income tax online.
assessing the property tax liability online.
paying the property tax liability online.
checking the traffic fines online.
paying the traffic fines online.
Lodging an income tax return online would take too much time.
Paying an income tax online would take too much time.
Assessing the property tax liability online would take too much time.
Paying the property tax liability online would take too much time.
Checking the traffic fines online would take too much time.
Paying the traffic fines online would take too much time.
5 Trust in e-government (TRUS)
The degree of citizens’ belief that the e-government services will perform to reduce the complexity and uncertainty of living environment
(Alsaghier et al., 2009)
I am confident that it is safe and secure to lodge an income tax return online.
I am confident that it is safe and secure to pay an income tax return online.
I am confident that it is safe and secure to assess the property tax online.
I am confident that it is safe and secure to pay the property tax liability online.
I am confident that it is safe and secure to check the traffic fines online.
I am confident that it is safe and secure to pay the traffic fines online.
IRBM can be trusted to process online tax returns reliably.
IRBM can be trusted to process online tax payments reliably.
Local authority can be trusted to process online property tax reliably.
Local authority can be trusted to process online property tax payments reliably.
MyEG can be trusted to process online traffic fines reliably.
MyEG can be trusted to process online traffic fines payments reliably.
I am more comfortable lodging my income tax return with someone rather than online.
I am more comfortable paying my income tax return with someone rather than online.
I am more comfortable assessing my property tax with someone rather than online.
I am more comfortable paying my property tax with someone rather than online.
I am more comfortable checking my traffic fines with someone rather than online.
I am more comfortable paying my traffic fines with someone rather than online.
Actual usage (AU)
The citizens’ actual experience of the system
•
(Rokhman, 2011)
In the past two (2) years, did you lodge your income tax return online?
In the past two (2) years, did you pay your income tax return online?
In the past two (2) years, have you ever assessed your property tax liabilities online?
In the past two (2) years, did you pay your property tax liabilities online?
In the last two (2) years, have you used the MyEG portal to check your traffic fines statement?
In the last two (2) years, have you used the MyEG portal to pay your traffic fines?
Page 105
88
5.3 Questionnaire Development
The questionnaire comprised five sections (see Appendix D) that were developed based on the
revised framework. Section A of the survey explained the purpose of the study and this section
also provided the participant information sheet and explained the participant’s consent. The
submission of the survey was regarded as the participant’s consent to participate in the study,
and this was clearly stated in the main web page. Section A also explained that the respondent’s
identity would be anonymous in order to ensure confidentiality.
Sections B, C and D involved questions relating to each of the three service areas investigated
in the study namely; income tax, property tax and traffic fines. As such, each section used the
same set of questions and consistent structure, but modified for each service area. Each section
started with a question designed to identify whether or not that service area was relevant to the
respondent. For example, the questions “At any point in the last two (2) years have you owned
any property that is subject to property tax?” was asked for the property tax section (Section
C) and “At any point in the last two (2) years, have you received a traffic offence notice?”was
asked for the traffic fines section (Section D). Respondents who answered “No” were
exempted from answering the remainder of that section as it was not relevant to them and they
were instructed to move to the next section. The remainder of each section asked several
questions designed to measure each construct in relation to each e-information and e-payment
services within that service domain. At the end of each section, the respondents were asked
about their actual use of online service (informational and transactional) in the past two years
(this was the dependent variable).
Section E collected respondents’ demographic information including gender, age,
employment, ethnicity, and respondent’s experience on computer. As this study focused on
Selangor State, the local authority to which respondents belonged was also included in the
demographic questions as it related to the property tax being local authority administered.
These data were also collected for the population representativeness in Selangor.
Overall, the survey contained 121 questions, with 36 questions each for Sections B, C and D,
while the demographic section in Section E contained 13 questions. The survey was
administered in Malay.
Page 106
89
5.4 Response Rate and Data Coding
Of the 1,142 survey invitations distributed in this research by the IRBM as the gatekeeper, 363
responses were received within two months. Of the 363 responses, 49 were rejected because
the respondents declined to participate, resulting in a total of 314 usable responses or 32%
usable response rate. The data was collected through the web survey tool namely SurveyGizmo
(surveygizmo.com).
Score reversal is used if there are negative items on the survey. In this study, for example, the
negative item for Relative Advantage construct in income tax was: “The disadvantages of
lodging an income tax return online far outweigh the advantages”. Meanwhile, the negative
item for Perceived Trust was: “I am more comfortable lodging my income tax return with
someone rather than online”. Reverse coding requires the numerical scoring scale runs in the
opposite direction. Based on the example above, the highest and the lowest scores are
substituted for each other, and vice versa, as shown in Figure 5-1.
Original Score Reversed Score
1 5
2 4
3 3
4 2
5 1
Figure 5-1: Reverse scoring in a 5-point scale
5.5 Missing Data
Identifying the patterns of missing data was important in order to determine the correct
approaches to deal with particular missing data. Data was screened and most items had less
than 1% missing data. Only 19 items had missing data of greater than 1% (see Appendix E,
Table E-1). As the significant p-value of the missing data was less than 5%, the missing values
were treated as missing at random (MAR) (Field, 2005). According to Cohen, Cohen, West,
and Aiken (2013), missing data with a minimal amount (up to 10%) will have no effect on the
Page 107
90
interpretation of the findings. As this study only had minimal missing data, the primary method
used in this study was to replace missing values with mean substitution, which is a common
method used to treat a minimal number of missing data. In this method, the missing data is
replaced with the mean responses for each variable (Hair, Black, Babin, & Anderson, 2010).
5.6 Demographic Profiles of Respondents
Descriptive and frequency statistics were calculated to gain insights into the demographic
profiles of the respondents who participated in the survey. The results indicated that the
demographic characteristics of the respondents in Selangor were slightly different from those
reported by the Department of Statistics (2016). As shown in Table 5-2, in terms of sex, there
was a slightly larger number of females (55%) compared to males (45%), which is close to the
Selangor population (49% and 51%, respectively) in Table 5-3.
The age range of the respondents was between 23 and 63 with 58% between 31 and 40 years
old, while those of between 20 and 30 years of age accounted for 18%. Compared to the report
by the Department of Statistics (2016), the percentage of respondents in the age groups between
31 and 40 years old was higher than Selangor (37%), while the percentage of respondents of
the age groups between 20 and 30 years of age was lower (26%) (see Table 5-4).
Eighty-two percent of the respondents were Malay. The remaining respondents were non-
Malays identified as Siamese, Chinese, Indian, and non-Bumiputera. The Department of
Statistics Report (2016) was used as the benchmark for comparison in terms of ethnicity. It
reported that, in Selangor, the percentage of Malays was 59%, whilst non-Malays were 41% of
the population, as shown in Table 5-3. In terms of job, it was categorised into two
(1=Government servant and 0=Non-government servant) because the number of respondents
who worked in non-government sectors was small. In the present study, 72% of the respondents
were government servants, showing a slight over-representation compared to the 54% of the
Selangor population as a whole, as reported in the Economic Plannning Unit of Selangor
(2011).
In terms of the type of local authorities, 52% of the respondents reported that the municipal
council was the relevant local authority, and 27% of the respondents reported that the city hall
was their relevant local authority. Those respondents who reported the district council as their
local authority comprised 21%. The Department of Statistics (2016) was used for comparison
Page 108
91
purpose. The report stated the majority of the population (see Table 5-5) reported that the
municipal council was their relevant local authority, accounting for 68%, followed by city
council (23%) and district council (9%). Although the percentage between the survey and the
population was slightly different, the comparison suggested that the present survey provided a
good representation of local authority.
Table 5-2: Demographic profiles of respondents Demographic Frequency
(n=294) Percentage
% Sex
Male Female
133 161
45 55
Age 20–30 31–40 41–50 51 above
54 171 49 20
18 58 17 7
Ethnic group Malay Non-Malay
240 54
82 18
Experience on the Internet Less than 10 years 11 to 15 years 16 years and more
55 70 169
19 24 57
Jobs Government Non-government
213 81
72 28
Local authority (n= 183)
City Municipal District
49 95 39
27 52 21
Table 5-3: Population in Selangor, 2016 Demographic Frequency
5634.4 (‘000) Percentage
(%) Sex Male Female
2861.2 2773.2
51 49
Ethnic Malay Non-Malay
3326 2308
59 41
Jobs Government 3042 54 Non-government 2591 46
Source: Department of Statistics Malaysia (2016)
Page 109
92
Table 5-4: Population by age in Selangor, 2016 Age Frequency
5634.4 (‘000) Adults
(%) Less than 20 21–30 31–40 41–50 51 above
1879.1 969.9 1402.6 718.1 664.7
26 37 19 18
Source: Department of Statistics Malaysia (2016)
Table 5-5: Population by local authority in Selangor, 2016
Source: Department of Statistics Malaysia (2016)
5.7 Frequency of Usage and Non-usage of E-Services by System
This section discusses the categorical inclusiveness of two types of e-government services
namely e-information and e-payment. Descriptive and frequency analyses were conducted to
gain insights into the usage of e-information and e-payment services. A total of 294
respondents were classified as citizens whose annual incomes incurred an income tax liability.
Of this number of respondents, 92% and 76% had used e-filing and online payment services,
respectively. Moreover, 183 respondents reported that they owned a property that was
subjected to property tax, with 43% of them had used e-assessment and 41% of them for online
payments. For the traffic fine system, 116 respondents had received a traffic offence notice in
the last two years. The proportion of these respondents who had checked a traffic fine online
(67%) was greater than the number of respondents who had made a payment online (45%). As
No. Local Authority Type of Local Authority
Population in 2010
Percentage (%)
1 Majlis Bandaraya Shah Alam City Council 481,845 23 2 Majlis Bandaraya Petaling Jaya City Council 502,913 3 Majlis Perbandaran Subang Jaya Municipal Council 660,967 68 4 Majlis Perbandaran Kajang Municipal Council 616,647 5 Majlis Perbandaran Selayang Municipal Council 462,412 6 Majlis Perbandaran Klang Municipal Council 641,648 7 Majlis Perbandaran Ampang
Jaya Municipal Council 531,639
8 Majlis Perbandaran Sepang Municipal Council 76,505 9 Majlis Daerah Kuala Selangor District Council 85,659 9 10 Majlis Daerah Sabak Bernam District Council 65,051 11 Majlis Daerah Hulu Selangor District Council 97,230 12 Majlis Daerah Kuala Langat District Council 117,435
Page 110
93
shown in Table 5-6, it is clear that the percentage of users doing e-payment was less than the
percentage of users doing e-information for each of the systems.
Table 5-6: The proportion of e-information and e-payment use
The evidence from the survey data showed e-government services fell into one or more
categories when the respondents used at least one e-service. Table 5-7 describes the percentage
of these six categories. It was reported that 86 of respondents were incurred with income tax,
property tax and traffic fines. The highest percentage of the respondents was those using two
services for all groups of respondents (26%). There is a significant overlapping of substantial
proportion (23%) among the six types of e-government users. It is noteworthy that 19% of the
respondents falls in to those used four services and followed by those who used three services.
The numbers of those who used five services (12%) is larger than the number of those who
used only one service (3%).
Table 5-7: The proportion of respondents use for all services
5.8 Item and Scale Analysis
In order to validate the items and determine the items that reflect a construct, dimensionality
and reliability tests were conducted.
Income Tax (n=294)
Property Tax (n =183)
Traffic Fines (n =116)
E-information 92% 43% 67%
E-payment 76% 41% 42%
Category (n=86) Use One Service 3% Use Two Services 26% Use Three Services 17% Use Four Services 19% Use Five Services 12% Use All Services 23%
Page 111
94
5.8.1 Dimensionality
Field (2005) and Hair et al. (2010) defined dimensionality as a set of items that determine the
number of factors with items loading. As stated earlier, the data were examined individually
according to each of the six types of e-government service. All the items for every explanatory
factor were loaded individually onto one factor. The factor loading threshold was 0.4 (Field,
2005; Straub et al., 2004), with the eigenvalues greater than 1 used to decide the retained
factors.
As shown in Appendix F, Table F-1, for e-filing in income tax system, three items were
analysed for Relative Advantage (RA) and two items were loaded onto one factor. The
eigenvalue was 1.66 and 56% of the total variance was explained. As the factor loading
threshold was 0.4, two items (TinfRA1 and TinfRA3) were retained. Similarly, the items that
measured all the independent variables for e-filing loaded onto one factor and achieved greater
than 1 eigenvalue with 56% to 75% of total variance explained for all constructs. As the factor
loading was greater than 0.4, all the items were retained except for Perceived Trust and Relative
Advantage. Similarly, the income tax system e-payment service items showed the same pattern
for the generated variables. Because of low factor loadings one item for Relative Advantage
factor (TpyRA2) and one item for Perceived Trust (TpyTRUST3) were deleted as both items
have low factor loading. All other items were retained as the eigenvalue was greater than 1 and
factor loading greater than 0.4.
Appendix F, Table F-2 shows the factor loading results for property tax system. For e-
assessment, it was identified that all items were greater than 0.4 of threshold except for item
PinfRA2 and PtyTRUST3. Therefore, this item was excluded from the variable. Two items
were analysed for both constructs and loaded onto one factor with eigenvalues were greater
than 1 and the total variance was explained between 55% to 90%. For the e-payment system in
the property tax, it was found that all items were greater than 1 for eigenvalue and as the factor
loading are greater than 0.4, with 66% to 89% of the total variance was explained, all items
were retained for further analysis.
For e-checking in traffic fines system, three items were analysed for Relative Advantage and
loaded onto one factor. 62% of the total variance was explained with the eigenvalue was 1.85.
As the factor loading threshold was 0.4, one item (FinfRA2) were excluded (see Appendix F,
Table F-3). Similarly, the items that measured Perceived Trust for e-checking loaded onto one
Page 112
95
factor and achieved greater than 1 eigenvalue with 59% of total variance explained. As the
factor loading was greater than 0.4, two items were retained (FinfTRUST1 and FinfTRUST2).
For e-payment in traffic fines system, it shows that all variables had more than 60% of total
variance explained with greater than 0.4 factor loading, but one item for each contruct
(FpyTrust3 and FpyRA2) was less than threshold loading. Thus, this item was excluded from
the construct.
5.8.2 Reliability
All the remaining items in the independent variables were tested using Cronbach’s alpha in
order to examine the internal consistency. As shown in Appendix F, Tables F1-F3, the
Cronbach’s alpha values vary from 0.71 to 0.92 for all the items. This result indicates that the
internal consistency of the items was at a satisfactory level as the value of more than 0.60, as
suggested by Churchill (1979). This result can also be considered as satisfactory according to
Hair et al. (2010). Therefore, the grouped items from this analysis were determined to be valid
and reliable to measure the interested variables in this study. Overall, as the results were
satisfying for unidimensional and reliability, the mean of each of the item was used to represent
each of the independent variables identified.
5.9 Exploratory Factor Analysis
Exploratory Factor Analysis (EFA) calculates the dimensionality of items, that is, whether an
item comes with a low or high loading on an intended factor and reveals the variables that
belong to a particular factor (Costello & Osborne, 2005; Field, 2005). For the factor extraction
and rotation, many scholars (e.g. Costello & Osborne, 2005; Kootstra, 2004; Yong & Pearce,
2013) recommend running tests with different extraction and factor options, and then making
decisions based on the results. The common methods for interpreting the factor solutions are
orthogonal and oblique rotation. The debate in the psychometrics literature about the best
method is ongoing (Field, 2005; Russell & Bobko, 1992; Winship & Mare, 1984). In this study,
the five-step EFA protocol proposed by Williams, Brown and Onsman (2012) (Figure 5-1) was
adopted.
In Step 1, the size of the sample determines whether or not the data are fit for EFA. There is
extensive discussion in the literature about the minimum sample size required to perform factor
analysis. According to Field (2005), the rule of thumb is 10 to 15 subjects per variable. A more
Page 113
96
lenient number is recommended by Habing (2003) who gives 50 observations or 5 times the
number of variables as the general rule of thumb. However, a number of scholars (e.g. Hair,
Black, Babin, & Anderson (2010) and Tabachnick & Fidell (2001)) cite the work by Comrey
and Lee (1992) as a guideline for determining the sample size, whereby a sample size of 100
is considered poor, 200 is fair, 500 is very good and more than 1000 is excellent. In the present
study, Bartlett’s sphericity test and the Kaiser-Mayer-Olkin index (KMO-Test) of sampling
adequacy was used to test whether or not the sample is large enough to run the factor analysis.
As the KMO-Test result was greater than 0.5 and the Bartlett’s sphericity test result was
statistically significant, it was established that the data set was large enough to run the factor
analysis (Field, 2005; Tabachnick & Fidell, 2001) (see Appendix G, Table G-1).
Several authors agree that, among the available types of factor analysis, the principal
component analysis (PCA) and principal axis factoring (PAF) methods are the most favoured
for contemporary research (Fabrigar, Wegener, MacCallum, & Strahan, 1999; Field, 2005;
Yong & Pearce, 2013). Therefore, in Steps 2, 3 and 4, in the present study, the entire data were
analysed separately via the PCA and PAF extraction methods, followed by both orthogonal
(varimax and aquamax) and oblique (direct oblimin and promax) rotation.
Page 114
97
Figure 5-2: The 5-step EFA protocol (adopted from Williams et al. (2012)
Step 5 involves determining the number of factors to be retained for each construct. Field
(2005) and Rietveld and Van Hout (1993) suggested three guidelines for determining the
number of factors. Firstly, the factors to be retained should have an eigenvalue larger than 1.
Secondly, the total variance of the factors should account for 60–80%. Thirdly, the number of
factors should be determined through the scree-plot breaking point. Researchers often follow
the first guideline due to simplicity as this option is the default in statistical software packages.
As suggested by Yong and Pearce (2013), in order to determine the number of significant
factors, using the rotated eigenvalue and the scree-plot breaking point is the recommended
practice for a novice researcher. Alternatively, a researcher can determine the number of factors
to be retained by specifying the factors.
Based on the extraction and rotation results, if the loading factor is less than 0.4 or if an item
has a similar loading on two factors, then exclusion of the items is recommended (Field, 2005;
Straub et al., 2004). A comparison of the results from the different extraction and rotation
methods was made and, based on the results, 4 components were accounted for more than 60%
1. Are the data suitable
for EFA?
5. Interpretation and
labelling
4. Rotational method
3. What criteria will
determine the factors?
2. How will the factors
be extracted?
Page 115
98
of the variance, thus PCA and varimax rotation were chosen in this study. As the study involved
six different e-services, the extraction and rotation test were repeated for each service. For
example, the results for e-filing in income tax system is shown in Appendix G, Table G-2.
5.10 Multicollinearity Test
Multicollinearity is related to the correlation matrix when there are strong correlations among
the predictors in a regression model (Field, 2005). Multicollinearity could be identified when
the variables are highly correlated (0.70 and above). In this study, the variance inflation factor
(VIF) and tolerance readings are used to indicate correlation among predictors. The threshold
for tolerance value was more than 0.20 and the VIF value was below 5.0 (Hair et al., 2010). As
presented in Appendix H, Table H-1, all the constructs for all systems met these requirements,
thereby indicating that none of the constructs had a collinearity issue.
A further examination of the results of the correlation matrix among the variables also were
checked for signs of multicollinearity. The threshold correlation between the variables should
not greater than 0.85 (Kline, 2005). The initial inspection of the Spearman Rho Correlation
Matrix (see Appendix I, Tables I1-I6) for each of the regression models revealed that the
correlations between the independent variables did not exceed 0.80. It was concluded that there
were no multicollinearity issues in each of the systems.
5.11 Multivariate Analysis: Logistic Regression Analysis Results
This section presents the regression analysis and discusses the findings with regard to the
study’s hypotheses. In this section, all the hypotheses relating to Relative Advantage, Effort
Expectancy, Social Influence, Perceived Risk, and Perceived Trust were tested based on the
six dependent variables of the study namely use of e-filing and e-payment in income tax
system, e-assessment and e-payment in property tax, and e-checking and e-payment for traffic
fines. A summary of the hypotheses is as follows:
H1: Relative Advantage has a positive influence on the usage of an e-government service.
H2: Effort Expectancy has a positive influence on the usage of an e-government service.
H3: Social Influence has a positive influence on the usage of an e-government service.
H4: Perceived Risk has a negative influence on the usage of an e-government service.
Page 116
99
H5: Perceived Trust has a positive influence on the usage of an e-government service.
Because all the dependent variables were binary measures, where 1 indicated using an e-service
and 0 indicated non-use, logistic regression was used to identify the associated predictors in
every model. The models were analysed with multivariate analysis that included both services,
e-information and e-payment.
5.11.1 Income Tax System Use
This section presents the findings from the logistic regression analysis for the income tax
system. Starting with the model presented in Table 5-8, each regression analysis predicted the
degree of usage of e-filing and e-payment system with existing determinants. A likelihood ratio
Chi-square test for e-filing service (χ2 (df=5) = 22.93, p<0.003) and e-payment service (χ2
(df=5) = 21.90, p<0.005) indicated that the model was significant and suggested that the model
fitted the data well. Furthermore, this was supported by the value of Pseudo-R2 statistic
(R2=0.138), indicating that the overall model quality was acceptable.
In order to identify the variables that were associated with actual usage of both services in the
income tax system, all predictors were included in the multivariate regression analysis. Only
two predictors were found to be significantly associated, while others were not significant.
Effort Expectancy and Perceived Risk were found to be associated with e-filing and e-payment
use. Effort Expectancy was found to be positively associated with e-filing and e-payment use.
The value of the coefficient revealed that an increase of one unit in Effort Expectancy was
associated with an increase in the odds of e-filing use by a factor of 4.22 (OR: 4.221, p<0.05)
and 2.98 for e-payment use (OR: 2.198, p<0.05). The results implied that e-filing use were
over four times likely when the citizens perceived e-filing service to be easy to lodge and
understandable, and it was slightly decreased to more than two times likely for e-payment use.
Meanwhile, for Perceived Risk, the results revealed a negative relationship for both services,
e-filing and e-payment. As citizens perceived a higher risk when engaging in online services,
the odds of not using e-filing are 49% higher than the odds of e-filing use (OR: 0.498, p<0.05).
Similarly, for e-payment, the odds of not using the service are 51% higher than the odds of e-
payment use (OR: 0.514, p<0.01). The results indicated that the citizens were less likely to use
the e-filing and e-payment service for half times if they perceived about the risk that involved
and unsafe for doing any transactions.
Page 117
100
In terms of demographic variables, only one explanatory factor was found to be associated in
relation to the use of both e-filing and e-payment, namely experience. Those respondents with
an Internet usage of more than 16 years were almost four (OR:3.90, p<0.05) times more likely
to use e-filing and four and half times (OR: 4.548, p<0.05) more likely to use e-payment
compared to those with less than 10 years’ Internet usage.
Table 5-8: Multiple regression analysis for factors associated with income tax system
Predictor E-filing E-payment
OR S.E. OR S.E. Relative Advantage 1.346 0.566 1.217 0.422 Effort Expectancy 4.221* 2.477 2.198* 0.883 Social Influence 1.078 0.416 1.384 0.489 Perceived Risk 0.498* 0.144 0.514** 0.121 Perceived Trust 0.905 0.370 0.942 0.379
Sex
Female = base= Male 1.010 0.536 0.710 0.291
Age Below 30 = base= 31–40 0.689 0.486 0.909 0.462 41–50 3.046 3.627 2.537 1.914 51 and above 0.441 0.562 2.985 2.234
Experience Less than 10 years = base= 11–15 years 3.780 2.876 3.263 1.795 More than 16 years 3.909* 2.470 4.548** 2.219
N 287 259 Pseudo-R2 0.1389 0.1031 Log-Likelihood −71.056248 −95.271359 Log-Likelihood χ2 (5)
22.93** 21.90**
*p<0.05, **p<0.01
Page 118
101
5.11.2 Property Tax System Use
Similar with the presentation of the results for income tax system, Table 5-9 includes the results
for e-assessment and e-payment service in the property tax system. A likelihood ratio Chi-
square test significantly predicted that the model fitted accurately for e-assessment (χ2 (df=5)
=64.37, p<0.000) and e-payment service (χ2 (df=5) = 63.90, p<0.000), respectively.
Furthermore, the value of Pseudo-R2 statistic indicated that both models were reliable and more
than 25% of the variation in the predictors was explained by the logistic model.
Effort Expectancy and Perceived Risk were identified to be associated with both e-assessment
and e-payment use. The citizens who perceived that assessing the property tax through e-
assessment service was easy, the odds of using e-assessment were more than five (OR: 5.395,
p<0.01) times larger for Effort Expectancy, while for e-payment, a unit change increased the
odds of use by a factor for almost seven (OR: 6.827, p<0.01) times. The results demonstrated
that citizens were more likely to use the services when they perceived that the services are easy
to learn, clear and understandable than those who did not it perceives as so.
However, Perceived Risk was found to be negatively associated (OR: 0.490, p<0.01),
indicating that the higher the risk citizens perceived, the odds of not using of e-assessment are
more than 50% higher than the odds of using the service. Similarly, for e-payment, the results
indicated the odds of not using e-payment service are 41% (OR: 0.410, p<0.01) higher
compared to those who are using e-payment service. From the results, it is clear that citizen’s
perceived on the risk that involved and unsecured on personal details, the usage of the services
will be decreased.
Regarding the effect of the demographic variables to the e-assessment and e-payment use,
Internet experience and types of local authority were found to be associated with use. In terms
of experience, the respondents with an experience of more than 16 years on the Internet were
almost three times more likely to use each service compared to the group with less than 10
years’ experience. For the local authorities, the citizens living in the district/rural areas were
less likely to use e-assessment (OR: 0.325, p<0.05) and e-payment (OR: 0.289, p<0.05)
services compared to the citizens living in the city area.
Page 119
102
Table 5-9: Multiple regression analysis for factors associated with property tax system
Predictor E-assessment E-payment
OR S.E. OR S.E. Relative Advantage 1.537 0.907 0.737 0.367 Effort Expectancy 5.395** 3.024 6.827** 3.313 Social Influence 1.716 0.534 1.206 0.436 Perceived Risk 0.490** 0.132 0.410** 0.125 Perceived Trust 0.547 0.249 0.636 0.278
Sex
Female = base= Male 1.485 0.527 1.192 0.423
Age Below 30 = base= 31–40 1.816 1.351 3.275 2.743 41–50 2.618 2.103 4.764 4.252 51 and above 1.339 1.341 6.939 7.612
Experience Less than 10 years = base= 11–15 years 1.460 0.834 1.778 1.015 More than 16 years 2.914* 1.487 2.633* 1.347
Local Authority City Hall = base= Municipal Council 0.695 0.288 0.605 0.254 District Council 0.325* 0.162 0.289* 0.144
N 182 163 Pseudo-R2 0.2578 0.2862 Log-Likelihood −92.637271 −79.676889 Log-Likelihood χ2 (5)
64.37** 63.90**
*p<0.05, **p<0.01
Page 120
103
5.11.3 Traffic Fines System Use
This section presents the findings for the traffic fines system. The model is presented in Table
5-10. Each regression analysis predicted the degree of usage of e-checking and e-payment
system with explanatory factors. The Chi-square tests of the model coefficients showed that
the model was significant at the 0.01 level for e-checking (χ2 (df=5) = 27.35, p<0.000) and e-
payment (χ2 (df=5) = 35.37, p<0.000), suggesting that the model fitted the data well. This was
supported by the values of Pseudo-R2 that indicated 19% (e-checking) and 24% (e-payment)
of the variation in the predictors were explained by the model.
Effort Expectancy and Social Influence were found to be consistently associated with increased
use for both services. In fact, the results revealed that as the citizens perceived that e-checking
and e-payment services in the traffic fines online were easy to learn, easy to use and
understandable, for one unit change in Effort Expectancy, the odds of e-checking and e-
payment use also increased by a factor of 3.27 (OR: 3.277, p<0.01) and 3.3 (OR: 3.307,
p<0.01), respectively.
The Social Influence construct highlights that peers and the government promoting and
advertising the benefits of online service was deemed effective. The results showed that a one
unit change in Social Influence, the odds of using e-checking increases by a factor of 4.73 (OR:
4.736, p<0.01). Similarly, the odds of using e-payment also increased by a factor of 2.71 (OR:
2.713, p<0.05) but slightly lower compared to e-checking service. From the results, it implied
that the adoption of both e-services would be increased up to 73% when the citizens perceived
on peer’s opinion and government’s roles on the e-government services.
The results also showed Relative Advantage had a positive association with e-payment in
traffic fines, indicating that the citizens perceived the online service to be better than the offline
service. The value of the coefficient showed that change of one unit in Relative Advantage was
associated with an increase in the odds of e-payment use by a factor of 4.45 (OR: 4.446,
p<0.05). Regarding the demographic variables, none of three potential factors was found to be
associated with both e-services.
Page 121
104
Table 5-10: Multiple regression analysis for factors associated with traffic fines system
Predictor E-checking E-payment
OR S.E. OR S.E. Relative Advantage 1.281 0.474 4.446* 2.844 Effort Expectancy 3.277** 1.324 3.307** 1.497 Social Influence 4.736** 2.286 2.713* 1.230 Perceived Risk 0.898 0.240 1.019 0.340 Perceived Trust 0.483 0.248 0.738 0.353
Sex
Female = base= Male 0.656 0.284 1.194 0.499
Age Below 30 = base= 31–40 1.347 .756 1.070 0.620 41–50 0.784 .559 0.563 0.415 51 and above 1.164 1.059 1.079 0.971
Experience
Less than 10 years = base= 11–15 years 0.575 0.373 1.211 0.763 More than 16 years 0.785 0.435 1.120 0.588
N 116 106 Pseudo-R2 0.1859 0.2423 Log-Likelihood −60.298079 −55.314082 Log-Likelihood χ2 (5) 27.53** 35.37**
*p<0.05, **p<0.01
5.12 Chapter Summary
This chapter has presented the empirical results and the discussions that focus on demographic,
descriptive statistics, reliability, dimensionality, multicollinearity, as well as the testing results
by using multivariate analyses. Logistic regression analysis was used to investigate the
determinants for the citizens’ actual usage on e-government services such as income tax,
property tax, and traffic fines. The factor analysis and multicollinearity analysis reported that
the survey was reliable and valid for further analysis. The next chapter provides a discussion
on the main findings, which are supported by the previous studies related to the theoretical
constructs.
Page 122
105
Chapter 6 : Discussion and Conclusion
6.1 Introduction
The purpose of this study was to investigate of citizens’ use of different e-government services
in Malaysia. From the extant literature, this study identified several factors related to the
citizens’ use of e-government services. In addition, previous studies showed there are different
patterns of citizen use of e-government services, particularly in developing countries. This
study involved six e-services offered by different government agencies. Therefore, this study
was unique as it extended the UTAUT model proposed by Venkatesh et al. (2003) in the context
of various uses of e-government services and examined whether the identified factors were
different by the type of services.
In the first stage, a scoping study of Malaysian citizens was undertaken to understand the nature
of how users determined their use of different e-government services. The conceptual
framework was revised, and a survey was formulated. The survey response was used for testing
the proposed predictors using regression analysis.
This chapter provides a discussion on the findings and offers conclusions based on the results
presented in the previous chapter. This is then followed by a discussion on the differences of
usage between e-information and e-payment service. This chapter also highlights the
contributions of the study, and the limitations in Section 6.3. This chapter ends with some
suggestions for the future research.
6.2 Discussion on the Survey Findings
The principal aim of this study was to investigate the predictors of citizens’ use of different e-
government services. In order to answer the proposed research questions and hypotheses,
multivariate analyses for income tax, property tax, and traffic fines were conducted. This
section discusses the findings of the analysis in accordance with the research questions and
hypotheses. In summary, all results of the regression analyses used to test the hypotheses are
summarised in Table 6-1.
Page 123
106
Table 6-1: Summary of the results by hypotheses
Research hypothesis Result
Income tax Property tax Traffic fines e-filing e-payment e-assessment e-payment e-checking e-payment
H1 Relative Advantage has a positive influence on the usage of an e-government service.
Supported (OR: 4.446) *
H2 Effort Expectancy has a positive influence on the usage of an e-government service.
Supported (OR: 4.221) *
Supported (OR: 2.918) *
Supported (OR: 5.395) **
Supported (OR: 6.827) **
Supported (OR: 3.277) **
Supported (OR:3.307) **
H3 Social Influence has a positive influence on the usage of an e-government service.
Supported (OR: 4.736) **
Supported
(OR: 2.713) *
H4 Perceived Risk has a negative influence on the usage of an e-government service.
Supported (OR: 0.498) *
Supported (OR: 0.514) **
Supported (OR: 0.490) **
Supported (OR: 0.410) **
H5 Perceived Trust has a positive influence on the usage of an e-government service.
*p<0.05, **p<0.01
Page 124
107
6.2.1 Drivers of E-government Use
After about a decade of e-government in Malaysia, a common perception from the Malaysian
citizens to e-service use seemed to be the Effort Expectancy, which was the most dominant
factor that influenced the citizens’ use on e-services. This was apparent in both e-information
and e-payment for each of the services. As shown in Table 6-1, Effort Expectancy clearly
appears to be a driver across each of the services. This result implies that Effort Expectancy
was identified as the main determinant of e-government use regardless of whether the service
was offered by the federal or the local authority. Thus, this finding supported the hypothesis
H2 for all the services.
Many previous empirical studies have investigated the effect of Effort Expectancy in
influencing the citizens’ use on e-government (Carter, Shaupp, Hobbs, & Campbell, 2011;
Kurfali et al., 2017; Rahman et al., 2011; Weerakkody, El-Haddadeh, Al-Sobhi, Shareef, &
Dwivedi, 2013; Wu et al., 2007; Yahya et al., 2011; Yu, 2011; Zuiderwijk, Janssen, & Dwivedi,
2015). In the context of this study, Effort Expectancy referred to the citizens perceiving that e-
services was ease to learn, ease to use and ease to understand. The findings revealed the
government’s role to fully utilise the existing technology in order to maintain its easiness and
effortless. For example, government agencies have to consider a user interface technology as
most of the citizens found and perceived it easy to access the service using a mobile phone.
Hence, a well-designed user interface is required to run the services on phones or tablets. Thus,
a huge investment is required to make it applicable. Moreover, during the interview, the
participants showed enthusiasm for e-government use, as they perceived that through the
mobile applications, they could pay all the utility bills easily. In other words, the provision of
suitable services provided with the latest technology may encourage more citizens to use these
services. For example, services such as those provided by IRBM, MyEG, and most local
authorities in Malaysia have added a new feature to their website namely the Financial Process
Exchange (FPX). This feature allows users to pay their taxes and fines through Internet banking
that can be accessed via the respective government websites. This feature facilitates
transactions as it is directly linked to the users’ account without opening the bank’s website.
The result was consistent with the previous studies that also identified Effort Expectancy to
have a high impact on technology adoption (Khattab et al., 2015) particularly among local
authorities in Malaysia (Pitchay et al., 2016; Zahari, Ariffin, Zamin, & Noor, 2014). Effort
Expectancy especially in terms of user friendliness of the service was also found to be
Page 125
108
significant in both assessing information and conducting transaction with the respective local
authority’s website. A study by Zahari, Ariffin, Zamin, and Noor (2014) showed that an
initiative by the Shah Alam City Council (MBSA) to offer a wide range of online banking
services on the their official website had increased usage as citizens had a another option to use
the online payment even though the citizens had different bank accounts.
As mentioned in Chapter 2, local authorities have the responsibility to develop, maintain, and
update their website frequently. Today, government agencies including the local authorities are
committed to promoting civic engagement by offering information and services through their
official portal. Therefore, in order to enhance Effort Expectancy, the portal should have a
design that is user-friendly and suitable for users with different levels of computer literacy. A
good website not only provides sufficient information needed by users, but, it should also be
able to be used effortlessly by all types and levels of users (AlAwadhi & Morris, 2009; Zaman,
2010). Therefore, the development of strategies with an emphasis on the benefits of online
services should be a priority. As mentioned by one of the participants involved in the interview:
“People should see this as an opportunity to change their lifestyle towards a more
technology-savvy community, but the major role is to ensure that the websites of the
local authorities are accessible, accurate, and updated” [R3, female, early 50s].
The interviewees were aware and admitted that providing e-services through websites was
effective. However, any drawbacks related to the local authorities’ websites, such as being
incomplete, not updated, and doubtful data security, should be avoided as these factors would
eventually cause a low usage among the citizens.
The interview participants perceived the ease of use of e-payment service as rather positive.
Effort Expectancy was a predictor, suggesting that MyEG should maintain and ensure their
portal websites are always accessible, useful, and usable. This result is inline with the study by
Adams, Nelson and Todd (2012), who reported that the higher the citizens perceived the ease
of use of a service, the more likely they would adopt the service. During the scoping study, it
was obvious that Effort Expectancy was the main factor among the interviewees when they
were asked about the reason for choosing some e-government services. Most of them believed
that once a service was available online, it meant it was easy to use and access. However, as
the MyEG services were considered new, this study found that the usage of the service was
low because citizens did not know about the service, particularly when the transaction process
Page 126
109
had been upgraded to integrate with the local banks. For example, due to lack of an advertising
campaign to expose the benefits of the service to the public, one of the interviewees, who was
convinced that the traditional method of doing any transaction was better than the online
method, and who believed that there was no need to change it, said:
“Frankly speaking, I know about MyEG and but I have no idea what the benefits of the
service are except to renew the road tax and insurance and to check the traffic fines.
Until today, my family and I believe that paying the traffic fines through the counter is
convenient and safe because the transaction receipt is given when the transaction is
done” [R12, female, early 30s].
Besides the campaign by the government, the efforts to increase the e-service capabilities are
also crucial. However, these efforts to increase the efficiency of government are likely to
increase the operational and infrastructure costs and eventually lead to failure due to cost over
run (Idawati & Pope, 2011). In Malaysia, due to the attitudes of citizens who prefer to pay their
traffic fines at the last minutes, there will be a high volume of traffic to the server. Because of
this, MyEG have to ensure their services are capable to work with the online traffic levels (Che
Azmi & Bee, 2010). Therefore, the investment to increase server capabilities to handle the
large volume of transaction simultaneously is highly supported.
As e-services were developed with encrypted websites, they provide security to the transaction,
and offer convenience and easiness to the users. The study’s result was inline with the findings
by Mohd Suki and Ramayah (2010), who mentioned other people’s perceptions on the benefits
of using e-government were associated with technology adoption. Additionally, this result also
indicated that the citizens who are frequent users will still consider the easiness of the systems
in deciding to use it. As one of the participant said:
I believe in the future, sooner or later, more people looking for e-services. As everybody
now has their Facebook, Twitter account, now with mobile technology, it is even easier
to update or access your taxes while on the go” [R7, male, late 40s].
Therefore, in pursuit of meeting citizens’ expectations, the governments should proactively
anticipate new technologies and then provide appropriate services with ease of use as the main
factor. Given the consistent effect of Effort Expectancy in each e-services studied, the findings
also suggest that government agencies should continuously improve their e-services in order
to fulfil the citizens’ needs. Furthermore, in order to spread the benefits of e-services,
Page 127
110
promoting the services on popular applications such as Facebook, YouTube, and Twitter is also
suggested.
Perceived Risk was also identified as a predictor to the actual use for both income tax and
property tax services, but not for traffic fines services. Although the relationship was
significant, the direction was negative. This result meant that the higher was the perceived risk,
the lower was the usage of e-services, and vice versa. This result supports a previous study that
revealed most of the respondents had a serious concern on the privacy issue (i.e., high risk on
their personal details) especially when dealing with online transactions (Kaur & Rashid, 2008).
In general, the citizens’ perception towards the usefulness of the online services would decrease
when any transactions were involved, which in some studies, it was proved that Perceived Risk
had a higher priority than other factors such as Relative Advantage, Perceived Trust, and Social
Influence (Belanger & Carter, 2008; Rehman et al., 2012).
This result was perhaps due to the action taken by local authorities to provide their online
service through highly encrypted website, which has greatly influenced the level of confidence
among the users towards the online services. According to Che Azmi and Bee (2010), a
reduction in the risk perception towards e-services will not only increase the public’s
perception towards their usefulness, but will also encourage them to adopt the system.
Therefore, it is important for local authorities particularly city and municipal areas, to actively
promote the benefits of the services to the public. One interviewee insisted that providing a
very good service is not enough to encourage the public to use it if the citizens’ perception
towards the risk existed. He claimed:
“...that is just a simple thing, only to get information on the amount of land tax to be
paid, but because this service is considered new, this simple thing is perceived to be
risky, and I prefer not to use it for transaction” [R7, male, late 40s].
However, surprisingly Perceived Risk was not associated with traffic fines services use.
Perhaps, a possible explanation for this result was the collaboration of MyEG with the local
banks that had improved the services provided by MyEG particularly in terms of security
system, which was compulsory in all the transactions. This effort is likely influenced the
citizens’ perceptions on risk. As a result, Perceived Risk was not associated with traffic fines
services. The result was confirmed from the interview as one of the participants said:
“...although the MyEG website needs some improvement, I am using that online services
Page 128
111
because the integration between MyEG services and the local banks makes things trusted and
reliable” [R11, female, early 30s].
The study found that Social Influence was significant for both traffic fines services, but not
for the other services. This result supported previous studies that found Social Influence to be
significant in the adoption of a technology (Colesca, 2009; Horst et al., 2007; Thompson et al.,
2008). Social Influence refer to the state when citizens perceive that peer’s influence (Taylor
& Todd, 1995; Venkatesh et al., 2003) and external factors (e.g., advertisement/mass media
and government’s role) (Mohd Suki & Ramayah, 2010) are important in deciding to use the
system.
To recall, MyEG is introduced in 2010 and it is a relatively new system in Malaysia compared
to income tax and property tax system. Meanwhile, e-filing was introduced in 2006 in the
Malaysia, and it was not surprising when Social Influence was indispensable for improving the
trust and confidence of the citizens to use the new technology. The finding of this study was
inline with the study’s expectation that an adoption of new technology would positively be
associated with peers’ influence. As stated by Rodgers (1995), when the society was exposed
with the new technology, their choice to accept or reject the use of the technology, and whether
the technology was adopted quickly or slowly, was based on their peers’ preferences.
An earlier study by Lean et al. (2009) that measured Social Influence using DOI model,
suggested that Social Influence had an influence in determining the use of e-government
services such as e-filing in Malaysia. A year after that, the research conducted by Mohd Suki
and Ramayah, (2010) also showed similar result and reported that social norms had a
significant effect on e-filing use in Malaysia. One of the possible reasons for this finding was
that, at the time of that studies, e-filing was just launched and was in an early stage of
implementation where it was considered a pioneer e-service in Malaysia (Ibrahim & Pope,
2011). The result was consistent with the previous studies that examined the direct relationship
between Social Influence and technology adoption (AlAwadhi & Morris, 2009; Hung et al.,
2006; Lean et al., 2009; Rotchanakitumnuai, 2008). As stated by one of the participants:
“… the most important thing when you are dealing with new emerged online services
is peers’ opinions especially for a new service like e-checking. This is necessary to build
trust in using that service.” [R3, female, early 50s].
Page 129
112
However, this study found that when an e-service was well established Social Influence was
no longer relevant for use. Social Influence showed no association with income tax and
property tax use. As already noted, as the income tax services were introduced a decade ago,
during the period, there were a lot of improvements implemented by the IRBM. It could be due
the fact that income tax system was more mature compared to other e-government services in
Malaysia. Thus, Social Influence was not a priority as the citizens believed other factors (such
as Perceived Risk and Effort Expectancy) were more important. Table 5-2 indicates that most
of the respondents had an experience on computer more than 15 years. Therefore, it was likely
that the citizens with more experience were more concerned on the risk. Experience with
inconsistent performance would lead the citizen to less likely embrace the benefits of the
services (Lean et al., 2009)
A possible explanation for this might be that, as the experience was identified significant for
both e-services, it could be the reason Social Influence was not relevant, as the users were
familiar and had an experience with the services. Or, as these services were required for citizens
to file and pay their income tax/property tax yearly, it became a routine and other people’s
opinion about it was not needed. However, the result was different from some published studies
(Nugroho, 2015; Ramayah et al., 2008) that reported Social Influence to be significantly
associated with e-service use.
The literature suggested that there is a relationship between Relative Advantage and
technology use (Lean et al., 2009; Pitchay et al., 2016). Besides Effort Expectancy and Social
Influence, the results also indicated that Relative Advantage was identified as a determinant
when the citizens dealt with e-payment service in the traffic fines service, while other services
were not associated. The result explained that a high level of perceived Relative Advantage
was associated with the increase in the use of online payment among the citizens. This finding
strongly supported that the actual use of e-payment was largely due to the citizens’ perception
towards the benefits of the service. The result was consistent with the findings in the studies
by Alomari, Sandhu and Woods (2010) and Sang, Lee and Lee (2010). The authors explained
that citizens who realised the benefits of current technology over the traditional method would
more likely to use e-government. However, in this present study, this factor was not associated
with income tax and property tax services.
The result shows that the Malaysian citizens were 45% likely to pay their traffic fines through
online if they perceived that they would get better benefits compared to face to face service.
Page 130
113
This result may be explained by the fact the e-payment in traffic fines service was considered
new, thus the users’ perception towards the capabilities of the e-services was crucial. As
mentioned by Agarwal and Prasad (1999), decline to use of e-government services occurred
when the citizens were likely disappointed with the features and capabilities of the e-services.
This was because the benefits of these e-services depended on user’s perceptions. This finding
was contradict with the study by Ramayah et al. (2008) who investigated the factors that
influenced the citizens’ use on e-filing during the early stage of its implementation. A study
reported the unfriendliness of the e-filing service. The citizens had to go to the IRBM counter
to buy the 16-digit PIN number before they could access the online service. This procedure had
led to the negative perceptions and directly contributed to the lower intention to use the service.
As a consequence, in 2007, it was reported that less than 8 percent of 2.5 million taxpayers
used the e-filing (Ibrahim & Pope, 2011). Hence, the benefits of e-services were not perceived
due to the complexity of the service (Ramayah et al., 2008). Therefore, the results of this study
indicated the citizens were likely to view e-payment service as being more advantageous
compared to the counter (face-to-face) service. The benefits such as quick information retrieval
and transaction completion, convenient, and reduced turnaround should be told to the public
frequently. Meanwhile, one possible explanation for the insignificant relationship between
Relative Advantage and income tax and property tax services was that the users did not
associate the services to be better in terms of service delivery than the manual method.
Finally, as the citizens perceived that trust had a major impact to the e-government use, the use
increased when Perceived Trust increased, showing that this factor was also important in
determining the e-payment use. The same conclusion has been discussed by Chatzoglou,
Chatzoudes and Symeonidis (2015) and Colesca (2009). The authors added that when citizens
perceived the government to guarantee the security of their personal data, they were more likely
to use e-services.
However, Perceived Trust was found no effect to each of the e-services studied. It explained
that perceived trust among the Malaysian citizens is not a factor that will influence to the e-
government use. The possible reason for this result was due to the role of the other factors. For
example, from the results, compared to other factors, it was found that Effort Expectancy has
higher effect to the e-assessment (OR: 5.3) and e-payment (OR: 6.827) service on property
tax. The results implied that citizens were more likely to use e-government service because of
the easiness and quicker the services rather than other factors in order to fulfil their needs.
Page 131
114
Meanwhile, one of the possible reason that leads to the lack of a relationship between Perceived
Trust and income tax usage is due to the fact that, as the income tax service was well-
established, it had brought a higher level of confidence to the citizens (Santhanamery &
Ramayah, 2012). Therefore, Perceived Trust was not an issue for e-filing and e-payment
services.
Therefore, the government is recommended to improve their online interactions with the
citizens because this action was identified as efficient in increasing the Perceived Trust
particularly for transactions that requested financial details (Tolbert & Mossberger, 2006). A
study conducted in Malaysia found that the citizens’ level of Perceived Trust on e-service
turned down when they dealt with an online payment (Hussein, Mohamed, Ahlan, et al., 2011).
A study in Jordan by Khattab et al. (2015) stressed that developing the citizens’ trust had
become a crucial factor that would drive the success of e-government in the country. This was
reflected to the earlier findings on the scoping study, in which a participant suggested service
providers tackle this issue. Thus, the initiative taken by MyEG to cooperate with the local banks
had brought a good improvement to the service besides gaining the citizens’ trust. For example,
one participant expressed this point when she said:
“I admitted...in early year of MyEG implementation, I had a problem. I still doubted
the level of security provided...I was reluctant to make any transaction online. The
account could easily be accessed using Identity Card (IC) numbers. However, my
perception has been changed when the local banks are involved in the system. All
payments are done online because the cooperation makes things a lot easier. It provides
confidence in the security systems, and people have no worries about their transactions
at all” [R11].
6.2.2. Level of E-information Versus E-payment Services.
As shown in Table 6-2, the findings provide a support for the second research question, but
they also differ according to the type of services, namely e-information and e-payment.
Page 132
115
Table 6-2: Summary of level of e-information and e-payment services
Predictor
Type of Services
E-information E-payment
Income Tax
Property Tax
Traffic Fines
Income Tax
Property Tax
Traffic Fines
Relative Advantage Support
Effort Expectancy Support Support Support Support Support Support
Social Influence Support Support
Perceived Risk Support Support Support Support
Perceived Trust
Effort Expectancy is defined as how easy it is to use the system (Venkatesh et al., 2003). Effort
Expectancy is significant in various innovations and has been widely discussed in previous
studies (Akram & Malik, 2012; Holden & Karsh, 2010; Rahman et al., 2011; Venkatesh et al.,
2003; Weerakkody et al., 2013). In this study, Effort Expectancy was found to be a strong
factor that was associated for both e-information and e-payment for each of the services. The
result implied that the Malaysian citizens relied on the easiness and user-friendliness of e-
services, regardless whether the services were offered by the federal or the local authority and
regardless of e-information or e-payment. The findings also highlighted that Perceived Risk
was also identified to support the income tax and property tax services, but not for traffic fines
services. In addition, there is no difference in Perceived Risk between e-information and e-
payment services for all services. This finding was consistent with the past study that found the
Perceived Risk significantly and directly affected the e-filing use (Teck Hong & Yin-Fah,
2012).
However, surprisingly, the survey finding did not support the relationship between Perceived
Risk on e-checking and e-payment use on traffic fines systems. As mentioned by Che Azmi
and Bee (2010), some constructs were influenced by other constructs in explaining the system
use. Moreover, in their study, the effect of Perceived Risk towards adopting a system was
positively influenced by Perceived Trust. Thus, this finding may help to understand as the
Page 133
116
citizens were dealing with a new online service, they were more concerned of their peers’
opinion and easiness of the service rather than Perceived Risk.
Meanwhile, for e-payment type of service, based on the results, Relative Advantage was only
identified to be a predictor for e-payment in the traffic fines service. Thus, it implies that
citizens perceived that the online services were better than the face to face services. The
statistical result revealed that the odds of use was almost 45%, that indicating the citizens were
likely to use e-payment compared to other method of services. The result implied that the
citizens were confident and convinced with the benefits of e-payment service, even though the
service was considered new. For e-information, Relative Advantage was found to be not
associated with any services. This contradictory result may be due to the government’s failure
to synchronise their system with the new technology. In the scoping study, it was found that
the participants had to call their respective local authority because the online system failed to
process their assessment tax properly. Carter and Weerakkody (2008) highlighted that by
providing extra benefits such as convenient access and prompt service, the benefits of the
service would diffuse throughout society quickly, hence offering a high use among the citizens.
Therefore, the government agencies had to respond quickly and keep updated with the current
technologies particularly that related to the social media such as Facebook, Twitter, and
YouTube. This was as highlighted by a previous study that the government role will be
enhanced with to the technology use (Henman, 1996, 2013).
Social Influence was identified as a factor for usage of e-information and e-payment services
for traffic fines services only. The result revealed that Social Influence was associated with e-
checking and e-payment in traffic fines system, but not for income tax and property tax
services. As mentioned before, MyEG was the latest system used in this study. Therefore, the
results suggest that peers’ and government advertisement feedback was needed to encourage
the citizens to use the e-services. This finding was inline with the study by Al-shafi and
Weerakkody (2010), who noted the decision to use the online services among the citizens
merely relied on the positive feedback among their social networks.
However, a study by Aziz and Idris (2012) found that Social Influence only significant on the
early stage of its implementation and turn to be non-significant as the citizen familiar with the
services. It implies that once the citizen become familiar with the service, opinion from othes
have no effect on the usage. In this study, as the study selected the respondents based on the
IRBM database, it was assumed that the respondents had knowledge on the online service (e-
Page 134
117
filing), and that was the strong reason for Social Influence not to be associated with e-filing.
Furthermore, as shown in Table 6-1, experience was found to be related with e-filing use,
whereas the Social Influence predictor was not associated. For example, the studies by Al-
Athmay, Fantazy and Kumar (2016) and Bélanger and Carter (2008) found that the effect of
peers’ influence decreased as experience on technology increased. It means as the users became
familiar with the system, Social Influence less likely affected the citizens’ decision to use the
online services.
Finally, based on the research findings, only Perceived Trust was found not to be associated
with any service under studies. Perceived Trust has been widely discussed in the previous
literature, but there is still no agreed definition on it. To recall, in this study, Perceived Trust is
defined as the citizens’ belief that the e-government services will perform to reduce the
complexity and uncertainty of living environment (Alsaghier et al., 2009) that can be trusted
by providing a safe and secure system for the citizens’ personal details (Mayer, Davis, &
Schoorman, 1995). As shown in Table 6-1, in this study, one possible explanations for these
results may be related to the pattern of use that was influenced by another factor, as explained
by Colesca (2009) in his study. The author highlighted that the higher were the levels of trust,
the lower was the level of citizens’ risk perceptions on e-government. For example, in the e-
filing service, Perceived Risk was supported but not for Perceived Trust, and it was found to
be similar with e-assessment service. The result of this study indicated the citizens perceived
the Effort Expectancy, Social Influence and Relative Advantage in e-government as rather
positive, and offered the inverse result for Perceived Risk in determining the citizens’ use on
e-government services (Horst et al., 2007).�
6.3 Implications of the Study
This section discusses the empirical and practical contributions to the existing body of
knowledge on e-government use. These contributions are presented in the following
subsections.
6.3.1 Academic Implications
At the heart of this body of research is a model that seeks to understand and predict usage of e-
government by citizens, namely UTAUT model. Most existing e-government studies (e.g.,
AlAwadhi & Morris, 2008; Marchewka, Liu, & Kostiwa, 2007; Rahman et al., 2011) focused
Page 135
118
on one e-government service, thus the comparative analysis was lacking. Therefore, this
present empirical research contributed to the body of knowledge as this study integrated the
UTAUT model with several e-government services, and a variation on citizens’ pattern of
usage in different setting of systems was identified.
The findings revealed that the service provider (government agency) should treat their services
accordingly. For example, in traffic fines service, Perceived Risk was not associated with e-
information and e-payment services. However, the usage of both services was influenced by
peer’s opinion as an important factor, regardless of whether it was an information or transaction
service. Apart from being concerned about Relative Advantage of e-services, it is advisable for
the government to look into the Social Influence factor, as the result of this study implied the
importance of such a factor particularly for new services. Second, the interviews proposed two
constructs that were obtained from the scoping study, and it can be used to measure the factors
that influenced the citizens’ use of e-government services. Unlike the previous studies that
successfully proved that the UTAUT model was validated to investigate the technology
adoption from different perspectives including behavioural intentions (AlAwadhi & Morris,
2008), management effectiveness (Abdulwahab & Dahalin, 2010), information quality and
service quality (Rahman et al., 2011), this study integrated the UTAUT model with Perceived
Risk and Perceived Trust to examine the key determinants on e-government use with different
setting of e-services. As a result, the integration of both constructs to the UTAUT model was
successfully proven when Perceived Risk construct was found to be significant on the property
tax and traffic fines systems. The result implied that the UTAUT model is not comprehensive
on its own where other factor (Perceived Risk) also was found to be associated on e-
government use. The adapted model that included six types of e-government services can be
used to enrich the understanding on theoretical development in the context of e-government
use by shedding the light on the reasons the citizen chose to use some e-government services
and not others.
Finally, another contribution of the present study was related to the methodology, more
specifically the opportunity to know the patterns of the citizens’ use by comparing different
types of e-government services in a single study by using the same data collected from the
same period. The present study identified various factors associated with citizens’ use from
three different settings of services namely income tax, property tax, and traffic fines. By
considering the different features of the systems and the different user needs that may influence
Page 136
119
the usage of technology, the present study also discussed a list of predictors considered to be
important by the citizens when engaging with e-government services.
6.3.2 Practical Implications
The findings of this research have practical implications for e-government design and
deployment. The research identified the main determinants leading to users’ decision making
to adopting e-government services. The adoption rate of e-government services in most
developing countries is very low (Heeks, 2006; M. Kaur & Singh, 2015). Thus, by identifying
this main determinant of use, it could bring out a new dimension to e-government
implementation. In the current study, the interviews that emphasised the collaboration between
government and private sectors (local banks) in the traffic fines system had brought a new
paradigm to the e-government delivery service. The findings are expected to help the
government acquire an understanding on the dominant factors that encourage the usage of e-
government service among the citizens. By collaborating the online payment system with
several local banks, it was found to be positively associated with e-government use. Therefore,
such initiatives that well planned by government are identify to have helped to streamline with
the technology and contribute to increase the usage by the citizens (Siddiquee, 2008).
Practically, to increase citizens’ use of e-government services, the service providers have to
make sure that the services provided are useful and accessible (Adams et al., 2012; Al-Khalifa,
2010). For instance, regardless of the type of services, based on the findings, Effort Expectancy
and Perceived Risk were found to be associated with e-government use. Thus, to engage the
citizen, it is crucial for the government agencies to understand the important determinants that
lead to the usage of e-government services. However, in this study, it was found that there was
a pattern of usage on e-government services. For example, Effort Expectancy and Perceived
Risk were identified associated with income tax and property tax services, while Social
Influence only related to the traffic fines services. Thus, governments have to conduct a
research that identifies the determinants of user acceptance by identifying the right solution as
well as to design the ways to increase citizen acceptance of e-government. This is because the
governments in developing countries have limited resources, and the success of e- government
is a must to ensure that the resources allocated and spent are not taken for granted.
Page 137
120
6.4 Limitations of the study
Similar with all studies, this study was also a subject to the limitations that could potentially
influence the conclusions. First, because this case study was conducted in Malaysia and the
respondents were recruited from the Malaysian Tax Office’s database, the findings might not
be generalised. This study was conducted in the Malaysian context, so the analysis was based
on the perception of the Malaysian citizens as one of developing country. Thus, the
interpretation of the results should only be applicable to the Malaysian e-government setting
(Hussein et al., 2007). Therefore, whether the results would be consistent with the results from
other countries, it would need to be confirmed in the further studies.
Second, the participants on the scoping study stage were selected based on purposive and
snowballing sampling, and only included those with an experience with e-government services.
Due to time constraint, this study was not able to reach the people who were excluded from the
scoping study, whereas acquiring information from these people was also important because
they may have some different points or views on the proposed predictors towards e-government
use. Therefore, further verification to enhance the findings from the scoping study is needed in
future.
Third, due to the voluntary nature of the respondents to involve in the study, it was difficult to
obtain a large number of returned questionnaires. The drawbacks of using an online survey
were also expected in this study. The researcher faced withdrawals by the respondents in the
early and middle stages of the survey.
Finally, regarding the test setting and the measurement of the variables, as mentioned above,
this study used the sample from the Malaysian Tax Office’s database. As the study focused on
six major systems used in the e-government context, a variety of characteristics of the systems
perhaps led to the different settings for testing and measurement. Because of this limitation,
the results about the predictors that influenced the citizens’ usage of e-government services
may not be generalised as some of the services were not relevant to some users in the first
place. Thus, future studies should consider a longitudinal approach to further explore these
factors.
Page 138
121
6.5 Future Studies
Firstly, future studies may also further explore the other types of government relationships as
they also possibly influence the citizens’ decision making on usage of the technology. As this
present study focused on the end-users’ perceptions (G2C), G2B and G2G were ignored
although the previous studies found that these types of relationship are also important in the
development of e-government services (Abdul Karim, 2003; Hung et al., 2006; WASEDA,
2012). Therefore, further studies are highly recommended to include these types of relationship
and and test the factors with the different e-services to determine the citizens’ intention to use
of e-government services. (Ghani & Said, 2010; Hassan & Palil, 2012; Hossan et al., 2006).
Secondly, this present study used only a dichotomous scale-item to measure the actual use.
Additional studies are needed to explore the impact of the study when multiple items are used
to measure the primary dimension of actual usage.�It would be interesting to further examine
when the multiple items are used to measure the actual use from different e-government
services. However, most of the studies only tested with single e-government service (Ambali,
2009; Hong, 2012; Lean et al., 2009). Therefore, due to limited numbers of study that measure
the actual use with multiple items and tested with several e-government services, future
research should be conducted to enhance the findings. Thirdly, longitudinal studies may be
required in the future studies in order to understand the citizens’ adoption in depth by looking
whether the citizen will repeat or continue the online services after the initial adoption.
Finally, the respondents of this study were selected based on a purposive sampling, and only
the citizens who were currently available in the IRBM database were included. Using this type
of respondents was worthwhile particularly to investigate the usage of different e- services and
their impact on the proposed constructs towards the actual usage of e-services. The
interpretation of result should only be confined to the Malaysian e-government setting.
However, further studies are encouraged to be conducted in different settings to verify this
research findings.
Page 139
122
References
Abdul Karim, M. (2003). Technology and improved service delivery: Learning points from the
Malaysian experience. International Review of Administrative Sciences, 69(2), 191–204.
Retrieved from http://ras.sagepub.com/cgi/doi/10.1177/0020852303069002005
Abdulwahab, L., & Dahalin, Z. M. (2010). A conceptual model of Unified Theory of
Acceptance and Use of Technology ( UTAUT ) modification with management
effectiveness and program effectiveness in context of telecentre. African Scientist Vol.,
11(4), 267–275.
Adams, D. A., Nelson, R. R., & Todd, P. A. (2012). Perceived usefulness, ease of use, and
usage of information technology: A replication. MIS Quarterly, 16(2), 227–247.
Agarwal, R., & Prasad, J. (1999). Are individual differences germane to the acceptance of new
information technologies? Decision Sciences, 30(2), 361–391.
Ajzen, I. (1991). The theory of planned behavior. Organizational Behavior and Human
Decision Process, 50, 179–211;
Ajzen, I. (2001). Nature and operation of attitudes. Annual Review of Psychology, 52, 27–58.
Akram, M. S., & Malik, A. (2012). Evaluating citizens’ readiness to embrace e-government
services. Proceedings of the 13th Annual International Conference on Digital
Government Research - Dg.o ’12, 58. http://doi.org/10.1145/2307729.2307740
Al-Adawi, Z., Yousafzai, S., & Pallister, J. (2005). Conceptual model of citizen adoption of e-
government. In The Second International Conference on Innovations in Information
Technology (IIT’05) (pp. 1–10).
AL-Athmay, Al. A. A., Fantazy, K., & Kumar, V. (2016). E-government adoption and user’s
satisfaction: An empirical investigation. EuroMed Journal of Business, 11(1), 57–83.
http://doi.org/10.1108/EMJB-05-2014-0016
Al-Gahtani, S. S., Hubona, G. S., & Wang, J. (2007). Information technology (IT) in Saudi
Arabia: Culture and the acceptance and use of IT. Information & Management, 44(8),
681–691. http://doi.org/10.1016/j.im.2007.09.002
Al-Hujran, O., Al-Dalahmeh, M., & Aloudat, A. (2011). The role of national culture on citizen
adoption of e-government services: An empirical study. Electronic Journal of E-
Government, 9(2), 93–106.
Al-Khalifa, H. S. (2010). The accessibility of Saudi Arabia government webites: An
exploratory study. Universal Access in the Information Society, 11(2), 201–210.
Page 140
123
http://doi.org/10.1007/s10209-010-0215-7
Al-Nuaim, H. (2011). An evaluation framework for Saudi e-government. Journal of E-
Government Studies and Best Practices, 1–12. http://doi.org/10.5171/2011.820912
Al-Qeisi, K., & Al-Abdallah, G. M. (2013). Internet banking adoption in Jordan: A behavioral
approach. International Journal of Marketing Studies, 5(6), 84–109.
http://doi.org/10.5539/ijms.v5n6p84
Al-Qeisi, K. I. (2009). Analyzing the Use of UTAUT Model in Explaining an Online Behaviour:
Internet Banking Adoption. Brunel University.
Al-shafi, S., & Weerakkody, V. (2010). Factors affecting e-government adoption in the state
of Qatar. In European and Mediterranean Conference on Information Systems 2010 (Vol.
2010, pp. 1–23).
Al-sobhi, F. (2011). The Roles of Intermediaries in the Adoption of E-Government Services in
Saudi Arabia. Brunel University.
Al-sobhi, F., Weerakkody, V., & El-Haddadeh, R. (2011). The roles of intermediaries in
citizens’ adoption of e-government: A case of Saudi e-government. In tGov Workshop
2011 (Vol. 11, pp. 1–15).
Al-zoubi, M. I., Thi, L. S., & Lim, H. E. (2011). Analysis of e-government adoption and
organization performance in the Jordan business sector. Academic Research
International, 1(3), 334–348.
Alateyah, S., Crowder, R. M., & Wills, G. B. (2012). Citizen adoption of e-government
services. In International Journal of Information Society (i-Society 2012) (pp. 182–187).
AlAwadhi, S., & Morris, A. (2008). The use of the UTAUT model in the adoption of e-
government services in Kuwait. In Proceedings of the 41st Annual Hawaii International
Conference on System Sciences (HICSS 2008) (pp. 219–219). Ieee.
http://doi.org/10.1109/HICSS.2008.452
AlAwadhi, S., & Morris, A. (2009). Factors influencing the adoption of e-government services.
Journal of Software, 4(6), 584–590. http://doi.org/10.4304/jsw.4.6.584-590
Aldrich, D., Bertot, J. C., & McClure, C. R. (2002). E-government: Initiatives, developments
and issues. Government Information Quarterly, 19(4), 349–355.
http://doi.org/10.1016/S0740-624X(02)00130-2
Alfarraj, O., Drew, S., & Alghamdi, R. (2011). EGovernment stage model: Evaluating the rate
of web development progress of government websites in Saudi Arabia. International
Journal of Advanced Computer Science and Applications, 2(9), 82–90.
Alomari, M. K., Sandhu, K., & Woods, P. (2010). Measuring social factors in e-government
Page 141
124
adoption in the Hashemite Kingdom of Jordan. International Journal of Digital Society,
1(2), 123–134.
Alsaghier, H., Ford, M., Nguyen, A., & Hexel, R. (2009). Conceptualising citizen’s trust in e-
government: Application of Q methodology. Electronic Journal of E-Government, 7(4),
295–310.
Alshawi, S., & Alalwany, H. (2009). E-government evaluation: Citizen’s perspective in
developing countries. Information Technology for Development, 15(3), 193–208.
http://doi.org/10.1002/itdj.20125
Alshehri, M., Drew, S., & Alghamdi, R. (2012a). Analysis of citizens acceptance for e-
government services: Applying the UTAUT model. In A. Rodrigues (Ed.), Proceedings
of the IADIS Multi Conference on Computer Science and Information Systems (MCCSIS)
2012 (pp. 69–76). IADIS International Association for Development of the Information
Society.
Alshehri, M., Drew, S., & Alghamdi, R. (2012b). E-Government services: Applying the
UTAUT model. In International Conference Theory and Practice in Modern Computing
and Internet Applications and Research (pp. 69–76).
Alzahrani, M. E., & Goodwin, R. (2012). Towards a UTAUT-based model for the study of e-
government citizen acceptance in Saudi Arabia. In World Academy of Science,
Engineering and Technology 2012 (pp. 8–14).
Ambali, A. R. (2009). E-government policy: Ground issues in e-filing system. European
Journal of Social Sciences, 11(2), 249–266.
Andersen, K. N., Henriksen, H. Z., Medaglia, R., Danziger, J. N., Sannarnes, M. K., &
Enemærke, M. (2010). Fads and Facts of E-Government: A Review of Impacts of E-
government (2003–2009). International Journal of Public Administration, 33(11), 564–
579. http://doi.org/10.1080/01900692.2010.517724
Aziz, S. A., & Idris, K. M. (2012). E-government application: The challanges in Malaysia. In
World Business and Economics Research Conference (pp. 1–11).
http://doi.org/10.2139/ssrn.2184632
Bagozzi, R. P. (2007). The legacy of the technology acceptance model and a proposal for a
paradigm shift . Journal of the Association for Information Systems, 8(4), 244–254.
Barnes, Stuart, & Vidgen, R. T. (2006). Data triangulation and web quality metrics: A case
study in e-government. Information & Management, 43(6), 767–777.
http://doi.org/10.1016/j.im.2006.06.001
Barnes, S. (2011). Increasing survey response rate.
Page 142
125
Belanger, F., & Carter, L. (2008). Trust and risk in e-government adoption. Journal of Strategic
Information Systems, 17, 165–176. http://doi.org/10.1016/j.jsis.2007.12.002
Bélanger, F., & Carter, L. (2008). Trust and risk in e-government adoption. The Journal of
Strategic Information Systems, 17(2), 165–176. http://doi.org/10.1016/j.jsis.2007.12.002
Bhatiasevi, V. (2015). An extended UTAUT model to explain the adoption of mobile banking.
Information Development, 32(4), 799–814. http://doi.org/10.1177/0266666915570764
Bhatiasevi, V. (2016). An extended UTAUT model to explain the adoption of mobile banking.
Information Development, 32(4), 799–814. http://doi.org/10.1177/0266666915570764
Bhatnagar, S. (2002). Egovernment: Lessons from implementation in Developing Countries.
In Regional Development Dialogue (Vol. 24, pp. 1–9).
Bhatnagar, S. (2004). E-government: From vision to implementation. New Delhi: SAGE
Publications, Ltd.
Bhatnagar, S. (2009). Unlocking E-Government Potential: Concepts, Cases and Practical
Insights. New Delhi: SAGE Publications, Ltd.
Bhattacharya, D., Gulla, U., & Gupta, M. P. (2012). E-service quality model for Indian
government portals: Citizens’ perspective. Journal of Enterprise Information
Management, 25(3), 246–271. http://doi.org/10.1108/17410391211224408
Bhuasiri, W., Zo, H., Lee, H., & Ciganek, A. P. (2016). User Acceptance of e-government
Services: Examining an e-tax Filing and Payment System in Thailand. Information
Technology for Development, 22(4), 672–695.
http://doi.org/10.1080/02681102.2016.1173001
Bulmer, M. (1982). When is disguise justified? Alternatives to covert participant observation.
Qualitative Sociology, 5(4), 251–264. http://doi.org/10.1007/BF00986753
Calista, D. J., Melitski, J., Holzer, M., & Manoharan, A. (2010). Digitized government in
worldwide municipalities between 2003 and 2007. International Journal of Public
Administration, 33(12–13), 588–600. http://doi.org/10.1080/01900692.2010.513881
Carter, L., & Bélanger, F. (2005). The utilization of e-government services: Citizen trust,
innovation and acceptance factors. Information Systems Journal, 15(1), 5–25.
http://doi.org/10.1111/j.1365-2575.2005.00183.x
Carter, L., Shaupp, L. C., Hobbs, J., & Campbell, R. (2011). The role of security and trust in
the adoption of online tax filing. Transforming Government: People, Process and Policy,
5(4), 303–318. http://doi.org/10.1108/17506161111173568
Carter, L., & Weerakkody, V. (2008). E-government adoption: A cultural comparison.
Information Systems Frontiers, 10(4), 473–482. http://doi.org/10.1007/s10796-008-9103-
Page 143
126
6
Casaló, L. V., Flavián, C., & Guinalíu, M. (2007). The role of security, privacy, usability and
reputation in the development of online banking. Online Information Review, 31(5), 583–
603. http://doi.org/10.1108/14684520710832315
Chadwick, A., & May, R. (2003). Interaction between states and citizens in the age of the
Internet: E-government in the United States, Britain, and the European Union
Governance. An International Journal of Policy, Administration, and Institutions, 16(2),
271–300.
Chang, H. H., Wang, Y.-H., & Yang, W.-Y. (2009). The impact of e-service quality, customer
satisfaction and loyalty on e-marketing: Moderating effect of perceived value. Total
Quality Management & Business Excellence, 20(4), 423–443.
http://doi.org/10.1080/14783360902781923
Chatzoglou, P., Chatzoudes, D., & Symeonidis, S. (2015). Factors affecting the intention to use
e-government services. In Computer Science and Information Systems (FedCSIS), 2015
Federated Conference on (pp. 1489–1498). IEEE.
Che Azmi, A., & Bee, N. L. (2010). The acceptance of the e-filing system by Malaysian
taxpayers: A simplified model. Electronic Journal of E-Government, 8(1), 13–22.
Cheema, G. S., & Hussein, S. A. (1978). Local government reform in Malaysia. Asian Survey,
18(6), 577–591.
Chen, Y. N., Chen, H. M., Huang, W., & Ching, R. K. H. (2006). E-government strategies in
developed and developing countries. Journal of Global Information Management, 14(1),
23–46. http://doi.org/10.4018/jgim.2006010102
Chiemeke, S. C., & Evwiekpaefe, A. E. (2011). A conceptual framework of a modified unified
theory of acceptance and use of technology (UTAUT) Model with Nigerian factors in E-
commerce adoption. Educational Research, 2(12), 1719–1726.
Churchill Jr, G. A. (1979). A paradigm for developing better measures of marketing constructs.
Journal of Marketing Research, 64–73.
Cohen, J., Cohen, P., West, S. G., & Aiken, L. S. (2013). Applied Multiple
Regression/Correlation Analysis for the Behavioral sSciences. Routledge.
Colesca, S. E. (2009). Understanding trust in e-government. Economic of Engineering
Decisions, (3), 7–15.
Comrey, A. L., & Lee, H. B. (1992). A first course in factor analysis (Second). Hillsdale, NJ:
Lawrence Erlbaum.
Conboy, K., Fitzgerald, G., & Mathiassen, L. (2012). Qualitative methods research in
Page 144
127
information systems: Motivations, themes, and contributions. European Journal of
Information Systems, 21(2), 113–118. http://doi.org/10.1057/ejis.2011.57
Costello, A. B., & Osborne, J. W. (2005). Best practices in exploratory factor analysis: Four
recommendations for getting the most from your analysis. Practical Assessment Research
& Evaluation, 10(7), 1–10.
Creswell, J. W. (2003). Research design qualitative, quantitative, and mixed methods
approaches (2nd Ed). Thousand Oaks, CA: SAGE Publications Ltd.
Dada, D. (2006). The failure of e-government in developing countries: A literature review. The
Electronic Journal of Information Systems in Developing Countries, 26(1), 1–10.
Dajani, D., & Yaseen, S. G. (2016). The applicability of technology acceptance models in the
Arab business setting. Journal of Business and Retail Management Research (JBRMR)
Www.jbrmr.com A Journal of the Academy of Business and Retail Management, 10(3),
46–57.
Davis, F. (1989). Perceived usefulness, perceived ease of use, and user acceptance of
information technology. MIS Quarterly, 13(3), 319–339.
De Vaus, D. A. (2002). Surveys in social research (5th ed). St. Leonards, N.S.W: Allen &
Unwin.
Department of Statistics. (2014). Labour Force Survey Report 2013. Retrieved from
http://www.statistics.gov.my/portal/download_Labour/files/labour_force/Labour_Force_
Survey_Report_Malaysia_2013.pdf
Department of Statistics. (2016). Current Population Estimates, Malaysia, 2016-2017.
Retrieved from
https://www.dosm.gov.my/v1/index.php?r=column/cthemeByCat&cat=155&bul_id=a1d
1UTFZazd5ajJiRWFHNDduOXFFQT09&menu_id=L0pheU43NWJwRWVSZklWdzQ
4TlhUUT09
Deursen, A. Van, Dijk, J. Van, & Ebbers, W. (2006). Why e-government usage lags behind:
Explaining the gap between potential and actual usage of electronic public services in the
Netherlands. In Electronic Government. EGOV 2006 (pp. 269–280).
Dick, B., & Swepson, P. (1997). Action research FAQ: “frequently asked questions.”
Retrieved from http://www.scu.edu.au/schools/gcm/ar/arp/arfa
Dillman, D. A. (2007). Mail and internet surveys: The tailored design method (2nd). Hoboken,
NJ: Wiley.
Dorasamy, M., Marimuthu, M., Raman, M., & Kaliannan, M. (2010). E-government services
online: An exploratory study on tax e-Filing in Malaysia. International Journal of
Page 145
128
Electronic Government Research, 6(4), 12–24. http://doi.org/10.4018/jegr.2010100102
Dwivedi, Y. K., Rana, N. P., Janssen, M., Lal, B., Williams, M. D., & Clement, M. (2017). An
empirical validation of a unified model of electronic government adoption (UMEGA).
Government Information Quarterly, 34(2), 211–230.
http://doi.org/10.1016/j.giq.2017.03.001
Ebrahim, Z., & Irani, Z. (2005). E-government adoption: Architecture and barriers. Business
Process Management Journal, 11(5), 589–611.
http://doi.org/10.1108/14637150510619902
Economic Plannning Unit of Selangor. (2011). Population forecast in local authority area in
Selangor, 2010. Retrieved from
https://www.dosm.gov.my/v1/index.php?r=column/cone&menu_id=ZmVrN2FoYnBvZ
E05T1AzK0RLcEtiZz09
Elling, S., Lentz, L., de Jong, M., & van den Bergh, H. (2012). Measuring the quality of
governmental websites in a controlled versus an online setting with the “Website
Evaluation Questionnaire.” Government Information Quarterly, 29(3), 383–393.
http://doi.org/10.1016/j.giq.2011.11.004
Evans, D., & Yen, D. C. (2006). E-government: Evolving relationship of citizens and
government, domestic, and international development. Government Information
Quarterly, 23(2), 207–235. http://doi.org/10.1016/j.giq.2005.11.004
Eze, U. C., Goh, M. H., Ling, H. Y., & Lee, C. H. (2011). Intention to use e-government
services in Malaysia: Perspective of individual users. In Informatics Engineering and
Information Science (ICIEIS) Part II (pp. 512–526).
Faaeq, M., Alqasa, K., & Al-Matari, E. M. (2015). Technology adoption and innovation of e-
government in Republic of Iraq. Asian Social Science;, 11(3), 135–146.
http://doi.org/10.5539/ass.v11n3p135
Fabrigar, L. ., Wegener, D. ., MacCallum, R. ., & Strahan, E. . (1999). Evaluating the use of
exploratory factor analysis in psychological research. Psychological Methods, 4(3), 272–
299.
Faruq Muhammad Abubakar, & Ahmad, H. (2013). The Moderating effect of technology
awareness on the relationship between UTAUT constructs and behavioural intention to
use technology. Australian Journal of Business and Management Research, 3(2), 14–23.
Field, A. (2005). Discovering statistics using SPSS (2nd ed.). London: SAGE Publications Ltd.
Fishbein, M., & Ajzen, I. (1975). Belief, attitude, intention, and behavior: An introduction to
theory and research. Reading, MA: Addison-Wesley.
Page 146
129
Fornell, C., & Larcker, D. F. (1981). Evaluating structural equation models with unobservable
variables and measurement error. Journal of Marketing Research, 18(1), 39–50.
Fu, J.-R., Farn, C.-K., & Chao, W.-P. (2006). Acceptance of electronic tax filing: A study of
taxpayer intentions. Information & Management, 43(1), 109–126.
http://doi.org/10.1016/j.im.2005.04.001
Gauld, R., & Goldfinch, S. (2006). Dangerous enthusiasms: E-government, computer failure
and information system development. Dunedin, New Zealand: Otago University Press.
Gautrin, H. F. (2004). Connecting Quebec to its citizens. Report on E-Government for Verdun,
Parliamentary Assistant to the Premier.
Gefen, D., Karahanna, E., & Straub, D. W. (2003). Trust and TAM in online shopping: An
integrated model. MIS Quarterly, 27(1), 51–90.
Ghani, E., & Said, J. (2010). Digital reporting practices among Malaysian local authorities.
Electronic Journal of E-Government, 8(1), 33–44.
Gilbert, D., Balestrini, P., & Littleboy, D. (2004). Barriers and benefits in the adoption of e-
government. International Journal of Public Sector Management, 17(4), 286–301.
http://doi.org/10.1108/09513550410539794
Gorsuch, R. L. (1983). Factor analysis (2nd ed.). Hillsdale, NJ: Lawrence Erlbaum.
Graneheim, U. H., & Lundman, B. (2004). Qualitative content analysis in nursing research:
Concepts, procedures and measures to achieve trustworthiness. Nurse Education Today,
24(2), 105–112.
Habing, B. (2003). Exploratory factor analysis. Retrieved September 15, 2015, from
http://people.stat.sc.edu/habing/courses/530EFA.pdf
Hair, J. F., Black, W. C., Babin, B. J., & Anderson, R. E. (2009). Multivariate data analysis.
Prentice Hall.
Hair, J. F., Black, W. C., Babin, B. J., & Anderson, R. E. (2010). Multivariate data analysis.
2010 (Seventh). Upper Saddle River, NJ: Prentice Hall.
Halaweh, M. (2012). Integration of grounded theory and case study: An exemplary application
from e-Commerce security perception research. Journal of Information Technology
Theory and Application, 13(1), 31–51.
Hashim, K. F. (2012). Understanding the determinants of continuous knowledge sharing
intention within business online communities. Auckland University of Technology.
Hassan, N. H., & Palil, M. R. (2012). Factors influencing society’s usage of e-goverment
services: A study on e-filing. In Persidangan Kebangsaan Ekonomi Malaysia ke VI
(PERKEM VI) (Vol. 1, pp. 203–210).
Page 147
130
Hazman Shah, A., & Kaliannan, M. (2008). From customer satisfaction to citizen satisfaction:
rethinking local government service delivery in Malaysia. Asian Social Science, 4(11),
87–92.
Heath, W. (2000). Europe’s Readiness for E-government. England.
Heeks, R. (2006). Understanding and measuring e-government: International benchmarking
studies. In E-Participation and E-Government: Understanding the Present and Creating
the Future (pp. 27–28).
Henman, P. (1996). Does computerisation save governments money? Information
Infrastructure and Policy, 5, 235–252.
Henman, P. (2013). Government and the Internet: Evolving technologies, enduring research
themes. In W. Dutton (Ed.), The Oxford handbook of Internet studies (pp. 283–306).
Oxford University Press.
Holden, R. J., & Karsh, B.-T. (2010). The technology acceptance model: Its past and its future
in health care. Journal of Biomedical Informatics, 43(1), 159–72.
http://doi.org/10.1016/j.jbi.2009.07.002
Hong, T. (2012). Predicting Taxpayers ’ Intentions of Adopting Electronic Tax-Filing ( E-
Filing ) in Malaysia, 19(2), 59–71.
Horst, M., Kuttschreuter, M., & Gutteling, J. M. (2007). Perceived usefulness, personal
experiences, risk perception and trust as determinants of adoption of e-government
services in The Netherlands. Computers in Human Behavior, 23(4), 1838–1852.
http://doi.org/10.1016/j.chb.2005.11.003
Hossan, C. G., Habib, M. W., & Kushchu. (2006). Success and failure factors for e-government
projects implementation in developing countries: A study on the perception of
government officials of Bangladesh. In Proceedings of the 2nd European Conference on
Mobile Government, Mobile Government Consortium International. Retrieved from
www.mgovernment.org/resurces/euromgvo2006/PDF/9_Chowdhury.pdf
Hung, S.-Y., Chang, C.-M., & Yu, T.-J. (2006). Determinants of user acceptance of the e-
government services: The case of online tax filing and payment system. Government
Information Quarterly, 23(1), 97–122. http://doi.org/10.1016/j.giq.2005.11.005
Hussein, R., Karim, N. S. A., & Selamat, M. H. (2007). The impact of technological factors on
information systems success in the electronic-government context. Business Process
Management Journal, 13(5), 613–627. http://doi.org/10.1108/14637150710823110
Hussein, R., Mohamed, N., Ahlan, A. R., & Mahmud, M. (2011). E-government application:
An integrated model on G2C adoption of online tax. Transforming Government: People,
Page 148
131
Process and Policy, 5(3), 225–248. http://doi.org/10.1108/17506161111155388
Hussein, R., Mohamed, N., Rahman Ahlan, A., & Mahmud, M. (2011). E-government
application: An integrated model on G2C adoption of online tax. Transforming
Government: People, Process and Policy, 5(3), 225–248.
http://doi.org/10.1108/17506161111155388
Ibrahim, I., & Pope, J. (2011). Compliance costs of electronic tax filing for personal taxpayers
in Malaysia. In International Conference on Manangement (ICM 2011) (pp. 927–940).
Inland Revenue Board of Malaysia. (2012). Annual Report 2012. Retrieved from
http://www.hasil.gov.my/pdf/pdfam/AR2010_2.pdf
Irani, Z., Weerakkody, V., Kamal, M., Hindi, N. M., Osman, I. H., Anouze, A. L., … Al-
Ayoubi, B. (2012). An analysis of methodologies utilised in e-government research: A
user satisfaction perspective. Journal of Enterprise Information Management, 25(3), 298–
313. http://doi.org/10.1108/17410391211224417
Islam, A., Muhd Yusuf, D. H., Yusoff, W. S., & Johari, A. N. (2012). Factors affecting user
satisfaction in the Malaysian income tax e-filing system. African Journal of Business
Management, 6(21), 6447–6455. http://doi.org/10.5897/AJBM11.1689
Israel, D., & Tiwari, R. (2011). Empirical study of factors influencing acceptance of e-
government services in India. Proceedings of the 5th International Conference on Theory
and Practice of Electronic Governance - ICEGOV ’11, 141.
http://doi.org/10.1145/2072069.2072093
Izatun, S. (2008, April 22). Almost half a million taxpayers now using e-filing. The Star.
Janesick, V. (1993). The dance of qualitative research design. In N. K. Denzin & Y. S. Lincoln
(Eds.), The Handbook of Qualitative Research. Sage Publications, CA.
Kaliannan, M., Awang, H., & Raman, M. (n.d.). Technology Adoption in the Public Sector:
An Exploratory Study of e- Government in Malaysia.
Karavasilis, I., Vrana, V. G., & Zafiropoulos, K. (2016). An Extended Model of E-Government
Adoption by Civil Servants in Greece. International Journal of Electronic Government
Research, 12(1), 1–23. http://doi.org/10.4018/IJEGR.2016010101
Kardaras, D. K., & Papathanassiou, E. A. (2008). An exploratory study of the e-government
services in Greece. In G. Garson & M. Khosrow-Pour (Eds.), Handbook of Research on
Public Information Technology (pp. 162–174). http://doi.org/10.4018/978-1-59904-857-
4.ch016
Kaur, J., & Rashid, N. D. (2008). Malaysian electronic government adoption barriers. Public
Page 149
132
Sector ICT Management Review, 2(1), 38–43. Retrieved from
papers3://publication/uuid/227876F4-DB11-41BE-B702-3921E992DE37
Kaur, M., & Singh, A. (2015). E-government: Challenges for acceptance and adoption in State
of Punjab. International Journal of Computer Applications, 109(15).
Khattab, A. Al, Al-Shalabi, H., Al-Rawad, M., Al-Khattab, K., & Hamad, Fa. (2015). The
effect of trust and risk perception on citizen’s intention to adopt and use e-government
services in Jordan. Journal of Service Science and Management, 8, 279–290.
Kianpisheh, A., Mustaffa, N., Mei Yean See, J., & Keikhosrokiani, P. (2011). User behavioral
intention toward using smart parking system. In A. Abd Manaf, A. Zeki, M. Zamani, S.
Chuprat, & E. El-Qawasmeh (Eds.), Informatics Engineering and Information Science:
International Conference, ICIEIS 2011 (pp. 732–743). Berlin, Heidelberg: Springer
Berlin Heidelberg. http://doi.org/10.1007/978-3-642-25453-6_61
Kim, D. J., Ferrin, D. L., & Rao, H. R. (2008). A trust-based consumer decision-making model
in electronic commerce: The role of trust, perceived risk, and their antecedents. Decision
Support Systems, 44(2), 544–564. http://doi.org/10.1016/j.dss.2007.07.001
King, N. (2008). Template analysis. Retrieved from
http://www.hud.ac.uk/hhs/research/template-analysis/technique/
Kline, P. (1994). An easy guide to factor analysis. London: Routledge.
Kootstra, G. J. (2004). Exploratory factor analysis: Theory and application. Retrieved
September 1, 2015, from http://www.let.rug.nl/nerbonne/teach/rema-stats-meth-
seminar/Factor-Analysis-Kootstra-04.PDF
Kumar, V., Mukerji, B., Butt, I., & Persaud, A. (2007). Factors for successful e-government
adoption: A conceptual framework. The Electronic Journal of E-Government, 5(1), 63–
76.
Kurfali, M., Arifoğlu, A., Tokdemir, G., & Paçin, Y. (2017). Adoption of e-government
services in Turkey. Computers in Human Behavior, 66, 168–178.
http://doi.org/10.1016/j.chb.2016.09.041
Lacey, A., & Luff, D. (2009). Qualitative Data Analysis. London: The NIHR RDS for the East
Midlands, Yorkshire and the Humber.
Lai, D. C., Lai, I. K., & Jordan, E. (2009). An extended UTAUT model for the study of negative
user adoption behaviours of mobile commerce. In The 9th International Conference on
Electronic Business, Macau (p. 720). Macau.
Lallmahomed, M. Z. I., Lallmahomed, N., & Lallmahomed, G. M. (2017). Factors influencing
the adoption of e-government services in Mauritius. Telematics and Informatics, 34(4),
Page 150
133
57–72. http://doi.org/10.1016/j.tele.2017.01.003
Lam, W. (2005). Barriers to e-government integration. Journal of Enterprise Information
Management, 18(5), 511–530. http://doi.org/10.1108/17410390510623981
Lapsley, I., & Pallot, J. (2000). Accounting, management and organizational change: A
comparative study of local government. Management Accounting Research, 11(2), 213–
229.
Layne, K., & Lee, J. W. (2001). Developing fully functional e-government: A four stage model.
, 18(2), 122–136. Government Information Quarterly, 18(2), 122–136.
Lean, O. K., Zailani, S., Ramayah, T., & Fernando, Y. (2009). Factors influencing intention to
use e-government services among citizens in Malaysia. International Journal of
Information Management, 29(6), 458–475. Retrieved from
http://linkinghub.elsevier.com/retrieve/pii/S0268401209000334
Lee, Y., Kozar, K. A., & Larsen, K. R. T. (2003). The technology acceptance model: Past,
present, and future. Communications of the Association for Information System, 12(1),
752–780.
Lee, Y., Kozar, K. A., & Larsen, K. R. T. (2003). The Technology Acceptance Model: Past,
present, and future. Communications of the Association for Information Systems Volume,
12(50). Retrieved from http://aisel.aisnet.org/cais/vol12/iss1/50
Levy, D. (2006). Qualitative methodology and grounded theory in property research. Pacific
Rim Property Research Journal, 12(4), 369–388.
Lincoln, Y. S., & Guba, E. G. (1985). Naturalistic inquiry. Beverly Hills, CA: Sage.
Lu, C., Huang, S., & Lo, P. (2010). An empirical study of online tax filing acceptance model:
Integrating TAM and TPB. African Journal of Business Management Vol., 4(5), 800–810.
Luna-Reyes, L. F., & Gil-Garcia, J. R. (2011). Using institutional theory and dynamic
simulation to understand complex e-government phenomena. Government Information
Quarterly, 28(3), 329–345. http://doi.org/10.1016/j.giq.2010.08.007
MacCallum, R. C., Widaman, K. F., Zhang, S., & Hong, S. (1999). Sample size in factor
analysis: Psychological methods. Psychological Methods, 4, 84–99.
Mahbob, M. H., Nordin, M. Z., Salman, A., Sulaiman, W. I. W., & Abdullah, M. Y. (2011).
Government to citizen: Advocacy of government on-line systems and their acceptance
among citizens. The Innovation Journal: The Public Sector Innovation Journal, 16(3), 2–
14.
Makoza, F. (2013). The level of e-government implementation: Case of Malawi. Electronic
Journal of E-Government, 11(2), 268–279. http://doi.org/10.4018/978-1-4666-6296-
Page 151
134
4.ch013
Malaysian Administrative Modernisation and Management Planning Unit (MAMPU). (1997).
Electronic government flagship application. Retrieved from
http://unpan1.un.org/intradoc/groups/public/documents/apcity/unpan015129.pdf
Malaysian Communications and Multimedia Commission. (2015). Communications and
Multimedia: Pocket Book of Statistics.
Maniam, K., & Halimah, A. (2010). Adoption and use of e-government services: A case study
on e-Procurement in Malaysia. World Scientific and Engineering Academy and Society
(WSEAS)., 7(1), 1–10.
Marchewka, J. T., Liu, C., & Kostiwa, K. (2007). An Application of the UTAUT model for
understanding student perceptions using course management software. Communications
of the IIMA, 7(2), 93–104.
Mayer, R. C., Davis, J. H., & Schoorman, F. D. (1995). An integrative model of organizational
trust. The Academy of Management Review, 20(3), 709–734.
http://doi.org/10.2307/258792
Mei-Ying, W., Pei-Yuan, Y., & Yung-Chien, W. (2012). A study on user behavior for I pass
by UTAUT: Using Taiwan’s MRT as an example. Asia Pacific Management Review,
17(1), 91–111.
Mohd Idris, S. H. (2016). Significant factors determining E-government adoption in Selangor,
Malaysia. Acta Universitatis Danubius. Œconomica), 12(3).
Mohd Idris, S. H., Kasimin, H., & Sahari, N. (2011). Identifying barriers to the adoption of e-
government services in Malaysia. In Prodising PERKEM (Vol. 1, pp. 211–217).
Mohd Suki, N., & Mohd Suki, N. (2017). Flight ticket booking app on mobile devices:
Examining the determinants of individual intention to use. Journal of Air Transport
Management, 62, 146–154. http://doi.org/10.1016/j.jairtraman.2017.04.003
Mohd Suki, N., & Ramayah, T. (2010). User acceptance of the e-government services in
Malaysia: Structural Equation Modelling approach. Interdisciplinary Journal of
Information, Knowledge and Management, 5, 395–413.
Mohsin, A., & Raha, O. (2007). Implementation of electronic government in Malaysia: The
status and potential for better service to the public. Public Sector ICT Management
Review, 1(1).
Moodley, T., & Govender, I. (2016). Factors influencing academic use of internet banking
services: An empirical study. African Journal of Science, Technology, Innovation and
Development, 8(1), 43–51. http://doi.org/10.1080/20421338.2015.1128043
Page 152
135
Moon, J., & Kim, Y. (2001). Extending the TAM for a World-Wide-Web context. Information
& Management, 38(2001), 217–230.
Moore, G. C., & Benbasat, I. (1991). Development of an instrument to measure the perceptions
of adopting an information technology innovation. Information Systems Research, 2(3),
192–222.
Moorthy, M. K., Samsuri, A. S. B., Hussin, S. B. M., Othman, M. S. B., & Chelliah, M. K.
(2014). E-filing behaviour among academics in Perak State in Malaysia. Technology and
Investment, 5(2), 79–94. http://doi.org/10.4236/ti.2014.52009
Murphy, F. J., & Yielder, J. (2010). Establishing rigour in qualitative radiography research.
Radiography, 16(1), 62–67.
Nam, T. (2014). Determining the type of e-government use. Government Information
Quarterly, 31(2), 211–220.
Nugroho, R. (2015). Electronic government adoption in developing countries: The case of the
Indonesian electronic procurement system. University of Queensland.
Nurdin, N., Stockdale, R., & Scheepers, H. (2011). Understanding organizational barriers
influencing local electronic government adoption and implementation: The electronic
government implementation framework. Journal of Theoretical and Applied Electronic
Commerce Research, 6(3), 5–6. http://doi.org/10.4067/S0718-18762011000300003
Orji, R. O., Cetin, Y. Y., & Ozkan, S. (2010). Critical factors in electronic library acceptance:
Empirical validation of nationality based UTAUT using SEM. In ADIS International
Conference WWW/Internet (pp. 81–88).
Oye, N. D., Lahad, N. A., & Ab. Rahim, N. (2012). The history of UTAUT model and its
impact on ICT acceptance and usage by academicians. Education and Information
Technologies, 19(1), 251–270. http://doi.org/10.1007/s10639-012-9189-9
Ozkan, S., & Kanat, I. E. (2011). E-government adoption model based on theory of planned
behavior: Empirical validation. Government Information Quarterly, 28(4), 503–513.
http://doi.org/10.1016/j.giq.2010.10.007
Pallant, J. (2007). Survival Manual a Step By Step Guide to Data Analysis using SPSS for
Windows. New York: Open University Press.
Papadopoulou, P., Nikolaidou, M., & Martakos, D. (2010). What is trust in e-government? A
proposed typology. In System Sciences (HICSS), 2010 43rd Hawaii International
Conference on (pp. 1–10). IEEE.
Parajuli, J. (2007). A content analysis of selected government web sites: A case study of Nepal.
The Electronic Journal of E-Government, 5(1), 87–94.
Page 153
136
Pavlou, P. (2003). Consumer acceptance of electronic commerce: Integrating trust and risk
with the technology acceptance model. International Journal of Electronic Commerce,
7(3), 69–103.
Petter, S., DeLone, W., & McLean, E. (2008). Measuring information systems success: models,
dimensions, measures, and interrelationships. European Journal of Information Systems,
17(3), 236–263. http://doi.org/10.1057/ejis.2008.15
Phang, C. W., Li, Y., Sutanto, J., & Kankanhalli, A. (2005). Senior citizens’ adoption of e-
government: In quest of the antecedents of perceived usefulness. In System Sciences,
2005. HICSS’05. Proceedings of the 38th Annual Hawaii International Conference on (p.
130a–130a). IEEE.
Pitchay, M. C. P., Ramayah, T., Alzahrani, A. I., Alfarraj, O., & Alalwan, N. (2016). E-
government service delivery by a local government agency: The case of E-licensing.
Telematics and Informatics, 33(4), 925–935. http://doi.org/10.1016/j.tele.2016.02.003
Pizzella, P. (2005). GovBenefits.gov: A valuable e-government tool for citizens. Public
Manager, 34(2), 37.
Plouffe, C., Julland, J., & Vandenbosch, M. (2001). Research report: Richness versus
parsimony in modeling technology adoption decisions – understanding merchant adoption
of a smart card-based payment system. Information Systems Research, 12(2), 208–222.
Rahman, A. L. A., Jamaludin, A., & Mahmud, Z. (2011). Intention to use digital library based
on modified UTAUT model: Perspectives of Malaysian postgraduate students. World
Academy of Science, Engineering and Technology, International Journal of Social,
Behavioral, Educational, Economic, Business and Industrial Engineering, 5(3), 116–122.
Ramayah, T., Ramoo, V., & Ibrahim, A. (2008). Profiling online and manual tax filers: Results
from an exploratory study in Penang, Malaysia. Labuan E-Journal of Muamalat and
Society, 2(December 2006), 1–8.
Rana, N. P., & Dwivedi, Y. K. (2015). Citizen’s adoption of an e-government system:
Validating extended social cognitive theory (SCT). Government Information Quarterly,
32(2), 172–181. http://doi.org/10.1016/j.giq.2015.02.002
Rana, N. P., Dwivedi, Y. K., Lal, B., Williams, M. D., & Clement, M. (2017). Citizens’
adoption of an electronic government system: towards a unified view. Information
Systems Frontiers, 19(3), 549–568. http://doi.org/10.1007/s10796-015-9613-y
Rana, N. P., Dwivedi, Y. K., & Williams, M. D. (2013). Evaluating alternative theoretical
models for examining citizen centric adoption of e-government. Transforming
Page 154
137
Government: People, Process and Policy, 7(1), 27–49.
http://doi.org/10.1108/17506161311308151
Rana, N. P., Dwivedi, Y. K., & Williams, M. D. (2015). A meta-analysis of existing research
on citizen adoption of e-government. Information Systems Frontiers, 17(3), 547–563.
http://doi.org/10.1007/s10796-013-9431-z
Rana, N. P., Williams, M. D., Dwivedi, Y. K., & Williams, J. (2012). Theories and theoretical
models for examining the e-government services. E-Service Journal, 8(2), 26–56.
http://doi.org/10.1353/esj.2012.0002
Rehman, M., Esichaikul, V., & Kamal, M. (2012). Factors influencing e-government adoption
in Pakistan. Transforming Government: People, Process and Policy, 6(3), 258–282.
http://doi.org/10.1108/17506161211251263
Rietveld, T., & Van Hout, R. (1993). Statistical techniques for the study of language and
language behaviour. Berlin – New York: Mouton de Gruyter.
Rogers, E. M. (1995). Diffusion of Innovations (4th ed.). New York: Free Press.
Rokhman, A. (2011). E-Government adoption in developing countries: The case of Indonesia.
Journal of Emerging Trends in Computing and Information Sciences, 2(5).
Roscoe, J. T. (1975). Fundamental Research Statistics for the Behavioral Sciences (2nd Ed.).
New York: Holt, Rinehart and Winston.
Rotchanakitumnuai, S. (2008). Measuring e-government service value with the E-
GOVSQUAL-RISK model. Business Process Management Journal, 14(5), 724–737.
http://doi.org/10.1108/14637150810903075
Rotter, J. B. (1967). A new scale for the measurement of interpersonal trust. Journal of
Personality, 35(4), 651–665.
Roushdy, A. S. (2012). Barriers to e-government implementation and usage in Egypt. The
Journal of American Academy of Business, Cambridge, 18(1), 185–198.
Rubin, A., & Babbie, E. R. (2008). Research Methods for Social Work. Belmont, CA:
Thomson/Brooks/Cole.
Rufín, R., Medina, C., & Figueroa, J. C. S. (2012). Moderating Factors in Adopting Local e-
Government in Spain. Local Government Studies, 38(3), 367–385.
Russell, C. J., & Bobko, P. (1992). Moderated regression analysis and likert scales: Too coarse
for comfort. The Journal of Applied Psychology, 77(3), 336–42. Retrieved from
http://www.ncbi.nlm.nih.gov/pubmed/1601825
Salman, A., & Mohd Safar, H. (2011). Internet usage in a Malaysian sub-urban community: A
study of diffusion of ICT innovation. The Public Sector Innovation Journal, 16(2).
Page 155
138
Sang, S., Lee, J.-D., & Lee, J. (2010). E-government adoption in Cambodia: A Partial Least
Squares approach. Transforming Government: People, Process and Policy, 4(2), 138–
157. http://doi.org/10.1108/17506161011047370
Santhanamery, T., & Ramayah, T. (2012). Continued usage intention of e-filing system in
Malaysia: The role of optimism bias. Procedia-Social and Behavioral Sciences, 65, 397–
403.
Saunders, M., Lewis, P., & Thornhill, A. (2009). Research Methods for Business Students
(Fifth Edit). England.
Sekaran, U. (2003). Research Methods for Business. A skill Building Approach (4th ed.). New
York, NY: John Wiley & Sons.
Shareef, M. A., Archer, N., Sharan, V., & Kumar, V. (2010). Critical factors for adoption of e-
government: Validity of adoption model in Indian context. In C. G. Reddick (Ed.),
Comparative E-Government, Integrated Series in Information Systems (Vol. 25, pp. 371–
388). New York, NY: Springer New York. http://doi.org/10.1007/978-1-4419-6536-3
Shenton, A. K. (2004). Strategies for ensuring trustworthiness in qualitative research projects.
Education for Information, 22, 63–75.
Siau, K., & Long, Y. (2005). Synthesizing e-government stage models – a meta-synthesis based
on meta- ethnography approach. Industrial Management & Data Systems, 10(5), 443–
458.
Siddiquee, N. A. (2008). E-government and innovations in service delivery: The Malaysian
experience. International Journal of Public Administration, 31(7), 797–815.
http://doi.org/10.1080/01900690802153053
Sin, T. K. (2009). An empirical study of Internet-based ICT adoption among SMEs in Southern
Malaysia. Multimedia University.
Sousa, R., & Voss, C. (2012). The impacts of e-service quality on customer behaviour in multi-
channel e-services. Total Quality Management & Business Excellence, 23(7), 789–806.
Srite, M. (2006). Culture as an explanation of technology acceptance differences: An empirical
investigation of Chinese and US users. Australasian Journal of Information Systems,
14(1), 5–26.
Stake, R. (1995). The Art of Case Research. Sage, Newbury Park, CA.
Stewart, D. W., & Shamdasani, P. N. (1990). Focus groups: Theory and practice. Newbury
Park, CA: SAGE Publications Inc.
Straub, D. (1989). Validating instruments in MIS research. MIS Quarterly, 6, 147–66.
Straub, D., Boudreau, M.-C., & Gefen, D. (2004). Validation guidelines for IS positivist
Page 156
139
research. Communications of the AIS, 13, 380–427.
Strauss, A., & Corbin, J. (1998). The Basics of Qualitative Research: Techniques and
Procedures for Developing Grounded Theory. Thousand Oaks, CA: Sage Publications.
Sun, H., & Zhang, P. (2006). The role of moderating factors in user technology acceptance.
International Journal of Human-Computer Studies, 64(2), 53–78.
http://doi.org/10.1016/j.ijhcs.2005.04.013
Tabachnick, B. G., & Fidell, L. S. (2001). Using Multivariate Statistics. Boston, MA: Allyn
and Bacon.
Taiwo, A. A., Mahmood, A. K., & Downe, A. G. (2012). User acceptance of eGovernment :
Integrating risk and trust dimensions with UTAUT model. In International Conference on
Computer & Information Science (ICCIS) (pp. 109–113).
http://doi.org/10.1109/ICCISci.2012.6297222
Tan, C. W., Benbasat, I., & Cenfetelli, R. T. (2008). Building citizen trust towards e-
government services: do high quality websites matter? In Hawaii International
Conference on System Sciences, Proceedings of the 41st Annual (p. 217). IEEE.
Tan, E., & Leby Lau, J. (2016). Behavioural intention to adopt mobile banking among the
millennial generation. Young Consumers, 17(1), 18–31. http://doi.org/10.1108/YC-07-
2015-00537
Taylor-Powell, E., & Renner, M. (2003). Analysing Qualitative Data, Program Development
and Evaluation Series. United States: University of Wisconsin.
Taylor, S., & Todd, A. (1995). Understanding information technology usage: A test of
competing models. Information Systems Research, 6(2), 144–176.
Teck Hong, T., & Yin-Fah, F. (2012). Predicting taxpayers’ intentions of adopting electronic
tax-filing (E-Filing) in Malaysia. Journal of Accounting – Business & Management, 19(2),
59–71.
Templeton, G. F., Lewis, B. R., & Snyder, C. A. (2002). Development of a measure for the
organisational learning construct. Journal of Management Information Systems, 19(2),
175–218.
Teo, T. S. H., Srivastava, S. C., & Jiang, L. (2008). Trust and electronic government success:
An empirical study. Journal of Management Information Systems, 25(3), 99–132.
http://doi.org/10.2753/MIS0742-1222250303
The Star Online. (2007). Good Response to E-filing. Retrieved from
http://www.thestar.com.my/news/nation/2006/04/27/good-response-to-efiling/
The United Nations and American Society for Public Administration (UNASPA). (2001).
Page 157
140
Global survey of e-government.
Thompson, T., Srivastava, S. C., & Jiang, L. (2008). Trust and electronic government success:
An empirical study. Journal of Management Information Systems, 25(3), 99–132.
http://doi.org/10.2753/MIS0742-1222250303
Thompson, T., Vivien, L., & Raye, L. (1999). Intrinsic and extrinsic motivation in Internet
usage. Omega, 27(1), 25–37. http://doi.org//10.1016/S0305-0483(98)00028-0
Tolbert, C. J., & Mossberger, K. (2006). The effects of e-government on trust and confidence
in government. Public Administration Review, (May-June), 354–369.
Umbach, P. D. (2005). Web surveys: Best practices. New Directions for Institutional Research,
(121), 23–38.
United Nations. (2012). UN E-government survey: E-government for the people. Retrieved
from http://unpan1.un.org/intradoc/groups/public/documents/un/unpan048065.pdf
United Nations. (2014). United Nations E-Government Survey 2014: E-Government for the
Future We Want. Retrieved from https://publicadministration.un.org/egovkb/en-
us/Reports/UN-E-Government-Survey-2014
Venkatesh, V., Morris, M. G., Davis, G. B., & Davis, F. D. (2003). User acceptance of
information technology: Toward a unified view. MIS Quarterly, 27(3), 425–478.
Venkatesh, V., Thong, J. Y. L., Chan, F. K. Y., Hu, P. J.-H., & Brown, S. A. (2011). Extending
the two-stage information systems continuance model: Incorporating UTAUT predictors
and the role of context. Information Systems Journal, 21(6), 527–555.
http://doi.org/10.1111/j.1365-2575.2011.00373.x
Warkentin, M., Gefen, D., Pavlou, P. A., & Rose, G. M. (2002). Encouraging citizen adoption
of e-government by building trust. Electronic Markets, 12(3), 157–162.
http://doi.org/10.1080/101967802320245929
WASEDA. (2012). The 2012 Waseda University International e-Government Ranking.
Retrieved from http://www.e-gov.waseda.ac.jp/images/Press Released on e-Gov ranking
2012.pdf
Weerakkody, V., Dwivedi, Y. K., Brooks, L., Williams, M. D., & Mwange, A. (2007). E-
government implementation in Zambia: Contributing factors. Electronic Government, an
International Journal, 4(4), 484–508. http://doi.org/10.1504/EG.2007.015040
Weerakkody, V., El-Haddadeh, R., Al-Sobhi, F., Shareef, M. A., & Dwivedi, Y. K. (2013).
Examining the influence of intermediaries in facilitating e-government adoption: An
empirical investigation. International Journal of Information Management, 33(5), 716–
725. http://doi.org/10.1016/j.ijinfomgt.2013.05.001
Page 158
141
Welch, E. W., Hinnant, C. C., & Moon, M. J. (2005). Linking citizen satisfaction with e-
government and trust in government. Journal of Public Administration Research and
Theory, 15(3), 371–391.
West, D. M. (2004). E-government and the transformation of service delivery and citizen
attitudes. Public Administration Review, 64(1), 15–27.
Williams, B., Brown, T., & Onsman, A. (2012). Exploratory factor analysis: A five-step guide
for novices. Australian Journal of Paramedicine, 8(3), 1–13.
Williams, M. D., Nripendra, P. R., & Dwivedi, Y. K. (2015). The Unified Theory of
Acceptance and Use of Technology (UTAUT): A literature review. Journal of Enterprise
Information Management, 28(3), 443–488.
Williams, M. D., Nripendra, P. R., Dwiyedi, K. Y., & Banita, L. (2011). Is UTAUT really used
or just cited for the sake of it ? A systematic review of citations of UTAUT’s. In European
Conference on Information Systems (ECIS).
Winship, C., & Mare, R. D. (1984). Regression models with ordinal variables. American
Sociological Review, 49(4), 512–525.
Wirtz, B. W., & Kurtz, O. T. (2016). Determinants of citizen usage intentions in e-government:
An empirical analysis. Public Organization Review, 1–20. http://doi.org/10.1007/s11115-
015-0338-7
World Bank. (2002). InfoDev and the entre for democracy and technology: The e-government
handbook for developing countries. Retrieved from
http://www.infodev.org/en/publication.lb.html
World Bank. (2009). e-Government primer. Retrieved August 28, 2014, from
http://www.infodev.org/publications
World Bank.. (2009). Information and Communication for Development: Extending Reach and
Increasing Impact. Washington, D.C.
Wright, S. (2006). Government-run online discussion fora: Moderation, censorship, and the
shadow of control. British Journals of Politics & International Relations, 8(4), 550.
http://doi.org/doi:10.1111/j.1467-856X.2006.00247.x
Wu, P. E. (2012). A mixed methods approach to technology acceptance research. Journal of
the Association for Information Systems, 13(3), 172–187.
Wu, Y., Tao, Y., & Yang, P. (2007). Using UTAUT to explore the behavior of 3G mobile
communication users. In 2007 IEEE International Conference on Industrial Engineering
and Engineering Management (pp. 199–203). Ieee.
http://doi.org/10.1109/IEEM.2007.4419179
Page 159
142
Yaghoubi, N., Kord, B., & Shakeri, R. (2010). E-Government services and user acceptance:
The unified models’ perspective. European Journal of Economics, Finance and
Administrative Sciences -, (24).
Yahya, M., Nadzar, F., & Abd Rahman, B. (2011). Determinants of UTAUT in measuring user
acceptance of e-syariah portal in syariah courts in Malaysia. In The 2nd International
Research Symposium in Service Management (pp. 26–30). Yogyakarta Indonesia.
Yildiz, M. (2007). E-government research: Reviewing the literature, limitations, and ways
forward. Government Information Quarterly, 24(3), 646–665.
http://doi.org/10.1016/j.giq.2007.01.002
Yong, A. G., & Pearce, S. (2013). A beginner’s guide to factor analysis: Focusing on
exploratory factor analysis. Tutorials in Quantitative Methods for Psychology, 9(2), 79–
94.
Yu, C. (2011). Factors affecting individuals to adopt mobile banking: Empirical evidence from
the UTAUT model. Journal of Electronic Commerce Research, 13(2), 104–122.
Yu, C. (2012). Factors affecting individuals to adopt mobile banking: Empirical evidence from
the UTAUT model. Journal of Electronic Commerce Research, 13(2), 104–122.
Zahari, R. K., Ariffin, R. N. R., Zamin, N., & Noor, N. M. (2014). E-payment at the local
government level: A study of Majlis Bandaraya Shah Alam and Majlis Daerah Kampar.
Planning Malaysia Journal, 12(3).
Zaman, M. S. (2010). Quality of public sector website and its impact on citizen involvement.
Drexel University.
Zeithaml, V. A., Berry, L., & Parasuraman, A. (1996). The Behavioral Consequences of
Service Quality. Journal of Marketing, 60(2), 31–46.
Zheng, Y. (2017). Explaining citizens’ e-participation usage. Administration & Society, 49(3),
423–442. http://doi.org/10.1177/0095399715593313
Zuiderwijk, A., Janssen, M., & Dwivedi, Y. K. (2015). Acceptance and use predictors of open
data technologies: Drawing upon the unified theory of acceptance and use of technology.
Government Information Quarterly, 32(4), 429–440.
http://doi.org/10.1016/j.giq.2015.09.005
Page 160
143
Appendix A
INTERVIEW GUIDE: General use of online government services 1. In the past 3 years what online government services have you used? 2. When deciding whether to use an online government service, what key factors do you
take into account? 3. Online government services can be classified into four different categories: obtain general
information; obtaining specific information about me; making transactions, such as applying for a license or benefit, or providing information to government; or paying government bills, such as taxes. Thinking about the way in which you tend to use online government services, do these different types of services make a difference to the whether you choose to go online or use a different method?
Income taxes I want to now talk about three different government websites and your use of them. First is an income tax. The government website allows you to file your income tax return, and also to pay any outstanding taxes.
1. Did you know that your income tax forms can be accessed and paid through online? 2. Have you used this service in the past 3 years? What are the reasons for you choosing
to use or not use this service? 3. If you have used the service:
a) What made you first use this online service? b) What was your first impression of e-filing? Why do you say that? c) Do you think e-filing is useful? How? d) Do you believe that e-filing services are easy to use? How about the website
quality? Land tax Secondly, I want to talk about the land tax (e-assessment) that provided by the local authority. Also, the local authority websites allows you to file your land tax return, and also to pay any outstanding taxes.
1. Did you know that your land tax forms can be accessed and paid through online? 2. Have you used this service in the past 3 years? What are the reasons for you choosing
to use or not use this service? 3. If you have used the service:
a) What made you first use this online service? b) What was your first impression of e-assessment? Why do you say that? c) Do you think e-assessment is useful? How? d) Do you believe that e-assessment services are easy to use? How about the
website quality? Traffic fines and drivers licensing Now I want to talk about the traffic fines and drivers licensing. The government websites also allows you to file and pay your traffic fines and drivers licensing through online.
1. Did you know that your traffic fines and drivers licensing can be accessed and paid through online?
Page 161
144
2. Have you used this service in the past 3 years? What are the reasons for you choosing to use or not use this service?
3. If you have used the service: a) What made you first use these online services? b) What was your first impression of these online services? Why do you say that? c) Do you think these online services are useful? How? d) Do you believe that these online services are easy to use? How about the
website quality? General
1. Do you believe that online government websites are trustworthy and your data is secure? Why?
2. Do you believe that people around you are important to influence your behaviour on online government services usage? How and why?
3. If you are using another method to deal with a government agency, what is the method? Why are using it?
4. In summary, what do you think about online government services? 5. Anything else you want to add/share about use of Malaysia online government
services? Demographic
1. Gender: ( ) Female ( ) Male 2. Age: ( ) 20 or under ( ) 21- 30 ( ) 31- 40 ( ) 41 -50 ( ) 51 or above 3. Highest level of education: ( ) High school and below ( ) Diploma ( ) Bachelor ( ) Master/PhD 4. Type of employment:
( ) Public sector ( ) Private Sector ( ) Own business 5. How do you describe your general computer knowledge?
( ) Very poor ( ) Poor ( ) Moderate ( ) Good ( ) Very good 6. How would you describe your Internet knowledge?
( ) Very poor ( ) Poor ( ) Moderate ( ) Good ( ) Very good 7. How long have you been using the Internet?____________________ 8. How often do you use the Internet per day?______________________
Page 164
147
Appendix D
PARTICIPANT INFORMATION SHEET
Section A Determinants that influence the citizens’ usage of different e-government systems: A
Malaysian case study Introduction and purpose of the study You are being invited to participate in this research study about Malaysian’s use of e-government services. This study is organised and conducted by the researcher – Muslimin Wallang, as a requirement for his Ph.D. at The University of Queensland. What is the aim of this study? The purpose of this research is to examine the reasons why citizen’s use or do not use different e-government services. What does the study involve? You will be asked to fill out an online survey that asks some questions about your e-government usage experience. This is expected to take between 20 and 30 minutes. Your responses will be anonymous and confidential. No personally identifying data are collected. The data from the study will be used in research publications and conference presentations. However, your identity will not be disclosed in any way in these publications or reports. This is an independent study. The IRBM is not involved in any other way in the study, and your participation is entirely voluntary and your involvement in the study will not be reported to IRBM. If you agree to participate, no personally identifying information will be collected. Additionally, your computer IP address will not be collected. Your participation in the research will be kept confidential. The main findings of this study will not be reporting to the participants as the researcher does not know about who participated in the survey. What are my rights and how will they be protected? As a volunteer in this study you can withdraw at any time. You do not need to say why you are withdrawing and it will not incur a penalty. The information that you provide will be used in this study only and your identity will not be made available to any other party. You have the right to ask questions at any time and details about how you can contact the researcher are available below.
Page 165
148
All information collected will be kept strictly confidential, and no one including the researchers will know who you are. The information will be kept in a secure place at The University of Queensland and will be secured electronically by password. This study has been cleared by one of the human ethics committees of the University of Queensland in accordance with the National Health and Medical Research Council’s guidelines. You are, of course, free to discuss your participation in this study with project staff (contactable on (+61) 733651252). If you would like to speak to an officer of the University not involved in the study, you may contact: Research Ethics Officer Office of Research and Postgraduate Studies Level 1, Cumbrae-Stewart Building Research Road The University of Queensland St Lucia, QLD 4072 Ph (+61) 73365 3924 Thank you for your assistance with this research study. Muslimin Wallang PhD Student University of Queensland [email protected] Phone: (+61) 405759341 I have read the Participant Information Sheet and agree to continue to the next page to view the Consent Form. Yes No
PARTICIPANT CONSENT I have been informed about the nature and purpose of the research, and my involvement in the study. I hereby give my consent to be involved in this project. By selecting the 'YES' button I acknowledge that: □ I have read and understood the Participant Information. □ I understand what is required of me by agreeing to be involved. □ I understand that all information collected is confidential and I will not be identified in
any information published from this study. □ Only research team personnel will have access to my survey data.
Page 166
149
□ I understand that taking part in this study is voluntary and that I am free to withdraw without penalty at any time.
□ There is no direct benefit for me in participating in the study. I consent to participate in the project: Yes No - thank you for your time
Section B Income Tax
Most Malaysian citizens are required to pay income tax. An internet-based income tax system enables tax payers to electronically lodge their income tax return (called ‘e-filing’) and to electronically pay their income tax bill (called ‘e-payment’) through the internet. Citizens can access the income tax online system at https://spsd.hasil.gov.my/PKI/e/mainpage.html During the last two years, have you visited the IRBM website?
Yes No
Did you know that you can lodge your income tax return online?
Yes No
Did you know that you can pay your income tax return online?
Yes No
In the last two (2) years, did you need to lodge a tax return?
Yes No – [GO TO SECTION C]
The following statements refer to your attitudes about lodging your income tax return. Please select your response for each of the statements using the scale from 1 to 5. 1 indicates “strongly disagree” and 5 indicates “strongly agree”.
No Statement strongly disagree
strongly agree
1 Compared to lodging my tax return over the counter, I think that lodging my income tax return online would be quicker.
1 2 3 4 5
2 The disadvantages of lodging an income tax return online far outweigh the advantages.
1 2 3 4 5
Page 167
150
3 Compared to lodging my tax return over the counter, I think that lodging my income tax return online would be easier.
1 2 3 4 5
4 I would find it easy to lodge an income tax return online.
1 2 3 4 5
5 It is easy for me to learn to lodge an income tax online.
1 2 3 4 5
6 Lodging my tax return online would be clear and understandable.
1 2 3 4 5
7 People who are important to me think that I should lodge my income tax return online.
1 2 3 4 5
8 I read/saw advertisements that lodging an income tax return online is a good way to interact with the income tax office.
1 2 3 4 5
9 IRBM encourages citizens to lodge their income tax return online.
1 2 3 4 5
10 There is a considerable risk involved in lodging an income tax return online.
1 2 3 4 5
11 Overall, it is not safe to transmit sensitive information by lodging an income tax return online.
1 2 3 4 5
12 Lodging an income tax return online would take too much time.
1 2 3 4 5
13 I am confident that it is safe and secure to lodge an income tax return online.
1 2 3 4 5
14 IRBM can be trusted to process online tax returns reliably.
1 2 3 4 5
15 I am more comfortable lodging my income tax return with someone rather than online.
1 2 3 4 5
In the past two (2) years, did you lodge your income tax return online?
Yes No
The following statements refer to your attitudes about paying your income tax bill. Please select your response for each of the statements using the scale from 1 to 5. 1 indicates “strongly disagree” and 5 indicates “strongly agree”.
No Statement strongly disagree
strongly agree
1 Compared to paying my tax return over the counter, I think that paying my income tax online would be quicker.
1 2 3 4 5
2 The disadvantages of paying an income tax return online far outweigh the advantages.
1 2 3 4 5
3 Compared to paying my tax return over the counter, I think that paying an income tax return online would be easier.
1 2 3 4 5
Page 168
151
4 I would find it easy to pay an income tax return online.
1 2 3 4 5
5 It is easy for me to learn to pay income tax online.
1 2 3 4 5
6 Paying my tax return online would be clear and understandable.
7 People who are important to me think that I should pay my income tax bill online.
1 2 3 4 5
8 I read/saw advertisements that paying an income tax online is a good way to interact with the income tax office.
1 2 3 4 5
9 IRBM encourages citizens to pay their income tax online.
1 2 3 4 5
10 There is a considerable risk involved in paying an income tax bill online.
1 2 3 4 5
11 Overall, it is not safe to transmit sensitive information by paying an income tax online.
1 2 3 4 5
12 Paying an income tax online would take too much time.
1 2 3 4 5
13 I am confident that it is safe and secure to pay an income tax return online.
1 2 3 4 5
14 IRBM can be trusted to process online tax payments reliably.
1 2 3 4 5
15 I am more comfortable paying my income tax return with someone rather than online.
1 2 3 4 5
In the past two (2) years, did you pay your income tax bill online?
Yes No
Section C Property Tax
All Malaysian’s who own property have to pay Property Tax (each year) to the local authority. Local authority websites now allow people to find out how much they have to pay online (called ‘e-assessment’) and to pay the amount of property tax owed online (called “e-payment”). During the last two years, have you visited your local authority website?
Yes No
Did you know that you can assess your property tax return online?
Yes No
Did you know that you can pay your property tax return online?
Page 169
152
Yes No
At any point in the last two (2) years have you owned any property that is subject to property tax?
Yes No – [GO TO SECTION D]
The following statements refer to your attitudes about assessing your property tax liability. Please select your response for each of the statements using the scale from 1 to 5. 1 indicates “strongly disagree” and 5 indicates “strongly agree”.
No Statement strongly disagree
strongly agree
1 Compared to assessing my property tax over the counter, I think that assessing my property tax liability online would be quicker
1 2 3 4 5
2 The disadvantages of assessing the property tax liability online far outweigh the advantages.
1 2 3 4 5
3 Compared to assessing my property tax over the counter, I think that assessing the property tax liability online would be easier.
1 2 3 4 5
4 I would find it easy to assess the property tax liability online.
1 2 3 4 5
5 It is easy for me to learn to assess the property tax liability online.
1 2 3 4 5
6 Assessing my property tax liability online would be clear and understandable.
1 2 3 4 5
7 People who are important to me think that I should assess my property tax liability online.
1 2 3 4 5
8 I read/saw advertisements that assessing the property tax liability online is a good way to interact with the local authority office.
1 2 3 4 5
9 Local authority office encourages citizens to assess their property tax liability online.
1 2 3 4 5
11 There is a considerable risk involved in assessing the property tax liability online.
1 2 3 4 5
11 Overall, it is not safe to transmit sensitive information by assessing the property tax liability online.
1 2 3 4 5
12 Assessing the property tax liability online would take too much time.
1 2 3 4 5
13 I am confident that it is safe and secure to assess the property tax online.
1 2 3 4 5
14 Local authority can be trusted to process online property tax reliably.
1 2 3 4 5
15 I am more comfortable assessing my property tax with someone rather than online.
1 2 3 4 5
Page 170
153
In the past two (2) years, have you ever assessed your property tax liabilities online?
Yes No
The following statements refer to your attitudes about paying your property tax. Please select your response for each of the statements using the scale from 1 to 5. 1 indicates “strongly disagree” and 5 indicates “strongly agree”.
No Statement strongly disagree
strongly agree
1 Compared to paying my property tax over the counter, I think that paying my property tax liability online would be quicker.
1 2 3 4 5
2 The disadvantages of paying the property tax liability online far outweigh the advantages.
1 2 3 4 5
3 Compared to paying my property tax over the counter, I think that paying the property tax liability online would be easier.
1 2 3 4 5
4 I would find it easy to pay the property tax liability online.
1 2 3 4 5
5 It is easy for me to learn to pay the property tax liability online.
1 2 3 4 5
6 Paying my property tax liability online would be clear and understandable.
1 2 3 4 5
7 People who are important to me think that I should pay my property tax liability online.
1 2 3 4 5
8 I read/saw advertisements that paying the property tax liability online is a good way to interact with the local authority office.
1 2 3 4 5
9 Local authority office encourages citizens to pay their property tax liability online.
1 2 3 4 5
10 There is a considerable risk involved in paying the property tax liability online.
1 2 3 4 5
11 Overall, it is not safe to transmit sensitive information by paying the property tax liability online.
1 2 3 4 5
12 Paying the property tax liability online would take too much time.
1 2 3 4 5
13 I am confident that it is safe and secure to pay the property tax liability online.
1 2 3 4 5
14 Local authority can be trusted to process online property tax payments reliably.
1 2 3 4 5
15 I am more comfortable paying my property tax with someone rather than online.
1 2 3 4 5
In the past two (2) years, did you pay your property tax liabilities online?
Yes No
Page 171
154
Section D Traffic Fines
Traffic fines are the responsibility of the Royal Malaysian Police (RMP) under the Ministry of Home Affairs. Through the MyEG portal (https://www.myeg.com.my), citizens can check their traffic fines (called “summons alert”) and to pay their traffic infringements (called “summons payment”) online. During the last two years, have you visited the MyEG portal website?
Yes No
Did you know that you can check your traffic fines statement through MyEG portal?
Yes No
Did you know that you can pay your traffic fines through MyEG portal?
Yes No
At any point in the last two (2) years, have you received a traffic offence notice?
Yes No – [GO TO SECTION E]
The following statements refer to your attitudes about checking your traffic fines. Please select your response for each of the statements using the scale from 1 to 5. 1 indicates “strongly disagree” and 5 indicates “strongly agree”.
No Statement strongly disagree
strongly agree
1 Compared to checking my traffic fines over the counter, I think that checking the traffic fines online would be quicker.
1 2 3 4 5
2 The disadvantages of checking the traffic fines online far outweigh the advantages.
1 2 3 4 5
3 Compared to checking my traffic fines over the counter, I think that checking the traffic fines online would be easier.
1 2 3 4 5
4 I would find it easy to check the traffic fines online.
1 2 3 4 5
5 It is easy for me to learn to check the traffic fines online.
1 2 3 4 5
6 Checking the traffic fines online would be clear and understandable.
1 2 3 4 5
7 People who are important to me think that I should check the traffic fines online.
1 2 3 4 5
Page 172
155
8 I read/saw advertisements that checking the traffic fines online is a good way to interact with the RMP office.
1 2 3 4 5
9 RMP encourages citizens to check their traffic fines online.
1 2 3 4 5
10 There is a considerable risk involved in checking the traffic fines online.
1 2 3 4 5
11 Overall, it is not safe to transmit sensitive information by checking the traffic fines online.
1 2 3 4 5
12 Checking the traffic fines online would take too much time.
1 2 3 4 5
13 I am confident that it is safe and secure to check the traffic fines online.
14 MyEG can be trusted to process online traffic fines reliably.
1 2 3 4 5
15 I am more comfortable checking my traffic fines with someone rather than online.
1 2 3 4 5
In the last two (2) years, have you used the MyEG portal to check your traffic fines statement?
Yes No
The following statements refer to your attitudes about paying your traffic fines. Please select your response for each of the statements using the scale from 1 to 5. 1 indicates “strongly disagree” and 5 indicates “strongly agree”.
No Statement strongly disagree
strongly agree
1 Compared to paying my traffic fines over the counter, I think that paying the traffic fines online would be quicker.
1 2 3 4 5
2 The disadvantages of paying the traffic fines online far outweigh the advantages.
1 2 3 4 5
3 Compared to paying my traffic fines over the counter, I think that paying the traffic fines online would be easier.
1 2 3 4 5
4 I would find it easy to pay the traffic fines online.
1 2 3 4 5
5 It is easy for me to learn to pay the traffic fines online.
1 2 3 4 5
6 Paying the traffic fines online would be clear and understandable.
1 2 3 4 5
7 People who are important to me think that I should pay the traffic fines online.
1 2 3 4 5
Page 173
156
8 I read/saw advertisements that paying the traffic fines online is a good way to interact with the RMP office.
1 2 3 4 5
9 RMP encourages citizens to pay their traffic fines online.
1 2 3 4 5
10 There is a considerable risk involved in paying the traffic fines online.
1 2 3 4 5
11 Overall, it is not safe to transmit sensitive information by paying the traffic fines online.
1 2 3 4 5
12 Paying the traffic fines online would take too much time.
1 2 3 4 5
13 I am confident that it is safe and secure to pay the traffic fines online.
1 2 3 4 5
14 MyEG can be trusted to process online traffic fines payments reliably.
1 2 3 4 5
15 I am more comfortable paying my income traffic fines with someone rather than online.
1 2 3 4 5
In the last two (2) years, have you used the MyEG portal to pay your traffic fines?
Yes No
Section E
Background Please tick the box that matches your status.
1. Sex: ( ) Female ( ) Male 2. Age: ________ years
3. Type of employment:
( ) Public sector ( ) Private Sector ( ) Own business ( ) Other (please specify); _____________
4. Ethnicity
( ) Malays ( ) Chinese ( ) Indian ( ) other (please specify); _________________
5. The district that best describes your location is:__________________________
6. Your local authority:____________________________________________
7. How would you describe your general computer knowledge? ( ) Very poor ( ) Poor ( ) Moderate ( ) Good ( ) Very good
8. How would you describe your Internet knowledge?
( ) Very poor ( ) Poor ( ) Moderate ( ) Good ( ) Very good
Page 174
157
9. How long have you been using the Internet? ( ) Less than 5 yrs. ( ) 6–10 yrs. ( ) 11- 15 yrs. ( ) More than 15 yrs.
10. On average, how long do you use the Internet per day?
( ) Less than 1 hour ( ) 1–2 hrs ( ) 3–4 hrs ( ) More than 4 hrs
11. Do you have internet connection at home? Yes No
12. Do you use the internet at work?
Yes No
Page 175
158
Appendix E
Table E-1: Details on items Item Number of cases Mean S.D Number of
missing Percentage of
missing Income tax
TinfRA1 314 4.64 0.721 0 0.0 TinfRA3 314 4.59 0.804 0 0.0 TinfRA2 311 2.46 1.357 3 1.0 TinfEE3 312 4.29 0.809 2 0.6 TinfEE2 311 4.18 0.709 3 1.0 TinfEE1 312 4.28 0.746 2 0.6 TinfSI1 312 4.09 0.879 2 0.6 TinfSI2 314 4.05 0.896 0 0.0 TinfSI3 313 4.21 0.793 1 0.3 TinfRisk1 311 2.95 1.107 3 1.0 TinfRisk3 312 2.08 0.871 2 0.6 TinfRisk2 313 2.34 0.928 1 0.3 TinfTrust3 308 2.33 1.021 6 1.9 TinfTrust2 310 4.12 0.718 4 1.3 TinfTrust1 312 4.02 0.869 2 0.6 TpyRA1 312 4.49 0.686 2 0.6 TpyRA3 313 4.44 0.788 1 0.3 TpyRA2 312 2.46 1.262 2 0.6 TpyEE3 312 4.18 0.771 2 0.6 TpyEE2 312 4.14 0.656 2 0.6 TpyEE1 309 4.19 0.666 5 1.6 TpySI1 310 4.06 0.773 4 1.3 TpyySI2 313 4.05 0.828 1 0.3 TpySI3 310 4.14 0.878 4 1.3 TpyRisk1 313 2.89 1.034 1 0.3 TpyRisk3 310 2.18 0.887 4 1.3 TpyRisk2 311 2.31 0.964 3 1.0 TpyTrust3 311 2.37 1.031 3 1.0 TpyTrust2 309 4.05 0.680 5 1.6 TpyTrust1 312 3.95 0.823 2 0.6
Property Tax PinfRA1 314 3.95 0.815 0 0.0 PinfRA3 312 3.86 0.825 2 0.6 PinfRA2 314 2.84 1.061 0 0.0 PinfEE3 312 3.66 0.769 2 0.6
PinfEE2 313 3.64 0.805 1 0.3 PinfEE1 310 3.70 0.782 4 1.3 PinfSI1 313 3.54 0.804 1 0.3 PinfSI2 314 3.44 0.885 0 0.0 PinfSI3 313 3.35 0.984 1 0.3 PinfRisk1 310 3.19 0.925 4 1.3 PinfRisk3 310 2.54 0.851 4 1.3 PinfRisk2 310 2.94 0.970 4 1.3
Page 176
159
PinfTrust3 309 2.90 1.051 5 1.6 PinfTrust2 313 3.62 0.715 1 0.3 PinfTrust1 311 3.55 0.780 3 1.0 PpyRA1 311 4.08 0.777 3 1.0 PpyRA3 313 3.90 0.934 1 0.3 PpyRA2 313 2.69 1.061 1 0.3 PpyEE3 312 3.78 0.812 2 0.6 PpyEE2 311 3.77 0.885 3 1.0 PpyEE1 313 3.86 0.831 1 0.3 PpySI1 310 3.70 0.882 4 1.3 PpySI2 313 3.54 0.967 1 0.3 PpySI3 312 3.49 1.028 2 0.6 PpyRisk1 313 3.24 0.933 1 0.3 PpyRisk3 313 2.48 0.916 1 0.3 PpyRisk2 310 2.85 1.035 4 1.3 PpyTrust3 314 2.94 1.163 0 0.0 PpyTrust2 313 3.63 0.865 1 0.3 PpyTrust1 311 3.60 0.909 3 1.0
Traffic Fines FinfRA1 314 4.24 0.660 0 0.0 FinfRA3 314 4.13 0.826 0 0.0 FinfRA2 312 2.80 1.157 2 0.6 FinfEE3 314 3.94 0.780 0 0.0 FinfEE2 313 3.98 0.704 1 0.3 FinfEE1 313 4.00 0.727 1 0.3 FinfSI1 311 3.81 0.790 3 1.0 FinfSI2 314 3.77 0.799 0 0.0 FinfSI3 313 3.76 0.794 1 0.3 FinfRisk1 314 3.09 0.951 0 0.0 FinfRisk3 314 2.49 0.916 0 0.0 FinfRisk2 313 2.88 0.943 1 0.3 FinfTrust2 312 2.84 1.058 2 0.6 FinfTrust3 313 3.79 0.744 1 0.3 FinfTrust1 312 3.70 0.803 2 0.6 FpyRA1 313 4.11 0.725 1 0.3 FpyRA3 313 3.95 0.861 1 0.3 FpyRA2 313 2.74 1.089 1 0.3 FpyEE3 310 3.91 0.759 4 1.3 FpyEE2 312 3.94 0.799 2 0.6 FpyEE1 310 3.87 0.879 4 1.3 FpySI1 312 3.79 0.858 2 0.6 FpySI2 311 3.77 0.837 3 1.0 FpySI3 310 3.67 0.912 4 1.3 FpyRisk1 313 3.15 0.959 1 0.3 FpyRisk3 312 2.50 0.941 2 0.6 FpyRisk2 311 2.88 0.989 3 1.0 FpyTrust3 311 3.03 1.122 3 1.0 FpyTrust2 312 3.85 0.726 2 0.6 FpyTrust1 312 3.76 0.900 2 0.6
Page 177
160
Appendix F
Table F-1: Factor loading and reliability of the scaled items income tax systems.
System Variable Item Factor loading Eigenvalue Variance
explained Cronbach’s
alpha
Income Tax
E-filing
Relative Advantage
TinfRA1 0.91 1.66 56% 0.77 TinfRA3 0.90
Effort expectancy
TinfEE1 0.84 2.24
75%
0.83 TinfEE2 0.90 TinfEE3 0.85
Social Influence
TinfSI1 0.83 1.97
66%
0.74 TinfSI2 0.87 TinfSI3 0.72
Perceived Risk
TinfRISK1 0.63 1.98
66%
0.72 TinfRISK2 0.86 TinfRISK3 0.91
Perceived Trust
TinfTRUST1 0.94 1.77 59% 0.86 TinfTRUST2 0.93
Income Tax E-payment
Relative Advantage
TpyRA1 0.92 1.74 58% 0.83 TpyRA3 0.91
Effort Expectancy
TpyEE1 0.81 2.11
70%
0.79 TpyEE2 0.89 TpyEE3 0.80
Social Influence
TpySI1 0.80 2.15
72%
0.81 TpySI2 0.89 TpySI3 0.84
Risk TpyRISK1 0.77
2.19
73%
0.82 TpyRISK2 0.91 TpyRISK3 0.87
Trust TpyTRUST1 0.88 1.65 55% 0.77 TpyTRUST2 0.89
Table F-2: Factor loading and reliability of the scaled items for property tax systems.
System Variable Item Factor loading Eigenvalue Variance
explained Cronbach’s
alpha
Property Tax e-Assessment
Relative Advantage
PinfRA1 0.94 1.75 55% 0.85 PinfRA3 0.92
Effort Expectancy
PinfEE1 0.95 2.71
90%
0.94 PinfEE2 0.96 PinfEE3 0.93
Social Influence
PinfSI1 0.82 2.21
74%
0.82 PinfSI2 0.91 PinfSI3 0.84
Risk PinfRISK1 0.82 1.93 64%
0.73 PinfRISK2 0.84 PinfRISK3 0.74
Trust PinfTRUST1 0.92 1.99 66% 0.86 PinfTRUST2 0.89
Property Tax E-payment
Relative Advantage
PpyRA1 0.96 1.96 66% 0.94
PpyRA3 0.95 Effort expectancy
PpyEE1 0.94 2.69 89%
0.94
PpyEE2 0.96 PpyEE3 0.94
Page 178
161
Social Influence
PpySI1 0.82 2.25 75%
0.84 PpySI2 0.87 PpySI3 0.89
Risk PpyRISK1 0.79 2.00 67%
0.75 PpyRISK2 0.89 PpyRISK3 0.74
Trust PpyTRUST1 0.91 1.96 66% 0.87 PpyTRUST2 0.89
Table F-3: Factor loading and reliability of the scaled items for traffic fines systems.
System Variable Item Factor loading Eigenvalue Variance
explained Cronbach’s
alpha
Traffic Fines- e-checking
Relative Advantage
FinfRA1 0.95 1.85 62%
0.90 FinfRA3 0.93
Effort Expectancy
FinfEE1 0.95 2.63
88%
0.93 FinfEE2 0.94 FinfEE3 0.92
Social Influence
FinfSI1 0.87 2.32
77%
0.86 FinfSI2 0.93 FinfSI3 0.84
Risk FinfRISK1 0.81 1.91
64%
0.71 FinfRISK2 0.86 FinfRISK3 0.72
Trust FinfTRUST1 0.91 1.76 59% 0.84 FinfTRUST2 0.90
Traffic Fines E-payment
Relative Advantage
FpyRA1 0.95 1.99 67% 0.93 FpyRA3 0.91
Effort Expectancy
FpyEE1 0.93 2.65
88%
0.94 FpyEE2 0.92 FpyEE3 0.95
Social Influence
FpySI1 0.88 2.19
73%
0.82 FpySI2 0.89 FpySI3 0.78
Risk FpyRISK1 0.82 2.05
68%
0.77 FpyRISK2 0.89 FpyRISK3 0.77
Trust FpyTRUST1 0.94 1.86 62% 0.89 FpyTRUST2 0.95
Page 179
162
Appendix G
Income Tax (e-Filing) – PCA/ Varimax
Table G-1: KMO and Bartlett's test Kaiser-Meyer-Olkin Measure of Sampling Adequacy. .835 Bartlett's Test of Sphericity Approx. Chi-Square 1459.918
df 105 Sig. .000
Table G-2: Total variance explained
Component
Initial Eigenvalues Extraction Sums of Squared
Loadings Rotation Sums of Squared
Loadings
Total % of
Variance Cumulati
ve % Total % of
Variance Cumulati
ve % Total % of
Variance Cumulati
ve % 1 5.353 35.687 35.687 5.353 35.687 35.687 3.096 20.641 20.641 2 1.784 11.895 47.583 1.784 11.895 47.583 2.491 16.608 37.250 3 1.337 8.915 56.497 1.337 8.915 56.497 2.111 14.077 51.326 4 1.164 7.760 64.257 1.164 7.760 64.257 1.940 12.930 64.257 5 .800 5.332 69.589 6 .781 5.204 74.793 7 .684 4.563 79.356 8 .606 4.042 83.398 9 .515 3.431 86.829 10 .462 3.077 89.906 11 .385 2.565 92.470 12 .357 2.379 94.849 13 .346 2.305 97.155 14 .233 1.555 98.710 15 .194 1.290 100.000 Extraction Method: Principal Component Analysis.
Page 180
163
Appendix H
Table H-1: Multicollinearity test – Actual usage on information Service Constructs Tolerance VIF Income tax system – e-filing
Relative Advantage 0.498 2.008 Effort expectancy 0.641 1.560 Social Influence 0.761 1.313 Perceived Risk 0.614 1.628 Perceived Trust 0.484 2.066
Income tax system – e-payment
Relative Advantage 0.394 2.537 Effort expectancy 0.524 1.910 Social Influence 0.648 1.542 Perceived Risk 0.550 1.817 Perceived Trust 0.584 1.714
Property tax system – e-assessment
Relative Advantage 0.579 1.728 Effort expectancy 0.552 1.813 Social Influence 0.651 1.536 Perceived Risk 0.474 2.110 Perceived Trust 0.388 2.576
Property tax system – e-payment
Relative Advantage 0.381 2.625 Effort expectancy 0.568 1.761 Social Influence 0.340 2.943 Perceived Risk 0.325 3.073 Perceived Trust 0.574 1.742
Traffic fine system – e-checking
Relative Advantage 0.623 1.605 Effort expectancy 0.636 1.572 Social Influence 0.641 1.561 Perceived Risk 0.607 1.647 Perceived Trust 0.447 2.239
Traffic fine system – e-payment
Relative Advantage 0.419 2.389 Effort expectancy 0.642 1.558 Social Influence 0.591 1.692 Perceived Risk 0.350 2.854 Perceived Trust 0.364 2.750
Page 181
164
Appendix I
Table I-1: Spearman correlation for e-filing service in income tax system
Relative
Advantage Effort
expectancy Social
Influence Perceived
Risk Perceived
Trust Relative Advantage 1 Effort expectancy .577** 1 Social Influence .355** .540** 1 Perceived Risk .158** .288** .204** 1 Perceived Trust .503** .486** .480** .422** 1 **. Correlation is significant at the 0.01 level (2-tailed). *. Correlation is significant at the 0.05 level (2-tailed).
Table I-2: Spearman correlation for e-payment service in income tax system
Relative
Advantage Effort
expectancy Social
Influence Perceived
Risk Perceived
Trust Relative Advantage 1 Effort expectancy .322** 1 Social Influence .189** .469** 1 Perceived Risk .269** .276** .211** 1 Perceived Trust .362** .481** .541** .413** 1 **. Correlation is significant at the 0.01 level (2-tailed). *. Correlation is significant at the 0.05 level (2-tailed).
Table I-3: Spearman correlation for e-assessment service in property tax system
Relative
Advantage Effort
Expectancy Social
Influence Perceived
Risk Perceived
Trust Relative Advantage 1 Effort Expectancy .314** 1 Social Influence .214** .599** 1 Perceived Risk .382** .226** .171* 1 Perceived Trust .442** .584** .468** .527** 1 **. Correlation is significant at the 0.01 level (2-tailed). *. Correlation is significant at the 0.05 level (2-tailed).
Table I-4: Spearman correlation for e-payment service in property tax system
Relative
Advantage Effort
Expectancy Social
Influence Perceived
Risk Perceived
Trust Relative Advantage 1 Effort Expectancy .641** 1 Social Influence .486** .609** 1 Perceived Risk .358** .316** .299** 1
Page 182
165
Perceived Trust .558** .602** .520** .431** 1 **. Correlation is significant at the 0.01 level (2-tailed). *. Correlation is significant at the 0.05 level (2-tailed).
Table I-5: Spearman correlation for e-checking in traffic fines system
Relative
Advantage Effort
Expectancy Social
Influence Perceived
Risk Perceived
Trust Relative Advantage 1 Effort Expectancy .618** 1 Social Influence .519** .496** 1 Perceived Risk .256** .247** .118 1 Perceived Trust .486** .497** .569** .212** 1 **. Correlation is significant at the 0.01 level (2-tailed). *. Correlation is significant at the 0.05 level (2-tailed). Table I-6: Spearman correlation for e-payment in traffic fines system
Relative
Advantage Effort
Expectancy Social
Influence Perceived
Risk Perceived
Trust Relative Advantage 1 Effort Expectancy .560** 1 Social Influence .301** .377** 1 Perceived Risk .318** .163 .099 1 Perceived Trust .424** .387** .596** .321* 1 **. Correlation is significant at the 0.01 level (2-tailed). *. Correlation is significant at the 0.05 level (2-tailed).