ORIGINAL ARTICLE Determination of a novel ACE inhibitor in the presence of alkaline and oxidative degradation products using smart spectrophotometric and chemometric methods Maha Abdel-Monem Hegazy a,n , Maya Shaaban Eissa b , Osama Ibrahim Abd El-Sattar c , Mohamed Mohamed Abd El-Kawy a a Analytical Chemistry Department, Faculty of Pharmacy, Cairo University, Cairo, Egypt b Analytical Chemistry Department, Faculty of Pharmacy, Egyptian Russian University, Cairo, Egypt c National Organization of Drug Control and Research, Giza, Egypt Received 25 March 2013; accepted 11 September 2013 Available online 8 October 2013 KEYWORDS Double divisor–ratio difference; Double divisor–ratio derivative; Mean centering of ratio spectra; Chemometry; Imidapril hydrochloride Abstract Simple, accurate, sensitive and validated UV spectrophotometric and chemometric methods were developed for the determination of imidapril hydrochloride (IMD) in the presence of both its alkaline (AKN) and oxidative (OXI) degradation products and in its pharmaceutical formulation. Method A is the fourth derivative spectra (D4) which allows the determination of IMD in the presence of both AKN and OXD, in pure form and in tablets by measuring the peak amplitude at 243.0 nm. Methods B, C and D, manipulating ratio spectra, were also developed. Method B is the double divisor–ratio difference spectrophotometric one (DD–RD) by computing the difference between the amplitudes of IMD ratio spectra at 232 and 256.3 nm. Method C is the double divisor-first derivative of ratio spectra method (DD–DR1) at 243.2 nm, while method D is the mean centering of ratio spectra (MCR) at 288.0 nm. Methods A, B, C and D could successfully determine IMD in a concentration range of 4.0–32.0 mg/mL. Methods E and F are principal component regression (PCR) and partial least-squares (PLS), respectively, for the simultaneous determination of IMD in the presence of both AKN and OXI, in pure form and in its tablets. The developed methods have the advantage of simultaneous determination of the cited components without any pre-treatment. The accuracy, precision and linearity ranges of the developed Contents lists available at ScienceDirect www.elsevier.com/locate/jpa www.sciencedirect.com Journal of Pharmaceutical Analysis 2095-1779 & 2013 Xi’an Jiaotong University. Production and hosting by Elsevier B.V. All rights reserved. http://dx.doi.org/10.1016/j.jpha.2013.09.006 n Corresponding author. Tel.: þ20 1112887066. E-mail address: [email protected] (M.A. Hegazy). Peer review under responsibility of Xi’an Jiaotong University. Journal of Pharmaceutical Analysis 2014;4(2):132–143
Transcript
Contents lists available at ScienceDirect
www.elsevier.com/locate/jpa
Journal of Pharmaceutical Analysis
Journal of Pharmaceutical Analysis 2014;4(2):132–143
2095-1779 & 2013 Xihttp://dx.doi.org/10.10
nCorresponding autE-mail address: m
Peer review under r
www.sciencedirect.com
ORIGINAL ARTICLE
Determination of a novel ACE inhibitor in the presenceof alkaline and oxidative degradation products usingsmart spectrophotometric and chemometric methods
Maha Abdel-Monem Hegazya,n, Maya Shaaban Eissab,Osama Ibrahim Abd El-Sattarc, Mohamed Mohamed Abd El-Kawya
aAnalytical Chemistry Department, Faculty of Pharmacy, Cairo University, Cairo, EgyptbAnalytical Chemistry Department, Faculty of Pharmacy, Egyptian Russian University, Cairo, EgyptcNational Organization of Drug Control and Research, Giza, Egypt
Received 25 March 2013; accepted 11 September 2013Available online 8 October 2013
KEYWORDS
Double divisor–ratiodifference;Double divisor–ratioderivative;Mean centering of ratiospectra;Chemometry;Imidapril hydrochloride
Abstract Simple, accurate, sensitive and validated UV spectrophotometric and chemometric methodswere developed for the determination of imidapril hydrochloride (IMD) in the presence of both its alkaline(AKN) and oxidative (OXI) degradation products and in its pharmaceutical formulation. Method A is thefourth derivative spectra (D4) which allows the determination of IMD in the presence of both AKN andOXD, in pure form and in tablets by measuring the peak amplitude at 243.0 nm. Methods B, C and D,manipulating ratio spectra, were also developed. Method B is the double divisor–ratio differencespectrophotometric one (DD–RD) by computing the difference between the amplitudes of IMD ratiospectra at 232 and 256.3 nm. Method C is the double divisor-first derivative of ratio spectra method(DD–DR1) at 243.2 nm, while method D is the mean centering of ratio spectra (MCR) at 288.0 nm.Methods A, B, C and D could successfully determine IMD in a concentration range of 4.0–32.0 mg/mL.Methods E and F are principal component regression (PCR) and partial least-squares (PLS), respectively,for the simultaneous determination of IMD in the presence of both AKN and OXI, in pure form and in itstablets. The developed methods have the advantage of simultaneous determination of the citedcomponents without any pre-treatment. The accuracy, precision and linearity ranges of the developed
sity. Production and hosting by Elsevier B.V. All rights reserved.6
Stability-indicating spectrophotometric determination of a novel ACE inhibitor 133
methods were determined. The results obtained were statistically compared with those of a reported HPLCmethod, and there was no significant difference between the proposed methods and the reported methodregarding both accuracy and precision.
& 2013 Xi’an Jiaotong University. Production and hosting by Elsevier B.V. All rights reserved.
Fig. 1 Chemical structure of IMD.
1. Introduction
Arterial hypertension is one of the most common cardiovasculardisorders. It is considered to be a social disease due to its highincidence, contribution in the development of arteriosclerosis andits clinical forms, coronary disease, cardiac infarction, and cerebralstroke. The principal action of hypotensive medicines is based oncontrolling blood pressure in various pressure points. Renin–angiotensin–aldosterone system plays an important role in controllingblood pressure and volume of body fluids. This necessitates searchingfor medicines inhibiting the renin–angiotensin activity, includingangiotensin converting enzyme (ACE) inhibitors. These inhibitors aredipeptides or compounds which are structurally very similar. ACEinhibitors differ in terms of pharmacokinetic properties and affinity forACE. This is related to the strength and time of their activity. Atpresent, ACE inhibitors are the first-choice medicines used in thetreatment of hypertension. They may also be used in the treatment ofischemia and heart failure. Their active metabolites created as a resultof hydrolysis cause the fall in ACE activity, a decrease in releasingaldosterone, an increase in the concentration of vaso-dialytic kinins andprostaglandins and indirectly reducing the synthesis of catecholaminesand general sympathetic activity. This results in the diastole of vesselsand reduction of circulating blood volume, which leads to the drop inblood pressure and the reduction of peripheral resistance [1].
IMD is a recently developed prodrug-type angiotensin-convert-ing enzyme (ACE) inhibitor. IMD, with an ethyl ester structure, isconverted into a dicarboxy-type compound (imidaprilat) in thebody. Imidaprilat shows about a 500 times higher activity than theester form, IMD [2]. From the literature survey on the subject,many methods have already been tested including HPLC and GCmethods with the use of MS detector [3–7], chiral LC method [2],other HPLC methods [8,9], densitometry [1] and spectrophoto-metric determinations [8,10].
With the intent of improving the quality of the active pharma-ceutical ingredient (API) and its formulation, there is an increasingneed of separation, identification, quantification, and characteriza-tion of the most possible degradation products generated under thevarious ICH guidelines for forced degradation [11]. These guide-lines require the stress testing to be conducted to elucidate theinherent stability characteristics of the active substance. An idealstability-indicating method is one that quantifies the drug and alsoresolves its degradation products.
IMD is a novel ACE inhibitor and a non-official pharmacopeialraw material and therefore, there is no officially approved methodneither for its determination in the pharmaceutical dosage formsnor for its stability or purity assessment: in solid state formula-tions, as a raw material or in body fluids. Most of the reportedmethods for the determination of IMD are based on chromato-graphic techniques, presenting a relatively high cost and timeconsumption. The aim of the present work is to develop accurate,specific, reproducible, rapid and less expensive stability-indicatingmethods for the determination of IMD in the presence of both itsalkaline and oxidative degradation products for assessment of thedrug stability in its dosage form, which can be performed easily
with adequate software support and thus providing a clear example ofthe high resolving power of those techniques. Therefore, in this study,the proposed methods were firstly developed for the determination ofIMD in the presence of its possible degradation products, which wasnot accomplished by the previously reported methods. This importantfeature of the adopted methods can resolve the intact drug in thepresence of more than one degradation product in the same sample.Other important features of the developed methods are the highersensitivity and the wider range of quantitation of IMD offering highflexibility in the determination of the intact drug at very low and highconcentrations. Also, the application of newly developed spectro-photometric methods, double divisor–derivative ratio, double divisor–ratio difference methods and mean centering of ratio spectra, andmultivariate calibration methods: principal component regression(PCR) and partial least-squares (PLS), was considered and adoptedas stability-indicating methods. The developed methods werevalidated as per ICH guidelines [12]. The results obtained bymeans of the adopted methods were subsequently statisticallycompared. The analytical procedure for both methods comprisedthe following stages: (1) validation; (2) evaluation of the keyparameters (i.e., linearity, accuracy and precision); and (3) assay ofIMD content in the pharmaceutical formulation. The chemicalstructure of IMD is illustrated in Fig. 1.
2. Experimental
2.1. Samples
2.1.1. Pure sampleImidapril hydrochloride (with certified purity of 99.80%) was kindlysupplied by SMS Pharmaceuticals Limited, Hyderabad, India.
2.1.2. Pharmaceutical formulationTanatrils tablets (Batch no. 8917) labeled to contain 10 mg ofIMD per tablet and manufactured by HIKMA Pharmaceuticals,Amman–Jordan were purchased from the local market.
2.2. Chemicals and reagents
All chemicals used throughout the work were of spectroscopicgrade. Methanol was purchased from Riedel-de Haen (Seelze,
M.A. Hegazy134
Germany). 35.4% of hydrochloric acid (0.1, 3 and 5 M aqueoussolutions) and sodium hydroxide (1 and 5 M aqueous solutions)were purchased from Merck (Darmstadt, Germany). Thirty percentof hydrogen peroxide (3% aqueous solution) was purchased fromFluka (Neu-Ulm, Germany). Two degraded solutions “alkaline(AKN) and oxidative (OXI)” of IMD, having concentrations of2.0 mg/mL, were prepared by dissolving 100 mg of the drug in10 mL of methanol and then mixed with 1 M NaOH and 3%H2O2, respectively; heating in thermostatic water bath at 80 1C for12 h and 48 h, respectively. After cooling and neutralizing with5 M HCl for AKN the volume was obtained by adding methanolfor all the degraded solutions. Complete degradation was ascer-tained by the disappearance of the intact drug peak at 220 nm inHPLC using the mobile phase consisting of ACN:0.15% TEA,pH¼2.2 (40:60, v/v), at a flow rate of 1.5 mL/min. The obtaineddegradation products were subjected to infrared spectroscopy (IR)and mass spectrometry (MS) analyses for subsequent structureelucidation.
2.3. Apparatus
UV–vis spectra were recorded using a Double Beam UV–vis spectro-photometer, model-T60 (PG Instruments Ltd., UK) with spectralbandwidth of 0.2 nm connected to an IBM compatible computer andanalyzed using accompanying UVWin Spectrophotometer softwareversion 5.0.5. pH-meter (Jenway 3310, UK), equipped with combinedglass electrode was used for pH adjustment.
High-performance thin layer chromatography (HPTLC) systemused to ensure complete degradation of IMD drug moleculeconsisted of a Camag TLC scanner III S/N 130319 (Camag,Muttenz, Switzerland) operated with winCATS software version3.15, Linomat IV autosampler (Camag, Muttenz, Switzerland),Camag microsyringe 100 mL (Hamilton, Bonaduz, Switzerland),precoated silica gel aluminum plates 60 F254 (20 cm� 10 cm)with 250 mm thickness (E. Merck, Darmstadt, Germany), and twintrough Automatic Developing Chamber ADC 2 chamber20 cm� 10 cm (Camag, Muttenz, Switzerland).
Statistical comparison of the proposed methods with a reportedHPLC method was carried out using LaChrom Elites HPLCsystem (VWR-Hitachi International GmbH, Darmstadt, Germany),which comprised L-2130 model pump, equipped with a L-2400model UV detector and a 20-mL volume injection loop. LaChromElites HPLC system was controlled by EZChrom Elite SoftwareChromatography Data System, version 3.3.1 SP1. A PhenomenexC18 column (250 mm� 4.6 mm i.d., 5 mm) was used as thestationary phase.
2.4. Software
All computations were performed in Matlabs version 7.10 [13]. ThePLS procedure was computed using PLS Toolbox version 5.8 [14].
2.5. Spectral characteristic
The zero-order (D0) absorption spectra of IMD and its degradates,AKN and OXI in 0.1 M HCl, were recorded separately over therange of 200–350 nm using 0.1 M HCl as blank.
2.6. Procedure
2.6.1. UV spectrophotometric methods2.6.1.1. Stock and working solutions. Stock standard solution ofIMD (2.0 mg/mL) was prepared by accurately weighing 100 mg ofpure powder into a 50 mL volumetric flask, dissolved in methanoland diluted to the required volume with methanol. Stock solutionsof AKN and OXI (2.0 mg/mL) were prepared as previouslymentioned in Section 2.2.Working standard solution of IMD and working solutions of
AKN and OXI (100 mg/mL; each) were prepared by transferring5 mL from the stock standard solution of IMD and the stocksolutions of AKN and OXI (2.0 mg/mL; each) into three separate100-mL volumetric flasks, dissolved in methanol and diluted to thevolume with methanol.The binary mixture solution of AKN and OXI (3 mg/mL; each),
was used as double divisor (DD).Aliquots equivalent to 40–320 mg IMD were accurately trans-
ferred from its working standard solution (100 mg/mL) into a seriesof 10-mL volumetric flasks. The volume was brought to the markwith 0.1 M HCl to obtain a final concentration range of 4–32 mg/mL.The zero order absorption spectra of the resulting solutions werescanned from 200 to 350 nm and stored in the computer.
2.6.1.2. Derivative specrophotometry (D4). Construction of thecalibration curve. The fourth derivative (D4) spectra werecomputed using scaling factor¼104 and Δλ¼4 nm. The peakamplitude at 243.0 nm was measured for IMD, then plotted eachagainst its corresponding concentration and the regression para-meters were computed.Assay of laboratory-prepared mixtures. The absorption spectrum
was recorded for each laboratory-prepared mixture, containingdifferent ratios of IMD, AKN and OXI against 0.1 M HCl as ablank and stored in the computer. The peak amplitudes of (D4)spectra of those laboratory-prepared mixtures were measured at243.0 nm for IMD determination. The concentrations of IMD werethen calculated from its corresponding regression equation.
2.6.1.3. Double divisor–ratio difference spectrophotometric(DD–RD) method. Construction of the calibration curve. Thestored spectra of IMD were divided by the spectrum of DDand stored in the computer as ratio spectra. Calibration curve forIMD was constructed by plotting the difference between theamplitudes of ratio spectra at 232.0 nm and 256.3 nm, versus thecorresponding concentration and the regression equation wascomputed.Assay of laboratory-prepared mixtures. The scanned spectra of
the laboratory-prepared mixtures were divided by the absorptionspectrum of DD and stored in the computer, and then the differencebetween the amplitudes of ratio spectra at 232.0 nm and 256.3 nmwas computed. The concentration of IMD in the mixtures wascalculated from the corresponding regression equation.
2.6.1.4. Double divisor–derivative ratio spectrophotometric(DD–DR1) method. Construction of the calibration curve. Thepeak amplitude of the first derivative of the stored ratio spectra ofIMD at 243.2 nm was differentiated using scaling factor¼10 andΔλ¼4 nm, then plotted versus the corresponding concentration ofIMD, and the regression equation was computed.Assay of laboratory-prepared mixtures. The first derivative of the
stored ratio spectra of the laboratory-prepared mixtures wascomputed. The concentration of IMD in the mixtures was calculatedfrom the corresponding regression equation at 243.2 nm.
Stability-indicating spectrophotometric determination of a novel ACE inhibitor 135
2.6.1.5. Mean centering of ratio spectra (MCR) method. Con-struction of the calibration curve. The scanned (D0) spectra ofIMD, AKN and OXI were exported to Matlab for subsequentcalculation, then the spectra of IMD were divided by the normal-ized spectrum of AKN, the obtained ratio spectrum was meancentered and then the mean centered ratio spectra were divided bythe mean centered normalized vector of AKN/OXI and then meancentered. The calibration curve for IMD was constructed byplotting the mean centered values at 288.0 nm, versus thecorresponding concentration of IMD and the regression equationwas computed.Assay of laboratory-prepared mixtures. The general procedure ofthe proposed method mentioned under “Construction of thecalibration curve” was followed. The concentration of IMD wascalculated using the mean centered values at 288.0 nm and thespecified regression equation.
2.6.2. Chemometric-assisted spectrophotometric methods2.6.2.1. Stock and working solutions. Stock standard solution ofIMD (2.0 mg/mL) was prepared as mentioned previously inSection 2.6.1. Stock solutions of AKN and OXI (2.0 mg/mL;each) were prepared as mentioned previously in Section 2.2.Working standard solution of IMD (100 mg/mL) was prepared asmentioned previously in Section 2.6.1. Working solutions of AKNand OXI (10 mg/mL; each) were prepared by transferring 0.5 mLfrom the stock solutions of AKN and OXI (2.0 mg/mL; each) intotwo separate 100-mL volumetric flasks, dissolved in and diluted tothe volume with methanol.Multilevel multifactor design was used for the construction of thecalibration and validation sets [15]. A five-level, five-factor
Table 1 Concentrations of IMD, AKN and OXI in thecalibration and validation sets for PCR and PLS.
The boldfaced samples are those of the validation set.
calibration design was used. The concentrations details are givenin Table 1.
2.6.2.2. Chemometric PCR and PLS methods. Building thecalibration models. A calibration set of seventeen differentlaboratory-prepared mixtures of IMD, AKN and OXI in differentratios was prepared by transferring different aliquots from theworking standard solution of IMD (100 mg/mL) and the workingsolutions of AKN (10 mg/mL) and OXI (10 mg/mL) into 10-mLvolumetric flasks and the volumes were completed with 0.1 MHCl. The absorption spectra of the prepared mixtures wererecorded in the range of 205–305 nm against 0.1 M HCl as blank.The recorded spectra were then transferred to MATLABs 7.10 forsubsequent data analysis and the calibration models (PCR, PLS)were constructed.Assay of external validation set. The absorption spectra of thevalidation set that consisted of eight laboratory-prepared mixturescontaining different ratios of IMD, AKN and OXI were recordedin the range of 205–305 nm. The concentrations of IMD, AKNand OXI were calculated using the optimized PCR and PLScalibration models.
2.6.3. Determination of IMD in its pharmaceutical formulation(Tanatrils tablets)Ten tablets of Tanatrils were finely powdered. A portion of thepowdered tablets equivalent to 20 mg of IMD was transferred intoa 25-mL volumetric flask and sonicated for 20 min with 20 mLmethanol, then the volume was completed with the same solventand filtered to prepare stock solution, having a concentration of0.8 mg/mL. Aliquot of 1.5 mL was transferred to 25-mL volu-metric flasks and the volume was completed with methanol; thenfrom this solution, second dilutions were made by transferringaliquots of 2.5, 3.0 and 3.5 mL into three separate 10-mLvolumetric flasks and the volume was completed with 0.1 MHCl. The general procedures described above for each of theproposed methods were followed to determine the concentration ofIMD in its pharmaceutical preparation.
2.6.4. Application of standard addition techniqueTo check the validity of the proposed methods, the standardaddition technique was applied. Three portions of the previouslypowdered tablets, each claimed to contain 10 mg of IMD wereaccurately weighed and mixed with 8, 10 and 12 mg of the purestandard IMD, separately. Each spiked sample was transferred to a25 mL volumetric flask and sonicated for 20 min with 20 mLmethanol then the volume was adjusted with the same solvent andfiltered to obtain three solutions having the concentrations of 0.72,0.8 and 0.88 mg/mL. Aliquot of 2.5 mL from each spiked solutionwas transferred into three separate 25-mL volumetric flasksand the volume was obtained with methanol. Then from thesesolutions, second dilutions were made by transferring aliquot of2.0 mL from each spiked sample into three separate 10-mLvolumetric flasks and diluting with 0.1 M HCl. The generalprocedures described in Sections 2.6.1 and 2.6.2 were thenproceeded.
3. Results and discussion
The main task of this work was to establish simple, sensitive andaccurate analytical methods for the simultaneous determination ofIMD in the presence of both its alkaline and oxidative degradation
M.A. Hegazy136
products and in its pharmaceutical formulation with satisfactoryprecision for good analytical practice (GAP) and to developmethods of comparable sensitivity and selectivity as chromato-graphic methods with lower cost and higher speed. Also, toconstruct a comparison between the efficiency of the proposedmethods and a reported HPLC method.
Upon stress testing of IMD with alkali, the drug underwentdegradation giving a diacid derivative of IMD through hydrolysisof ester linkage on the basis of the studies of Nishi et al. [2].Degradation of IMD was also examined upon stress testing usingperoxide. It was noticed that diketopiperazine (DKP) derivativewas produced via oxidation and internal cyclization of IMD assuggested by Stofik et al. [16]. IMD was exposed to different timeperiods (12 h and 48 h) at 80 1C as an accelerated stress test tocarry out complete drug degradation under alkaline and oxidativeconditions, respectively. Complete drug degradation under pre-viously mentioned conditions was ascertained using previouslydeveloped HPTLC method as presented in Fig. 2.
The assignment of IMD degradation was based on comparison ofIR and MS spectral data for the degradation products with that of theintact drug as shown in Figs. 3 and 4. IR spectrum of IMD shows
Fig. 3 IR spectra of IMD, AKN and OXI.
Fig. 2 HPTLC chromatograms of IMD (A), AKN (B) and OXI(C), using chloroform:ethanol:acetic acid (3:0.5:0.1, by volume) at 220 nm.
peaks at 3217 and 3027 cm�1, which are assigned to the stretchingvibrations of N–H (the secondary amine) and C–H bands of aromaticring. The peaks at 2947 and 2853 cm�1 are due to the asymmetricCH3 and CH2 stretching vibrations, respectively. The peaks at 1751and 1728 cm�1 are attributed to the carbonyl stretching of ester andcarboxylic acid, respectively; while the peak at 1627 cm�1 corre-sponds to the carbonyl stretching of tertiary amide; the peak at1456 cm�1 corresponds to CH2 scissoring; the peak at 1380 cm
�1 isdue to C–H bending. The IR spectrum of AKN shows the absence ofthe peak at 1751 cm�1, which corresponds to the carbonyl stretchingof ester. But the presence of intense and sharp peak at 1725 cm�1 isattributed to the carbonyl stretching of the two carboxylic acidgroups of the diacid derivative of IMD produced through hydrolysisof ester linkage. The disappearance of IR peaks in OXI spectrum
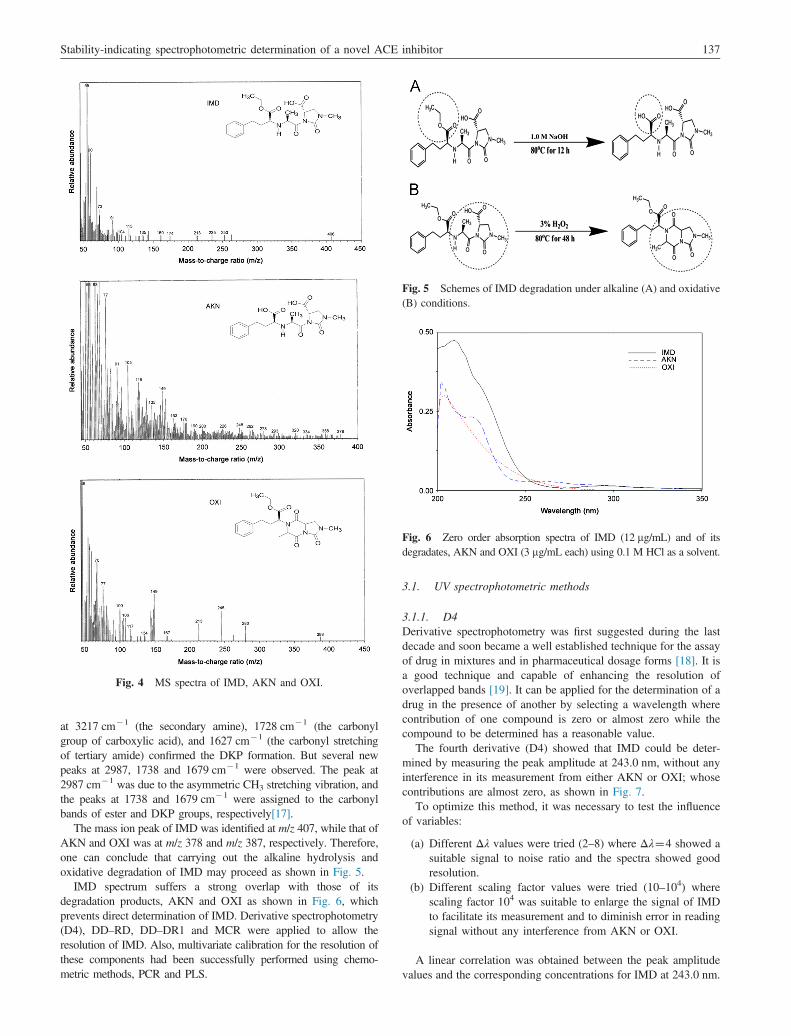
Fig. 4 MS spectra of IMD, AKN and OXI.
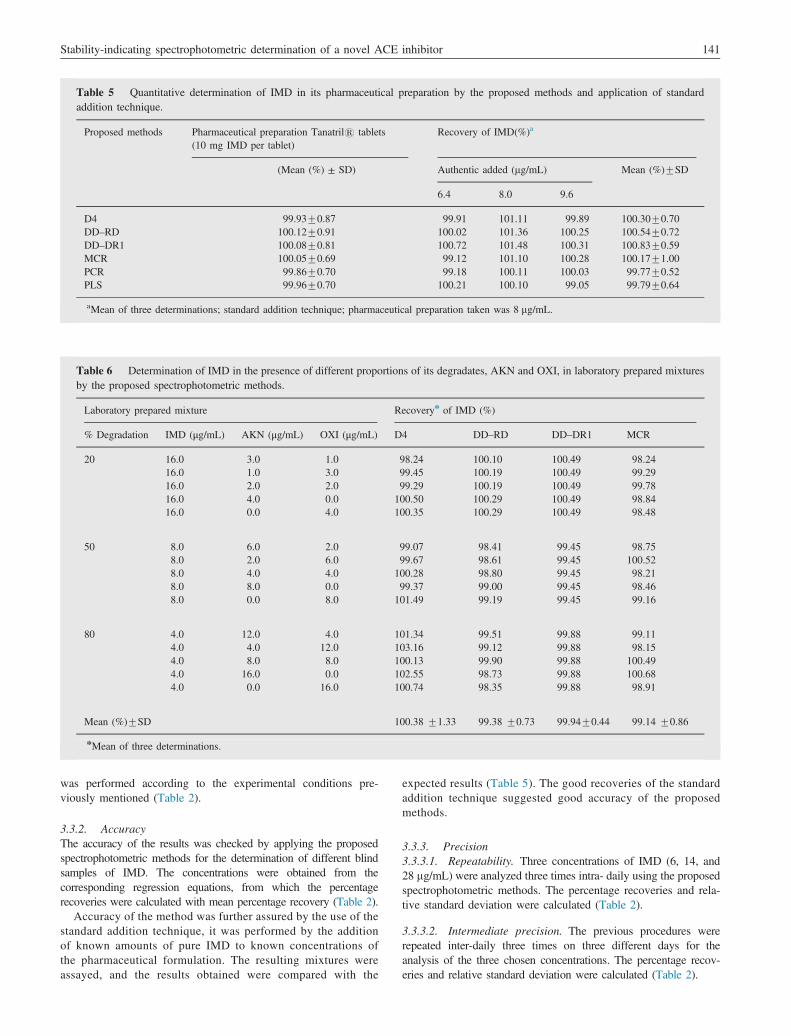
Fig. 5 Schemes of IMD degradation under alkaline (A) and oxidative(B) conditions.
Fig. 6 Zero order absorption spectra of IMD (12 mg/mL) and of itsdegradates, AKN and OXI (3 mg/mL each) using 0.1 M HCl as a solvent.
Stability-indicating spectrophotometric determination of a novel ACE inhibitor 137
at 3217 cm�1 (the secondary amine), 1728 cm�1 (the carbonylgroup of carboxylic acid), and 1627 cm�1 (the carbonyl stretchingof tertiary amide) confirmed the DKP formation. But several newpeaks at 2987, 1738 and 1679 cm�1 were observed. The peak at2987 cm�1 was due to the asymmetric CH3 stretching vibration, andthe peaks at 1738 and 1679 cm�1 were assigned to the carbonylbands of ester and DKP groups, respectively[17].
The mass ion peak of IMD was identified at m/z 407, while that ofAKN and OXI was at m/z 378 and m/z 387, respectively. Therefore,one can conclude that carrying out the alkaline hydrolysis andoxidative degradation of IMD may proceed as shown in Fig. 5.
IMD spectrum suffers a strong overlap with those of itsdegradation products, AKN and OXI as shown in Fig. 6, whichprevents direct determination of IMD. Derivative spectrophotometry(D4), DD–RD, DD–DR1 and MCR were applied to allow theresolution of IMD. Also, multivariate calibration for the resolution ofthese components had been successfully performed using chemo-metric methods, PCR and PLS.
3.1. UV spectrophotometric methods
3.1.1. D4Derivative spectrophotometry was first suggested during the lastdecade and soon became a well established technique for the assayof drug in mixtures and in pharmaceutical dosage forms [18]. It isa good technique and capable of enhancing the resolution ofoverlapped bands [19]. It can be applied for the determination of adrug in the presence of another by selecting a wavelength wherecontribution of one compound is zero or almost zero while thecompound to be determined has a reasonable value.
The fourth derivative (D4) showed that IMD could be deter-mined by measuring the peak amplitude at 243.0 nm, without anyinterference in its measurement from either AKN or OXI; whosecontributions are almost zero, as shown in Fig. 7.
To optimize this method, it was necessary to test the influenceof variables:
(a)
Different Δλ values were tried (2–8) where Δλ¼4 showed asuitable signal to noise ratio and the spectra showed goodresolution.
(b)
Different scaling factor values were tried (10–104) wherescaling factor 104 was suitable to enlarge the signal of IMDto facilitate its measurement and to diminish error in readingsignal without any interference from AKN or OXI.
A linear correlation was obtained between the peak amplitudevalues and the corresponding concentrations for IMD at 243.0 nm.
M.A. Hegazy138
The characteristic parameters of the regression equation of the(D4) method for the determination of IMD are given in Table 2.
3.1.2. DD–RDThis is a newly developed method having the ability for solvingseverely overlapped spectra without prior separation mean while itdoes not require any sophisticated apparatus or computer programs[20]. The most striking feature of the DD–RD method is itssimplicity, rapidity and accuracy. The utility of the DD–RDmethod is to calculate the unknown concentration of a componentpresent in a ternary mixture containing the component of interestand other two unwanted interfering components. For the determi-nation of concentration of component of interest by the DD–RDmethod, the only requirement is the contribution of the threecomponents at the two selected wavelengths λ1 and λ2 where theratio spectrum of the interfering components shows the sameamplitudes (constant) whereas the component of interest showssignificant difference in these two amplitude values at these twoselected wavelengths with respect to concentration. The over-lapped spectra of the cited components suggested that the DD–RDmethod was a suitable method for the determination of IMD in thepresence of both its degradates, AKN and OXI.
Table 2 Results of regression and assay validation parameters of thethe presence of both AKN and OXI.
Validation parameters D4 DD
Linearity range (mg/mL) 4–32 4–Slope 0.0413 0.0SE of slope 0.0003 0.0Intercept �0.0025 0.0SE of intercept 0.0048 0.0Correlation coefficient (r) 0.9998 0.9SE of regression 0.0060 0.0SE of residuals 0.0054 0.0LOD (mg/mL) 0.43 0.4LOQ (mg/mL) 1.30 1.2Accuracy (Mean7SD) 100.1470.52 99
Fig. 7 The fourth derivative (D4) spectra of IMD (12 mg/mL) and ofits degradates, AKN and OXI (3 mg/mL, each) using 0.1 M HCl as asolvent.
Ratio difference method began with scanning the zero orderabsorption spectra of their laboratory-prepared mixtures (IMD,AKI and OXI). For determination of IMD, each spectrum of theprevious mixtures was divided by the absorption spectrum of asolution of binary mixture of AKN and OXI (3 mg/mL; each) as adouble divisor (DD) producing new ratio spectra which representIMD/(AKNþOXI)′þconstant, as shown in Fig. 8. The amplitudesat 232.0 nm and 256.3 nm were selected. The amplitudes at thesetwo wavelengths were subtracted, so the constant (AKNþOXI)/(AKNþOXI)′ will be canceled.
To optimize this method, it was necessary to test the influence ofthe divisor and its concentration. Therefore, different concentrationsof AKN and OXI were tried as double divisor. It was found thatchanging the concentration had no significant effect on the linearcalibration range and the calculated analytical parameters.
The concentration of IMD was calculated using the correspond-ing regression equation obtained by plotting the difference inthe amplitudes at 232.0 nm and 256.3 nm of the ratio spectra ofIMD/(AKNþOXI)′ against its corresponding concentrations. Thecharacteristic parameters of the regression equation of the DD–RDmethod for the determination of IMD are given in Table 2.
developed spectrophotometric methods for determination of IMD in
Fig. 8 Ratio spectra of IMD (12 mg/mL) and of its degradates, AKNand OXI (3mg/mL each) using DD as double divisor of AKN and OXI(3 mg/mL each) and 0.1 M HCl as a blank.
Fig. 9 The first derivative of the ratio spectra of IMD (12 mg/mL) andof its degradates, AKN and OXI (3 mg/mL each) using DD as doubledivisor of AKN and OXI (3 mg/mL each) and 0.1 M HCl as a blank.
Stability-indicating spectrophotometric determination of a novel ACE inhibitor 139
3.1.3. DD–DR1Another method for resolving ternary mixtures without previousseparation is the DD–DR1 method, which was developed by Dincet al. [21]. In this method the absorption spectrum of the mixture isobtained and divided by the absorption spectrum of a solution ofbinary mixture of AKN and OXI (3 mg/mL; each) as a doubledivisor (DD) and then the first derivative of the ratio spectrum isobtained. This method permits the determination of IMD in itsmixture at 243.2 nm, as presented in Fig. 9.
To optimize this method, it was necessary to test the influenceof variables:
(a)
The divisor and its concentration: different concentrationsof AKN and OXI were tried as double divisor. It was foundthat changing the concentration had no significant effecton the linear calibration range and the calculated analyticalparameters.
(b)
Different Δλ values were tried where Δλ¼4 showed asuitable signal to noise ratio and the spectra showed goodresolution.
(c)
Different scaling factor values were tried where scaling factor10 was suitable to enlarge the signal of IMD to facilitate itsmeasurement and to diminish errors in reading signal.
Fig. 10 Mean centering of ratio spectra of IMD, 4–32 μg/mL in0.1 M HCl using the spectra of its degradation products as divisor ofAKN and OXI (3 mg/mL each).
Calibration curve was constructed at 243.2 nm, representing therelationship between the peak amplitudes of DD–DR1 and thecorresponding concentrations of IMD. The characteristic para-meters of the regression equation of the DD-DR1 method for thedetermination of IMD are given in Table 2.
Fig. 11 Root mean square error of calibration (RMSEC) plot of thecross validation results of the training set as a function of the numberof principal components used to construct the PCR calibration.
3.1.4. MCRIt is a new spectrophotometric method that was developed forthe simultaneous determination of binary and ternary mixtureswithout preliminary separation. This method is based on themean centering of ratio spectra instead of calculating the derivativeand therefore signal-to-noise ratio is enhanced [22].
As shown in Fig. 6, the absorption spectra of IMD, AKI andOXI are severely overlapped. So, the absorption spectra of thestandard solutions of IMD with different concentrations wererecorded in the wavelength range of 200–350 nm and divided bythe normalized spectrum of AKN (3 mg/mL) and the obtained ratiospectra were then divided by the mean centered vector of AKN/OXI (OXI, 3 mg/mL), then the obtained second ratio spectra weremean centered as presented in Fig. 10.
The effect of divisor concentration on the analytical parameterssuch as slope, intercept and correlation coefficient of the calibra-tion graphs was also tested. Different concentrations of divisorwere used but it was observed that changing the concentration hadno significant effect on the linear calibration range and thecalculated analytical parameters. A calibration curve could beconstructed by plotting the amplitude at 288.0 nm against thecorresponding concentrations of IMD. The characteristic para-meters of the regression equation of the MCR method for thedetermination of IMD are given in Table 2.
3.2. Chemometric two-way PCR and PLS methods
The spectral data acquisition was taken with 0.1 nm intervals, thusproducing 1001 data points per spectrum. In order to decrease theinitial number of wavelengths, every 10th wavelength wasselected, thus the produced spectral data matrix has 17 rowsrepresenting different samples and 101 columns representingwavelengths (17� 101). In order to build the PCR and PLSmodels, the raw data of the calibration samples were meancentered [23] as a pre-processing step and the ‘random subsets’cross-validation method was used [24]; each subset consisted ofsix and iterated four times. The appropriate selection of thenumber of factors to be used for building the model is crucialfor achieving correct quantitation in PCR and PLS calibrations.
M.A. Hegazy140
The optimum number of latent variables was selected according toHaaland and Thomas criteria [25]. The selected model was thatwith the smallest number of factors such that root mean squareerror of calibration for that model was not significantly greaterthan root mean square error of calibration from model with anadditional factor. The optimum number of latent variablesdescribed by the constructed models was found to be four factorsfor both PCR and PLS as shown in Figs. 11 and 12.
Fig. 12 Root mean square error of calibration (RMSEC) plot of thecross validation results of the training set as a function of the numberof principal components used to construct the PLS calibration.
Table 3 Percentage recoveries of IMD, AKN and OXI in the valida
Table 4 Summary of results obtained by applying the diagnostic to
Validation parameters IMD
PCR
Predicted vs. known concentration plot1—Slope 0.99792—SE of slope 0.0033—Intercept 0.02604—SE of intercept 0.0506—Correlation coefficient 0.99997—SE of regression 0.012Residual vs. actual concentration plot7error in prediction 0.011
In order to assess the predictive ability of each of the developedmodels, it was applied on an external validation set for determina-tion of the three components. The recoveries, mean recoveries andRMSEP are summarized in Table 3.
The validation of the developed PCR and PLS models wasassessed using several diagnostic tools. The predicted concentra-tions of the validation samples were plotted against the trueconcentration values. This was used to determine whether themodel accounted for the concentration variation in the validationset. All plots had a slope of nearly one and an intercept close tozero. The results in Table 4 indicate the high predictive abilities ofthe two models.
3.3. Determination of IMD in its pharmaceutical formulation(Tanatrils tablets)
The suggested methods were successfully applied for determina-tion of IMD in Tanatrils tablets. The results shown in Table 5 aresatisfactory and with good agreement with the labeled amount.
ICH guidelines [12] for method validation were followed forvalidation of the suggested methods.
3.3.1. LinearityThe linearity of the proposed spectrophotometric methods wasevaluated by analyzing six concentrations of IMD ranging from 4to 32 mg/mL for all of the proposed UV spectrophotometricmethods. Each concentration was repeated three times. The assay
aMean of three determinations; standard addition technique; pharmaceutical preparation taken was 8 mg/mL.
Table 6 Determination of IMD in the presence of different proportions of its degradates, AKN and OXI, in laboratory prepared mixturesby the proposed spectrophotometric methods.
Mean (%)7SD 100.38 71.33 99.38 70.73 99.9470.44 99.14 70.86
nMean of three determinations.
Stability-indicating spectrophotometric determination of a novel ACE inhibitor 141
was performed according to the experimental conditions pre-viously mentioned (Table 2).
3.3.2. AccuracyThe accuracy of the results was checked by applying the proposedspectrophotometric methods for the determination of different blindsamples of IMD. The concentrations were obtained from thecorresponding regression equations, from which the percentagerecoveries were calculated with mean percentage recovery (Table 2).
Accuracy of the method was further assured by the use of thestandard addition technique, it was performed by the additionof known amounts of pure IMD to known concentrations ofthe pharmaceutical formulation. The resulting mixtures wereassayed, and the results obtained were compared with the
expected results (Table 5). The good recoveries of the standardaddition technique suggested good accuracy of the proposedmethods.
3.3.3. Precision3.3.3.1. Repeatability. Three concentrations of IMD (6, 14, and28 mg/mL) were analyzed three times intra- daily using the proposedspectrophotometric methods. The percentage recoveries and rela-tive standard deviation were calculated (Table 2).
3.3.3.2. Intermediate precision. The previous procedures wererepeated inter-daily three times on three different days for theanalysis of the three chosen concentrations. The percentage recov-eries and relative standard deviation were calculated (Table 2).
Table 7 Statistical comparison between the reported HPLCmethod and the adopted methods for the determination of IMD.
aThe theoretical values of t and F at P¼0.05 are 2.23 and 5.05,respectively (n¼6).
bHPLC method using C18 column, flow rate of 1.0 mL/min,mobile phase composed of acetonitrile–methanol–phosphate buffer,pH 2.0 (60:10:30, v/v/v) and UV detection at 254 nm.
M.A. Hegazy142
3.3.4. RangeThe calibration range was established through considerations ofthe practical range necessary according to adherence to Beer's lawand the concentration of IMD present in the pharmaceuticalpreparations to give accurate, precise and linear results (Table 2).
3.3.5. Detection and quantitation limitsAccording to the ICH recommendations [12], the approach basedon the SD of the response and the slope was used for determiningthe limits of detection (LOD) and quantitation (LOQ) (Table 2).
LOD¼ 3:3� SD of the response=slope
LOQ¼ 10� SD of the response=slope
3.3.6. SpecificitySpecificity of the proposed spectrophotometric methods wasachieved by the analysis of different laboratory prepared mixturesof IMD and its degradation products, AKN and OXI, within thelinearity range. Satisfactory results are shown in Table 6.
Table 7 shows statistical comparison of the results obtained bythe proposed methods and the reported HPLC method by Staniszet al. [8]. The calculated t and F values are less than the theoreticalones indicating that there is no significant difference between theproposed methods and the reported HPLC method with respect toaccuracy and precision.
4. Conclusion
The present work is concerned with the determination of IMD inthe presence of both its alkaline and oxidative degradationproducts, in pure form or in its pharmaceutical formulation. Theproposed spectrophotometric and chemometric methods areconsidered to be simple, convenient, less time consuming andeconomic stability-indicating methods compared to other pub-lished LC methods. The suggested methods showed high sensi-tivity, accuracy, reproducibility and specificity. These methods canbe used as stability-indicating methods and can determine IMD inits tablets without interference from excipients. Moreover, theadopted methods are inexpensive and do not require sophisticatedtechniques or instruments. They can be considered useful and
promising for developing routine quality control analysis ofpharmaceuticals without any preliminary separation step. Theyare valid for application in laboratories lacking liquid chromato-graphic instruments.
Acknowledgments
We wish to thank SMS Pharmaceuticals Limited, Hyderabad,India, for the great effort afforded for supplying Imidapril hydro-chloride standard.
References
[1] E. Wyszomirska, K. Czerwinska, A.P. Mazurek, Identification anddetermination of antihypertonics from the group of angiotensin-convertase inhibitors by densitometric method in comparison withHPLC method, Acta Pol. Pharm.—Drug Res. 67 (2010) 137–143.
[2] H. Nishi, K. Yamasaki, Y. Kokusenya, et al., Optical resolution ofimidapril hydrochloride by high performance liquid chromatographyand application to the optical purity testing of drugs, J. Chromatogr.A 672 (1994) 125–133.
[3] M. Mabuchi, Y. Kano, T. Fukuyama, et al., Determination ofimidapril and imidaprilat in human plasma by high-performanceliquid chromatography–electrospray ionization tandem mass spectro-metry, J. Chromatogr. B: Biomed. Sci. Appl. 734 (1999) 145–153.
[4] S. Horimoto, M. Mabuchi, K. Banno, et al., Rapid determination of anew angiotensin-converting enzyme inhibitor, imidapril, and its activemetabolite in human plasma by negative-ion desorption chemicalionization-tandem mass spectrometry (MS/MS), Chem. Pharm. Bull.41 (1993) 699.
[5] J. Yun, J. Myung, H. Kim, et al., LC–MS determination andbioavailability study of imidapril hydrochloride after the oral admin-istration of imidapril tablets in human volunteers, Arch. Pharm. Res.28 (2005) 463–468.
[6] P. Rudzki, K. Buś, H. Ksycińska, et al., An overview of chromato-graphic methods coupled with mass spectrometric detection fordetermination of angiotensin-converting enzyme inhibitors in biolo-gical material, J. Pharm. Biomed. Anal. 44 (2007) 356–367.
[7] M. Matsuoka, S. Horimoto, M. Mabuchi, et al., Determination ofthree metabolites of a new angiotensin-converting enzyme inhibitor,imidapril, in plasma and urine by gas chromatography–mass spectro-metry using multiple ion detection, J. Chromatogr. B: Biomed. Sci.Appl. 581 (1992) 65–73.
[8] B. Stanisz, K. regulska, K. Kolasa, UV derivative spectrophotometricand RP-HPLC methods for determination of imidapril hydrochloridein tablets and for its stability assessment in solid state, Acta Pol.Pharm. 68 (2011) 645–651.
[9] K. Tagawa, K. Hayashi, M. Mizobe, et al., Highly sensitivedetermination of imidapril, a new angiotensin I-converting enzymeinhibitor, and its active metabolite in human plasma and urine usinghigh-performance liquid chromatography with fluorescent labellingreagent, J. Chromatogr. B: Biomed. Sci. Appl. 617 (1993) 95–103.
[10] F. El Yazbi, M. Mahrous, H. Hammud, et al., Kinetic spectro-photometric determination of betaxolol, clopidogrel and imidapril inpharmaceutical preparations, Curr. Anal. Chem. 6 (2010) 228–236.
[11] ICH, Q1A (R2) Stability Testing of New Drug Substances andProducts, in: Proceeding of the International Conference on Harmo-nization, Geneva, 2003.
[12] ICH, Q2 (R1) Validation of Analytical Procedures, in: Proceeding ofthe International Conference on Harmonization, Geneva, 2005.
Stability-indicating spectrophotometric determination of a novel ACE inhibitor 143
[16] S. Stofik, R. Gwozdz, C. Pelloni, et al., Stable Formulations ofAngiotensin Converting Enzyme (ACE) Inhibitors, US Patent 2003/0215526 A1, 2003. ⟨http://www.google.com/patents/US20030215526⟩.
[17] S.Y. Lin, S.L. Wang, T.F. Chen, et al., Intramolecular cyclization ofdiketopiperazine formation in solid-state enalapril maleate studied bythermal FT-IR microscopic system, Eur. J. Pharm. Biopharm. 54(2002) 249–254.
[18] S. Altinöz, D. Tekeli, Analysis of glimepiride by using derivative UVspectrophotometric method, J. Pharm. Biomed. Anal. 24 (2001)507–515.
[19] D. Bonazzi, R. Gotti, V. Andrisano, et al., Analysis of ACE inhibitorsin pharmaceutical dosage forms by derivative UV spectroscopy andliquid chromatography (HPLC), J. Pharm. Biomed. Anal. 16 (1997)431–438.
[20] H.M. Lotfy, M.A. Hegazy, Comparative study of novel spectro-photometric methods manipulating ratio spectra: an application on
pharmaceutical ternary mixture of omeprazole, tinidazole and clari-thromycin, Spectrochim. Acta A: Mol. Biomol. Spectrosc. 96 (2012)259–270.
[21] E. Dinç, F. Onur, Application of a new spectrophotometric methodfor the analysis of a ternary mixture containing metamizol, para-cetamol and caffeine in tablets, Anal. Chim. Acta 359 (1998) 93–106.
[22] A. Afkhami, M. Bahram, Mean centering of ratio spectra as a newspectrophotometric method for the analysis of binary and ternarymixtures, Talanta 66 (2005) 712–720.
[23] T. Pham-Gia, Q. Duong, The generalized beta- and F-distributions instatistical modelling, Math. Comput. Modell. 12 (1989) 1613–1625.
[24] R.G. Brereton, Introduction to multivariate calibration in analyticalchemistry, Analyst 125 (2000) 2125–2154.
[25] D. Haaland, E. Thomas, Partial least-squares methods for spectralanalyses. 1. Relation to other quantitative calibration methods and theextraction of qualitative information, Anal. Chem. 60 (1988) 1193–1202.