Determination of absorption coefficients and thermalconductivity of GaAIAs/GaAs heterostructure using aphotothermal method
N. Yacoubi, B. Girault, and Jean Fesquet
A method for measurement of the optical absorption coefficient of stacked heterostructures such as GaAlAson GaAs substrates is described, based on the Fernelius model for an optically absorbing thin layer. Thismethod enables us to obtain the thermal conductivity of the thin layer. The experimental results arecompared with the results given by spectroscopic ellipsometry.
1. Introduction
In recent years photothermal spectroscopy has be-come one of the most important tools for the study oflight absorption in materials that are optically opaque.In a previous paper' we described a nondestructivemethod of optical absorption coefficient measurementof bulk semiconductor samples based on photoacousticspectroscopy. Here we present the results of measure-ments on a heterostructure.
Stacked heterostructures such as GaAlAs on GaAssubstrates are of high technological interest especiallyfor optoelectronic devices. In such devices, preciseknowledge of the GaAlAs and GaAs absorption coeffi-cients near each fundamental absorption edge usingnondestructive techniques is of primary importance.For the top GaAlAs layer of the GaAlAs/GaAs struc-tures, measurements are complicated by the fact thatGaAs is not transparent in the useful photon energyrange and only reflectance-based techniques are avail-able. Among these techniques, spectroscopic ellipso-metry with rotating analyzers is the most reliable.2
In this paper we present an improved photothermaltechnique which allows us to obtain
(1) the thermal conductivity, kc, of a 9-,gm thickGao.4 6Alo.54As top layer;
The authors are with Universite des Sciences et Techniques duLanguedoc, Equipe de Microoptoelectronique de Montpellier (UAau CNRS 3921), F 34060 Montpellier, France.
(2) the absorption coefficient of the top layer in the2.05-2.30-eV photon energy range; and
(3) the absorption coefficient of the heavily p-dopedGaAs substrate in the 1.3-1.44-eV photon energyrange.
The photothermal data are compared to ellipsome-tric measurements performed on the same sample.
11. Measurement Method
The outline of the photothermal deflection (mirageeffect)3 is schematically represented in Fig. 1. Theabsorption of the optical exciting beam (heat beam)causes a variation in the temperature of the opticallyheated region. This temperature variation causes arefractive-index gradient in the oil layer adjacent tothe sample surface. By probing this gradient with asecond beam (probe beam), one can relate its deflec-tion to optical absorption and to thermal properties ofthe sample. To obtain a high signal-to-noise ratio, thesample is immersed into carefully filtered cedar oil,which has a refractive index matched to that of theoptical sample cell and appropriate thermal diffusivity(4.8 X 10⁻⁸ m 2 s 1 ).
The cedar oil forms region I; the solid sample com-posed of the epitaxial GaAlAs layer with a thickness hand the GaAs substrate with a thickness forms regionII. The backing forms region III (Fig. 2).
The experimental data are reduced using the Ferne-lius model4 which treats the case of a two-layer samplewith different optical and thermal properties. Thetreatment uses the same level of approximation asRosencwaig and Gersho.5 The probe beam travelinginto the refractive-index gradient is deflected. Theprobe beam deflection can be related to the optical andthermal properties of the sample under test.
Neglecting transients, the general solution givingthe temperature o(x,t) in oil can be written 4 as
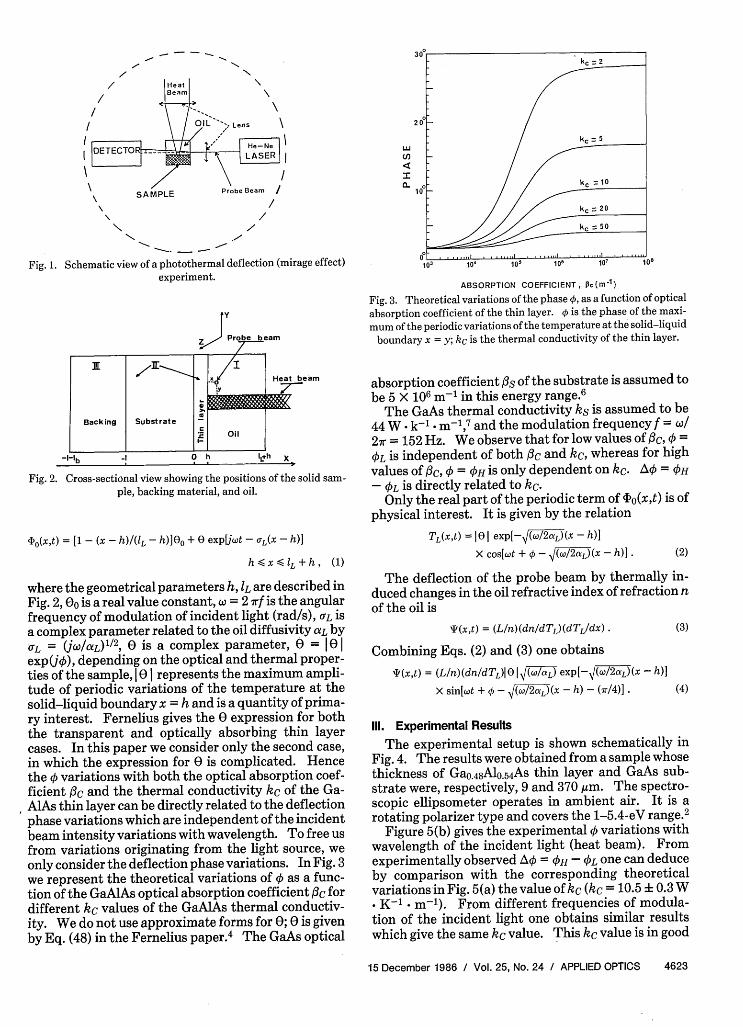
where the geometrical parameters h, IL are described inFig. 2, 00 is a real value constant, X = 2 7rf is the angularfrequency of modulation of incident light (rad/s), CL isa complex parameter related to the oil diffusivity aYL byCL = (/XL) 12, 0 is a complex parameter, 0 = 101exp(jo), depending on the optical and thermal proper-ties of the sample, I 0 I represents the maximum ampli-tude of periodic variations of the temperature at thesolid-liquid boundary x = h and is a quantity of prima-ry interest. Fernelius gives the 0 expression for boththe transparent and optically absorbing thin layercases. In this paper we consider only the second case,in which the expression for 0 is complicated. Hencethe k variations with both the optical absorption coef-ficient 13c and the thermal conductivity kc of the Ga-AlAs thin layer can be directly related to the deflectionphase variations which are independent of the incidentbeam intensity variations with wavelength. To free usfrom variations originating from the light source, weonly consider the deflection phase variations. In Fig. 3we represent the theoretical variations of k as a func-tion of the GaAlAs optical absorption coefficient 13c fordifferent kc values of the GaAlAs thermal conductiv-ity. We do not use approximate forms for 0; 0 is givenby Eq. (48) in the Fernelius paper.4 The GaAs optical
ABSORPTION COEFFICIENT, Pc(M-1)
Fig. 3. Theoretical variations of the phase 0, as a function of optical
absorption coefficient of the thin layer. k is the phase of the maxi-mum of the periodic variations of the temperature at the solid-liquid
boundary x = y; kc is the thermal conductivity of the thin layer.
absorption coefficient fls of the substrate is assumed tobe 5 X 10⁶ m-1 in this energy range. 6
The GaAs thermal conductivity ks is assumed to be44 W -k-1 _ m-1 ,7 and the modulation frequency f = wi27r = 152 Hz. We observe that for low values of 13c, 0 =kL is independent of both 0c and kc, whereas for high
values of 0c, p = OH is only dependent on kc. Ak = 'OH
L is directly related to kc.Only the real part of the periodic term of 4)0(x,t) is of
physical interest. It is given by the relation
TL(x,t) = 1O1 exp[- (w/2aL)(x - h)]
X cosuwt + 0 - /(/2aL)(x - h)] . (2)
The deflection of the probe beam by thermally in-duced changes in the oil refractive index of refraction nof the oil is
The experimental setup is shown schematically inFig. 4. The results were obtained from a sample whosethickness of Ga0 .48Alo.54As thin layer and GaAs sub-strate were, respectively, 9 and 370 gim. The spectro-scopic ellipsometer operates in ambient air. It is arotating polarizer type and covers the 1-5.4-eV range.2
Figure 5(b) gives the experimental 0 variations withwavelength of the incident light (heat beam). Fromexperimentally observed AO = OH - XL one can deduceby comparison with the corresponding theoreticalvariations in Fig. 5(a) the value of kc (kc = 10.5 i 0.3 W* K-l * mm1 ). From different frequencies of modula-tion of the incident light one obtains similar resultswhich give the same kc value. This kc value is in good
I __I LOCK-IN APLIFIER J COMPUTER IEEE 32 K - OCTETS
Fig. 4. Schematic diagram of the setup. The light source is a 250-Whalogen lamp. The light is modulated by a variable-speed chopper.The sample is immersed in a glass cell (see Fig. 1) filled with cedar oil.Data acquisition and instrument control are performed through
interfacing with a 32 K octets computer.
50 600 650
Fig. 5. Comparison between the theoretical 0 vari-ations with the optical absorption coefficient of theGa0.46Alos4As thin layer and the experimental variations with the wavelength of the incident light
(heat beam).
700
ABSORPTION COEFFICIENT p(m-t)
10
.5
WAVELENGTH (nm)
10
105
_._... .. .1o42.25 2.30
Fig. 6. Experimental results corresponding to the modulation fre-quencies f = 152 Hz and f = 373 Hz agree with the c(X) curve (solid
line) obtained from optical measurements using ellipsometry.
agreement with previous work8 (kc = 11.5 + 0.5 W -In 1 - k-1).
If we compare the theoretical curve (flc) and theexperimental curve (X) it is possible to determine theabsorption coefficient as a function of wavelength X.Available values of flc(X) are between 2.5 X 10⁴ and 4 X10⁶ m 1 . The f3c(X) values obtained between 2.05 and2.30 eV are given in Fig. 6 for two frequencies. Theoptical absorption coefficient increases with increas-ing photon energy because of the X (2.00-eV), L (2.07-eV), and r (2.135-eV) electronic transitions. 9 Near2.135 eV, the shoulder in the absorption curve is clearlyrelated to the r direct electronic transitions. In Fig. 6we have also reported the optical absorption coeffi-cient given by a multilayer analysis from linear regres-sion of spectroscopic ellipsometry data between 1 and3.6 eV. The methodology has been described else-where in detail.' 0 Photothermal and spectroscopicellipsometry data are in approximative agreement inthe region where photothermal deflection is sensitiveto c.
Fig. 7. Comparison between the theoretical 0 vari-ations with the optical absorption coefficient of the
l GaAs substrate and the experimental 0 variationswith the wavelength of the incident light (heat
beam).
E f 259Hz :tI- r + f =481 Hzz_ -E.S. /
0
z
1.30 1,34 1.38 1.42
ENER GY E (eV)
Fig. 8. Experimental results corresponding to the modulation fre-quencies f = 259 and 481 Hz agree with the fs(X) curve (solid line)
obtained from optical measurements using the ellipsometrytechnique.
Between 1.3 and 1.4 eV the GaAlAs top layer isoptically thin. Using the Fernelius model we haveobtained at 259 Hz the theoretical variation of 0 infront of the optical coefficient absorption Ns for theGaAs substrate [see Fig. 7(b)] for a value of Nlc = 2 X10⁻⁴ m'1 in this energy range obtained by experimen-tal results. In the Ns region where k(NS) is sensitive thedirect comparison between experimental [see Fig. 7(a)]and theoretical values gives Ns(X). The results ob-tained at 481 and 259 Hz are reported in Fig. 8 whichalso gives the optical absorption coefficient obtainedby spectroscopic ellipsometry into the same GaAs sub-strate.
IV. Conclusion
From the theoretical Fernelius model and the ex-perimental detection of the phase of the photothermaldeflection, we have obtained the stacked heterostruc-ture spectra corresponding to both the GaAlAs thinlayer and the GaAs substrate. The experimental dataare in agreement with the results given by spectroscop-ic ellipsometry.
In addition, the photothermal measurement enablesus to measure the thermal conductivity of the GaAlAsthin layer.
The method appears particularly interesting be-cause the experiment has been performed without anyspecial sample preparation.
It is a great pleasure to acknowledge M. Erman andJ. B. Theeten of the laboratoire d'Electronique et dePhysique appliqu6e (Limeil Br6vannes, France) forthe spectroscopic ellipsometry measurement and thereduction of the spectroscopic ellipsometry data.
References
1. J. Fesquet, B. Girault, and M. D. M. Razafindrandriatsimaniry,"Determination of Absorption Coefficients of Thick Semicon-ductor Samples Using Photoacoustic Spectroscopy," Appl. Opt.23, 2784 (1984).
2. J. B. Theeten, F. Simomdet, M. Erman, and J. Pernas, "Filmsand Interface Analysis using Spectroscopic Ellipsometry," inProceedings, Fourth International Conference on Solid Sur-faces, Cannes, le vide les couches minces 201, 1071 (1980).
3. J. Badoz, D. Fournier, and A. C. Boccara, "La photoacoustiquerenouveau d'une methode centenaire," J. Opt. 11, 399 (1980).
4. N. C. Fernelius, "Extension of the Rosencwaig-Gersho Photo-acoustic Spectroscopy Theory to Include Effects of a SampleCoating," J. Appl. Phys. 51, 650 (1980).
5. A. Rosencwaig and A. Gersho, "Theory of the PhotoacousticEffect with Solids," J. Appl. Phys. 47, 64 (1976).
6. D. E. Aspnes and A. A. Studna, "Dielectric Functions and Opti-cal Parameters of Si, Ge, GaP, GaAs, GaSb, InP, InAs, and InSbfrom 1.5 to 6.0 eV," Phys. Rev. B 27, 123 (1983).
7. P. D. Maycock, "Thermal Conductivity of Silicon, Germanium,III-V Compounds and III-V Alloys," Solid State Electron. 10,161, 168 (1967).
8. M. A. Afromowitz, "Thermal Conductivity of Gaj.,AlAs Al-loys," J. Appl. Phys. 44, 1092 (1973).
9. A. K. Saxena, "Intervalley Scattering in GalAIAs Alloys," J.Appl. Phys. 52, 5643 (1981).
10. M. Erman, J. B. Theeten, P. Frijlink, S. Gaillard, F. Jia Hua, andC. Alibert, "Electronic States and Thicknesses of GaAs/GaAlAsQuantum Wells as Measured by Electroreflectance and Spectro-scopic Ellipsometry," J. Appl. Phys. 56, 3241 (1984).