Determination of Appropriate Cost of Capital Rates for the Regulated Fixed Services of France Telecom A report commissioned by AFORST, Association Française des Opérateurs de Réseaux et Services de Télécommunications Djibril Diakité 31 October 2005
Transcript
Determination of Appropriate Cost of Capital Rates for the Regulated Fixed Services of France Telecom
A report commissioned by AFORST, Association Française des Opérateurs de Réseaux et Services de Télécommunications
Djibril Diakité 31 October 2005
Determination of Appropriate Cost of Capital Rates for the Regulated Fixed Activities of France Telecom
31 October 2005 Djibril Diakité 2
Table of contents 1. General Approach ................................................................................................ 4
1.1. WACC/CAPM .......................................................................................................... 4 1.2. Approach of this Report ........................................................................................... 5
2. The Marginal Investor .......................................................................................... 7 2.1. Home and global CAPM .......................................................................................... 7 2.2. FT’s Shareholding.................................................................................................... 8 2.3. Conclusion..............................................................................................................10
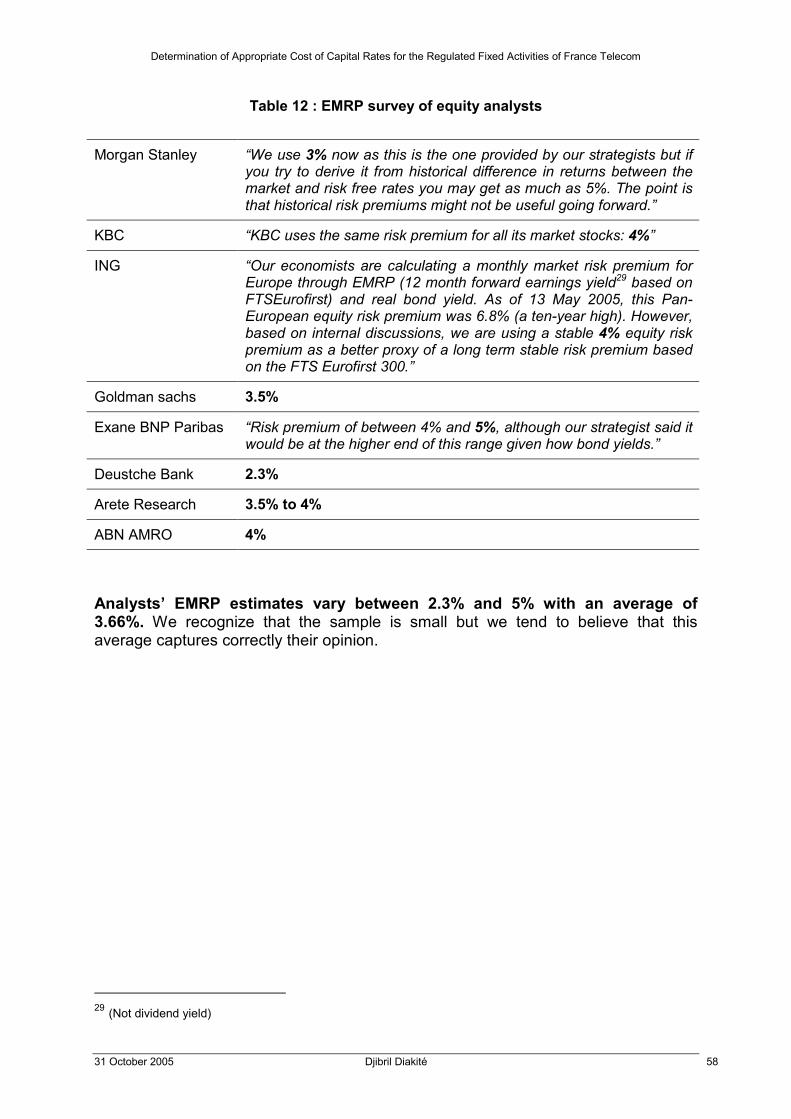
4.3. Survey Premia ........................................................................................................55 4.3.1. Fund Managers and Equity Analysts......................................................................................... 55 4.3.2. Other Surveys from Ofcom’s Consultation ................................................................................ 59 4.3.3. Regulators ................................................................................................................................. 61
4.4. Summary of EMRP evidence..................................................................................63
5. Group Beta.......................................................................................................... 66 5.1. Estimation Issues....................................................................................................67
5.1.1. Estimation Period and Frequency ............................................................................................. 67 5.1.2. Market index.............................................................................................................................. 72 5.1.3. Bayesian Adjustment................................................................................................................. 74
5.2. Asset Beta ..............................................................................................................75 5.2.1. Unlevering Formula ................................................................................................................... 75 5.2.2. Debt to Equity Ratio .................................................................................................................. 75 5.2.3. France Telecom’s Asset Beta.................................................................................................... 78
6. Cost of Debt and Capital Structure................................................................... 79 6.1. Ratings and Spreads ..............................................................................................79
Determination of Appropriate Cost of Capital Rates for the Regulated Fixed Activities of France Telecom
Determination of Appropriate Cost of Capital Rates for the Regulated Fixed Activities of France Telecom
31 October 2005 Djibril Diakité 4
1. General Approach
1.1. WACC/CAPM The cost of capital is a key input in the regulatory process for telecom operators. Used as the discount rate in net present value calculations, typically for LRIC models, it has an indirect but significant impact on cost-oriented prices set by regulators.
Following EC recommendations, ARCEP consider the WACC/CAPM framework to assess the pre-tax rate. WACC is the weighted average of the costs of the different components of financing used by a firm to fund its financial requirements. They are usually split into two categories: equity and debt. The weights are based on the economic value of each component: D/(D+E)=g for debt and 1-g for equity. There are several models for the cost of equity. The most commonly used is the Capital Asset Pricing Model (CAPM): Cost of Equity = Rf+β.EMRP where
- Rf is the risk free rate - EMRP is the Equity Market Risk Premium: the incremental return that
shareholders require from holding risky securities rather than risk-free securities.
- Beta is the measure of the firm’s exposure to market (or systematic) risk. In spite of its shortcomings, it remains indeed the most appropriate framework in a regulatory context, especially for large publicly traded firms. The CAPM has a clear theoretical foundation and its implementation is simple and well established relative to that of other asset pricing models. The cost of debt is the rate at which the company can refinance its existing debt given its present economic position. It cannot be lower than the risk free rate: Cost of debt = Rf+d where d is the debt margin (or spread), a measure of the higher yield that compensates for the default/credit risk of the corporate debt. Hence, in nominal terms: WACCpre-tax= (1-g)/(1-t).(Rf+β.EMRP)+g.(Rf+d) In most circumstances, and especially for LRIC models, the relevant measure for the cost of capital is a forward looking one, e.g. the expected EMRP.
Determination of Appropriate Cost of Capital Rates for the Regulated Fixed Activities of France Telecom
31 October 2005 Djibril Diakité 5
1.2. Approach of this Report There is and has been much research and debate concerning the cost of capital in general and its usual parameters in particular. Our approach has consisted in examining as much as possible this abundant literature and in selecting the elements which we have deemed to be the most appropriate to help us in our own WACC estimations, regardless of the direction they might led us. We have naturally focused our attention on previous reports written for European telecom regulators. Ofcom, the British regulator, has published recently several papers of great quality and interest. They are extensively quoted in this note. Works of consulting firm such as Andersen Management international (for PTS in Sweden), Nera (for Opta in the Netherlands), PricewaterhouseCoopers, and The Brattle Group are also often mentioned. Damodaran’s “Applied Corporate Finance”, has largely inspired our own approach to the subject, and “The Real Cost of Capital” of Ogier et al has provided useful complementary insights. Documents of economists such as Wright, Mason & Miles or Dimson Marsh & Staunton have proved to be very valuable sources as well. To collect data, Bloomberg’s services have been simply indispensable for our research but other financial services such as Thomson Financial could have been used. The study of this extensive literature has not impeded us from forging our own opinion in the framework we have described. The issue here is not so much to present a figure as to explain how we have come to it. It is what we have tried to do in a transparent manner. In that respect, we believe it is more appropriate to choose a single figure for each parameter instead of suggesting a range, ending with an even wider range for the WACC estimate, and eventually taking typically the mid-point. For all WACC parameters, and not only for the equity risk premium, we are fully aware that there is no single right answer, the available evidence remain imperfect when not controversial. But we do need to decide on an estimate for the cost of capital rate, at least at the level of France Telecom Group. Rather than leaving the final WACC figure influence retroactively the parameters’ assessment, we think it is more transparent and correct to express a point estimate at each stage of the process.
Since this estimate is not based only on substantiated argument but requires also a degree of judgement, it is suitable to clarify what principles have guided us. Generally speaking, we have been ‘reasonably’ conservative to take into account the regulatory perspective. For instance: - We have considered in practice both latest market information and longer-term estimates to allow for more stability. - When a particular issue remains (potentially) controversial, we have applied a balanced weighting or opted for the intermediate solution instead of using only one side of the evidence, even if we have sensed what would be more appropriate in our situation.
Determination of Appropriate Cost of Capital Rates for the Regulated Fixed Activities of France Telecom
31 October 2005 Djibril Diakité 6
- Similarly, we have reduced the scope of adjustments whose necessity is demonstrated in a convincing manner but quantification is not yet standard practice or may lack of robustness.
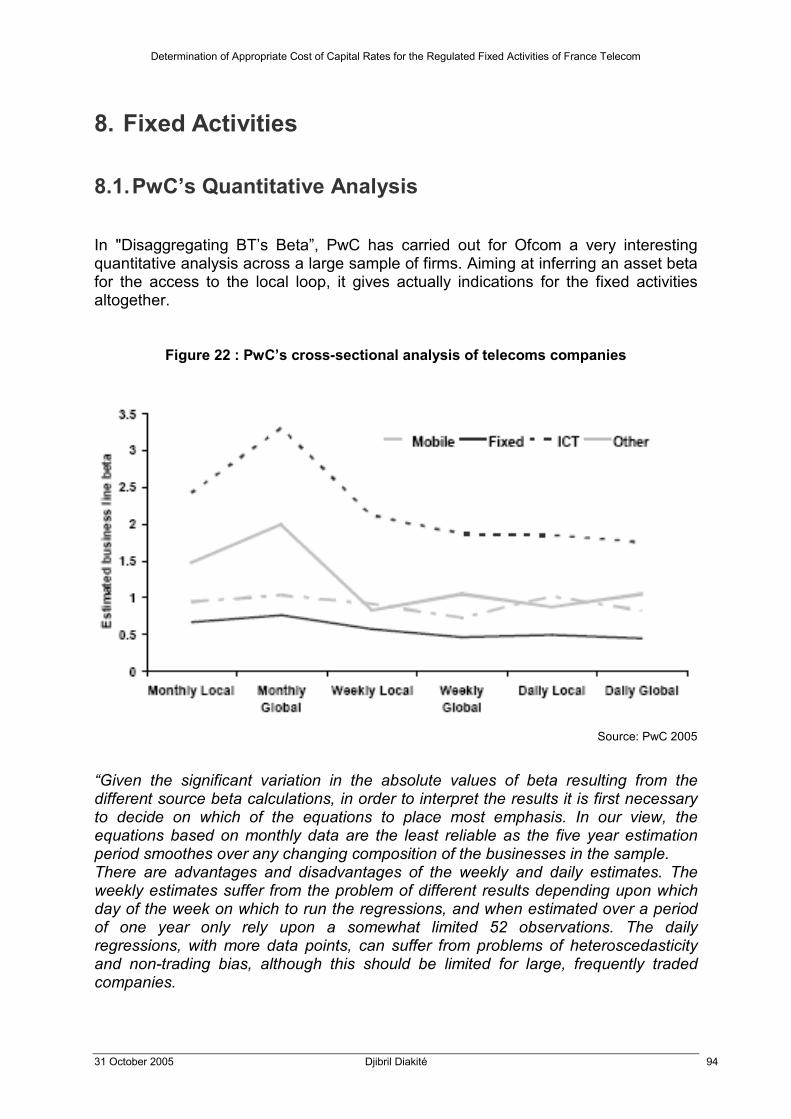
Robustness of the estimation was typically a problem when we have tried to derive WACC rates at more relevant levels: fixed services then access to the local loop. Regarding the fixed/mobile beta disaggregation, we have been able to carry out some quantitative analysis through regressions over a sample of listed European telecom operators. Also we caution against the direct use of the inferred figures, they do show clear indication of the magnitude of differences between divisional betas. Regarding the local loop, we have simply not seen nor been able to develop ourselves an approach that offer some quantification. A qualitative analysis suggests that the systematic risk of this activity is lower than the fixed core network business. But in this area, we believe the regulator will have to apply a supplementary degree of judgement in conjunction with operator’s contributions.
While there will be always elements appearing discretionary, the outcome of this detailed and hopefully balanced approach is simply:
- our best WACC rate estimate for France Telecom’s group in a regulatory context,
- and our best assessment of the difference of exposure to systematic risk –the only one that matters in WACC estimation- between its main activities.
Determination of Appropriate Cost of Capital Rates for the Regulated Fixed Activities of France Telecom
31 October 2005 Djibril Diakité 7
2. The Marginal Investor
2.1. Home and global CAPM In “The Real Cost of Capital”, Ogier et al examine several models for the cost of equity, each giving different results. The ‘home’ CAPM and the ‘global’ CAPM are two of these approaches that are relevant in our case. The other ones are rather associated with investments located abroad (requiring in some cases adjustments for country risk) or calculate the cost of equity for the market portfolio in each country without distinguishing sectors and companies. The ‘home’ approach assumes that equity markets are segmented and calculates CAPM variables with respect to home benchmarks (where the investor is located). The global CAPM assumes that there is a global supply and global demand for all forms of capital, investors hold fully diversified international portfolios made up of stocks from around the world. The model is therefore based on a global risk-free rate, a single global EMRP and a global beta, typically measured with respect to the Morgan Stanley World Capital Indices (MSWCI). It usually generates the lowest rates through typically lower betas, a phenomenon consistent with the principle of incremental benefit from international investment. Ogier et al: “In situation where a company’s shareholder register is largely dominated by investors holding fully diversified global portfolio, there are strong arguments for using the global CAPM approach.”
A Euro implementation of the global CAPM would involve using the Eurozone risk-free rate and simply substituting a world equity index measured in Euro when beta is estimated.
Determination of Appropriate Cost of Capital Rates for the Regulated Fixed Activities of France Telecom
31 October 2005 Djibril Diakité 8
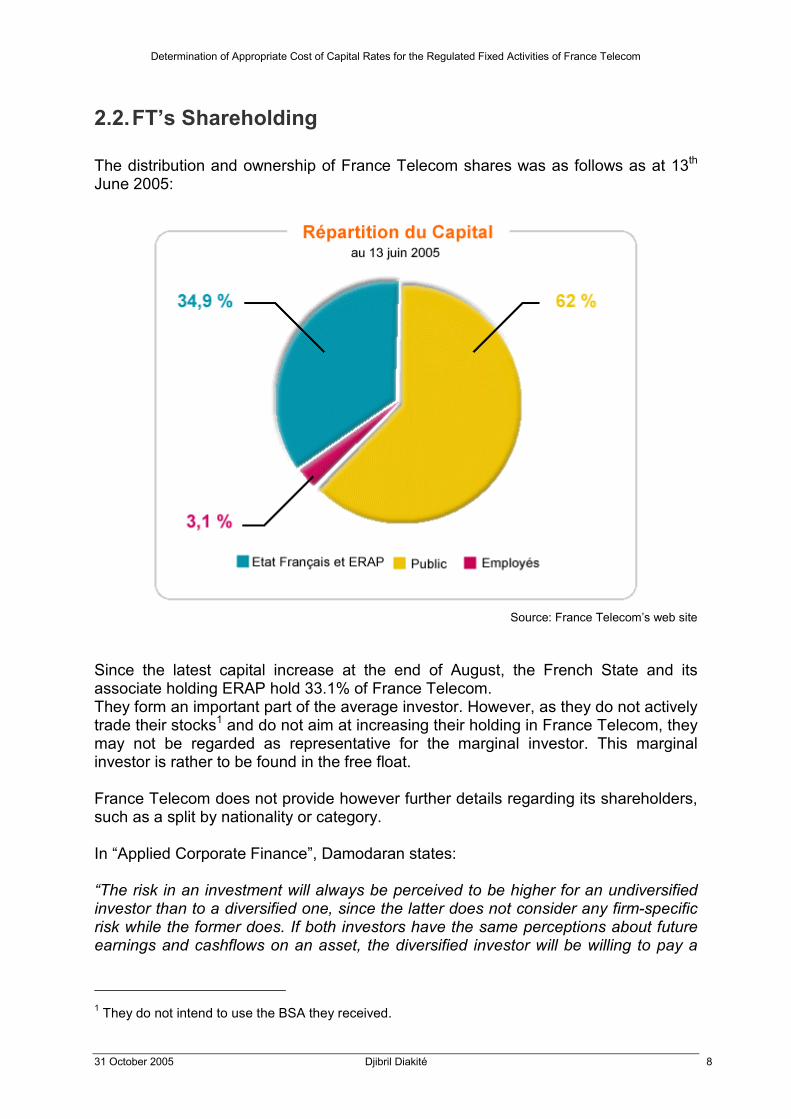
2.2. FT’s Shareholding The distribution and ownership of France Telecom shares was as follows as at 13th June 2005:
Source: France Telecom’s web site
Since the latest capital increase at the end of August, the French State and its associate holding ERAP hold 33.1% of France Telecom. They form an important part of the average investor. However, as they do not actively trade their stocks1 and do not aim at increasing their holding in France Telecom, they may not be regarded as representative for the marginal investor. This marginal investor is rather to be found in the free float. France Telecom does not provide however further details regarding its shareholders, such as a split by nationality or category. In “Applied Corporate Finance”, Damodaran states: “The risk in an investment will always be perceived to be higher for an undiversified investor than to a diversified one, since the latter does not consider any firm-specific risk while the former does. If both investors have the same perceptions about future earnings and cashflows on an asset, the diversified investor will be willing to pay a
1 They do not intend to use the BSA they received.
Determination of Appropriate Cost of Capital Rates for the Regulated Fixed Activities of France Telecom
31 October 2005 Djibril Diakité 9
higher price for that asset because of his or her risk perceptions. Consequently, the asset, over time, will end up being held by diversified investors”.
France Telecom’s IR : « Nous ne communiquons par sur la répartition du flottant mais vous pouvez en effet considérer que celui-ci est composé dans sa très grande majorité de fonds d’investissement internationaux, comme j’imagine, dans la quasi-totalité des sociétés du CAC 40 et les autres grands groupes européens. » The following table from Bloomberg (one among 100) is an illustration of who these investors are:
Source: Bloomberg
The global approach appears clearly justified. One can also argue that it is essentially portfolios dedicated to the European market which are investing in France Telecom, the global diversification being carried out in a second stage. In any case, since the issue is about estimating the level of return demanded by France Telecom’s current marginal investor, an analysis based only on the French market appears inappropriate.
Determination of Appropriate Cost of Capital Rates for the Regulated Fixed Activities of France Telecom
31 October 2005 Djibril Diakité 10
In “Estimating the Cost of Capital of Telecommunications Interconnection Services in Holland – A final report for OPTA” (June 2001), Nera explains: “The cost of capital that is required on any investment will be influenced by the whole portfolio of stocks (and other assets) to which an investor can gain access. This return will partly depend on where investors are located and the type of markets to which they have access. Traditionally, the cost of capital for the Netherlands telecommunications sector has been calculated with reference to the Dutch stock market. As investors become increasingly international, it can be argued that the investors’ reference market goes beyond the national market to embrace the European market as a whole, or potentially the world market.”
2.3. Conclusion In consistence with the framework set at the beginning if this report, we have opted for a more conservative ‘European home’ CAPM. In the following analyses, the European perspective prevails: - The currency being Euro, the risk free rate is anyway the one of the
Eurozone. - For the equity risk premium, we consider also the US and the global market
evidence, but this should have less weight in our final judgement than considerations regarding European EMRP.
- The market index against which betas are computed is pan-European and not limited to the Eurozone2.
One will note that this approach gives indeed higher rates than the global CAPM whereas a less relevant national approach shows unexpectedly the lowest rates for France Telecom.
2 This would exclude non Euro shares which are likely to be in the portfolio of France Telecom’s marginal investor and it would make comparisons with other European operators less relevant. In practice, the differences are very slim: with a Eurozone index, betas are lower of a few basis points.
Determination of Appropriate Cost of Capital Rates for the Regulated Fixed Activities of France Telecom
31 October 2005 Djibril Diakité 11
3. Risk Free Rate
3.1. Risk Free Asset A riskfree asset is defined as the one where the investor knows the expected returns with certainty. Consequently, for an investment to be risk free, i.e., to have an actual return equal to the expected return, two conditions have to be met. - First, there has to be no default risk, which generally implies that the security has
to be issued by a government (but naturally not all governments are default free)3.- Second, there can be no uncertainty about reinvestment rates, which implies that
there are no intermediate cash flows4. With a zero coupon bond, the total compounded interest earned are paid only upon redemption.
The risk free rate for is proxied by the expected return on a default-free (government) zero coupon bond.
3.2. Reference Market There is no government bond at a European level or for the Eurozone actually. Nonetheless, the German government bond is usually used as a proxy for the risk free asset, since its rate is the lowest in the Eurozone and the German economy is at its core. In “Applied Corporate Finance”, Damodaran writes: “There are about 8 countries that issue 10-year Euro denominated bonds. We used the German Euro bond rate as the riskfree rate, not because Deutsche Bank was a German company, but because the German Euro bond rate was the lowest of the government bond rates. The Greek and Spanish 10-year Euro bond rates were about 0.20% higher, reflecting the perception of default risk in those countries. We would continue to use the German Euro bond rate to value Greek and Spanish companies in Euros.”
3 A purist’s view would require that the risk-free asset must have zero correlation (beta) with the market portfolio. In practice it is difficult to identify such an asset since inflation, as well as other factors, has been shown to lead to covariance between notionally risk-free government debt and stock markets. 4 Damodaran: “To illustrate this point, let us assume that we are trying to estimate the expected return over a five-year period and that we want a risk free rate. A six-month Treasury bill rate, while default free, will not be risk free, because there is the reinvestment risk of not knowing what the Treasury bill rate will be in six months. Even a 5-year treasury bond is not risk free, since the coupons on the bond will be reinvested at rates that cannot be predicted today”.
Determination of Appropriate Cost of Capital Rates for the Regulated Fixed Activities of France Telecom
31 October 2005 Djibril Diakité 12
Similarly, Nera states: “There is no “Eurozone” bond in existence that enables a direct measurement of the risk free rate for the Eurozone. Instead, there are many bonds in existence, issued by different sovereign states which exhibit different yields that reflect many different factors, most notably differences in Sovereign risk.’ “The Yields to Maturity are lower for the German denominated bonds. This is likely to reflect reduced sovereign risk attached to the German government debt. Since the risk free rate should reflect simply the time value of money it should not reflect the sovereign risk attached to government default. Given the evidence above which shows a lower YTM for German government bonds, and the fact that Germany is at the centre of the development of the European market, NERA believe that the Yield to Maturity on a euro denominated bond issued by the German government provides the best estimate of a risk free rate for the Eurozone market.” Koller et al in “Valuation” add another argument in favour of the German Eurobonds when valuing European companies: they have higher liquidity. In our case, the risk free rate will be the yield to maturity5 on the German zero coupon government bond. Remarks: - YTM on zero coupon bonds are currently 5 to 10 basis points higher than YTM on
coupon bonds. - The yield differential between the French and the German bonds is very slim. The
following chart shows the cumulative change in government bond spreads against Germany since May 2004 (in basis points):
Source: Reuters and ECB calculation
5 Yield to maturity or redemption yield : this rate of return can be different from the rate of interest (coupon payments usually expressed as a percentage of the bond’s face value) because it is a function of both the coupon payments received and any difference between the current price and the face value that will be returned on redemption.
Determination of Appropriate Cost of Capital Rates for the Regulated Fixed Activities of France Telecom
31 October 2005 Djibril Diakité 13
3.3. Maturity It is usually appropriate to match up the duration of the risk free asset to the duration of the cash flows being analyzed. In corporate finance and valuation, this leads towards long term government bond rates as risk free rates. However, this view may be not the most relevant one in a regulatory context, as explains Nera in reports provided by the Dutch regulator: “With regard to the appropriate bond term or maturity, there are three conceptually attractive options. - the “investment horizon” or security holding period for a representative equity
investor; - >the “planning horizon”, that is the average life of projects that are to be assessed
using the estimate of the cost of capital; - the time-horizon of the periodic review is the appropriate measure, as this offers
an opportunity to readjust the ex-ante return on the asset base. It is a widely accepted financial management principle that amortisation of relevant assets must be over their full economic life and assets life as matched to the maturities of liabilities. This implies that investors generally have an expectation that they will be compensated for making long term investments. Thus, it is argued that when determining expected returns, consideration needs to be given to the investors’ planning horizons. A problem with this argument, however, is that there is little or no evidence to guide the length of the investment horizon of an equity holder. For a regulated company, there are good arguments to use the regulatory review period as the appropriate maturity. Given that WACC is used primarily to value projected cash flows arising in the regulatory period, the use of a risk free rate with a maturity consistent the regulatory review period would mean cost of capital is then consistent with the cash flows to which it is being applied. The regulatory review process then offers the opportunity to readjust the ex ante return on the asset basis as cash flows forecasts are adjusted. Some IG respondents argued that the appropriate maturity for the risk free asset should be equal to the economic lifetime of the assets on the basis that the company must be remunerated for the full cost of the assets. It is noted that there is some support amongst academics and practitioners for a risk free rate as short as 90 days (Brealey and Myers and the Office of Gas Supply in the UK have favoured this approach). For the purpose of NERA’s WACC calculation, NERA use a risk free rate consistent with the regulatory review period, namely 1 year. As returns are reset every 1 year, the use of shorter term bond rates eliminates interest rate risk and provides a better estimate of a risk free rate benchmark for the regulatory period.” Regarding the impact on the EMRP, the consultant adds:
“Since our preferred risk-free rate measure is a bond proxy, we attach primary weight to evidence on historic EMRP measured with respect to bonds” (and not bills, even for a maturity of one year ahead).
Determination of Appropriate Cost of Capital Rates for the Regulated Fixed Activities of France Telecom
31 October 2005 Djibril Diakité 14
The rationale for the Nera/Opta position is explained in more details by Professor Kevin Davis in “The Weighted Average Cost of Capital for the Gas Industry” (1998): “While a long term cost of capital might be appropriate for the valuation of long lived assets, it is not apparent that a long term cost of capital is appropriate for price determination decisions in the short run. Where the allowable cost of capital is to be revised on a regular basis, it is not necessarily appropriate that a long term cost of capital is used as the benchmark. How is this compatible with the facts that the assets in question are long term assets and that long term interest rates are normally at a premium to short term rates? The answer is most easily seen by considering a period in which there is an upward sloping yield curve. A long term fixed rate bond will have a yield to maturity well in excess of the short term rate while, an equivalent term floating rate bond will have a yield much closer to the short rate. The reason is that the cash flows on the floating rate bond reset in line with movements in market interest rates. Any difference between the short term rate and the yield to maturity on the long term floating rate bond reflects market premium for possible default risk, not the yield curve effect. The case under consideration here is basically equivalent. Allowable prices and thus cash flows are to be reset regularly taking into account movements in market interest rates. In this way, the owners of the assets are to be largely protected from changes in the value of their assets arising from movements in market interest rates. Consequently there is no obvious reason to believe that they should be allowed to charge prices which incorporate a premium for bearing long term interest rate risk, which is not in fact being borne. Clearly, however, there is no protection from the risk arising from other sources of fluctuation in asset values, which might be thought to be important. However, if the CAPM is thought to be appropriate for deriving a benchmark, a premium for systematic risk is incorporated while idiosyncratic risk, because it is diversifiable, does not require compensation. Therefore, it would seem to be the case that an appropriate term risk free interest rate for use in the CAPM would be the term between pricing reviews.” Andersen Management International (AMI) for PTS in Sweden shares this approach: “For non-regulatory purposes, the relevant time to maturity is determined by the average life of the group of assets making up the investment project. In such circumstances, matching the duration of the risk-free asset to the cash flows being analysed would imply the use of a time period of at least 10 years. In a regulatory context, on the other hand, the WACC is not used to discount expected cash flows over the investment horizon [referred as the ‘planning horizon’ by Nera], but rather to determine these cash flows (indirectly) in the regulatory period, providing lenders and investors with a reasonable return. Following a regulatory review process, the opportunity is offered to re-adjust the ex ante return on the asset base if financial market conditions have changed. Thereby, asset owners are largely protected from movements in market interest rates as returns may be re-set during the regulatory review. Therefore, it could be argued that operators should not be allowed to charge prices with an interest rate risk premium measured over a period in excess of the regulatory review period. Doing so would compensate the operator for an interest rate risk that is not being borne.
Determination of Appropriate Cost of Capital Rates for the Regulated Fixed Activities of France Telecom
31 October 2005 Djibril Diakité 15
This suggests that the maturity period should be linked to the regulatory review period. This principle is e.g. adopted in the UK, where Oftel uses yields on nominal gilts with a maturity length consistent with that of the price control, i.e. approximately 4-5 years.”
Figure 1 : YTM of zero coupon German bonds with a maturity of January 2009, 2011 and 2016
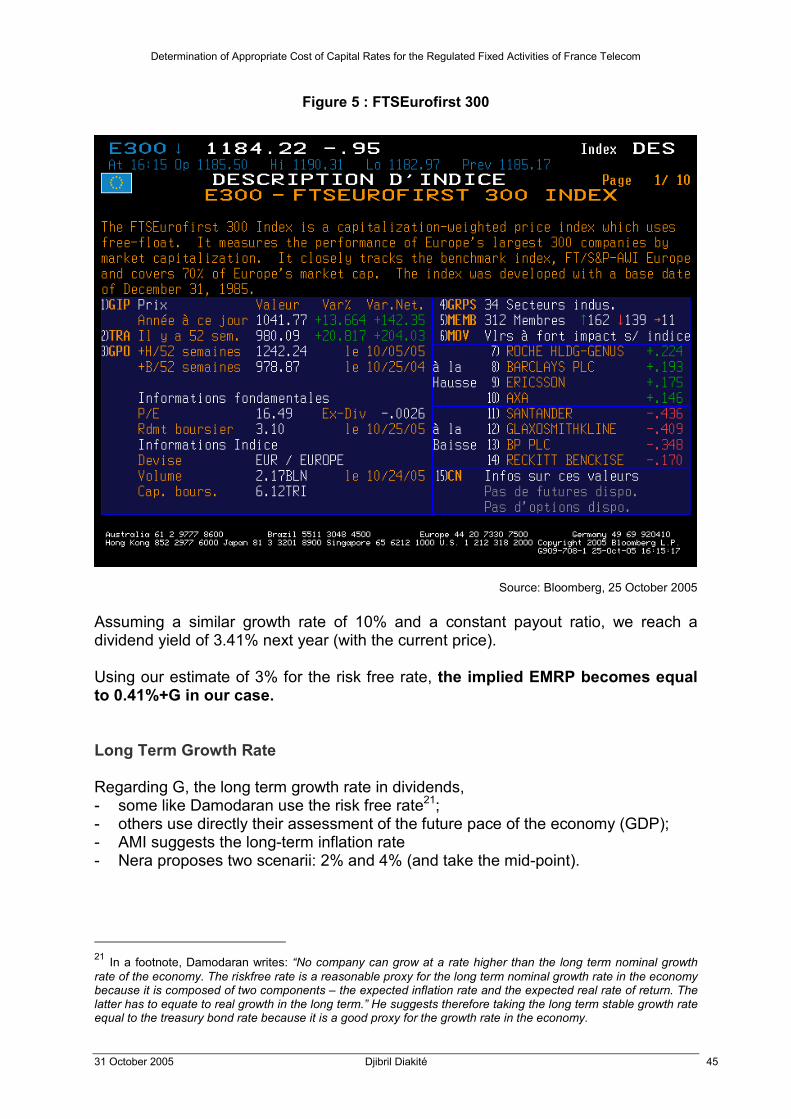
In its consultation paper, “Ofcom’s approach to risk in the assessment of the cost of capital” (June 2005), the British regulator writes more precisely: “There are arguments in favour of both short and long-term gilts as the best estimate of the risk free rate for the purposes of the proposed charge control. For example: - a maturity relevant to the duration of a particular charge control may be appropriate (e.g. if a review relates to a 3-year charge control, a 3-year gilt may be appropriate); - BT is required to make investments (for example regarding network infrastructure) that will have economic lifetimes in excess of a typical charge control period, and hence a longer-term gilt may be appropriate. Ofcom’s preferred approach is to give weight to both of the above considerations. In calculating a risk-free rate to be applied to BT, its view is that 5-year gilts represent a reasonable compromise between the above two arguments.”
Determination of Appropriate Cost of Capital Rates for the Regulated Fixed Activities of France Telecom
31 October 2005 Djibril Diakité 16
The argument for a duration matching the periodic review is strong. But although ARCEP’s next regulatory period ends in 2008, we opt cautiously for a maturity of 2011 years for the prevailing market risk free rates. In our case, this maturity would be closer to the intermediate ‘investor’s horizon’ (as defined by Nera). It is in the end the same compromise as the one set by Ofcom.
Determination of Appropriate Cost of Capital Rates for the Regulated Fixed Activities of France Telecom
31 October 2005 Djibril Diakité 17
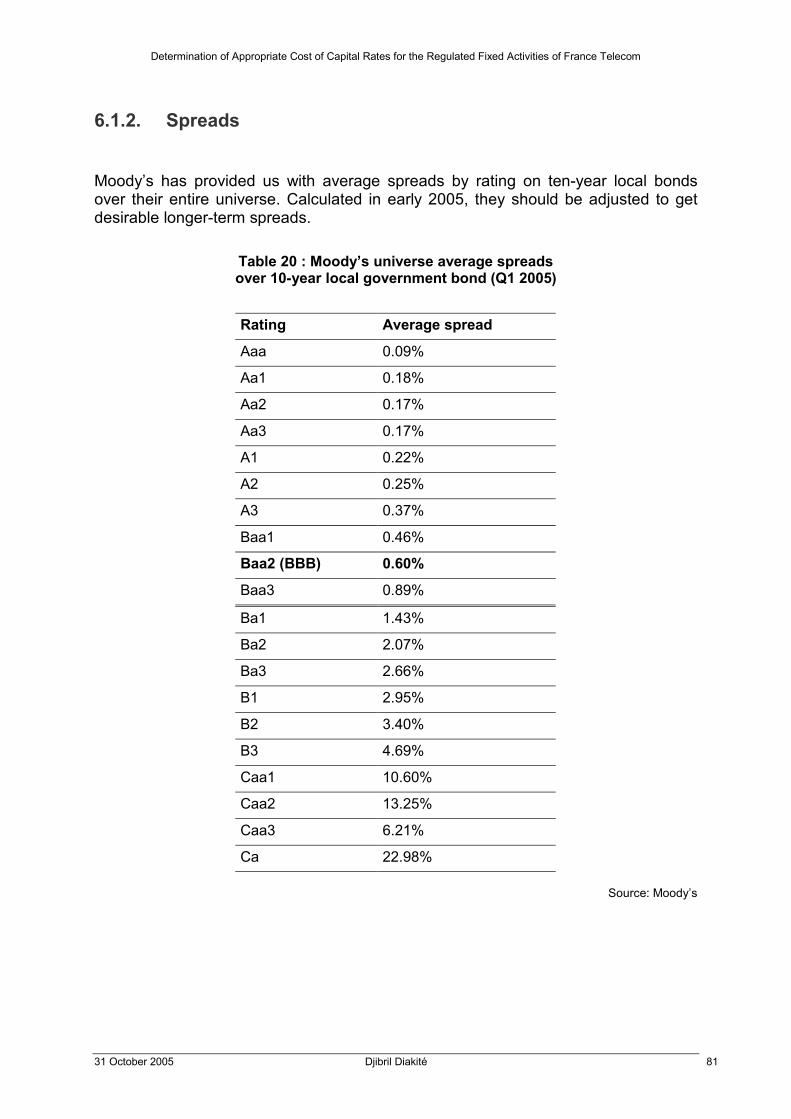
3.4. Rate
3.4.1. Average Spot Rates On this issue, opinions of consultants and regulators vary according to the time period. The volatility of judgement on that matter matches more or less the one attributed to the government bonds’ YTM. For instance, Nera asserts in its various reports that: “The latest data should be the market best estimate. While some regulators have used an average yield for a number of months there seems to be no rationale for doing so in what is a market with high liquidity unless there a specific technical factors which indicate that there may temporary mis-pricing”. “For this study NERA recommend that the risk free rate should be calculated as a 3-month average of recent bond price yields. This method captures the most recent information and views on inflation, while minimising the distortion that can be caused by any one day’s deviation in the rate”. “Because of the recent high level of volatility, we recommend that the estimate for the risk free rate is based on the 1-year arithmetic average of daily yields on German government bonds with maturity dates close to July 2004”. And as far as AMI is concerned: “If capital markets were perfectly efficient, current yields would reflect all expectations of future earnings and the appropriate measure of the risk free rate would clearly be the current yield. In practice, capital markets are not perfectly efficient. However, at any point in time, current yields will still reflect the best available information on future yields. Although risk free rates can be affected by institutional factors and be volatile in the short run, AMI therefore considers it appropriate to calculate a risk free rate based on recent bond market yields It is however recommended that this yield be calculated as a 6-month average of the latest yields, minimising any short-term fluctuations in rates while capturing the most up to date information and expectations”. It has to be said that, contrary to the above points of view, many regulators, including ARCEP in its latest estimation, do not average yields and rely on the last spot rate. JCRA, Jersey’ regulator, is one of them who explains its choice, here regarding the UK gilts in 2004: “We propose to use the latest available yield as the estimate of the risk free rate. The latest data points should be the markets best current estimate. While some regulators have used an average yield for a number of months there seems to be no rationale for doing so in what is a market with high liquidity unless there are specific technical factors which indicate that there may be temporary mis-pricing”.
Determination of Appropriate Cost of Capital Rates for the Regulated Fixed Activities of France Telecom
31 October 2005 Djibril Diakité 18
Figure 2: German government zero coupon bond with a January 2011 maturity:
Source: Bloomberg, 24 October 2005. Ticker: DBRS 0 01/04/11
Table 1 : Current and averaged yields on German government bonds
Maturity Current 90 days avg 180 days avg 1 yr avg January 2009 2.65% 2.46% 2.58% 2.67% January 2011 2.86% 2.76% 2.90% 3.01%
Source: Bloomberg, 24 October 2005
The (variation of) volatility attributed to government bond’s yields appears to be the main reason invoked by regulators to use averages. But in its September 2005 Bulletin, the European Central Bank writes: “Despite the recent swings in long-term interest rates, market participants’ uncertainty about short-term bond market developments –as indicated by implied bond market volatility- remained relatively low in the major [government] bond markets.”
Determination of Appropriate Cost of Capital Rates for the Regulated Fixed Activities of France Telecom
31 October 2005 Djibril Diakité 19
3.5. Conclusion In the light of this analysis, a risk free rate rounded up to 3%, matching the 12-month averaged 2011 yield to maturity (beyond regulatory period) is sufficiently conservative and avoids the instability caused by very short-run fluctuations.
Determination of Appropriate Cost of Capital Rates for the Regulated Fixed Activities of France Telecom
31 October 2005 Djibril Diakité 20
4. Equity Market Risk Premium
4.1. Historical Premia The most common approach to estimating the risk premia used in financial asset pricing models is to base it on historical data. The traditional historic approach considers the past as a reliable indicator of how the market will behave in the future. This is supported by a belief that investors’ expectations are influenced by the historic performance of the market and that future market conditions do not differ substantially from those in the past. More precisely, it implicitly assumes that: - the risk aversion of investors has not changed in a systematic way across time
(the risk aversion may change from year to year, but it reverts back to historical averages);
- the average riskiness of the ‘risky’ portfolio (stock index) has not changed in a systematic way across time.
Since the 80s, but with more intensity in the last few years, these assumptions have been challenged. Adjustments to the traditional historical EMRP are presented in section 4.1.3.
4.1.1. Estimation Issues Even with the traditional historical approach, there are large differences in the actual premia used in practice. These divergences follow from the choices made for the time period, the risk free asset and the averaging method. Time Period The rationale presented by those who use shorter periods is that the risk aversion of the average investor is likely to change over time and that using a shorter and more recent time period provides a more updated estimate. However, this has to be offset against a cost associated with using shorter time periods, which is the greater noise in the risk premium estimate. For instance, for the US market, given the annual standard deviation in stock prices
between 1928 and 2002 of 20%, the standard errors associated with the EMRP estimate can be estimated as follows for different periods of time:
Determination of Appropriate Cost of Capital Rates for the Regulated Fixed Activities of France Telecom
31 October 2005 Djibril Diakité 21
Estimation Period Standard Error of Risk Premium Estimate 5 years 20 / √5 = 8.94% 10 years 20 / √10 = 6.32% 25 years 20 / √25 = 4.00% 50 years 20 / √50 = 2.83%
Source: Damodaran, “Applied Corporate Finance” Damodaran adds: “Note that to get reasonable standard errors, we need very long time periods of historical returns. Conversely, the standard errors from ten-year and twenty-year estimates are likely to be almost as large or larger than the actual risk premium estimated. This cost of using shorter time periods seems, in our view, to overwhelm any advantages associated with getting a more updated premium”. Considering the example of the last twentieth century’s decade, Dimson Marsh Staunton (DMS) state in “Global evidence on the equity risk premium” (September 2002): “The need for a long-run perspective, and the dangers of focusing on recent stock market history, are easily demonstrated (…) In order to make inferences we thus need long time series that incorporate the bad times as well as the good (…) Investor’s judgement should be informed by the full extent of financial market history.” This view is widely shared among academics and practioners, but some have a slightly more wary approach to this issue. For instance, JCRA writes in February 2004: “The volatility of equity returns means that the error margins attached to ex post estimates are considerable depending on the length of sample used. While longer time series minimise the effect of this volatility, there is some evidence that the Equity Risk Premium has not been stable over time, and so more distant data points may not increase the accuracy of an estimate of the current EMRP”. Similarly, AMI explains: “If the risk premium is assumed to be constant over time, one may reduce the variance of the estimate by increasing the time period and hence the number of observations. On the other hand, if there has been a permanent shift in the size of the risk premium during the applied time period (meaning that the current market premium is different from the historical returns), too long a time period will bias the estimation by attaching equal weights to old and recent observations. Too short a time period may on the other hand place too much weight on single events and therefore result in misleading estimates of the “true” premium.”
Determination of Appropriate Cost of Capital Rates for the Regulated Fixed Activities of France Telecom
31 October 2005 Djibril Diakité 22
There is some truth in these last two remarks but they question actually the fundamental assumptions underlying the traditional historical approach. We tackle them later. If we want the best estimate of an historical EMRP, we believe that we should first try to reduce the standard error. This means that we should start this analysis with an EMRP estimated indeed over a very long period of time.
Arithmetic and Geometric Averages This issue is more sensitive. As in previous paragraphs, we quote a sample of opinions extracted from reports made for regulators, corporate finance books or economists’ research. Damodaran: “The arithmetic average return measures the simple mean of the series of annual returns, whereas the geometric average looks at the compounded returns. Conventional wisdom argues for the use of the arithmetic average. In fact, if annual returns are uncorrelated over time and our objectives were to estimate the risk premium for the next year, the arithmetic average is the best unbiased estimate of the premium. In reality, however, there are strong arguments that can be made for the use of geometric averages. First, empirical studies seem to indicate that returns on stocks are negatively correlated over time (in other words, good years are more likely to be followed by poor years and vice versa). The evidence on negative serial correlation in stock returns over time is extensive and can be found in Fama and French (1988). While they find that the one-year correlations are low, the five-year serial correlations are strongly negative for all size classes. Consequently, the arithmetic average return is likely to over state the premium. Second, while asset pricing models may be single period models, the use of these models to get expected returns over long periods (such as five or ten years) suggests that the single period may be much longer than a year. In this context, the argument for geometric average premiums becomes even stronger”
Determination of Appropriate Cost of Capital Rates for the Regulated Fixed Activities of France Telecom
31 October 2005 Djibril Diakité 23
AMI: “One of the most debated issues concerns the calculation of the historic mean. Two approaches have been proposed: the arithmetic mean and the so-called “geometric” mean (more correctly referred to as the “compounded” mean). As the arithmetic mean is typically around two percentage points higher than the geometric mean (according to both theoretical and empirical studies), depending on volatility and time period, it is worthwhile providing at least the intuition behind this theoretical controversy.
Arithmetic mean (or simple mean) where N is the number of years and rtj the annual return for asset j.
Geometric mean (or compounded mean) 6
If one is concerned with estimating the average annual return actually obtained over a longer time period, more than one year, one should clearly use a geometric mean, which takes account of the interest of interests. Earning 10% the first year and 20% the next year would correspond to earnings of, not 15%, but 14.9% two years in a row. The issue is somewhat subtler when trying to estimate the expected return for the next year on the basis of past observations. If returns were completely unpredictable (uncorrelated) from one year to the other, one might consider the past observations as possible outcomes with a certain probability attached to them, say 10% or 20% with 50/50 probability. In this case, the expected return should be calculated as 10% x 50% + 20% x 50% = 15%, corresponding to the arithmetic average. Therefore, the choice of approach therefore basically depends on one’s view regarding the predictability of returns over longer time periods and the distribution of these returns. The more unpredictable the return, the better the case for using the arithmetic average. The ultimate aim must be to derive an estimate of the arithmetic mean return, since this corresponds to the theoretical “true” expectation. But if the distribution and predictability of returns are ignored, the risk premium will be overestimated. Empirical research suggests that returns are neither fully predictable nor fully unpredictable – the longer the time period, the more predictable (correlated) the returns. In the view of AMI, it is not possible to recommend one approach strongly over the other. If returns were fully predictable, a geometric approach should be used. If they were fully unpredictable, the arithmetic mean should be used instead. As there is no consensus to rely on either, AMI recommends PTS to use a fair and pragmatic approach: Select an estimate somewhere in the middle between the standard arithmetic mean and the standard geometric mean.”
6 Minus one actually.
Determination of Appropriate Cost of Capital Rates for the Regulated Fixed Activities of France Telecom
31 October 2005 Djibril Diakité 24
One of the most extensive (and fairly technical) economic paper regarding the cost of capital with a regulatory perspective is “A Study into Certain Aspects of the Cost of Capital for Regulated Utilities in the U.K.” written by Wright, Mason, Miles (WM&M 2003): “So which to use? The discussion above shows that the relationship between geometric and arithmetic average returns: - will only be constant over time if volatility of returns is constant; - will only be constant across different return horizons if returns are unpredictable. Unfortunately, arguments have frequently been presented in the literature that neither of these conditions will hold. There is no doubt that the ultimate aim must be to derive an estimate of the arithmetic mean return, since, as noted above, this corresponds to the theoretically desirable “true" expectation. But if the above conditions do not hold, any presumption that, e.g., the arithmetic mean return has been stable over time must, logically imply that the geometric mean return has not been stable over time; and vice versa. There is no clear-cut empirical evidence, that we are aware of, that distinguishes between these two characterisations of the data; indeed, given the degree of uncertainty in historical averages, it would be surprising if there were. Eminent academic economists have come down on both side of the fence. Thus e.g., Campbell and his various co-authors typically assume lognormality, and hence stability of the mean log return and the geometric average, as implicitly, do Dimson et al. In contrast, eg, Fama and French have, in various papers, worked on the assumption that the arithmetic mean return is stable. Our (not very strong) preference would be to side with Campbell, since the assumption of lognormality of returns is consistent with the feature of financial returns that they cannot fall below -100%, but are unbounded in the opposite direction. But given the absence of a clear consensus on the best way to model the underlying properties of returns, the only clear-cut recommendation must be to deal consistently with the difference between the two averaging methods, to be precise in noting which estimate is being used in any context, and to be aware of the potentially significant differences between the two”7.
Koller et al in « Valuation »: “To estimate the mean (expectation) of any random variable, well-accepted statistical principles dictate that the arithmetic average is the best unbiased estimation” “Although there is disagreement in the academic community, the general consensus is that the aggregate stock market exhibit negative autocorrelation. In this case, the arithmetic mean is biased upward”.
7 In “Ofcom’s approach to risk in the assessment of the cost of capital” (February 2005), the British regulator quotes only this reference regarding the ‘arithmetic vs. geometric mean’ issue but failed in its exegesis. It wrote: ”WM&M provides a balanced discussion at the end of which the authors express a “weak” preference for using the arithmetic mean”.
Determination of Appropriate Cost of Capital Rates for the Regulated Fixed Activities of France Telecom
31 October 2005 Djibril Diakité 25
The link between the arithmetic and the geometric means is the following if the financial returns are assumed to be lognormal:
where E(R) is the expected return computed with the arithmetic mean, and E(r) the corresponding geometric mean. Considering the previously mentioned average historical market volatility of 20%, the last term becomes (20%)2 / 2= 2%, the usual difference between both means with historical data. In “Global evidence on the equity risk premium”, Dimson Marsh & Staunton (DMS) suggest using the historical annualised; i.e. geometric, mean (which still require some adjustments as explained later) and the current volatility. “To estimate the equity risk premium to use in discounting future cash flows, we need the expected future risk premium, i.e., the arithmetic mean of the possible premia that may occur (…) In looking to the future, let us assume that investors in each country expect the same annualized (geometric mean) risk premium as they have received in the past. If there were no volatility in future annual returns, the expected arithmetic risk premia would be equal to their (historical) geometric mean. On the other hand, if future volatility were equal to the long-term historical volatility, the expected risk premia would be equal to the historical arithmetic mean risk premia. However, the long-term historical standard deviation is a poor predictor of future volatility, especially since some sources of extreme volatility (such as hyperinflation) are unlikely to recur. We therefore need estimates of expected future risk premia that are conditional on current predictions for market volatility. While they recommend considering both means (with a “weak” preference for the geometric mean as confirmed by telephone by Robin Mason), WM&M seem to disagree with DMS approach consisting in using an updated volatility8. Eventually, we notice that giving equal weights to both means gives the same outcome if the current or the projected volatility is around √2 x 20%= 14%. For the last 12 months, this volatility is close or slightly below 10% in average in the Euro Stoxx index as shows the last column of the following table from ECB’s monthly bulletin.
8 Cf. first paragraph in Annexe: WM&M’s objection and DMS’ answer.
Determination of Appropriate Cost of Capital Rates for the Regulated Fixed Activities of France Telecom
31 October 2005 Djibril Diakité 26
Table 2 : Historical volatility in the Dow Jones Euro Stoxx economic sector indices
Source: Thomson Financial Datastream and ECB calculations9.
Following DMS’ approach, the prospective risk premium, i.e. the historical annualized figure converted into arithmetic mean, would currently exceed by σ2/2=0.5% the historical geometric mean in the Eurozone.
In summary: - It is generally accepted that the expected return E(R) is the arithmetic mean of possible returns (R) that may occur (DMS, WMM, Koller et al). The common assumption of lognormality of financial returns -they cannot fall below 100% but are unbounded in the opposite direction- implies, to a linear approximation, the following relationship between E(R) and the geometric mean G(R): E(R)≈G(R)+σ2(r)/2 where r are the log returns. - If returns are deemed unpredictable, the variance of X year log return is simply X times the variance of one year return and the change of time period has no impact: the historical arithmetic mean is the right measure. However, there is much evidence that there is some predictability of returns, more precisely negative autocorrelation of returns (‘good’ years followed by ‘bad’ years), especially at longer horizons: 5 and 10 year return variances are significantly lower than they would be in the random hypothesis. - Economists consider also that the last term σ2(r)/2 should be based, with some precautions, on current market volatility, rather than on the long-term historical standard deviation. In that case, this would entail an expected (arithmetic) EMRP much closer to the historical annualized mean, the difference being as close as 0.5% instead of 2% historically (A(R)-G(R)).
We believe that the expected EMRP should be closer to the historical geometric mean in our case. But we recognize that academics and practioners remain divided and we have chosen to give equal weights to both means as a compromise reflecting also the possible variety of investor’s points of view.
9 Remark: only the last column is relevant here (and not the volatility of one sector in particular such as the telecoms).
Determination of Appropriate Cost of Capital Rates for the Regulated Fixed Activities of France Telecom
31 October 2005 Djibril Diakité 27
Country Average We have debated the common methodological issues regarding historical EMRP. Another one arises in our case: which country should be considered, or rather, which average should be made between various countries’ historical EMRP estimates?10
In the case of BT, Ofcom writes: “The estimation of a World premium may offer advantages over a country specific premium. Firstly, a global risk premium utilises many more data points than any one country risk premium, enabling more robust estimation. Secondly, a global perspective to the EMRP avoids focusing on relatively successful markets such as the US or the UK that may have outperformed expectations over the last century or more. The choice between a domestic or world index depends upon the degree to which capital markets are integrated or segmented and how internationally diversified UK investors are i.e. the extent of the “home bias”. UK investors continue to exhibit a significant “home bias”, meaning that a UK premium may better reflect the expectations of domestic investors”. DMS in “Global evidence on the equity risk premium”: “Much of the cross-country variation in historical premia is attributable to country-specific historical events that will not recur. When making future projections, there is a strong case, particularly given the increasingly international nature of capital markets, for taking a global rather than a country-by-country approach to determining the prospective equity risk premium”. Like Ofcom, most EMRP analyses consider various estimates and end up with a narrow range or a single estimate since this is still desirable when settling a WACC rate. Our situation is different since the marginal investor in France Telecom is very international with a likely European prism. Spreads between arithmetic and geometric averages are usually around 2%. The range between historical EMRP from European countries, whether stemming from geometric or arithmetic means, can be much larger. This range is also larger than the differences between UK, US and world EMRP. In order to have a reasonably low number of data at the end of this EMRP assessment, we think it is more appropriate to compute a geographic average of historical EMRP, even if any average would be imperfect given the lack of aggregated data on France Telecom’s private investors (and their market portfolios). We make the following assumption: the portfolio of the likely marginal investor is made of the largest European stocks with a weighting matching their relative market capitalizations.
10 This question should actually be considered in all cases given the increased internationalisation of financial markets.
Determination of Appropriate Cost of Capital Rates for the Regulated Fixed Activities of France Telecom
31 October 2005 Djibril Diakité 28
FTSEurofirst 300 (E300) is in that respect one of the best known pan-European index. It is a free float market cap weighted index that measures the performance of Europe's largest 300 companies by market capitalization. We therefore consider the country weights in this index.
Table 3 : Country breakdown as at 31st may 2004
Source: ftse.com
The following table shows the adjusted country weights for the historical EMRP estimates available through either of the two sources used in the next paragraph.
.
Determination of Appropriate Cost of Capital Rates for the Regulated Fixed Activities of France Telecom
31 October 2005 Djibril Diakité 29
Table 4 : Adjusted weights for EMRP country averages
Country % E300 % with Ibbotson % with DMS
Austria 0,2% 0,2% n/a
Belgium 1,3% 1,3% 1,3%
Denmark 0,8% 0,8% 0,8%
Finland 1,7% n/a n/a
France 14,9% 14,9% 15,4%
Germany 10,5% 10,5% 10,9%
Greece 0,6% n/a n/a
Ireland 0,9% 0,9% 0,9%
Italy 5,7% 5,7% 5,8%
Netherlands 7,4% 7,4% 7,6%
Norway 0,7% n/a 0,7%
Spain 5,5% 5,5% 5,7%
Sweden 3,2% n/a 3,3%
Switzerland 10,5% 10,5% 10,8%
U.K. 35,8% 35,8% 36,9%
Total 100% 100% 100%
% E 300 100% 93.4% 97%
Determination of Appropriate Cost of Capital Rates for the Regulated Fixed Activities of France Telecom
31 October 2005 Djibril Diakité 30
4.1.2. Traditional Historical Risk Premia Two sources are often mentioned to assess historical EMRP: Ibbotson’s “(International) Risk Premia Report”, and more notably today, the “Global Investment Returns Yearbook“ by DMS/LBS/ABN AMRO. Ibbotson Associates Until recently, standard practice drew heavily on the United States, with most textbooks citing only the US experience. By far the most widely cited US source prior to the end of the technology bubble was Ibbotson Associates, whose equity premium history starts in 1926. We think that this source is now less interesting for the following reasons. - The international report delivers EMRP from 1970 at best. For longer period, only US figures are available: “In Ibbotson’s Stocks, Bonds, Bills and Inflation Yearbook Valuation Edition, the U.S. long- and short-horizon equity risk premia are estimated to be 7.2 and 8.6 percent respectively, using data spanning 1926-2004. The results presented here [4.9%] differ considerably from the 1926-2004 period. Ibbotson Associates recommends using the longest time period for which quality data is available to calculate risk premia. For this reason, we use the longest history available for each of the countries presented in this report”. - As a consequence, a detailed observation of the data shows that the resulting EMRP are very volatile from year-to-year in most cases. Beside, no standard deviations or standard errors are indicated. - Last but not least, Ibbotson does not deliver geometric means11.
11 Ibbotson Associates by e-mail: “We can offer you geometric mean through our analyzer program (along with data if you don't already have them) and you could calculate your own EMRP. Otherwise, we don't offer anything other than the arithmetic mean in our international equity risk premia report (100$). The cost for analyzer is $2,000 and the World Capital Markets data is $4,000”.
Determination of Appropriate Cost of Capital Rates for the Regulated Fixed Activities of France Telecom
31 October 2005 Djibril Diakité 31
Table 5 : Ibbotson’s long horizon12 EMRP (1970-2004)
Country EMRP in local currency
Australia 3.6%
Austria 4.6% (since 1972)
Belgium 6.7%
Canada 3.2%
Denmark n/a (short horizon: 9.3%)
France 5.8%
Germany 4.0%
Ireland 7.0% (since 1988)
Italy 3.8%
Japan 5.2%
Netherlands 6.1%
New Zealand 0.5% (since 1988)
Spain n/a (short horizon: 5.4% since 1976)
Switzerland 6.2%
U.K. 6.3%
U.S. 4.9%
Source: Ibbotson Associates 2005
The country average EMRP estimate along adjusted E300 weights is 5.76% with Ibbotson’s arithmetic means (like for France).
12 “The long-horizon equity risk premium utilizes the appropriate country’s long-term government bond income return as the riskless asset. The short-horizon equity risk premium utilizes the appropriate country’s cash equivalent rate as the riskless asset.”
Determination of Appropriate Cost of Capital Rates for the Regulated Fixed Activities of France Telecom
31 October 2005 Djibril Diakité 32
Dimson Marsh Staunton (DMS) LBS/AMRO
WM&M: “The advent of the LBS/ABN AMRO database has generated an abundance of new evidence on the common components.” “Historically one of the barriers to estimating cost of capital in an international context has been the lack of rigorous estimates of the MRP for many significant capital markets. However, the recent work of Dimson et al (2002) provides a much more solid foundation than previously existed.” PwC in the FSA report (2003): “The level of the global EMRP has been the centre of significant debate and the range of estimates is wide, varying greatly through time and between countries. Academic economists’ approach to the EMRP typically involves making deductions from long run historical data on equity and bond returns. In our view, recent work by DMS provides the best source of evidence on the level of the global EMRP.” Ofcom: “The recent work carried out by Dimson, Marsh and Staunton (“DMS”) is widely regarded as being one of the most authoritative sources of historical estimates. It addresses a number of methodological problems that earlier studies had largely failed to deal with13. These include the measurement of total returns over a relatively long time period, the inclusion of a large sample of countries and adjustments for survivorship bias.” PwC explains the issue with firm-level survivorship bias: “Many long-run equity indices have been constructed by compiling data on historical returns for firms which still exist today. Firms for which a long time-series of returns data is available have necessarily been more successful than the average firm which may at any time cease to exist. Therefore examining returns for firms which still exist provides an example of survivorship bias which will tend to exaggerate measured equity returns”.
13 In “Global evidence on the equity risk premium” (2002), DMS explain: “Unlike most previous long –term studies of global markets, all our investments returns include reinvested gross income as well as capital gains. Many early equity indices measure just capital gains, ignoring dividends, thereby introducing serious downward bias. Similarly, many early bond indices record just yields, ignoring price movements. Our database is thus more comprehensive and accurate than previous research, spans a longer period, and the common start date of 1900 aids international comparisons.” According to subsequent sections of the DMS’ note, these biases in index construction seem to concern rather Barclays Capital’s and CSFB’s studies in the UK than Ibbotson Associates’ estimates in the US.
Determination of Appropriate Cost of Capital Rates for the Regulated Fixed Activities of France Telecom
14 WM&M notes that: “In the case of Germany, in particular, equity returns were so volatile that, while it displayed a relatively poor performance in terms of geometric average returns, in terms of arithmetic average returns its performance appears relatively good. In this particular case, we would regard the relative ranking of geometric returns as more representative.” The world EMRP estimate is computed with GDP weights, from the perspective of a US investor. The home currency is thus US dollars, and the inflation rate is as for the United States.
Determination of Appropriate Cost of Capital Rates for the Regulated Fixed Activities of France Telecom
31 October 2005 Djibril Diakité 34
DMS add these comments about their findings: “Our estimates are lower than frequently quoted historical averages such as the Ibbotson Associates Yearbook figures for the United States, and the earlier Barclays Capital and CSFB studies for the United Kingdom. The differences arise from bias in previous index construction for the United Kingdom and, for both countries, from our use of a long time frame (1900–2004) that incorporates the earlier part of the twentieth century as well as the opening years of the new millennium. Our global focus also results in rather lower risk premia than hitherto assumed. Prior views have been heavily influenced by the experience of the United States, yet we find that the US risk premium is somewhat higher than the average for the other 16 countries in the Yearbook [3.8% including the US]”.
Using the same process as with Ibbotson’s data, we reach the following averages for EMRP estimates based on geometric and arithmetic means:
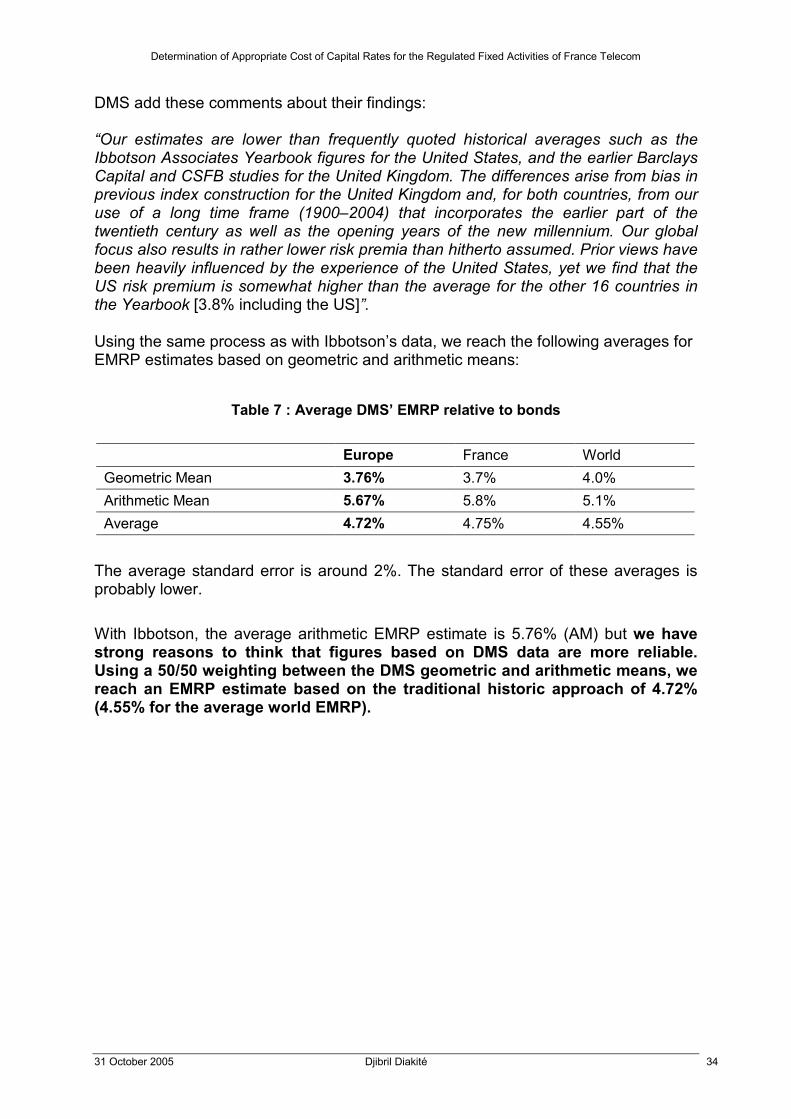
Table 7 : Average DMS’ EMRP relative to bonds
Europe France World Geometric Mean 3.76% 3.7% 4.0% Arithmetic Mean 5.67% 5.8% 5.1% Average 4.72% 4.75% 4.55%
The average standard error is around 2%. The standard error of these averages is probably lower. With Ibbotson, the average arithmetic EMRP estimate is 5.76% (AM) but we have strong reasons to think that figures based on DMS data are more reliable. Using a 50/50 weighting between the DMS geometric and arithmetic means, we reach an EMRP estimate based on the traditional historic approach of 4.72% (4.55% for the average world EMRP).
Determination of Appropriate Cost of Capital Rates for the Regulated Fixed Activities of France Telecom
31 October 2005 Djibril Diakité 35
4.1.3. Adjusted Historical Risk Premia For the last two decades but more acutely since DMS’ “Triumph of the optimists”, the assumptions underlying the traditional historical approach are more and more called into question. It is first important to revisit at this stage the difference between ex-post EMRP such as the one calculated in the previous section and ex-ante EMRP, the relevant EMRP for our WACC calculations. Ex-post vs Ex-ante In “The Equity Premium: why is it a puzzle?” (2003), Rajnish Mehra explains the difference between both concepts: “Two different interpretations of the term “equity premium” must be distinguished. One is the ex post or realized equity premium. This figure is the actual, historically observed difference between the return on the market, as captured by a stock index, and the risk-free rate, as proxied by the return on government bills. This premium is what Prescott and I addressed in our 1985 paper. The other (related) concept is the ex ante equity premium. This figure is a forward-looking measure of the premium— that is, the equity premium that is expected to prevail in the future or the conditional equity premium given the current state of the economy.” PwC (2003) illustrates the apparent paradox stemming from these definitions: “Suppose that the ex ante, forward-looking EMRP falls. This means that market participants regard future equity returns as less risky, and so discount those future cash flows at a lower discount rate, thereby increasing their value. In other words, a lower EMRP means a higher price of equities. At this higher price, the expected future return is lower, matching the lower required return. Suppose, however, we were now to carry out a historical analysis. Because equities have risen, the ex post measure of the EMRP will also have risen. So a fall in the forward-looking EMRP leads to a rise in the backward-looking EMRP.” Ogier et al explain that over the long-run both concepts should in theory match: what was actually achieved in the past should, in principle, reflect the additional returns required.
“If actual achieved returns were above those required, one would have expected equity investors to be attracted to invest more money in equities, driving up shares, and reducing returns. Similarly, lower than required returns would lead to less equity investment, driving up share prices down and returns up. Arbitrage should ensure that -in well functioning capital markets- required and achieved returns should be equivalent”. Mehra writes that “this relationship should not come as a surprise, because returns to stock have been documented to be mean reverting.” and maintains that ex-post EMRP could still be used for “very long investment horizons”.
Determination of Appropriate Cost of Capital Rates for the Regulated Fixed Activities of France Telecom
31 October 2005 Djibril Diakité 36
Issues with the Traditional Approach Most other economists have a different view on the subject and stressed in particular the bias introduced by 20th century data.
A first objection is that ex post historical experience is unlikely to have reflected investor expectations at the time and therefore does not provide an indication of the expected EMRP: Fama and French (JCRA’s quote): “Fama and French having compared actual returns against expected, calculated using the Gordon Growth’s model15, found that actual returns were considerably in excess of the expected returns” WM&M: “It is evident that even over quite long periods, realised returns need not provide any relation to the expected premium. If they did, the experience of the bull market of the 1990s would have implied a risk premium of equities over cash of around 15%, switching to a large negative risk premium in the subsequent bear market of the early years of the new millennium. This would be manifestly absurd. There is no evidence that rational investors were expecting to receive such returns in advance. A significant element in the returns they actually received was therefore almost certainly due to expectational errors. This problem can only be overcome, if at all, by assuming that, if a long enough period is chosen, pleasant mistakes in predicting returns, such as those of the 1990s, will be offset by unpleasant ones, as more recently. Unfortunately, it is quite possible that historic errors do not always so conveniently average out at zero.” DMS (Ofcom’s quote): “DMS have conjectured that the historic risk premia are likely to over-estimate the future EMRP, due to the market having outperformed the expectations of investors over the last century i.e. investors could not reasonably have expected to experience such prolonged periods of growth and economic stability, particularly in the US economy.” PwC: “The analysis of the statistical data provides supporting evidence for the thesis that market outturns were different from what the participants expected. It is striking that, although bonds are supposed to be a relatively safe investment (and indeed are, but only in nominal terms), the real returns on bonds have shown similar volatilities to equities. Thus the data show that equity investors were paid an additional 5% for bearing what turned out to be very little extra risk compared with bondholders. This large premium for a small risk suggests that outturns were not what market participants expected. 15 Cf. next section.
Determination of Appropriate Cost of Capital Rates for the Regulated Fixed Activities of France Telecom
31 October 2005 Djibril Diakité 37
There is a ready explanation for this: the 20th century was an inflationary century. Unexpected inflation reduces the real return to bond holders. Changes in the rate of inflation increase the variance of real bond returns. But inflation does not necessarily so much affect the returns on equity because profits, dividends and hence equity values all tend to rise with prices. Equities are a better hedge against inflation and in this limited sense are less risky than bonds. In the inflationary 20th century bonds produced a poorer return, and were riskier, than expected. Equities were relatively unscathed by inflation. So the ex-post MRP, which is the difference between equity and bond returns, was greater than expected.”
Table 8 : Annualized inflation 1900-2004
Source: DMS (ABN AMRO/LBS)
Arnott-Bernstein (from “A puzzle at the heart of equities”, FT, 19 March 2003): “Such performance could not have been predicted. Partly it was due to economic policy changes that led to the re-emergence of inflation after the Second World War, decreasing real bond returns but not those on equities. A second reason was the rise in equity values relative to dividends paid, particularly since the mid-1980s. This could not have been forecast at the beginning of the century. Third, the improvement in company regulation after the 1920s helped equity returns. If equity investors were simply lucky, rather than being compensated for additional risk, there is no reason, to expect the same equity premium in the future. »
Determination of Appropriate Cost of Capital Rates for the Regulated Fixed Activities of France Telecom
31 October 2005 Djibril Diakité 38
A second general (related) objection is that the future may not be like the past.
Ofcom: “There are a number of arguments to suggest that changes in the level of risk associated with the equity market may mean that the EMRP will be lower in the future than was the case in the past. These include the following: - Investor confidence has grown leading to a re-rating of equities. DMS observed a step upward change in price/earnings ratios. This means that either investors are expecting faster earnings/dividend growth than in the past and/or are requiring a lower risk premium. By taking into account current forecasts for earning/dividend growth, DMS were able to make a downward adjustment to the historic risk premium; - The risk premium is now associated with a portfolio that is less risky. The equity market is more diversified in terms of the breadth of companies and industries; - International diversification is now easier with lower transaction costs and cross border listings as well as companies themselves becoming more international.” Revisiting history in “Global evidence on the equity risk premium” and linking the two general objections, DMS make the case for going beyond raw historical estimates, beside the fact even a century of data remains imprecise: “We must take account of the fact that stock market outcomes are influenced by many factors, some of which (like removal of trade barriers) may be non-repeatable, which implies projections for the premium that deviate from the past.” “Most of the sixteen countries had lower mean premia in the first half century (…) The large risk premia achieved during the second half of the twentieth century are attributable to three factors. First, there was unprecedented growth in productivity and efficiency, accelerating technological change, and enhancements to the quality of management and corporate governance (…) Corporate cash flows grew faster than investors anticipated, and this higher growth is known to the market and built into higher stock prices. Second, stock prices have also risen because of a fall in the required rate of return due to diminished business and investment risk. Business risk diminished as the economic and political lessons of the twentieth century were learned, international trade flows increased, and the Cold War ended. Investment risk diminished over time as investors gained the benefits of diversification, both domestically (through a wider range of quoted securities and industries, and through intermediaries such as mutual funds), and internationally (with the disappearance of impediments to foreign investments). Diversification allows investors to lower their risk premium without detriment to expected return. Finally, transactions and monitoring costs are also lower now than a century ago. Factors such as these, which led to a reduction in the required risk premium, have contributed further to the upward re-rating of stock prices. To convert from a pure historical estimate of the risk premium into a forward-looking projection, we need to reverse-engineer the factors that drove up stock markets over the last 102 years.”
Determination of Appropriate Cost of Capital Rates for the Regulated Fixed Activities of France Telecom
31 October 2005 Djibril Diakité 39
Ogier et al add: “The last decades saw a substantial increase in pension fund and other long-term institutional investment in the market. All other things being equal, an increase in the supply of capital should lead to a reduction in the EMRP, the price of equity capital.” The Annexe gives some supplementary insights and contradictory opinions on the EMRP debate. In our view, the strongest arguments suggesting that ex-post EMRP estimates have an upwards bias are the following: - Investors could not reasonably have expected to receive such returns on
equity in advance (1). Conversely, because of the inflation in the 20th century, bonds produced poorer returns and were riskier than expected ex-ante (while equities were less affected). The size of the EMRP delivered by the traditional approach can not be justified by the additional risk16.
- Given the dividends growth, the observed change in valuation ratios is better explained by the fact that investors demand a lower risk premium (2).
The change in investors’ confidence indicates the failure of one or both of the assumptions introduced at the beginning of this section about historical premia. - Investors’ aversion to risk has changed; - and/or, the average riskiness of the ‘risky’ portfolio has changed (decreased). The latter seems also very plausible because this portfolio can be more diversified in terms of the breadth of companies, industries and countries; and because of improved regulatory and legal infrastructures to protect investors, improved market liquidity, etc.
Adjustments At this stage, after having recognized the failure of ex-post EMRP estimates to capture the expected EMRP, some suggest to balance these ‘flawed’ EMRP with ex-ante EMRP estimates derived from the current situation on the financial markets or investors’ surveys (addressed in the next sections). The initial view is increasingly shared by regulators but their EMRP analyses still rely heavily on traditional ex-post estimates. Instead of simply casting a shadow on any historical approach, we think we should consider adjustments suggested by DMS since “Triumph of the Optimists” (2001)17,and updated in their “Global Investment Returns Yearbooks”.
16 For instance, models of human behaviour that attempt to mirror the data must assume improbably large levels of risk aversion and prudence. 17 In the book “Triumph of the Optimists”, DMS explain that stock holders in the 20th century were lucky while in the paper “Irrational Optimism” quoted in the annexe, they state that the optimism of those who assume today that favourable equity returns can be relied on in the long term is irrational.
Determination of Appropriate Cost of Capital Rates for the Regulated Fixed Activities of France Telecom
31 October 2005 Djibril Diakité 40
Ofcom: “Simply extrapolating historic returns in order to estimate the future EMRP is a reasonable approach if the average risk premium achieved provides an unbiased estimate of today’s expected EMRP. It has been widely argued that this assumption may not be realistic.” “DMS adjust for this apparent outperformance of expectations by making a downward adjustment to historical premia. Ofcom’s view is that it is reasonable to give some weight to such an adjustment.” DMS:
“While our historical estimates of the risk premium [used in 5.2] are lower than those previously cited, we have argued in both “Triumph of the Optimists” and previous editions of the Yearbook that they are still too high as forecasts of the future. In particular, we have maintained that past returns have been advantaged by a re-rating due to a general decline in the risk faced by investors as the scope for diversification has increased. We have illustrated at least one approach that can be used to obtain an estimate of the amount by which the required rate of return has fallen (also see Dimson, Marsh and Staunton, 2003). In addition, we have argued that past returns have also been inflated by the impact of good luck. Since the middle of the last century, equity cash flows have almost certainly exceeded expectations. Stock markets have therefore risen for reasons that are unlikely to be repeated. This period was indeed the “Triumph of the Optimists”. This means that when developing forecasts for the future, investors should adjust historical risk premia downward for the impact of these factors. Our estimate of a plausible, forward-looking risk premium for the world’s major markets would be on the order of 3% relative to bills on a geometric mean basis, while the corresponding arithmetic mean risk premium would be around 5%. These are lower than the historical premia quoted in most textbooks or cited in surveys of finance academics. They nevertheless represent our best estimate of the equity risk premium for investment, asset allocation, valuation, and corporate capital budgeting applications.” PwC: “In projecting the prospective global EMRP, DMS make two suitable adjustments to the premia observed in historical data to take account of both the reasons cited above: (1) Adjustment for the difference between the observed premium and that which investors sought ex ante. This adjustment involves identifying any returns which are likely to have exceeded expectations. Expected growth is taken to be equal to the geometric average dividend growth from the start of the period (1900). This figure can be compared with actual dividend growth over the year to provide an indication of the excess returns investors enjoyed which they did not expect to be rewarded for (through the EMRP) ex ante.
Determination of Appropriate Cost of Capital Rates for the Regulated Fixed Activities of France Telecom
31 October 2005 Djibril Diakité 41
(2) Adjustment for the significant re-rating of equities that has occurred over the period. DMS note the average price/dividend ratio (i.e. the inverse of the dividend yield) has risen from 23 at the start of 1900 to 42 at the end of 2000. This rise implies that investors are either expecting faster growth of earnings and dividends than they have done in the past, are requiring a lower risk premium, or are just discounting future dividends at a lower rate. By taking account of current and average expected earnings growth rates, risk-free rates and retention rates it is possible to calculate the required adjustment to the average observed EMRP over the period. DMS estimate that this amounts to an excess return from re-rating of 0.6% per annum18.” More precisely, the first adjustment is calculated as follows: - Cash flows are proxied by equity dividends. - As it is commonly done today, the forecasted long run real dividend growth in year n is extrapolated from previous long-term real dividend growth, i.e. the annualized growth rate : (1+projected growth)n = Π (1+ Year i annual growth) with i going from 1900 to year n. - The difference between the projected dividend growth and the one actually observed is defined as (1+annual growth)/(1+projected growth) -1. - The unanticipated growth rates in dividends are then compounded together to produce an estimate of their annualized impact over the last century. Regarding the second adjustment, DMS write in “Global evidence on the equity risk premium”: “Undoubtedly, this change [in price/dividend] ratio is in part a reflection of expected future growth rate in real dividends, so we could in principle decompose the impact of this valuation change into both an element that reflects changes in required rates of return, and an element that reflects enhanced growth expectations. To keep things simple, we assume that the increase in the price/dividend ratio is attributable solely to a long-term fall in the required risk premium for equity investment.” This means that the second adjustment in the 2002 paper takes partially into account the first one, the separation of the two factors being difficult to implement. It is unclear whether this issue has been dealt with in subsequent works of DMS. This seems to be less a problem for Europe: «There are quite large differences in the relative importance of these factors between the United States and the United Kingdom (…) In the United States, the rapid growth of stock repurchases and the trend toward “disappearing dividends” makes it harder to disentangle these effects. The United Sates is the outlier among our sixteen countries. [In comparison], stock repurchases have been far less prevalent in other countries. In Europe, the United Kingdom has the highest level of buybacks, but even UK repurchases are small compared with the United States.”
18 Martin Weale of the UK’s National Institute of Economic and Social Research writes in its comments of the FSA report that the “re-rating of the market has delivered an excess return of about 0.5% p.a”.
Determination of Appropriate Cost of Capital Rates for the Regulated Fixed Activities of France Telecom
31 October 2005 Djibril Diakité 42
DMS have not presented adjusted EMRP relative to bonds in the latest LBS/ABN AMRO Yearbook. Nonetheless, it is reasonable to extrapolate their findings at their world level to the EMRP which are relevant for us through the bond premium (0.7% geometric, 1.1% arithmetic):
Table 9 : DMS’ 1900-2004 world EMRP relative to bills and bonds World EMRP Relative to bonds Relative to bills Prospective (adjusted)
relative to bills Geometric mean 4.0% 4.7% ≈ 3% (-1.7%) Arithmetic mean 5.1% 6.1% ≈ 5% (-1.1%)
Source: DMS (ABN AMRO/LBS 2005)
The world EMRP relative to bonds would be between 2.3% (geometric) and 4% (arithmetic). Using older figures (1900-2000) and considering both World and UK EMRP, Ofcom makes a 2% downwards adjustment. The simple average of the DMS adjustments is here -1.4%. In our case, we will reduce them: -0,9% as a cautious measure taking into account that there is no other source yet to our knowledge to estimate this necessary adjustment, for both criteria (1) and (2). The reduced adjustment is roughly equivalent to the consideration of only one of these two criteria. This leads to 3.8% as our best expected EMRP estimate based on historical data.
We see a priori no reason to consider the traditional figures except for intermediate calculation: their widely documented upward bias since in particular DMS works make them irrelevant in our opinion. Mehra Prescott calculated together in 1985 that equities should command only a 1% annual premium over riskless assets. At the end of 2002/beginning of 2003, Prescott has concluded that it is reasonable to treat the equity premium as if it were so close to zero as to be empirically negligible whereas Mehra has concluded that the puzzle requires some modification of the underlying theoretical model, on the assumption that there is a significant equity premium requiring explanation19. In his view, “in the absence of explanation and on the basis of what is currently known”, investors with long planning horizon should still rely on past EMRP. But Mehra failed to mention in his analysis of the EMRP ‘puzzle’ the concomitant works of DMS. His early 2003 conclusion appears questionable, rather bold than conservative. Nevertheless, one should note that applying the above discount on the DMS’ adjustment is equivalent to consider both the traditional EMRP estimate and the one based on the full DMS’ adjustment with respective weights of 1/3 and 2/3.Consistent with the principle set at the beginning of this report, we believe that, in the light of all this evidence, such an approach is sufficiently but not excessively conservative. 19 For instance, risk aversion models or US market survivorship fail to adequately explain the discrepancy.
Determination of Appropriate Cost of Capital Rates for the Regulated Fixed Activities of France Telecom
31 October 2005 Djibril Diakité 43
4.2. Implied Premia
4.2.1. Equation There are alternative ways to estimating risk premia that does not require historical data. A first one consists in calculating the EMRP implied by the current market levels and growth forecasts. A number of authors have inferred the desired EMRP from variants of the Dividend Discount Model. The value for a share is given by the net present value of the dividend stream using a discount rate which reflects the cost of equity. If it is assumed that dividends grow into the infinite future at a constant rate of growth, the following formula (Gordon 1962) can be easily derived: P0 = D1 / (R-G) P0 = Current market value D1 = Dividend in the Next period R= Expected return on equity = Rf + EMRP G= Dividend growth rate This can be arranged to give: ‘Implied’ EMRP = Dividend Yield Next Period + G – Rf Remarks: - The simplest form of the Dividend Discount Model, set out in the above equation, can be turned into an intuitively appealing identity, which states that total returns on equities are equal to the cost of equity: Total return on equity = Cost of equity Prospective dividend yield + expected growth of dividends = Rf + EMRP - This approach assumes the overall stock market to be correctly priced. But the equation is also used for other purpose, such as:
• deriving the expected rate of growth of dividends implied by current stock market values, on a reasonable range of assumptions about the EMRP;
• or, calculating the ‘fair value’ of shares which would deliver a long run expected rate of growth of dividends in line with the macro-economic profit forecasts.
- Some mention the DDM (also labelled dividend growth model) but use earnings
yields, i.e. the reverse of the P/E ratio, instead of the dividend yield. Since beginning 2004, the payout ratio –the percentage of earnings paid out to investors- has fluctuated between 45% and 60% in the Eurofirst 300 market index (source: Bloomberg). This approach naturally leads to higher implied EMRP estimates.
Determination of Appropriate Cost of Capital Rates for the Regulated Fixed Activities of France Telecom
31 October 2005 Djibril Diakité 44
4.2.2. Growth Rate Dividend Next Year ECB Monthly bulletin September 2005: “Although somewhat lower than for US corporations and for last year, analysts’ short-term earnings growth expectations for the companies listed in the Dow Jones EURO STOXX index have been rising steadily over the last three quarters, and the latest data suggest that a growth rate above 10% is expected over the next twelve months.”
Figure 4 : Expected growth in corporate earnings per share in the euro area
Source: Thomson Financial DataStream and ECB calculations20
The current dividend yield in the Eurofirst 300 Index is 3.10% (P/E=16.49 entailing a payout ratio of 60%). It is slightly above the DJ Euro Stoxx dividend yield (2.82%).
20 Expected earnings growth of the Dow Jones EURO STOXX index for the euro area and Standard & Poor’s 500 index for the United States. 1) Short-term refers to analysts’ earnings expectations twelve months ahead (annual growth rates). 2) Long-term refers to analysts’ earnings expectations three to five years ahead (annual growth rates).
Determination of Appropriate Cost of Capital Rates for the Regulated Fixed Activities of France Telecom
31 October 2005 Djibril Diakité 45
Figure 5 : FTSEurofirst 300
Source: Bloomberg, 25 October 2005
Assuming a similar growth rate of 10% and a constant payout ratio, we reach a dividend yield of 3.41% next year (with the current price). Using our estimate of 3% for the risk free rate, the implied EMRP becomes equal to 0.41%+G in our case.
Long Term Growth Rate Regarding G, the long term growth rate in dividends, - some like Damodaran use the risk free rate21;- others use directly their assessment of the future pace of the economy (GDP); - AMI suggests the long-term inflation rate - Nera proposes two scenarii: 2% and 4% (and take the mid-point).
21 In a footnote, Damodaran writes: “No company can grow at a rate higher than the long term nominal growth rate of the economy. The riskfree rate is a reasonable proxy for the long term nominal growth rate in the economy because it is composed of two components – the expected inflation rate and the expected real rate of return. The latter has to equate to real growth in the long term.” He suggests therefore taking the long term stable growth rate equal to the treasury bond rate because it is a good proxy for the growth rate in the economy.
Determination of Appropriate Cost of Capital Rates for the Regulated Fixed Activities of France Telecom
31 October 2005 Djibril Diakité 46
Professor Ian Cooper writes in the annexe of BT’s response to the Ofcom’s consultation that: “there is no consensus about what forecast to use, so the assumption is largely a matter of opinion”.
Depending on which of these features is applied to G, the implied EMRP appears between 2.5% and 3.5%.
Historical Data Regarding the dividend growth rate, DMS make the following remarks based on reappraised historical data. They are at odds with the conventional view that dividends grow in line with GDP: “Two observations, first revealed in Triumph of the Optimists, stand out. First, long-term dividend growth was below per capita GDP growth in all countries [even more in comparison with the simple GDP growth]. The assumption that profits, and hence dividends, represent a constant share of national income, and hence grow at the same rate, is not valid internationally. Dividend growth has lagged behind economic growth in all seventeen countries. Second, higher economic growth was not associated with higher real dividend growth; if anything, the relationship was perverse with a marked negative correlation. Lower growth economies experienced superior stock market performance, and vice versa. Statistically, we cannot reject the hypothesis that there is no association between economic growth and stock market performance”
Table 10 : Real dividend and GDP growth 1900-2004
Source: DMS (ABN AMRO/LBS)
Determination of Appropriate Cost of Capital Rates for the Regulated Fixed Activities of France Telecom
31 October 2005 Djibril Diakité 47
“Bernstein and Arnott (2003) note that, in stable nations, there is a two-percent dividend shortfall relative to GDP growth, noting that “ a roughly 2 percent net annual creation of new shares—the Two Percent Dilution—leads to a separation between long-term economic growth and long-term growth in dividends per share, earnings per share, and share price” (page 55). Ritter (2005) makes similar observations.” If we consider the narrower gap of 2% between GDP and dividend growth suggested by Bernstein and Arnott (compared to DMS data), the previously calculated long-term EMRP is probably overestimated. It should be around 1.5% (0.32%+3%-2%), maximum 2%, assuming a GDP growth up to 3%. This GDP growth is estimated to be 2% next year by Consensus Economics just for the Eurozone but we can assume/hope that the longer-term forecast, which is more relevant for the Gordon formula, is closer to 3% in Europe in general. The following graph shows the sum of dividend growth and dividend yield (larger than today as we have mentioned previously).
Figure 6 : Annualised dividend yield plus growth (compared to total returns), 1900-2004
Source: DMS (ABN AMRO/LBS) The ‘E300 average’ of the real dividend yield plus growth is here 3.90% with a long term perspective. Like for the market volatility (cf. DMS with the geometric/arithmetic mean issue), using historical data for the real risk free rate is not recommended because of one-sided inflation surprises over the twentieth century.
Determination of Appropriate Cost of Capital Rates for the Regulated Fixed Activities of France Telecom
31 October 2005 Djibril Diakité 48
PricewaterhouseCoopers, in its report for the UK’s Financial Services Authority (2003), writes: “We thus have to be extremely careful how we interpret the past. We believe that the most sensible approach to the provision of investment guidelines is to start with today’s risk-free rate, so in that sense, the past is irrelevant. What matters to today’s investor is what is on offer today, and it would be quite wrong to set up investment guidelines using a risk-free rate which is an average of rates over the past century. It would be wrong conceptually, because today’s rate is what is on offer to the investor. And it would deliver some very misleading numbers because the past risk-free rates have reflected some very high inflation rates that are considered unlikely to recur.” The following graph shows the French index-linked bond with a maturity consistent with the one set in the previous chapter (there is no German bond linked to inflation).
Figure 7 : Index-linked French government bond with a 2011 maturity
Source: Bloomberg, 24 October 2005
Considering the prevailing real risk free rate of 0.8%-1%, the Gordon formula leads in our case to a historical ‘DDM’ EMRP adjusted to current market conditions of around 3%.This is broadly in line with the adjusted historical EMRP with the full DMS adjustment estimated for the world market: 4.7%-1.4%=3.3%22.
22 Although this calculated historical ‘DDM’ EMRP does not factor in all the arguments for these adjustments (argument 2 but not 1: “investors could not reasonably have expected to receive such
Determination of Appropriate Cost of Capital Rates for the Regulated Fixed Activities of France Telecom
31 October 2005 Djibril Diakité 49
4.2.3. Two-Stage DDM It is possible to use more sophisticated multi-period DDM allowing for: - a growth period - a mature period, - and in between, a transition period for a three-stage DDM. They however require at least a growth estimate for the first period, and like any models, they are very sensitive to their assumptions. Results vary significantly according to this growth estimate (beside the long-term growth rate G) and the duration of the first (two) period(s). Let us consider for instance a two-stage model built like in the example developed in Damodaran’s “Applied Corporate Finance”: the growth period last for five years. Let us assume that, for the growth period, the earnings growth will be indeed close to 10% (cf. figure 4) and the payout ratio remains constant: the dividends grow as the earnings do. For its own modelling in the FSA report, PwC states: “The assumptions of constant payout ratios and reinvestment rate are not far from fact when we investigate the equity market because we are actually looking at an aggregate of many individual equities. Individual assets are subject to differing structures and degrees of uncertainty. For example, some may have constant payout ratios, others may not. However, when we aggregate across all equities, we reduce the impact of idiosyncrasies associated with the individual equities. Regarding G, Damodaran suggests taking it equal to the risk free rate but he specifically adds in the corresponding spreadsheet available online: “As a default, I will set this equal to the treasury bond rate. You can reset it to a lower number.” Our risk-free rate matches the assumed long-term GDP growth rate of around 3%. Given Bernstein and Arnott’s observations, we should rather take G=3%-2%=1%. The following calculations are based on G taken equal to 1.5%, a high case according to the previous remarks.
returns on equity in advance”). This could possibly suggest that the World DMS’ adjustment may undervalue the desirable adjustment in our specific case.
Determination of Appropriate Cost of Capital Rates for the Regulated Fixed Activities of France Telecom
31 October 2005 Djibril Diakité 50
As at 25th October 2005, the index level was 1041.77. The dividends for the next five year are computed as follows: 1041.77x 3.10% x (1+10%) = 35.52 1041.77x 3.10% x (1+10%)2 = 39.08 etc. To determinate R = Rf + EMRP, we need to solve the following equation where the last term is the discounted terminal value: 1041.77= 35.52/(1+R) °+ 39.08/(1+R)2 + ….+ 52.01 /(1+R)5
+ 52.01 x (1+G)/ (R-G)/(1+R)5
Using Excel Solver, we get EMRP = 2.85%. Taking the duration of the growth period constant, this result is naturally also sensitive to the assumption made for the short-term dividend growth and even more to G, although this figure should be less arbitrary.
Determination of Appropriate Cost of Capital Rates for the Regulated Fixed Activities of France Telecom
31 October 2005 Djibril Diakité 51
We have not built three-stage models but we believe that the difficulties to produce robust estimates become larger.
Bloomberg proposes an EMRP estimate based on such a model, re-assessed every day. As at 24th October 2005, it is estimated at 6.83% for the Eurozone. None of the equity analysts we have interviewed use it. We remark that such a high figure is based on G taken equal to the 10-year government bond’s YTM (3.2%). We have shown that this traditional rule of thumb is inappropriate and leads to a significant upward bias in the EMRP estimate.
Ofcom has not carried out its own calculations but quotes several studies. For the UK and the US, the results range between: - 2.6% to 3.5%: Fama French (US/2002) rolling two-stage DDM over several
decades. It is an historical EMRP23 which shows some similarity with the adjustment carried out by DMS.
- 4.1%: PwC (UK/2003) based on the market conditions prevailing in 2003. Regarding this higher value, Mr Martin Weale of the National Institute of Economic and Social Research writes in its comment of the PwC/FSA report: “The real growth rate of over 2% p.a. in dividends, needed to deliver the estimate of 4% p.a. seems very high; a historical context would be useful. If the capital-output ratio is constant over time, so that technical progress is only labour-saving, then it is difficult to see why there should be any real dividend growth, and I think in the past real dividends per share have grown more slowly than nominal GDP.” In the same context, David Miles (the second M of WM&M) makes a similar reproach: G is too high and this entails an EMRP estimate higher than what it should have been inferred: “Assuming that the future growth of dividends is likely to be equal to the future growth of GDP is making two strong assumptions. It is not merely assuming that the share of profits in GDP stays roughly constant, it is also assuming that the pool of dividends earned in the future accrues to the current crop of companies. But this really is not plausible since many companies that exist now will not exist 10 or 20 years from now. The relevant thing for investors is the growth of dividends of those companies that they currently invest in. This is almost certainly lower than the growth of aggregate GDP, assuming that the share of profits in GDP is roughly constant24.”
23 Before this estimation, Wadwhani’s (1999) empirical analysis led him to determine a value for the US EMRP of 1.7% with the DDM approach. In “Valuation”, Koller et al propose an alternative approach to Fama French by “focusing on all cash-flow available to equity holders. An argument for the inferred higher EMRP of 5% lies in the share buy-back phenomenon. This is anyway less relevant in Europe as indicated in 5.1.3. 24 Bernstein and Arnott also note that the growth of existing enterprises contributes only part of GDP growth. New enterprises contribute to economic growth, but have no direct impact on the profits and dividends of listed companies.
Determination of Appropriate Cost of Capital Rates for the Regulated Fixed Activities of France Telecom
31 October 2005 Djibril Diakité 52
“The long run rate of growth of real GDP in the UK has been slightly under 2.5 percent over the last 100 years. Real dividends are likely to grow slightly less than this, because what is relevant is the growth of dividends for those companies that currently exist, rather than the growth of aggregate dividends (some of which accrue to companies not yet in existence). If we adjust downwards the likely future growth of real GDP, by half a percent, we get a ballpark figure for the likely growth of real dividends on companies that currently exist. Adding this to a current dividend yield of around 3.5 percent generates an overall average rate of return on equities of 5.5 percent. Subtracting the 2 percent index bond yield would then give an equity risk premia of 3 ½ percent”. In summary, we have estimated actually two types of implied top-down EMRP: - one based on current data with a range of EMRP estimates of around 2%,
2.85% and a less relevant 6.93%; - one based on historical data with EMRP estimates around 3%. While it aims at capturing current market conditions, the first type shows a strong sensitivity to assumptions regarding in particular future dividend growth. We are also concerned by its inherent volatility. Damodaran notices that:
“They change over time much more than historical risk premia.” “There is a strong tendency towards mean reversion in financial markets. Given this tendency, it is possible that we can end up with a far better estimate of the implied equity premium by looking at not just the current premium, but also at historical data.”25
We will therefore put more weight on the historical evidence.
25 Damodaran adds: “A more rigorous approach would require relating implied equity risk premiums to fundamental macroeconomic data over the period. For instance, given that implied equity premiums tend to be higher during periods with higher inflation rates (and interest rates), we ran a regression of implied equity premiums against treasury bond rates and a term structure variable between 1960 and 2000: Implied Equity Premium = 1.87% + 0.2903 (T.Bond Rate) - 0.1162 (T.Bond – T.Bill) The regression has significant explanatory power … For those who would like to investigate further this matter.
Determination of Appropriate Cost of Capital Rates for the Regulated Fixed Activities of France Telecom
31 October 2005 Djibril Diakité 53
4.2.4. Bottom-up Models Bottom-up models typically work by projecting future company dividends, and then calculating the internal rate of return that sets the current market capitalization equal to the present value of future expected dividends. A similar approach (DCF) consists in solving the equation with on one side the enterprise value and on the other side the anticipated future free cash flow with the unknown discount factor. Some use this technique to derive a cost of capital rate for the firm. This is not recommended (even less so in a regulatory context). Koller et al in “Valuation”: “This calculation is rarely used because it is difficult to determine the market consensus for free cash-flows”. For the market’s cost of capital, applying this procedure to all companies in aggregate is more relevant. In the US, Merrill Lynch publishes ‘bottom up’ expected returns on S&P500. It uses a multi-stage DDM to calculate expected returns for several hundred companies, using projections made by its own securities analysts. Ogier et al (December 2004): “Merrill Lynch expected return estimates have indicated in recent years an EMRP in the region of 4% to 5%.” “There is [however] some evidence to suggest analysts’ forecasts of expected earnings or dividend growth may overstate outturn actual earnings or dividend growth. All other things equal, if there is an upward bias in analysts projections used in the bottom-up model then the implicit EMRP that is derived may also be on the high side”.26
26 In addition to the likely overestimation of G, the long term growth, as mentioned previously.
Determination of Appropriate Cost of Capital Rates for the Regulated Fixed Activities of France Telecom
31 October 2005 Djibril Diakité 54
In Europe, Associés en Finance carries out similar calculations:
Figure 8 : Associés en Finance’s bottom-up EMRP for France until 2001, then Eurozone
Source: Associés en Finance from Vernimmen.net
We could not get an updated estimate from this firm but the new authors of Vernimmen’s Corporate Finance gave us the following indications by e-mail: « La prime d'Associés en Finance est une prime prospective qui résulte de l'égalité entre le cours actuel de la société plus la valeur de ses dettes nettes et l'actualisation des flux de trésorerie disponible. » « Dans une perspective européenne historique, le niveau actuel EMRP (5,7 %) est élevé (la moyenne historique étant plus ou moins de 3%-4%). Mais le monde, après le 11 septembre 2001, est devenu plus risqué. » By definition, these implied premia are unstable. The historical average over 20 years seems to be rather around 4% if we put aside the last two years. Given the recent trend and Merrill Lynch figures, we think it is reasonable to consider on a prospective basis an average of 5% for this type of EMRP.
Determination of Appropriate Cost of Capital Rates for the Regulated Fixed Activities of France Telecom
31 October 2005 Djibril Diakité 55
4.3. Survey Premia
4.3.1. Fund Managers and Equity Analysts Since the premium is a weighted average of the premia demanded by investors, another approach to estimating this premium is to survey investors about their expectations for the future. An easily available survey is the one published every year by PwC, “What the City thinks the equity risk premium will be”. In its 2005 edition (issued in August), the consulting firm writes:
“Each year since 1998, PricewaterhouseCoopers has undertaken a survey of institutional investors’ views of equities’ likely outperformance. This year, 37 institutions were asked to give their estimates of returns on various asset classes; 20 responded. These 20 managers run about £605bn of UK pension scheme funds, comprising approximately 70% of this market. The managers’ views of the likely outperformance of UK, US and European equities are shown below.”
It is interesting to compare the range of results for the expected ERP in each of the markets, as shown in the graph below. Similar to last year the median expected outperformance for all three markets is very closely clustered around 3%. The range of results between the markets has been tightening over the last few years and might be interpreted as convergence of the perceived relative values of the markets.
Determination of Appropriate Cost of Capital Rates for the Regulated Fixed Activities of France Telecom
31 October 2005 Djibril Diakité 56
Figure 10 : PwC 2004 survey, “analysts’ estimates of the EMRP in different markets”
Tableau 11 : PwC 2004 survey, median and weighted mean estimates
EMRP UK US Europe Median 3.25% 3.0 % 3.13% Mean 3.0% 2.9% 3.1%
Source: PwC
These figures could suggest that the expected equity risk premium in the UK is closely in line with the ERP for the US and European markets. This is different from the previous year’s results when the expected UK ERP (3.3%) was 0.6% higher than expected US ERP(2.7%) and 0.3% higher than the expected ERP in European markets (3.0%).” The PwC Survey shows an averaged EMRP estimate of 3.1% for Europe. Some are reticent to surveys for the following reasons: - “There are no constraints on reasonability; individual money managers could
provide expected returns that are lower than the riskfree rate, for instance”. In the case of the PWC survey, the ‘maverick’ opinion of its 2004 edition (negative EMRP) has been discarded but one could still question the rationale for doing so.
Determination of Appropriate Cost of Capital Rates for the Regulated Fixed Activities of France Telecom
31 October 2005 Djibril Diakité 57
- “Survey premia are extremely volatile; the survey premia can change dramatically, largely as a function of recent market movements”. An examination of previous editions shows it is untrue in the case of the PwC surveys. According to the consulting firm, these expectations have remained reasonably stable for the past few years. In 2003, the mean for Europe was 2.72% with a standard deviation of 0.96. This reproach seems to be more justified for surveys among academics surrounding the financial bubble of the late 90s (cf. Welch surveys in the next section).
- We may also question how these figures have been estimated but this is of little relevance. The key thing is that they are used in the calculations of investors.
- A more sensitive reproach concerns a possible downward bias of fund managers.
Ogier et al:
“Pension fund managers tend to suggest low values [for the EMRP]. One can speculate that this is because their performance will be judged on the basis of the return they actually secure for their pensioners, and that they want to manage expectations down. Personal financial advisor, however, tend to quote higher figures. Are we being too cynical if we suggest that this is because they want to attract clients to invest?”27
We believe this is less an issue with equity analysts, especially nowadays. Contrary to beta for instance, EMRP is probably one their most interesting WACC parameters because it is usually calculated by their strategists/economists, it is pan-equity by definition so more thoroughly investigated, and it requires less frequent update in WACC calculations 28.Equity analysts surveyed in June 2005 gave the following answers about EMRP used for their own calculation:
27 The PwC’s Manager in charge of this survey declined any comment about this reproach made by a colleague from the same consulting firm. 28 The author of this report is a former equity analyst.
Determination of Appropriate Cost of Capital Rates for the Regulated Fixed Activities of France Telecom
31 October 2005 Djibril Diakité 58
Table 12 : EMRP survey of equity analysts
Morgan Stanley “We use 3% now as this is the one provided by our strategists but if you try to derive it from historical difference in returns between the market and risk free rates you may get as much as 5%. The point is that historical risk premiums might not be useful going forward.”
KBC “KBC uses the same risk premium for all its market stocks: 4%”
ING “Our economists are calculating a monthly market risk premium for Europe through EMRP (12 month forward earnings yield29 based on FTSEurofirst) and real bond yield. As of 13 May 2005, this Pan-European equity risk premium was 6.8% (a ten-year high). However, based on internal discussions, we are using a stable 4% equity risk premium as a better proxy of a long term stable risk premium based on the FTS Eurofirst 300.”
Goldman sachs 3.5%
Exane BNP Paribas “Risk premium of between 4% and 5%, although our strategist said it would be at the higher end of this range given how bond yields.”
Deustche Bank 2.3%
Arete Research 3.5% to 4%
ABN AMRO 4%
Analysts’ EMRP estimates vary between 2.3% and 5% with an average of 3.66%. We recognize that the sample is small but we tend to believe that this average captures correctly their opinion.
29 (Not dividend yield)
Determination of Appropriate Cost of Capital Rates for the Regulated Fixed Activities of France Telecom
31 October 2005 Djibril Diakité 59
4.3.2. Other Surveys from Ofcom’s Consultation In its first 2005 consultation paper, the British regulator lists other surveys. We notice that more recent figures tend to be lower in each category.
Source: Ofcom The regulator notes that: “The views of practitioners (fund managers and financial professionals) appear to be clustered in the range 2% to 4%. The views of academics appear to produce higher estimates, with a range from 3% to 7% [in 2001].” Welch actually interviewed academics in the US where historical EMRP have been proved to be somehow higher than in Europe and at a time when there was more inclination to the arithmetic average. In its summary of the EMRP chapter, Ofcom writes that “this evidence leads to a range of between 2% and 5%”, therefore dismissing the figures above 5% in the 2001 academic surveys.
Determination of Appropriate Cost of Capital Rates for the Regulated Fixed Activities of France Telecom
31 October 2005 Djibril Diakité 60
In “Picking Stocks: Profits from the Prophets?” John Nofsinger writes:
“Ivo Welch, a Yale University financial economist, administered the first survey in late 1997 and throughout 1998. Note that this survey was conducted after a long bull market was underway. The economists had seen some high market returns in the period just before taking the survey. Several behavioral biases should be noted.
The 226 financial economists that responded to the survey predicted an average annual market risk premium of 7.1%. They also predicted that the consensus among their colleagues would be 7.6%. Two points should be noted. First, for most economists, the prediction they made was near the consensus target they offered. This indicates that the economists used their belief about a consensus to anchor their own beliefs. Also, it is interesting to note that the economists liked to predict a risk premium that was different (albeit similar) to their consensus estimate. Why did they think that their estimate was better than the consensus of their peers? Believing your predictions are more accurate than others' is a characteristic of overconfidence.
Professor Welch surveyed his colleagues (and mine) again in 2001. This survey followed a severe stock market downturn. There were 510 economists that responded to the second survey. The average 30-year risk premium prediction in the second survey was 5.5%. Note how dramatically lower this estimate was compared to the 7.1% prediction in the first survey. It appears that the short-term upward trend in the stock market before the first survey made economists optimistic about the next 30 years, while the short-term downward trend before the second survey made them more pessimistic about the next 30 years.”
DMS in “Global evidence on the equity risk premium”,referring first to the 1998 Welch survey:
“Most respondents to the Welch survey would have regarded the Ibbotson Associates yearbook as the definitive study of the historical US risk premium (…) These survey and textbook figures represent what was being taught at the end of the 1990s in the world’s leading business schools and economics departments in the United States and around the world. As such, these estimates were also widely used by investors, finance professionals, corporate executives, regulators, lawyers and consultants (…) In August 2001, Welch updated his earlier survey (…) While it is possible that one-year required rates of return fluctuate markedly, it is unlikely that thirty-year expectations can be so volatile. The changing consensus may, however, reflect the new approaches to estimating the premium and/or new facts about the long-term stock market performance, such as evidence that other countries have typically had historical premia that were lower than the United States”
Determination of Appropriate Cost of Capital Rates for the Regulated Fixed Activities of France Telecom
31 October 2005 Djibril Diakité 61
The previous quote from Ogier et al continues as follows:
“Academics seem to respond with a wide range of different figures – probably because they hold different views on the various theories for calculating the EMRP, and do not necessarily need to justify their views, or take financial decisions dependent on them. Which leaves corporate organizations somewhere in the middle30. Their main vested interest in EMRP seems to be to get it right, so perhaps their views should be given the most weight.” Among the additional surveys from Ofcom’s consultation, we will put more weight on the Goldman Sachs 2002 and the Graham & Harvey 2003 surveys, respectively 3.9% and 3.8%, in spite of their lack of European prism and ‘freshness’ (the other ones are not better in that respect).
4.3.3. Regulators With European telecom regulators, we have obtained the following EMRP estimates:
Table 13 : European telecoms regulators’ EMRP
Country (Regulator)
EMRP estimate
Last update
Methodology
Denmark (NITA) 3.75% 2002 “National historical EMRP (however confirmed by European surveys), somewhere between geometric and arithmetic mean.”
Italy 4% 2001 n/a UK (Ofcom) 4.5% Aug 2005 Various UK and US evidences quoted in
this report. Sweden (PTS) 4.5% Dec 2003 “Using the highest estimates of DMS
and Damodaran”31 Spain (CMT) 4.5% May 2005 Historical and ex-ante. Belgium (BIPT) 4.69%32 2005 Between GM and AM France (Arcep) 5% Dec 2003 “Among a range of 4%-6% with ex-post
and ex-ante estimates” The Netherlands (OPTA)
6% June 2003 All evidences considered with a preference for the arithmetic mean as far as the historic approach is concerned. Gordon DDM premia with earning yield.
30 And equity analysts in our view. 31 We are not aware of Damodaran’s own EMRP estimate. In his books, he explains methodologies and quotes external sources such as Ibbotson and DMS. 32 The figure for BIPT has been extrapolated through the final WACC rate set by the regulator and other WACC parameters.
Determination of Appropriate Cost of Capital Rates for the Regulated Fixed Activities of France Telecom
31 October 2005 Djibril Diakité 62
The European telecom regulators’ EMRP estimates are clustered around 4.6%. We could consider that: - contrary to fund managers and equity analysts, regulators’ opinions have almost
no impact on investors’ expected EMRP; - ownership structures of European SMP operators differ and countries’ EMRP vary
as well: so should do EMRP estimates. But with the convergence of financial markets and their internationalisation, EMRP is a WACC parameter for which such a benchmark could be of interest, in theory. However, the concentration of EMRP estimates can be better explained by other factors: - a strong reliance on the US market evidence, especially EMRP based on
traditional historical arithmetic mean, which have been historically more abundant but also higher than most European EMRP estimates as DMS have demonstrated;
- peers mutual observation and concern about consistency between regulatory reviews, entailing in the end a certain inertia around higher levels.
This is typically the case with some regulators for which EMRP estimate seems to stem from a ‘satisfactory’ WACC rate rather than the contrary, even if another approach to the EMRP is deemed ‘technically correct’. Ofcom’s EMRP assessment is interesting because the decided value, 4.5%, coming initially from a suggested range of 4%-4.5%, is the result of recent and extensive research (though not exempt from reproaches, suggesting a 4% EMRP would have been more appropriate in its case). DMS’ table with historical (traditional) EMRP by country shows that except Germany, all other European countries have an EMRP lower than those of the UK and the US, the two countries essentially considered in its analysis: an EMRP estimate decided on the fashion of Ofcom would be in our case under its choice of 4.5% for BT, probably below 4% actually33.
Remark: In this EMRP analysis, we have not mentioned techniques based on regression analysis linking market variables, such as the aggregate dividend-to-price ratio, book-to-market ratio, or ratio of earnings to price, to project the EMRP. They usually ignore valuable information and studies such as the one of Ivo Welch (2005) have demonstrated that their predictability power is null.
33 Even more with a mere global perspective.
Determination of Appropriate Cost of Capital Rates for the Regulated Fixed Activities of France Telecom
31 October 2005 Djibril Diakité 63
4.4. Summary of EMRP evidence
DMS (2001): “Though some writers may give another impression, there is no single figure for the risk premium that theory says is `correct'.” This being said, as we have indicated in the introduction of this note, we prefer to suggest a point estimate than a range. In the next table, we have gathered the various EMRP estimates calculated or analysed in this chapter. For the transparency of the process, we have attached to them weights, naturally subjective, but consistent, we believe, with our qualitative appreciations34.
34 Except to some extent for the regulators’ survey.
Determination of Appropriate Cost of Capital Rates for the Regulated Fixed Activities of France Telecom
AM 4.77% 50% Reduced Adjustment (uniform -0,9%) GM 2.86% 50%
Compromise equivalent to weighted avg of A&B
Average historical EMRP 3.8% 40%
Implied Current top-down 1 st 2% 5% Volatility
2 st 2.85% 5% More sophisticated but sensitivity and volatility
PwC 2-DDM top-down 2 st 4.1% 5% G too high, UK
Bloomberg top-down 3 st 6.93% 5% Sensitivity and volatility, G too high, not used for WACC purposes
Average Bottom-up 3 st 5% 40% Upward bias?
Historical adj. top-down 1 st 3% 20% More stable
Fama French historical 2 st 3% 20% Reputation but US only
Average implied EMRP 4% 30%
Survey PwC/ Fund Managers 3.1% 10% Stable, downward bias?
Equity Analysts 3.66% 25% Neutral but small sample
GS02 Global, GH03 US companies
3.85% 25% Neutral but a bit old, lack of European perspective
Welch 2001 5% 10% Old, US, median 3-7%
European regulators 4.6% 30% European ‘average’ but data and methods often to upgrade, bias, not used by investors
Average survey EMRP 4% 30%
3.92%
Determination of Appropriate Cost of Capital Rates for the Regulated Fixed Activities of France Telecom
31 October 2005 Djibril Diakité 65
- For the historical premia, we have considered only the forward-looking adjusted EMRP of 3.8% with a reduced downward adjustment.
- For the implied premia, we have reached an average of 4% by taking into account essentially the long-term evidence and average bottom-up premia.
- For the survey premia, we have reached an average of 4% with a more balanced weighting between sources (though with more weight to previous regulatory decisions in spite of their likely bias).
These ERMP are naturally related. Forward-looking opinions presented in surveys reflect other premia, adjustments to the traditional historical approach are in part derived by reverse-engineering implied premia, etc. We remark that we have obtained similar results in each category in the way they have been split, but variations within each of them, especially the implied premia, are important. We adopt an ERMP rounded up to 4% after having strived to lower as much as possible the uncertainty in our case.
Determination of Appropriate Cost of Capital Rates for the Regulated Fixed Activities of France Telecom
31 October 2005 Djibril Diakité 66
5. Group Beta
For firms that are publicly traded, the standard procedure for estimating betas is to regress stock returns (Rj), including both dividends and price appreciation, against market returns (Rm) :
Rj = a + b Rm
Where a = Intercept from the regression b = Slope of the regression = Covariance (Rj, Rm) / σ2 (Rm)
The slope of the regression corresponds to the beta of the stock and measures the riskiness of the stock. Like any statistical estimate, this slope is made with noise whose level is revealed by the standard error of the beta estimate. It is usually used to arrive at confidence intervals for the ‘true’ beta value. For instance, a slope equal to 1 and a standard error equal to 0.20 imply that the ‘true’ beta could range from 0.8 to 1.2 with 67% confidence and from 0.6 to 1.4 with 95% confidence.
Determination of Appropriate Cost of Capital Rates for the Regulated Fixed Activities of France Telecom
31 October 2005 Djibril Diakité 67
5.1. Estimation Issues
5.1.1. Estimation Period and Frequency Although they are usually mentioned separately, we tackle these issues together because they are very closely related. Monthly measurements require at least 5 years of data (60 points) but even then, the standard error remains high: above 20% in general. The following graph shows France Telecom’s monthly beta calculated over 6 years and the associated standard error (0.41!). Even with such a long period, Bloomberg indicates that “the number of points may be insufficient to get an accurate beta”.
Figure 11 : BT Group’s standard error of 6-year monthly equity beta
Source: Bloomberg
Determination of Appropriate Cost of Capital Rates for the Regulated Fixed Activities of France Telecom
31 October 2005 Djibril Diakité 68
Another issue is that such a long period encompasses the TMT bubble (or at least its burst), i.e. an era when telecoms stock prices movements were dominated by company/sector specific events (affecting actually the whole market through their high valuation) unlikely to be representative on a prospective basis.
Figure 12 : Evolution of E300 and E3TELE indexes over the last six years
Source: Bloomberg
Several studies have shown that not only telecoms operators’ equity betas change significantly over time but their asset risk profiles as well, i.e. when the variations in financial leverage are removed. A true and constant relationship between the variables across the time-period of analysis is one of the fundamental assumptions behind the OLS regression. The next graph shows the evolution of BT’s asset beta over time as calculated by PwC in “Disaggregating BT’s Beta” (June 2005).
Determination of Appropriate Cost of Capital Rates for the Regulated Fixed Activities of France Telecom
31 October 2005 Djibril Diakité 69
Figure 13 : BT Group unadjusted asset beta over time
Source: PwC, June 2005
For telecoms operators, the problems entailed by long periods are severe. But they are not the only ones plaguing monthly betas. Various studies (Professor Ian Cooper regarding Vodaphone, WM&M, The Brattle Group etc.) have also shown that monthly equity betas vary significantly according to the starting day of the month:
Figure 14 : Variation of BT’s monthly equity beta, according to starting day
Source: The Brattle Group, February 2004
Determination of Appropriate Cost of Capital Rates for the Regulated Fixed Activities of France Telecom
31 October 2005 Djibril Diakité 70
All the above mentioned issues affect also weekly betas though logically to a lesser degree. Beta estimations based on daily returns allow greater statistical accuracy and shorter data windows. But they are more likely to be subject of statistical problems such as: - non synchronous trading bias: thin trade is unlikely to be an issue for a group as
large as France Telecom whereas thick trade could lead to an overestimate of beta. Statistical corrections such as the ‘Dimson adjustment’ to mitigate these effects are however rarely statistically significant.
- Serial correlation/heteroscedasticity: they can on their side affect the estimated standard errors but not the beta estimate itself 35.
The Brattle Group concluded its 2002 analysis on this issue in these terms: “The problems associated with monthly data are severe, while the problems generally associated with daily data appear relatively minor”. Like all detailed reports dealing with the issue of beta in the telecoms sectors, we opt for daily betas. Regarding the data window, periods as short as 6 months can be considered since they already provide a large number of points with a reasonable standard error. But one year of data is likely to give more accurate estimate. Beyond one year from today, another problem arises: the transition to IFRS.
In July 2002 the European Parliament adopted a regulation requiring all European Union companies to prepare their financial statements in conformity with International Financial Reporting Standards (IFRS) if their securities are traded on a regulated market within the EU. The regulation has to be applied as of the first period that begins on or after January 1, 2005 36.
Most operators have started to implement IFRS this year, typically with Q1 reports restating also 2004 figures. The impact of the transition to the new standard has been in general anticipated by the market since end 2004. For instance, France Telecom gave in December last year a conference explaining to analysts all the forecasted changes in its financial accounts.
35 We have not been able to carry out these tests which require raw data processing and perfect command of econometric software packages such as Stata. 36 However, Member States may defer mandatory application until the first period that begins on or after January 1, 2007 for companies that already use other internationally accepted standards and that are publicly traded outside of the EU. For instance, Telekom Austria, which is listed on the New York Stock Exchange and prepares its financial statements in accordance with US GAAP, is considering adopting IFRS later in 2006.
Determination of Appropriate Cost of Capital Rates for the Regulated Fixed Activities of France Telecom
31 October 2005 Djibril Diakité 71
The following table shows the discrepancies between net debts stated in 2004 annual reports and those restated according to IFRS in the following interim reports.
Tableau 15 : Net debts as stated in the last annual reports and restated in following interim reports
Source: Annual and interim reports
Since we aim at deriving an asset beta (stripped from the impact of the financial leverage), regressing an equity beta with a period overlapping this transition from local GAAP to IFRS would deliver a dubious asset beta. Even if /when figures for previous years are restated, one may question whether they were already anticipated by the market at that time. In the case of France Telecom, the impact is significant. We therefore opt for a daily beta calculated over 1 year.
AR 2004 Restated IFRS Difference %
Telekom Austria m€ IFRS compliant by 2006
TDC mDKK 20010 20146 +1%
France Télécom M m€ 43900 49800 +13%
Deutsche Telekom m€ 35200 39543 +12%
OTE m€ 2313,4 2310,3 0%
Telecom Italia m€ 29525 32862 +11%
KPN Telecom m€ 7446 7930 +7%
Portugal Telecom m€ 3123 3531 +13%
Telefónica m€ 20982,2 27141 +29%
TeliaSonera mSEK IFRS compliant 7062
British Telecom 31 march m£ 7786 7893 +1%
Swisscom mCHF IFRS compliant -2089
Telenor mNOK 18619 19195 +3%
Tele 2 mSEK 2793 2814 +2%
Eircom 31 march m€ 1922 2008 +4%
Belgacom m€ IFRS compliant -110
Determination of Appropriate Cost of Capital Rates for the Regulated Fixed Activities of France Telecom
31 October 2005 Djibril Diakité 72
5.1.2. Market index As discussed in chapter 2, the proxy for the market portfolio should reflect the assumed diversification of France Telecom’s marginal investor. We have chosen E300. S&P Europe 350 Index, BE 500 are other (more recent) pan-European indexes. DJ Eurostoxx (SXXE) is an index often mentioned by equity analysts like E300 but it measures the performance of equities in the Euro Bloc markets only (which means that firms like BT or TeliaSonera for instance are excluded from that index). In the table below, we have calculated for European integrated operators the differences between daily betas/E300 and daily betas/SXXE over one year. The simple average of 1.5 basis point is well under the average standard error of 0.10: at least for recent daily betas, the choice between European market indexes has almost no impact.
Table 16 : Daily raw betas/E300 minus daily betas/SXXE for European integrated operators
Determination of Appropriate Cost of Capital Rates for the Regulated Fixed Activities of France Telecom
31 October 2005 Djibril Diakité 73
The difference becomes usually more tangible when comparing with other types of indices: national or global. In the case of France Telecom, they almost always fall within standard error.
Table 17 : France Telecom’s daily raw equity beta vs. various indices
Raw Equity beta Local (CAC40)
Pan-European (FTSEurofirst 300)
World (MSCI World)37
Std Error E300
Daily 6 month 0.9 0.94 0.97 0.14
Daily 1 year 1.02 1.10 1.05 0.10
Daily 18 month* 1.08 1.20 1.19 0.07
Weekly 2 year 0.89 0.94 1.05 0.14
Weekly 3 year 0.58 0.69 0.61 0.19
Source: Bloomberg *maximum possible number of points We remark that the weekly betas which we believe to be less accurate are the lowest ones in this table. Given that France Telecom’s gearing steadily and sharply decreased during the time periods they cover, the corresponding asset betas would be even lower in proportion than those based on daily data. 18-month and 1-year daily betas would probably give close asset betas for the same reason. The 6-month asset beta would be maybe lower: the IFRS net debt decreased by 7% in H1 but the average D/E remained probably almost unchanged. The betas measured against CAC 40 produce the lowest results which could be explained to some extent by the international exposure of this group. For other operators, the situations may vary. Considering the split of nationalities in the local incumbent’s shareholding, some argue for a strong ‘home bias’ and deem acceptable to compute betas with the local market index, as long as the incumbent has a reasonably low weight in that index (because of the feedback effect). For UK regulated companies, WM&M’s ‘pragmatic’ suggestion consists in building a specific portfolio combining 50% FTSE All Share, 20% UK gilts, 10% overseas bonds and 20% FTSE global share index. We believe that in our situation the results would barely be affected by using, instead of E300, a customized portfolio built according to another estimate of France Telecom’s current free float (including for instance US shares). The Brattle Group which has carried out for Ofcom several beta estimations of BT considers separately the results with FTSE All Share (UK) and FTSE All World. In “Disaggregating BT’s Beta”, PwC carries out a world benchmark with both local indexes and MSCI World. In comparison with BT and other operators, the discrepancies between France Telecom’s betas are rather narrow.
37 MSCI World index (Bloomberg: MSDLWI) is a free-float adjusted market capitalization index designed to measure global developed market equity performance. It consists today of 23 developed market country indices.
Determination of Appropriate Cost of Capital Rates for the Regulated Fixed Activities of France Telecom
31 October 2005 Djibril Diakité 74
5.1.3. Bayesian Adjustment Ogier et al: “The rationale for the Bayesian adjustments is that regressions to estimate beta provide only one out of two potential sources of information about what the underlying beta might be. The second source of information is that the average firm in the market place has a beta of one.This statistical idea has been tested empirically by Marshall Blume who noticed that they are greater measurement error with betas of extreme values. Many data providers –for example, Bloomberg and Merrill Lynch- adjust betas using a formula based on Blume’s Bayesian adjustment. Both these providers weight the raw stock market beta by a factor of 0.67 and the market portfolio value (1.0) by 0.33. The Blume analysis is, however, quite outdated (much of the share price information relates to the period 1926 to 1961).” The general formula for the Bayesian adjustment is: Βadjusted =P x βOLS + (1-P) x 1 Where: - P= Var(βpop) / (Var(βpop)+ SE2(βOLS)) - SE2(βOLS) is the standard error squared of the OLS estimate of beta - and Var(βpop) is the variance of beta across the sample of firms for whom
average beta is unity. WM&M (2003): “For example, the variance of the estimated betas of the FTSE 100 companies reported in the June 2002 edition of the LBS Risk Management service was around 0.13. (This is the variance of the estimated betas which have already been adjusted towards unity because LBS use a Bayesian adjustment).” “The important point is that even though the unadjusted estimate of the daily beta is very far from unity, the Bayesian adjustment has relatively little impact since the variance of the estimate of the Vodafone Beta is based on daily data (0.132) is only around one eighth the size of the variability in betas across companies.” In our case, SE2(βOLS) is typically around 0.102 with daily betas. Using the (old) LBS figure for Var(βpop), we reach: βadjusted = 0.93 x βOLS +0.07 x 1. WM&M (2003):
“While such adjustments are correct in principle, in practice this may not make much difference if daily data are used because the resulting estimates of beta are typically very precise. With monthly data the Bayesian adjustment is likely to be more significant.”
Determination of Appropriate Cost of Capital Rates for the Regulated Fixed Activities of France Telecom
31 October 2005 Djibril Diakité 75
The Bayesian adjustment is not appropriate with the amplitude calculated by Blume some time ago. As a compromise, given that Var(βpop) is indeterminate for E300 today, we will use a Bayesian adjustment consisting in taking the mid point between the raw beta and the Blume/Bloomberg adjusted beta. This gives eventually an adjusted equity beta of 1.08 instead of 1.10.
5.2. Asset Beta
5.2.1. Unlevering Formula
We have noticed that recent publicly available reports (PwC, Brattle, Nera, Ofcom) and financial textbooks (Ogier et al, Koller et al Vernimmen, etc.) use now this simple unlevering formula for the standard WACC approach:
βasset= (1-g).βequity+ g.βdebt
With the assumption βdebt=0, it becomes βasset = βequity /(1+D/E).
Some still use the Hamada formula: βasset = βequity/(1+(1-t).D/E).
According to Ogier et al, this traditional formula should rather be used with the Modigliani Miller WACC in conjunction with one another: MM WACC = Kasset (1-t.g)
where Kasset is the unlevered cost of equity. It does not include the cost of debt as, in the simplified 1958 MM theory, the capital structure does not have any effect on the value of the business, therefore on the WACC. This unlevering formula which incorporates a tax term should not be applied in circumstances where debt is free to vary.
Given that the target D/E ratio set in the next chapter is very close to the current one, the impact of choosing one formula instead of another is close to zero38.
5.2.2. Debt to Equity Ratio Issues regarding the debt to equity ratio are usually overlooked when unlevering equity betas. If for some of them, the level of granularity remains lower than the level of uncertainty surrounding the true equity beta, we prefer to clearly state the simplifications or assumptions we have made.
38 The same applies here to the assumption βdebt=0 instead of 0.1 like some do.
Determination of Appropriate Cost of Capital Rates for the Regulated Fixed Activities of France Telecom
31 October 2005 Djibril Diakité 76
Adjustment for Cash Damodaran: “Investments in cash and marketable securities have betas close to zero. Consequently, the unlevered beta that we obtain for a business by looking at comparable firms may be affected by the cash holdings of these firms. Unlevered Beta corrected for Cash = Unlevered Beta / (1 - Cash/ Firm Value) Many analysts in Europe prefer to subtract the cash from the gross debt to arrive at a net debt figure. This unlevered beta is already corrected for cash and no further adjustments are needed. [This approach] assumes that both debt and cash are riskless and that the tax benefit from debt is exactly offset by the tax paid on interest earned on cash. It is generally not a good idea to net debt if the debt is very risky or if the interest rate earned on cash is substantially lower than the interest rate paid on debt. In general, using net debt ratios will overstate the value of riskier firms.” We believe that for our sample of investment grade firms, the ‘net debt’ simplification described by Damodaran has almost no impact. Like equity analysts in Europe (and most in the US, actually) as well as other meticulous reports dealing with asset betas for regulators, we will use directly the net debt instead of implementing the double adjustment.
Operating Leases and Other Fixed Commitments Damodaran: “The essential characteristic of debt is that it gives rise to a tax-deductible obligation that firms have to meet in both good times and bad and the failure to meet this obligation can result in bankruptcy or loss of equity control over the firm. If we use this definition of debt, it is quite clear that what we see reported on the balance sheet as debt may not reflect the true borrowings of the firm. In particular, a firm that leases substantial assets and categorizes them as operating leases owes substantially more than is reported in the financial statements.”
In an operating lease, the lessor (or owner) transfers only the right to use the property to the lessee. At the end of the lease period, the lessee returns the property to the lessor. Since the lessee does not assume the risk of ownership, the lease expense is treated as an operating expense in the income statement and the lease does not affect the balance sheet. In a capital lease, the lessee assumes some of the risks of ownership and enjoys some of the benefits. Consequently, the lease, when signed, is recognized both as an asset and as a liability (for the lease payments) on the balance sheet. A firm that signs a lease commits to making the lease payment in future periods and risks the loss of assets if it fails to make the commitment. The operating lease commitments in future years should be discounted back at a rate that reflects their status as unsecured and fairly risky debt. As an approximation, using the firm’s current pre-tax cost of borrowing as the discount rate yields a good estimate of the value of operating leases.”
Determination of Appropriate Cost of Capital Rates for the Regulated Fixed Activities of France Telecom
31 October 2005 Djibril Diakité 77
Koller et al are also clear on that matter in “Valuation”: the net debt to consider is the reported debt plus the present value of operating leases less excess cash. Brealey Myers: “When a firms obtains off-balance sheet financing, the conventional measures of financial leverage, such as debt-to-equity-ratio, understate the true degree of financial leverage. Some believe that financial analysts do not always notice off-balance sheet lease obligations (which are still referred to in footnotes) or the greater volatility of earnings that results from the fixed lease payments. They may be right, but we would not expect such an imperfection to be widespread”. For France Telecom, the off-balance sheet commitments can be found pages 204 to 213 of the 2004 Financial report (not the annual report). They represent around a quarter of its ‘official’ net debt.
We have decided to adopt a conservative position on this issue, taking into account only operating leases that clearly do not qualify as financial leases (which are supposed to be fully integrated in the new IFRS net debt). Regarding item b), we had a doubt and we simply did not take it into account.39
Using average maturities for each sub-group of operating leases and a (pre-tax) discount rate of 4%, we reach the following net present value for a)+b): 2502+2699/(1+4%)^2+1936/(1+4%)^4+2274/(1+4%)^7=8121 M€ (instead of 9411) For other operators considered in chapter 8, we apply a similar process, using in some cases different maturities when presentations differ or a different discount rate (typically 5% for BT given the higher UK gilt yields). When there was a doubt about whether some items should be classified as (non-cancellable) operating leases, we simply did not take them into account: these calculations probably understate the off-balance sheet commitments40 that should be added to net debt in consistence with the costs and assets considered in the LRIC model.
40 Some analysts add commitments related to workforce reduction or pension liabilities to the net debt. We do not do it for France Telecom nor for other operators considered in chapter 8 although this adjustment should probably be carried out for some of them
Determination of Appropriate Cost of Capital Rates for the Regulated Fixed Activities of France Telecom
31 October 2005 Djibril Diakité 78
Average D/E ratio We have noticed that D/E ratios used to unlever equity betas are not consistent in most reports with the time period of the betas estimation. To unlever the betas, we we need average D/E ratios, and not simply the last ones. For the 1-year beta (26 October 2004-25 October 2005), we consider: - the (restated) end 2004 ‘official’ net debt: 49800 M€ - and the H1 2005 ‘official’ net debt: 46300M€ We add to both the previously estimated operating leases (this information is updated only on a yearly basis). Early October, France Telecom has closed a EUR2 billion bond offering. This transaction forms part of the financing of the acquisition of 80% of the Spanish mobile operator Amena. We do not integrate this debt increase because this information concerns only the last four weeks of the considered period. For equity, we make a simplification consisting in applying respectively the market capitalization prevailing at the end of 2004 and the current one (although H1 financial statements were released end July). The recent capital increase through BSA has allowed for the creation of a maximum of 5.2% additional shares. We choose here also not to take this recent information into account. These simplifications have probably very little impact. The estimated average D/E ratio for France Telecom for the last 12 month is 93.9% (resp. 80% without operating leases) and the gearing D/D+E 48.4% (resp. 44.4%).
5.2.3. France Telecom’s Asset Beta
France Telecom’s group asset beta is estimated at 0.56 (0.60 without operating leases). The equivalent asset beta with the traditional unlevering formula with 1-tax is 0.66 (0.71 without operating leases).
Determination of Appropriate Cost of Capital Rates for the Regulated Fixed Activities of France Telecom
31 October 2005 Djibril Diakité 79
6. Cost of Debt and Capital Structure
6.1. Ratings and Spreads
6.1.1. Ratings The following table indicates the usual correspondence between ratings attributed by the two best known credit rating agencies: Moody’s and Standard and Poor’s41.
Table 18 : Moody’s and S&P ratings
Moody's S&P Definitions
Aaa AAA Prime. Maximum Safety
Aa1 AA+ High Grade High Quality
Aa2 AA
Aa3 AA-
A1 A+ Upper Medium Grade
A2 A
A3 A-
Baa1 BBB+ Lower Medium Grade
Baa2 BBB
Baa3 BBB-
Ba1 BB+ Non Investment Grade
Ba2 BB Speculative
Ba3 BB-
B1 B+ Highly Speculative
B2 B
B3 B-
Caa1 CCC+ Substantial Risk
Caa2 CCC In Poor Standing
Caa3 CCC-
Ca - Extremely Speculative
C - May be in Default
Source: Bondsonline.com
41 Fitch uses the same scale as S&P.
Determination of Appropriate Cost of Capital Rates for the Regulated Fixed Activities of France Telecom
31 October 2005 Djibril Diakité 80
The most important distinction is between investment grade and non-investment grade firms. Some institutional investors, such as pension funds, are constrained from holding bonds with below-investment grade ratings. A bond rating below investment grade may also trigger significant losses in revenues and increases in expenses. All European telecoms companies are investment-grade:
Table 19 : European telecoms operators’ ratings
Moody’s Outlook S&P Outlook
Telekom Austria A3 positive BBB+ stable
TDC Baa1 negative BBB+ stable
France Télécom A3 positive A- positive
Deutsche Telekom A3 stable A- stable
OTE A3 stable BBB+ negative
Telecom Italia Baa2 stable BBB+ stable
KPN Telecom Baa1 stable A- stable
Portugal Telecom A3 stable A- stable
Telefónica A3 stable A negative
TeliaSonera A2 stable A negative
British Telecom A- negative
Swisscom no rating
Telenor A2 stable A- stable
Tele 2 no rating
Eircom no rating
Belgacom Aa2 stable A+ stable
Source: Bloomberg, July 13 2005
Determination of Appropriate Cost of Capital Rates for the Regulated Fixed Activities of France Telecom
31 October 2005 Djibril Diakité 81
6.1.2. Spreads
Moody’s has provided us with average spreads by rating on ten-year local bonds over their entire universe. Calculated in early 2005, they should be adjusted to get desirable longer-term spreads.
Table 20 : Moody’s universe average spreads over 10-year local government bond (Q1 2005)
Rating Average spread
Aaa 0.09%
Aa1 0.18%
Aa2 0.17%
Aa3 0.17%
A1 0.22%
A2 0.25%
A3 0.37%
Baa1 0.46%
Baa2 (BBB) 0.60%
Baa3 0.89%
Ba1 1.43%
Ba2 2.07%
Ba3 2.66%
B1 2.95%
B2 3.40%
B3 4.69%
Caa1 10.60%
Caa2 13.25%
Caa3 6.21%
Ca 22.98%
Source: Moody’s
Determination of Appropriate Cost of Capital Rates for the Regulated Fixed Activities of France Telecom
31 October 2005 Djibril Diakité 82
Evolution since 1996 Looking at the evolution of the last ten year, spreads on BBB-rated non financial corporate bonds have increased significantly between mid 1999 and end 2003. Peaks correspond to the events of September 11 2001 and the subsequent (US) air carriers’ difficulties, then to the crisis of confidence triggered by the collapse of Enron and WorldCom (off-balance sheet issues).
Figure 15 : Evolution of non-financial BBB rated corporate bond spreads (Eurozone)
Source: Merrill Lynch, Moody’s KMV and ECB calculations In 2004, spreads on these BBB-rated non financial corporate bonds came back to pre-1999 levels around 60 basis points.
Recent trends In the first quarter of 2005, spread have increased sharply because of serious concerns around GM, Ford and US automotive suppliers such as Delphi and Visteon. They have been suddenly but belatedly downgraded to speculative grades. Spreads have then fluctuated again around lower levels.
Determination of Appropriate Cost of Capital Rates for the Regulated Fixed Activities of France Telecom
31 October 2005 Djibril Diakité 83
Figure 16 : Recent evolution of BBB rated corporate bond spreads (Eurozone)
Source: Merrill Lynch, Bloomberg and ECB calculations
According to the above graph, the peak's level at 145 basis points in the first quarter of 2005 corresponds to the overall BBB index average since 1999.
The European Central Bank explains in its June 2005 Bulletin: “After reaching very low levels by historical standards in early 2005, corporate bond spreads across the globe have increased sharply over the past few months. Thus, by late May, BBB corporate bond spreads in the euro area stood at levels not observed since mid-2003.” “The rise in corporate bond spreads in recent months has not been isolated to the BBB-rated segment (although in terms of percentage changes it showed the largest increase).”
Determination of Appropriate Cost of Capital Rates for the Regulated Fixed Activities of France Telecom
31 October 2005 Djibril Diakité 84
Introduced in the mid 90s, credit derivatives allow a disconnection between an asset or a liability’s credit risk management and the actual holding of this asset or liability. Credit derivatives spreads are usually a little bit lower than the corresponding spreads and their evolution are approximately parallel. An observation of average credit derivatives spreads for US telecoms shows just a little upward trend in the first half of 2005. Although the sources of this volatility are located in the US, local operators seem to have been relatively spared. This is probably due to the fact that their ratings are in average above BBB like their European counterparts (we have been unfortunately unable to observe directly the evolution of their spreads).
Figure 17 : Evolution of US telecom operators’ CDS 5-year premia
Source : Morgan Stanley Fixed Income Research US Credit, June 2005
Determination of Appropriate Cost of Capital Rates for the Regulated Fixed Activities of France Telecom
31 October 2005 Djibril Diakité 85
6.1.3. Adjustments As already mentioned, France Telecom has closed on October 5th 2005 a Euro 2bn bond offering in two tranches: Currency Format Term Notional Coupon Re-offer spread
Euro Fixed-rate 1-year 1 billion 3 % 27 bp
Euro Fixed-rate 10-year 1 billion 3.625 % 49 bp
”In this way, the Group has financed a strategic operation capitalizing on particularly attractive interest rates. This will be France Telecom's only benchmark Euro issue for 2005” This gives a clear indication of the current cost of (long-term) debt financing for France Telecom: Rf+0.49%. Given the considerations of the previous section, multiplying all Moody’s early 2005 spreads by 145/ 60=2.4 i.e. the 1999-2005 BBB average level/BBB early 2005 spread would be probably an excessive adjustment: - The 1999-2005 period went through extreme turbulences rather unlikely to
occur with the same magnitudes over the next regulatory period. - Higher investment grade firms such as telecoms operators appear to have
been less affected. But we recognize that the recent evolutions call for caution and we suggest a x2 adjustment. With the current rating of France Telecom, this would entail a spread of 75 bp, still 25bp above the current one
Determination of Appropriate Cost of Capital Rates for the Regulated Fixed Activities of France Telecom
31 October 2005 Djibril Diakité 86
Table 21 : Adjusted long-term spreads by rating
Moody’s Rating
Spreads Early 2005
Adjusted (x 2.4)
S&P equivalent
Aaa 0.09% 0.18% AAA
Aa1 0.18% 0.36% AA+
Aa2 0.17% 0.34% AA
Aa3 0.17% 0.34% AA-
A1 0.22% 0.44% A+
A2 0.25% 0.50% A
A3 0.37% 0.74% A-
Baa1 0.46% 0.92% BBB+
Baa2 0.60% 1.20% BBB
Baa3 0.89% 1.78% BBB-
Ba1 1.43% 2.86% BB+
Ba2 2.07% 4.14% BB
Ba3 2.66% 5.32% BB-
B1 2.95% 5.90% B+
B2 3.40% 6.80% B
B3 4.69% 9.38% B-
Caa1 10.60% 21.20% CCC+
Caa2 13.25% 26.50% CCC
Caa3 6.21% 12.42% CCC-
Ca 22.98% 45.96% -
Determination of Appropriate Cost of Capital Rates for the Regulated Fixed Activities of France Telecom
31 October 2005 Djibril Diakité 87
6.2. Target Structure
6.2.1. Optimal Gearing Equity shareholders demand a risk premium that is usually higher than the margin debt holder. When a firm increases its reliance on debt finance, - both debt and equity (debt has a priority claim) become more risky, and hence the costs of both debt (financial distress costs, agency costs, and less flexibility) and equity rise; - but cheaper debt replaces more expensive equity. In the Modigliani Miller 1958 theory, these two effects exactly offset each other. In the real world, many believe there is an optimum level (or at least a range) which maximizes the value of the firm.
Figure 18 : Optimal structure
Source: Vernimmen, “Finance d’entreprise” With the reasonable assumption -especially in the investment grade range- that free cash-flow remains unaffected by the gearing, the optimal gearing is simply the one that minimizes the cost of capital:
Determination of Appropriate Cost of Capital Rates for the Regulated Fixed Activities of France Telecom
31 October 2005 Djibril Diakité 88
Figure 19 : WACC and firm value as a function of leverage
Source: Damodaran, “Applied Corporate Finance”
The following graph shows the path of the forward-looking WACC/CAPM estimation and in bold, the iterative process giving various WACC rates according to the gearing ratio.
Figure 20 : Forward-looking WACC/CAPM estimation and optimal gearing
Determination of Appropriate Cost of Capital Rates for the Regulated Fixed Activities of France Telecom
31 October 2005 Djibril Diakité 89
In practice, the difficulty lies in the relation between gearing and new rating. Some develop synthetic ratings typically through interest coverage ratios. This requires complex calculations and possibly adjustments of other WACC parameters estimated in a regulatory context. We also find this unsatisfactory in our case because a European telecoms benchmark shows that, with or without operating leases, the relationship between gearing and rating is rather weak.
Figure 21 : Composite ratings and D/E of European integrated operators*
*Swisscom, Eircom and Tele2 are not rated, OL=operating leases in last AR The composite rating is an average between Moody’s and S&P’s ratings
As shows the above figure, the spreads of D/E within the same rating are very large. In practice, gearing levels are also set on factors which are more to do with perception than actual hard numbers (cf. Ogier et al)42. Moody’s rating methodology summarized in annexe shows that their quantitative analysis is based only on ratios. But, this figure tends to show that size do matter as well! Eventually, estimating a target gearing through a large benchmark of operators makes little sense. Here, only two or three of them appears directly comparable to France Telecom.
42 For this reason, some mention an effective structure rather than an optimal structure in the quantitative analysis also called tradeoff model.
-20%
0%
20%
40%
60%
80%
100%
AA- A A- A- A- A- A- A- BBB+ BBB+ BBB+ BBB+ BBB+
Average “conventional” D/E Average OL/E
Belgacom
TelekomAustria
FT
TeliaSonera
BTTelecom Italia
KPN
Telenor
TelefonicaPortugaltelecom
DT
OTE
TDC
-20%
0%
20%
40%
60%
80%
100%
AA- A A- A- A- A- A- A- BBB+ BBB+ BBB+ BBB+ BBB+
Average “conventional” D/E Average OL/E
Belgacom
TelekomAustria
FT
TeliaSonera
BTTelecom Italia
KPN
Telenor
TelefonicaPortugaltelecom
DT
OTE
TDC
-20%
0%
20%
40%
60%
80%
100%
AA- A A- A- A- A- A- A- BBB+ BBB+ BBB+ BBB+ BBB+
Average “conventional” D/E Average OL/E
Belgacom
TelekomAustria
FT
TeliaSonera
BTTelecom Italia
KPN
Telenor
TelefonicaPortugaltelecom
DT
OTE
TDC
Determination of Appropriate Cost of Capital Rates for the Regulated Fixed Activities of France Telecom
31 October 2005 Djibril Diakité 90
6.2.2. France Telecom’s Target One of the best sources to estimate a target gearing is probably the management itself. On June 29th, 2005, Didier Lombard, France Telecom’s Chairman and CEO, presented the Group’s programme for 2006 – 2008 to employees, the financial community and the press43.
“The Group’s new financial objectives for 2008: France Telecom aims for an average annual revenue growth rate of 3% to 5% on a comparable basis in the period from 2006 to 2008 and for an EBITDA growth rate slightly higher than revenue growth in the same period (…) Debt reduction: net debt to EBITDA ratio under 2 by end 2008.” On October 27th, 2005, France issued a press released regarding Q3: ”In light of the revenues seen in the third quarter, notably impacted by the decrease in revenues on TP, the Group has revised its initial revenue target for 2005 (3 to 5% growth pro forma) and is now aiming for pro forma growth of nearly 3% over the full-year in 2005, factoring in the favorable outlook for business expected for the fourth quarter. '”Group confirms its gross operating margin target of more than EUR 18.5 billion Objectives maintained for the ratios of Capex to revenues (in the upper range of 10 to 12%) and net debt to GOM44 (less than 2.5)” On the basis of these statements, we make the following assumptions: - In 2008, the pro-forma EBITDA will be 18.5x(1+5%)^3 = 21.41 billion. - Stated net debt = 21.41x2 = 42.8 billion. - The current market capitalization is the best estimate of the future market value of
equity: 60 billion. - There is no reason to believe that operating leases will disappear:
the ratio OL/(D without OL) of 2004 remains our best estimate for their future impact in absence of any updated information on this issue
This gives a target D/E = 71.3%x(1+19%)=85% or a target gearing around 45.9% (41.6% without operating leases).
43 http://www.francetelecom.com/en/financials/investors/news/CP_infos/cp050629.html 44 Gross operating Margin which is replacing EBITDA.
Determination of Appropriate Cost of Capital Rates for the Regulated Fixed Activities of France Telecom
31 October 2005 Djibril Diakité 91
For the rating of France Telecom, the outlook is rather positive:
Source: Bloomberg A net debt lower than 2xEBITDA is not an innocent objective: it is well known to be fully compatible with an A rating (cf. Annexe with Moody’s table). We however make the conservative assumption that France Telecom remains A- like all other good performer in terms of rating (except Belgacom which is at least two notches above). This would entail a debt margin of 0.75.
Determination of Appropriate Cost of Capital Rates for the Regulated Fixed Activities of France Telecom
31 October 2005 Djibril Diakité 92
7. Group’s WACC Rate
7.1. Inflation Rate Inflation is back in the limelight. Le Monde, October 16th 2005 : « Le retour de l'inflation préoccupe les banques centrales : Les banques centrales tiennent leur revanche. Au cours des dernières années, la plupart des économistes - et parmi les plus renommés d'entre eux - n'ont cessé de répéter que l'inflation était morte. (...) Avec le choc pétrolier, résultant d'une offre insuffisante d'or noir par rapport à une demande croissante, notamment en provenance de Chine, l'inflation semble bel et bien de retour. Un peu partout dans le monde, cette semaine, les preuves se sont multipliées. Aux Etats-Unis, elles ont même pris des allures de flambée45.(...) L'Europe n'est pas à l'abri de la psychose inflationniste. La hausse des prix à la consommation en France a atteint 0,4 % en septembre, soit une hausse de 2,2 % sur un an contre + 1,8 % en août, selon les chiffres communiqués jeudi par l'Insee. Elle reste toutefois inférieure à celle observée en Allemagne, où elle s'est établie à 2,5 % en septembre, ce qui constitue le plus haut niveau depuis quatre ans. (...) « Les risques que l'inflation dans la zone euro soit supérieure à 2 % l'an prochain ont augmenté », a prévenu Otmar Issing chef économiste de la Banque centrale européenne.» Yahoo Finance, October 16th 2005: « L'inflation pourrait dépasser le plafond des 2% l'an prochain sous l'effet des cours élevés du pétrole, a estimé dimanche le président de la Banque centrale européenneJean-Claude Trichet à l'issue d'une réunion du G20 près de Pékin. "Je n'excluerais certainement pas que nous soyons au-dessus de notre définition de la stabilité des prix l'an prochain en ce qui concerne l'inflation dans son ensemble", a-t-il dit lors d'un point presse. L'indice harmonisé des prix à la consommation a déjà atteint un pic de 2,5% en septembre dans la zone euro, selon l'office européen des statistiques Eurostat, dépassant largement l'objectif de la BCE d'une inflation proche mais en dessous de 2%. Un autre membre de la BCE, le président de la Bundesbank allemande Axel Weber, a lui aussi laissé entendre que l'inflation pourrait se situer au-dessus de 2% dans le courant de l'année prochaine. "Nous reviendrons sans doute seulement à la fin de l'année 2006 à la stabilité des prix", a-t-il déclaré dans une interview au quotidien Handelsblatt à paraître lundi. "Les risques d'inflation ont augmenté à court, moyen et long terme", a ajouté M. Weber dans cet entretien diffusé dimanche soirdans un communiqué du Handelsblatt.” Given the current situation, we believe ARCEP should assume for the next regulatory period an inflation rate of 2% minimum (ECB’s objective). 45 Above 4.5% in annual percentage.
Determination of Appropriate Cost of Capital Rates for the Regulated Fixed Activities of France Telecom
31 October 2005 Djibril Diakité 93
7.2. Group’s Real WACC Rate The following table shows the WACC parameters considered by ARCEP in the current consultation and those estimated in this report at the group’s level.
Table 22 : ARCEP’s suggested WACC rate and our estimate for France Telecom’s group
ARCEP Our estimates
Risk Free Rate 3.42% 3%
Equity Risk Premium 5% 4%
Target Gearing (D/D+E) 40%% 45.9% (41.6%*)
Fwd-looking Equity Beta 1 1.02
Debt Margin 1% 0.75%
Tax Rate 34.93% 34.43%
Nominal WACC Rate 9.5% 7.64% (7.94%*)
Inflation Rate 1.6% 2%
Real WACC Rate 7.9% 5.44% (5.74%*)
*Without taking into account operating leases In ARCEP’s suggested WACC, only the risk-free rate has been updated. As the inflation rate, it probably stems from the French long-term bond yield prevailing at the end of May 2005. The other parameters are based on a prior review dating back to 2003. The statutory tax rate is probably the appropriate (forward-looking) tax rate to use in the WACC formula: 34.43% in France starting from 2006 (instead of 34.93% this year). Our analysis is adjusted to the regulatory framework and may not be compared to rates estimated according to some corporate finance practices: - To some extent, it takes into account that this rate is re-estimated by regulators
on a periodic basis - It relies more on stable estimates for WACC parameters than on current market
conditions. We have indicated between parenthesis figures which do not take into account operating leases. We believe that these simpler estimates are less accurate but we recognize that the involved calculations are more complex and maybe difficult to implement by regulators.
Determination of Appropriate Cost of Capital Rates for the Regulated Fixed Activities of France Telecom
31 October 2005 Djibril Diakité 94
8. Fixed Activities
8.1. PwC’s Quantitative Analysis
In "Disaggregating BT’s Beta”, PwC has carried out for Ofcom a very interesting quantitative analysis across a large sample of firms. Aiming at inferring an asset beta for the access to the local loop, it gives actually indications for the fixed activities altogether.
Figure 22 : PwC’s cross-sectional analysis of telecoms companies
Source: PwC 2005
“Given the significant variation in the absolute values of beta resulting from the different source beta calculations, in order to interpret the results it is first necessary to decide on which of the equations to place most emphasis. In our view, the equations based on monthly data are the least reliable as the five year estimation period smoothes over any changing composition of the businesses in the sample. There are advantages and disadvantages of the weekly and daily estimates. The weekly estimates suffer from the problem of different results depending upon which day of the week on which to run the regressions, and when estimated over a period of one year only rely upon a somewhat limited 52 observations. The daily regressions, with more data points, can suffer from problems of heteroscedasticity and non-trading bias, although this should be limited for large, frequently traded companies.
Determination of Appropriate Cost of Capital Rates for the Regulated Fixed Activities of France Telecom
31 October 2005 Djibril Diakité 95
Examination of the weekly and daily estimates suggests that weekly data causes more erratic results, especially when using the global index. We therefore prefer to place more emphasis on the daily equations. We have no strong preference regarding the use of the local or global index – as capital markets become more globally integrated there are good arguments for using the betas calculated on global indices, but there can be a lack of synchronicity issue across different time zones. The former tends to give better specified beta regression equations, but can be affected by the problem of the company being a significant proportion of the overall market index in some countries (tending to bias the equity beta estimate towards one). (…)We place less emphasis on the absolute beta estimates in the table as opposed to the direction and indicative size of the differences between individual business segments and the overall group. (…) Using the daily local measure of beta, our estimated equation suggests that for a BT group asset beta of 0.7, divisional asset betas vary widely from 1.8 for ICT activities, 0.9 for other activities, 1.0 for mobile, and 0.5 for the fixed network. Subject to the caveats, the actual equations may give some indication of the magnitude of differences between divisional betas, but cannot be used to quantify differences with any precision.”
Determination of Appropriate Cost of Capital Rates for the Regulated Fixed Activities of France Telecom
31 October 2005 Djibril Diakité 96
8.2. European Benchmark In this section, we consider a similar analysis with European firms.
8.2.1. European Operators’ Asset Betas For this benchmark, our preferred approach is to measure betas against the same E300 index for all European operators. Other approaches would consist in: - assessing all operators’ individual situations and computing betas accordingly, - doing like PwC and other consultants mentioned in 5.1.2 with eventually a wide
range of betas. Our opinion is that : - With a European index such as E300, we are likely to capture intermediate betas
not far from the ‘true’ beta. - The benchmark will serve as a complementary estimation and we think that the
extra workload entailed by the first approach is not justified. - Last but not least, we could also argue for the need of a consistent basis in this
benchmark that should be considered from the point of view of France Telecom’s marginal investor46.
Damodaran:
“Once a list of comparable firms has been put together, we need to estimate the betas of each of these firms. Optimally, the beta for each firm will be estimated against a common index. If that proves impractical, we can use betas estimated against different indices.”
46 We have however to make here a more restrictive assumption regarding the marginal investor’s currency: it is the Euro, E300’s base currency. This is still a reasonable hypothesis and less restrictive than any national CAPM. In that case, betas of operators out of the Eurozone are not an issue since this investor is exposed to the same currency fluctuations. A more rigorous approach would maybe consist in considering currency averages for each operator’s beta. For instance: 30% of beta against E300 in £, 50% of beta against E300 in €, etc. We believe that this extra-sophistication could hardly be justified in a regulatory context and results may well barely differ like in the similar but simpler approaches with historical EMRP.
Determination of Appropriate Cost of Capital Rates for the Regulated Fixed Activities of France Telecom
Source: Bloomberg, 25th October 2005; * excluding F&M.
Beta
Telekom Austria 0.74
TDC 0.46
France Telecom 1.08
Deutsche Telekom 0.85
OTE 0.75
Telecom Italia 1.07
KPN Telecom 0.78
Portugal Telecom 0.67
Telefónica 0.96
TeliaSonera 1.03
British Telecom F 0.93
Swisscom 0.41
Telenor 0.90
Tele 2 1.04
Eircom F 0.50
Belgacom 0.83
Vodafone* M 0.84
O2* M 1.02
Mobistar M 0.68
Telefonica Moviles M 1.06
Simple Average 0.83
Integrated Operators* 0.83
Determination of Appropriate Cost of Capital Rates for the Regulated Fixed Activities of France Telecom
31 October 2005 Djibril Diakité 98
In the table below, we indicate our estimate in local currency of the market value of their operating leases 2004 (estimated according to the principles set in §5.2.2.), and their weights compared to the market value of equity at the end of the financial year.
Table 24 : Future operating lease commitments at the end of 2004 or 31 March 2005
OL Mkt value Mkt Cap 0L/Mkt Cap
Telekom Austria M€ 217 194 6887 3%
TDC MDKK 5525 4700 45163 10%
France Telecom M€ 9411 8353 60104 14%
Deutsche Telekom M€ 11377 9924 69894 14%
OTE M€ 353 302 6494 5%
Telecom Italia M€ 0 48211
KPN Telecom M€ 2223 1875 16283 12%
Portugal Telecom M€ 0 10615
Telefónica M€ 0 65816
TeliaSonera MSEK 9025 7755 186074 4%
British Telecom* M£ 10457 7463 17472 43%
Swisscom MCHF 544 473 27543 2%
Telenor MNOK 0 95432
Tele 2 MSEK 2410 2066 38513 5%
Eircom* M€ 24 19 1525 1%
Belgacom M€ 373 330 11152 3%
Vodafone* M£ 3074 2520 89997 3%
O2* M£ 1931 1630 14081 16%
Mobistar M€ 0 0 4192
Telefonica Moviles M€ 0 0 37416
Source: Annual reports 2004 (*2005), Bloomberg
Determination of Appropriate Cost of Capital Rates for the Regulated Fixed Activities of France Telecom
31 October 2005 Djibril Diakité 99
This table shows the D/E ratios considered to unlever the 1-year daily betas (cf. 5.2.2). Table 25 : Average ‘official and adjusted with operating leases D/E ratios and gearings
Average 1 year ‘official’ D/E ‘official’ gearing
D/E with op. leases
Gearing with op. leases
Telekom Austria 26% 20% 28% 22%
TDC 39% 28% 48% 32%
France Telecom 80% 44.4% 94% 48.4%
Deutsche Telekom 64% 39% 79% 44%
OTE 31% 24% 35% 26%
Telecom Italia 82% 45% 82% 45%
KPN Telecom 47% 32% 59% 37%
Portugal Telecom 41% 29% 41% 29%
Telefónica 41% 29% 41% 29%
TeliaSonera 3% 3% 7% 7%
British Telecom* 46% 32% 89% 47%
Swisscom -8% -9% -7% -7%
Telenor 20% 16% 20% 16%
Tele 2 10% 9% 16% 14%
Eircom* 117% 54% 118% 54%
Belgacom -1% -1% 2% 2%
Vodafone* 12% 11% 15% 13%
O2* 1% 1% 14% 13%
Mobistar 3% 3% 3% 3%
Telefonica Moviles 24% 19% 24% 19%
Simple Average 34% 21% 40% 29%
Integrated Operators 34% 22% 39% 28%
Source: Annual reports 2004 (*2005), Bloomberg
Determination of Appropriate Cost of Capital Rates for the Regulated Fixed Activities of France Telecom
31 October 2005 Djibril Diakité 100
The table below shows asset betas estimated with and without operating leases (OL). In the next section, we consider only the first type which we consider to be more reliable, in accordance with indications quoted in 5.2.2. from reference financial textbooks.
Table 26 : European telecom operators’ asset betas
Asset betas Without OL With OL
Telekom Austria 0.59 0.58
TDC 0.33 0.31
France Telecom 0.60 0.56
Deutsche Telekom 0.52 0.48
OTE 0.57 0.56
Telecom Italia 0.59 0.59
KPN Telecom 0.53 0.49
Portugal Telecom 0.48 0.48
Telefónica 0.68 0.68
TeliaSonera 1.00 0.96
British Telecom 0.64 0.49
Swisscom 0.45 0.44
Telenor 0.76 0.76
Tele 2 0.95 0.90
Eircom 0.23 0.23
Belgacom 0.84 0.81
Vodafone 0.75 0.74
O2 1.01 0.91
Mobistar 0.66 0.66
Telefonica Moviles 0.89 0.89
According to Damodaran, a better asset beta is calculated by applying the unlevering formula to the average equity beta and D/E ratio rather than considering the average of asset betas. Whether we consider all the main European operators or just the ‘truly” integrated ones (i.e. excluding BT, Eircom, Vodafone, O2, Mobistar and Telefonica Moviles), this average asset is 0.62 for the first column and 0.59 with operating leases.
Determination of Appropriate Cost of Capital Rates for the Regulated Fixed Activities of France Telecom
31 October 2005 Djibril Diakité 101
8.2.2. Regressions
Since the beta of a firm is the weighted average of its activities betas, we need to assess these weights (for non-mobile operators).
The economic value is often proxied by sales or EBITDA but a better measure is given by EV/EBITDA since 1€ of ‘mobile’ EBITDA is not valued by the market as 1€ of ‘fixed’ EBITDA.
We have first considered with some the relative shares of EBITDA between fixed and mobile services in the last annual reports47 (with some adjustments through sales figures when information was missing at the EBITDA level)
Table 27 : Relative shares of EBITDA between fixed and mobile services
Fixed Mobile F+M/Group
Telekom Austria 51.5% 48.5% 101%
TDC 68.7% 31.3% 69%
France Télécom 51.4% 48.6% 85%
Deutsche Telekom 57.7% 42.3% 94%
OTE 56.2% 43.8% 94%
Telecom Italia 55.6% 44.4% 107%
KPN Telecom 54.3% 45.7% 82%
Portugal Telecom 42.1% 57.9% 92%
Telefónica 63.3% 36.7% 98%
TeliaSonera 47.8% 52.2% 102%
British Telecom 100.0% 0.0% 89%
Swisscom 52.3% 47.7% 94%
Telenor 35.1% 64.9% 86%
Tele 2 40.8% 59.2% 98%
Eircom 100.0% 0.0% 100%
Belgacom 52.6% 47.4% 100%
Source: Annual reports
47 Consolidated statements.
Determination of Appropriate Cost of Capital Rates for the Regulated Fixed Activities of France Telecom
31 October 2005 Djibril Diakité 102
We have then adjusted these proportions through an OLS regression since EV/EBITDA are known only at companies' level. We have obtained wireline x4.71, wireless x7.84, or: 5€ of ‘fixed’ EBITDA= 3€ of 'mobile' EBITDA48.
We have eliminated TDC because of the low share in the group’s EBITDA of the combined fixed plus mobile EBITDA.
Table 28 : Operators’ fixed and mobile adjusted weights
Fixed Mobile
Telekom Austria 39% 61%
France Télécom 42% 58%
Deutsche Telekom 49% 51%
OTE 44% 56%
Telecom Italia 43% 57%
KPN Telecom 49% 51%
Portugal Telecom 35% 65%
Telefónica 41% 59%
TeliaSonera 35% 65%
British Telecom 100% 0%
Swisscom 43% 57%
Telenor 29% 71%
Tele 2 30% 70%
Eircom 100% 0%
Belgacom 40% 60%
Regressing operators asset betas against activities weights, 'pure-play' companies included to improve accuracy, gives:
regression asset βfixed=0.39 and regression asset βmobile=0.86 (the longest line). R2=0.49. 80% confidence intervals given by Student law: [0.18, 0.46] for fixed services and [0.84, 1.06] for mobile services.
48 We believe that here the averaging issue over this short regression period matters less than with D/E.
Determination of Appropriate Cost of Capital Rates for the Regulated Fixed Activities of France Telecom
31 October 2005 Djibril Diakité 103
Like in the PwC study, we caution against the direct use of the previous regression's asset βfixed and asset βmobile but the directional evidence is clear, here also.
Remark: an asset beta of 0.4 would imply a nominal WACC rate of around 6.8% (without operating leases).
Determination of Appropriate Cost of Capital Rates for the Regulated Fixed Activities of France Telecom
31 October 2005 Djibril Diakité 104
8.3. Local Access
8.3.1. Ofcom’s consultation The main studies regarding access beta come from Ofcom's 2005 consultations which have been completed this summer. The first ones consisted essentially in benchmarking: - Equity betas of UK's largest utilities companies. However the basis for such
comparison is limited: these firms include not only distribution networks but also transport and in some cases production. Their asset betas are rather in the range of our fixed betas which seems logical.
- Equity betas of US telecoms companies. This proved to be unsatisfying because of regulatory differences, the significant weight of non-access activities, etc.
For the second consultation, PwC carried out probably one of the most extensive contribution on the subject up to date. It includes: - the above mentioned cross-sectional analysis of telecoms companies across the world (§ 8.1) - a times series analysis of BT's equity beta, examining the relationship over time between its equity beta and the proportion of its business accounted by different types of activity. The main problem of these quantitative analysis is that both approaches actually consider access and core business altogether. Given the level of the publicly available financial information for local access business units, any quantitative analysis aiming at separating both activities is probably bound to fail. Nonetheless, the qualitative appraisal carried out by PwC is of great interest. We recommend the regulator to pay attention to it. In order to have a good grasp of this issue, one should first understand the difference between systematic and specific risk In finance, risk means variability about an average: it does not refer simply to the possibility of downside movements. The systematic risks are those risk factors that tend to affect all investments simultaneously, e.g. GDP growth, interest rates, currencies, inflation rate, price of oil, etc. Specific risks are those risks factors which are specific to a particular investment or a group of investments. They include risks brought about by new technologies, changes in the competition, etc. The only risks for which equity investors require a return are systematic risks correlated with the market as a whole, because investors can ‘diversify away’ specific risks by holding a portfolio of different investments.
Determination of Appropriate Cost of Capital Rates for the Regulated Fixed Activities of France Telecom
31 October 2005 Djibril Diakité 105
Consequently, required returns on equity vary between investments according to the relative degree of systematic risks to which they expose the investor. This is captured by beta in the CAPM. [Remark: for a debt provider, diversification provides no protection against downside risk associated with specific factors (when the yield being considered is the ‘promised’ yield and not the ‘expected’ yield, as it is conventional practice). Because of this asymmetrical risk profile, the cost of debt reflects all risks, including company specific risks. Specific risks are nevertheless extremely important for all investors as they have a significant impact on the cash flows generated by an investment and hence on the success or failure of an investment. For valuation purposes, e.g. licence applications, it is reasonable to regard specific risks as being symmetrical because the cost of capital is applied to a probability-weighted assessment of cash-flow which takes into account all risks.]
- operational leverage (fixed vs. variable costs). The fixed costs magnify the effect of revenue cyclicality at the relevant level for beta: cash flows.
In addition to the financial leverage, these are the main factors impacting the sensitivity to systematic risk.
Determination of Appropriate Cost of Capital Rates for the Regulated Fixed Activities of France Telecom
31 October 2005 Djibril Diakité 106
8.3.2. Conclusion The main conclusion of PwC’s qualitative analysis is that local access shows a lower systematic risk profile than the core business, hence lower asset betas. It therefore reasonable to estimate that: - any WACC rate set for the access to the local loop should be lower than the
one for the fixed activities altogether, - themselves having, with even more certainty, a lower rate than the one
calculated for the whole group. We remark that eventually the British regulator has set has set a βaccess reduced by 18% from BT's βgroup (and BT group not only has fixed telecoms services but also some ICT and other 'riskier' activities). Beside, all these analyses assume in a realistic fashion a same capital structure since there is only one balance sheet for all France Telecom's activities. WACC rates differ only through betas. This follows the “European Commission Recommendation of 8 April 1998 on interconnection in a liberalised telecommunications market (98/322/EC)” which says: “While it may be easy to identify the values of debt and equity for an operator as a
whole, it is not easy to do so for each of its constituent activities. This is because decisions about debt finance are largely corporate decisions determined by a number of factors, such as historical borrowing facilities and tax planning considerations. Hence, the debt position of the corporation may not relate specifically to the funding requirements of individual activities.” “Where there is only one main balance sheet for several activities, it is acceptable to assume the same capital structure for these activities. In this context, the cost of debt can normally be assumed the same for all activities, unless they have markedly different balance sheets.” One can however note that in the benchmark, gearings of the ‘pure’ play fixed operators are significantly higher than those of the pure play mobile operators, implying that the fixed business can carry more debt.
Determination of Appropriate Cost of Capital Rates for the Regulated Fixed Activities of France Telecom
31 October 2005 Djibril Diakité 107
9. Annexe [Continuation of the discussion on the EMRP Puzzle] Arithmetic vs. Geometric WM&M recognize that the EMRP should be adjusted downwards “to the extent that this reflects clear distortions in the historic record (eg, extreme volatility during hyper-inflations)”. But they criticize, in a post 9/11 world, such “an adjustment to reflect forward-looking assessments of volatility”: “To the extent that it embodies the assumption that the world is a safer place, this approach is on distinctly less firm ground. There is indeed a reasonable amount of evidence that macroeconomic aggregates like GDP became more stable in the second half of the twentieth century. But, at least in mature markets, the evidence that stock markets, as opposed to the rest of the economy, have got much safer, is distinctly weaker. In economies that escaped major disruption, such as the UK or the US, there is little or no evidence of a decline in stock return volatility.”
However, this can be mitigated by wider international (smart) diversification allowing for a decrease in portfolio’s volatility. Looking at the future in “Irrational Optimism”, DMS clarify some possible misinterpretation of their works. They explain that equity investment will continue to remain risky. The coming years may bring new forms of disorder and volatility, as well as new business opportunities barely reflected in today’s stock prices. Investors should therefore continue to expect a reward for the additional risk as they did and received in the past (although stocks’ margin of outperformance was narrower than was previously surmised). Nevertheless, for many of them, their prospective real stocks returns are lower than it was in the 20th century and they project, while the risk is higher than they appreciate. To maximize the probability of favourable real returns, equity exposures should be diversified globally (efficiently and cost-effectively) so as to dampen domestic stock market volatility
Adjusted Historical Approach - The sub-argument regarding the fall of transaction costs is objected by economists like WM&M: “The proportion of the population investing indirectly in the stock market has risen enormously. The rise of third party investment, via pension funds, etc, may quite possibly have increased principal-agent type costs for the average investor. There is certainly evidence that the costs of third party investment are distinctly non-trivial (…). Thus the case for lower trading costs does not appear clear-cut “
Determination of Appropriate Cost of Capital Rates for the Regulated Fixed Activities of France Telecom
31 October 2005 Djibril Diakité 108
- Some add the (market level) survivorship bias49 to the case for a lower expected EMRP than the ex-post estimate. Mehra’s objects to this idea and writes that stocks and bonds were equally affected by financial crises: “The central thesis [of Brown et al] is that the ex post measured returns reflect the premium in the United States on a stock market that has successfully weathered the vicissitudes of fluctuating financial fortunes. Many other exchanges have been unsuccessful; hence, the ex ante equity premium was lower because no one knew a priori which exchanges would survive. For this explanation to work, however, stock and bond markets must be differently affected by financial crises. One reason the effects might not be different is that governments have expropriated much of the real value of nominal debt by the mechanism of unanticipated inflation. Five historical instances come readily to mind: During the post-WWI period of German hyperinflation, holders of bonds denominated in Reich marks lost virtually all of the value invested in those assets. During the 1920s administration of Henri Poincaré in France, bondholders lost nearly 90 percent of the value invested in nominal debt. In the 1980s, Mexican holders of dollar-denominated debt lost a sizable fraction of the debt’s value when the Mexican government, in a period of rapid inflation, converted the debt to pesos and limited the rate at which the funds could be withdrawn. Bondholders in czarist Russia and holders of Chinese debt holdings after the fall of the Nationalist government suffered a similar fate under the new communist regimes. These examples demonstrate that in times of financial crises, bonds are as likely to lose value as stocks.(…) Thus, although survivorship bias may have an impact on the levels of the return on both equity and debt, researchers have no evidence that crises affect the returns to stocks and bonds differentially. Hence, the equity premium is not affected.” In “Global evidence on the equity risk premium” (2002), DMS give this qualified judgement: “Commentators have suggested that [firm level] survivor bias may have given rise to equity premia for the United States and the United Kingdom that are unrepresentative. While legitimate, these concerns are somewhat overstated (…) [But] even if we have been successful in avoiding survivor bias within each index, we still focus on markets that survived, omitting countries such as Poland, Russia or China whose compound rate of return was -100 percent. Although these markets were relatively small in 1900, their omission probably leads to an overestimate of the worldwide risk premium. We say “probably” because of the possibility that some defaulting countries have returns of -100 on bonds, while equities retain some residual value. For such countries, the ex post equity premium would be positive.”
49 This ‘macro’ survivorship bias is, in our understanding, different than the one consisting in building EMRP estimates with only equity returns of firms that still exist today.
Determination of Appropriate Cost of Capital Rates for the Regulated Fixed Activities of France Telecom
31 October 2005 Djibril Diakité 109
- Regarding specifically the fall in dividend yield (implying a decrease of the EMRP), some state that this argument is driven entirely by the rise in the market during the 1990s. DMS note in “Irrational Optimism” (December 2003) that: “In addition to potentially lower future growth rates of dividends and earnings, the starting point in terms of dividend yield is very different from long ago. The U.S. dividend yield is today only 1.6 percent, and for our 16-country world index, it is just under 2 percent. In 1900, the corresponding dividend yields were around 4.5 percent, and scope was available for rising multiples to enhance returns. Today, P/Es are much higher than they were long ago.” We have not checked whether the current levels of dividend yields [resp. P/E ratios] are lower [resp. higher] than those which prevailed until the beginning of the 90s’ bubble. As said WM&M in February 2003, the historical decrease in dividend yields might have been limited to this exuberant time period. Nevertheless, we can argue that the 90s’ excess has been to a large extent purged and that current levels fit a deeper trend. - FT “A puzzle at the heart of equities” (March 19 2003): “One of the authors of the original 1980s work, Rajnish Mehra of the University of
California, has recently published a paper examining whether economic theory has been able satisfactorily to explain the "equity premium puzzle" in the 20 years since it became widely discussed [he actually revisited in 2003 his famous 1985 paper]. Since equities and bonds perform similarly in various economic scenarios, he calculates that equities should command only a 1 percentage point annual premium over riskless assets. His answer is that none of the theoretical explanations adequately explains the discrepancy. Some academics have constructed models that mirror the data but their assumptions about human behaviour, especially regarding risk aversion and prudence, "become improbably large". A potential upward bias in the equity return data because the US market has survived the past century also fails because government bonds are as vulnerable to financial implosion owing to war or revolution [cf. infra]. Other explanations similarly fail, according to Prof Mehra, leaving the equity premium puzzle intact. He draws the conclusion that since economic theory has failed to answer his puzzle, and since the data on long-run equity returns are better than almost any other economic series, there is every reason to expect equity returns to keep outperforming bonds significantly over the next century. Others disagree. They tend to the view that since the size of the equity premium has been a genuine puzzle, there is little reason to expect it to remain high.” [Follow then quotes from DMS research]
Mehra 2003: “Market watchers and other professionals who are interested in short-term investment planning will wish to project the conditional, expected equity premium over their planning horizon. This task is by no means simple. Even if the equity premium in current market conditions is small (and the general consensus is that it is), it does not imply that either the historical premium was too high or that the equity premium has diminished.”
Determination of Appropriate Cost of Capital Rates for the Regulated Fixed Activities of France Telecom
31 October 2005 Djibril Diakité 110
“Before the equity premium is dismissed, not only do researchers need to understand the observed phenomena, but they also need a plausible explanation as to why the future is likely to be any different from the past. In the absence of this explanation, and on the basis of what is currently known, I make the following claim: Over the long term, the equity premium is likely to be similar to what it has been in the past and returns to investment in equity will continue to substantially dominate returns to investment in T-bills for investors with a long planning horizon.
Risk free rate With the equity market return R=Rf+EMRP, the cost of equity can also be expressed as: β.R + (1-β).Rf When beta is around 1, the second term is negligible. “The relatively greater importance of the market return is fortunate for the regulators, since we argue that there is considerably more uncertainty about the true historic risk-free rate, and hence the equity premium, than there is about the market return itself. The historic size of the equity premium is still the subject of considerable puzzlement and controversy amongst academics; but this is largely due to the historic behaviour of the risk-free rate (proxied by the short-term interest rate). In contrast, we summarise a range of evidence that the equity return has, over reasonably long samples, been fairly stable both over time, and across different markets.” “For example, some arguments, examined below, that the historic risk premium overstates the true risk premium due to one-sided inflation surprises that have depressed the historic safe rate, imply precisely offsetting errors in the two elements, and thus should not affect the estimate of the overall cost of equity capital”. “Finally, the “equity premium puzzle" and the “risk-free rate puzzle" are essentially the same puzzle. That being the case, if the equity premium were to fall in the future, it would seem more likely that the safe rate (both hard to explain and apparently unstable in the data) should rise towards the more stable, and more easily explicable stock return, than that the latter should fall. There has indeed been an observable tendency for real safe rates to drift upwards from the second half of the twentieth century onwards - visible both in the US data and, as Dimson, Marsh, and Staunton (2001a) show, in a wide range of other countries.” It is true that one-sided inflation surprises tend to affect less equities than government bonds. But our objection to this WM&M’s remark is that Rf and EMRP were not symmetrically affected by other factors presented in §5.1.3 (adjusted historical premia).Some factors suggesting lower ex-ante equity returns are not compensated by those suggesting higher ex-ante Rf. Ex-post market returns may have been fairly stable, but it is still possible that the expected market returns have decreased over the last century, i.e. the optimists have indeed ‘triumphed’.
Determination of Appropriate Cost of Capital Rates for the Regulated Fixed Activities of France Telecom
31 October 2005 Djibril Diakité 111
[Excerpt from Moody’s Rating Methodology Global Telecommunications Industry]
Determination of Appropriate Cost of Capital Rates for the Regulated Fixed Activities of France Telecom
31 October 2005 Djibril Diakité 112
Determination of Appropriate Cost of Capital Rates for the Regulated Fixed Activities of France Telecom
31 October 2005 Djibril Diakité 113
Determination of Appropriate Cost of Capital Rates for the Regulated Fixed Activities of France Telecom
31 October 2005 Djibril Diakité 114
10. References Financial textbooks Damodaran: Applied Corporate Finance 2004 *** http://pages.stern.nyu.edu/~adamodar/ ** Ogier Rugman Spicer: The Real Cost of Capital 2004 *** http://www.costofcapital.net Koller Goedhart Wessels: Valuation Measuring and Managing the Value of Companies, Fourth Edition 2005 ** Vernimmen Quiry Le Fur: Corporate Finance 2005 * Finance d’Entreprise 2002 http://www.vernimmen.net * Brealey Myers: Principle of Corporate Finance, Sixth Edition 2000
Reports commissioned or carried out by regulators: Ofcom: Ofcom’s approach to risk in the assessment of the cost of capital *** First Consultation amended document February 2005 (EMRP, beta access) Second Consultation June 2005 (beta access) Final Statement August 2005 (little change from the first two documents) BT’s responses to Ofcom’s consultation, Annexe by Ian Cooper (EMRP, beta) * Wholesale Mobile Voice Call Termination, June 2004* PricewaterhouseCoopers: Disaggregating BT’s Beta *** (Ofcom’s 2005 consultation) The Brattle Group’s beta studies: Issues in Beta Estimation for UK Mobile Operators July 2002 ** Financial Analysis of British Telecommunications February 2004 ** Beta Analysis of British Telecommunications: Update June 2005 * (Ofcom’s 2005 consultation) Co-author: David Stalibrass [email protected] Wright Mason Miles (WMM): Study into Certain Aspects of the Cost of Capital for Regulated Utilities in the U.K 2003 *** Co-author: [email protected] Stephen Wright wrote the EMRP section [email protected]
Determination of Appropriate Cost of Capital Rates for the Regulated Fixed Activities of France Telecom
31 October 2005 Djibril Diakité 115
Nera’s reports for OPTA: Estimating the Cost of Capital of Telecommunications Interconnection Services in Holland A Final Report for OPTA June 2001/July 2002/June 2003** Estimating the Weighted Average Cost of Capital (WACC) for Originating Telecommunication Services in Holland June 2002/June 2003 Andersen Management International (AMI) draft report for PTS: Estimating the cost of capital for fixed and mobile SMP operators in Sweden ** [email protected] Kevin Davis: The Weighted Average Cost of Capital for the Gas Industry - Report Prepared for Australian Competition and Consumer Commission And Office of the Regulator General 1998 (Rf, tax) * Alexander Estache Oliveri: A Few Things Transport Regulators Should Know About Risk and the Cost of Capital July 1999 * JCRA/Coleago: Price Control of JT: Final Report February 2004 * ERG: Note on the hearing on cost accounting and accounting separation June 2004 Commission Recommendation of 8 April 1998 on interconnection in a liberalised telecommunications market (Part 2 - Accounting separation and cost accounting) (98/322/EC)
Economic research about EMRP:
Dimson Staunton Marsh (DMS): Global Investment Returns Yearbook 2005 (LBS/ABN AMRO) *** Available on request: ABN AMRO PR [email protected] Irrational Optimism 2003 * Global Evidence on the Equity Risk Premium 2002 *** Triumph of the Optimists 2001 (book) PricewaterhouseCoopers: Rates of return for FSA prescribed projections June 2003 ** [email protected] Also responsible for the annual PwC EMRP Survey (on request) Rajnish Mehra: The Equity Premium: Why Is It a Puzzle? 2003 * Article from Financial Times: A puzzle at the heart of equities Chris Giles 19 March 2003 *
Determination of Appropriate Cost of Capital Rates for the Regulated Fixed Activities of France Telecom
31 October 2005 Djibril Diakité 116
Other papers: Useful links for economic research: http://www.ssrn.com *** http://www.afajof.org/ http://jfe.rochester.edu/ Roger A. Morin: Direct testimony of Roger A. Morin San Diego Gas & Electric Company before the public utilities commission of the state of California October 2003 * (divisional beta) Duett Merikas Tsiritakis: A Pedagogical Examination of the Relationship between Operating and Financial Leverage and Systematic Risk (beta) European Central Bank: Publications: http://www.ecb.int/pub/html/index.en.html Monthly Bulletins *** Statistic Pocket books
Other data sources:
Bloomberg $ European regulators (survey): Links can be found at http://www.art-telecom.fr/liens/unioneu.htm Or in ERG web site http://www.erg.eu.int/links/index_en.htm Investment banks (survey) Telecoms operators’ annual and interim reports France Telecom press releases and presentations to analysts (web site) Moody’s (not publicly available): Rating Methodology: Global Telecommunications Industry February 2005 Consensus Economics (surveys on forecasts and views) $ http://www.consensuseconomics.com/ Ibbotson Associates $: “International Equity Risk Premia Report 2005”Heather Recibe International Sales Manager [email protected] For regression techniques and statistical tables: Dodge Rousson: Analyse de Regression Appliquée (book)
Determination of Appropriate Cost of Capital Rates for the Regulated Fixed Activities of France Telecom
31 October 2005 Djibril Diakité 117
List of Tables Table 1 : Current and averaged yields on German government bonds .................................18 Table 2 : Historical volatility in the Dow Jones Euro Stoxx economic sector indices .............26 Table 3 : Country breakdown as at 31st may 2004................................................................28 Table 4 : Adjusted weights for EMRP country averages .......................................................29 Table 5 : Ibbotson’s long horizon EMRP (1970-2004) ..........................................................31 Table 6 : DMS’ Worldwide risk premia relative to bonds, 1900-2004 ....................................33 Table 7 : Average DMS’ EMRP relative to bonds .................................................................34 Table 8 : Annualized inflation 1900-2004..............................................................................37 Table 9 : DMS’ 1900-2004 world EMRP relative to bills and bonds ......................................42 Table 10 : Real dividend and GDP growth 1900-2004..........................................................46 Tableau 11 : PwC 2004 survey, median and weighted mean estimates ...............................56 Table 12 : EMRP survey of equity analysts ..........................................................................58 Table 13 : European telecoms regulators’ EMRP .................................................................61 Table 14 : Summary of EMRP Evidence ..............................................................................64 Tableau 15 : Net debts as stated in the last annual reports and restated in following interim
reports...........................................................................................................................71 Table 16 : Daily raw betas/E300 minus daily betas/SXXE for European integrated operators
......................................................................................................................................72 Table 17 : France Telecom’s daily raw equity beta vs. various indices .................................73 Table 18 : Moody’s and S&P ratings.....................................................................................79 Table 19 : European telecoms operators’ ratings..................................................................80 Table 20 : Moody’s universe average spreads over 10-year local government bond (Q1
2005).............................................................................................................................81 Table 21 : Adjusted long-term spreads by rating...................................................................86 Table 22 : ARCEP’s suggested WACC rate and our estimate for France Telecom’s group ..93 Tableau 23 : European telecom operators’ 1-year daily adjusted equity betas .....................97 Table 24 : Future operating lease commitments at the end of 2004 or 31 March 2005.........98 Table 25 : Average ‘official and adjusted with operating leases D/E ratios and gearings ......99 Table 26 : European telecom operators’ asset betas..........................................................100 Table 27 : Relative shares of EBITDA between fixed and mobile services .........................101 Table 28 : Operators’ fixed and mobile adjusted weights....................................................102
Determination of Appropriate Cost of Capital Rates for the Regulated Fixed Activities of France Telecom
31 October 2005 Djibril Diakité 118
List of Figures
Figure 1 : YTM of zero coupon German bonds with a maturity of January 2009, 2011 and 2016..............................................................................................................................15
Figure 2: German government zero coupon bond with a January 2011 maturity: .................18 Figure 3 : DMS’ 1900-2004 EMRP estimates (geometric mean)...........................................33 Figure 4 : Expected growth in corporate earnings per share in the euro area .......................44 Figure 5 : FTSEurofirst 300 ..................................................................................................45 Figure 6 : Annualised dividend yield plus growth (compared to total returns), 1900-2004.....47 Figure 7 : Index-linked French government bond with a 2011 maturity .................................48 Figure 8 : Associés en Finance’s bottom-up EMRP for France until 2001, then Eurozone....54 Figure 9 : PwC 2005 EMRP survey, ‘the City’s view’ ............................................................55 Figure 10 : PwC 2004 survey, “analysts’ estimates of the EMRP in different markets” .........56 Figure 11 : BT Group’s standard error of 6-year monthly equity beta....................................67 Figure 12 : Evolution of E300 and E3TELE indexes over the last six years ..........................68 Figure 13 : BT Group unadjusted asset beta over time.........................................................69 Figure 14 : Variation of BT’s monthly equity beta, according to starting day .........................69 Figure 15 : Evolution of non-financial BBB rated corporate bond spreads (Eurozone) .........82 Figure 16 : Recent evolution of BBB rated corporate bond spreads (Eurozone) ..................83 Figure 17 : Evolution of US telecom operators’ CDS 5-year premia......................................84 Figure 18 : Optimal structure ................................................................................................87 Figure 19 : WACC and firm value as a function of leverage..................................................88 Figure 20 : Forward-looking WACC/CAPM estimation and optimal gearing..........................88 Figure 21 : Composite ratings and D/E of European integrated operators*...........................89 Figure 22 : PwC’s cross-sectional analysis of telecoms companies......................................94
Determination of Appropriate Cost of Capital Rates for the Regulated Fixed Activities of France Telecom