DETERMINATION OF CHEMICAL COMPOSITION, STATE OF ORDER, MOLAR VOLUME, AND DENSITY OF A MONOCLINIC ALKALI FELDSPAR USING X-RAY DIFFRACTION Guy L. Hovis Department of Geology Lafayette College Easton, PA 18042 [email protected]INTRODUCTION Alkali feldspars (commonly referred to as "potassium feldspars") are among the most abundant minerals in the Earth's crust. As such, they have the potential to provide important information about the rocks in which they occur. Using X-ray data, it is possible to characterize both the chemical composition and state of order of an alkali feldspar, and in some instances to approximate the temperature at which the feldspar equilibrated. Molar volume and density, fundamental properties of any mineral, also can be determined. Although many chemical substitutions occur in these minerals, the replacement ofK by Na is the most common. Thus, as a first approximation, alkali feldspars can be thought of as solid solutions varying from potassium-rich to sodium-rich end members, that is, from KAISi 3 0g to NaAISi 3 0 g . Mineralogists characterize alkali feldspar composition by a parameter called NOr' which is simply the "mole fraction" of potassium in the mineral. If NOr = 0.7, for example, a formula of Ko.7Nao.3AI~.i30g is implied (note that Na and K always add to 1.0). Both the a unit- cell dimension and the ( 201 ) X-ray diffraction peak of an alkali feldspar are quite sensitive to K:Na ratio. In this exercise both will be used to estimate the composition of an alkali feldspar. In addition to chemical composition, alkali feldspars are characterized by their state of "order" or "disorder." Ordering phenomena can occur in any crystalline material in which two or more ions compete for symmetrically nonequivalent crystallographic sites. In monoclinic alkali feldspars it is aluminum (AI) and silicon (Si) ions that occupy both of the crystallographically distinct tetrahedral sites (named Tl and T2; see Fig. 2 of Hovis, this publication). Ordering relationships, however, are found in many other mineral series, including pyroxenes, amphiboles, and micas, and in sites other than tetrahedral ones. Because these relationships are temperature- and/or pressure-dependent, they can give important information about the conditions under which a mineral has equilibrated. The state of order in monoclinic alkali feldspars is defined by the distribution of Al and Si between the two tetrahedral sites. To illustrate, let us suppose that there are a total of 2000 tetrahedra in a tiny feldspar crystal. Since there are equal numbers ofTl and T2 sites, 1000 of these would be Tl sites and 1000 would be T2 sites. Because of the 1:3 AI:Si ratio, 500 Al ions and 1500 Si ions would occupy these sites. The most "ordered" possible monoclinic feldspar crystal would have all 500 Al ions in one site (the Tl). The 1500 Si ions would fill the remaining 500 Tl sites and all 1000 of the T2 sites. Thus, the fraction of Al ions in the Tl site (symbolized NAl(Tl)) of such a crystal would be 0.50 (50011000), and the fraction of Al in T2 (NAl(T2}) would be 0.00. On the other hand, a "perfectly disordered" crystal would have a "random" distribution of Al and Si between the two sites (that is, the same occupancy in both sites). In such a case, 250 Al 107
Transcript
DETERMINATION OF CHEMICAL COMPOSITION,STATE OF ORDER, MOLAR VOLUME, AND DENSITY OF A
MONOCLINIC ALKALI FELDSPAR USING X-RAY DIFFRACTION
Alkali feldspars (commonly referred to as "potassium feldspars") are among the most abundantminerals in the Earth's crust. As such, they have the potential to provide important informationabout the rocks in which they occur. Using X-ray data, it is possible to characterize both thechemical composition and state of order of an alkali feldspar, and in some instances to approximatethe temperature at which the feldspar equilibrated. Molar volume and density, fundamentalproperties of any mineral, also can be determined.
Although many chemical substitutions occur in these minerals, the replacement ofK by Na isthe most common. Thus, as a first approximation, alkali feldspars can be thought of as solidsolutions varying from potassium-rich to sodium-rich end members, that is, from KAISi30g toNaAISi30g. Mineralogists characterize alkali feldspar composition by a parameter called NOr'which is simply the "mole fraction" of potassium in the mineral. If NOr = 0.7, for example, aformula of Ko.7Nao.3AI~.i30g is implied (note that Na and K always add to 1.0). Both the a unit-cell dimension and the ( 201 ) X-ray diffraction peak of an alkali feldspar are quite sensitive toK:Na ratio. In this exercise both will be used to estimate the composition of an alkali feldspar.
In addition to chemical composition, alkali feldspars are characterized by their state of "order"or "disorder." Ordering phenomena can occur in any crystalline material in which two or moreions compete for symmetrically nonequivalent crystallographic sites. In monoclinic alkali feldsparsit is aluminum (AI) and silicon (Si) ions that occupy both of the crystallographically distincttetrahedral sites (named Tl and T2; see Fig. 2 of Hovis, this publication). Ordering relationships,however, are found in many other mineral series, including pyroxenes, amphiboles, and micas,and in sites other than tetrahedral ones. Because these relationships are temperature- and/orpressure-dependent, they can give important information about the conditions under which amineral has equilibrated.
The state of order in monoclinic alkali feldspars is defined by the distribution of Al and Sibetween the two tetrahedral sites. To illustrate, let us suppose that there are a total of 2000tetrahedra in a tiny feldspar crystal. Since there are equal numbers ofTl and T2 sites, 1000 ofthese would be Tl sites and 1000 would be T2 sites. Because of the 1:3 AI:Si ratio, 500 Al ionsand 1500 Si ions would occupy these sites. The most "ordered" possible monoclinic feldsparcrystal would have all 500 Al ions in one site (the Tl). The 1500 Si ions would fill the remaining500 Tl sites and all 1000 of the T2 sites. Thus, the fraction of Al ions in the Tl site (symbolizedNAl(Tl)) of such a crystal would be 0.50 (50011000), and the fraction of Al in T2 (NAl(T2}) wouldbe 0.00. On the other hand, a "perfectly disordered" crystal would have a "random" distribution ofAl and Si between the two sites (that is, the same occupancy in both sites). In such a case, 250 Al
ions and 750 Si ions would fill each site. In this case, NAl(Tl) =NAl(T2)= 0.25 (250/1 000).
A convenient way to express the AI-Si distribution of an alkali feldspar is with a singleparameter, Z, defined as twice the difference of the atom mole fractions of Al in the two tetrahedralsites (Thompson, 1969 and 1970):
Substituting into this equation the above mole fractions of AI, we see that a perfectly orderedmonoclinic feldspar would have a Z-value of 1.0 (2 times 0.50), whereas a perfectly disorderedone would have a value of 0.0 (2 times zero). Although we can relate the Z-values of any naturalsample to this range (samples with Z-values closer to 1.0 being more ordered, and those closer to0.0 more disordered), bear in mind that naturally occurring alkali feldspars seem to possessZ-values in a range from about 0.8 to 0.2; even synthetically disordered ones have Z-values ofonly 0.07 or so (Hovis, 1986). We can use X-ray data to estimate the Z-value of any monoclinicalkali feldspar.
Just as Z can be calculated from site populations, site populations can be calculated from Z.Considering Eqn. (1) above, and the fact that NA1(Tl) + NA1(T2)must sum to 0.5 in the simpleK-Na alkali feldspar system, one can use these two simultaneous equations to demonstrate that
NAl(Tl) = (1 + Z) /4NA1(T2) = (1- Z) / 4
Eqn. (2)Eqn. (3)
So, just as site populations can be used to calculate Z, Z-values can be converted to the fractions ofaluminum (and silicon) in each of the tetrahedral sites. Whether one chooses a Z-value or theindividual site populations to express the state of order is arbitrary; the two are equivalent.
For alkali feldspars, the state of order is almost solely dependent on the temperature ofequilibration, ordered samples having equilibrated at lower temperatures (e.g., hydrothermal veins)than disordered ones (e.g., volcanic phenocrysts). Because geologists are interested in theconditions to which a rock has been exposed, the temperature information that a feldspar-bearingrock might provide is potentially valuable. One must remember, however, that feldspars canre-equilibrate (become more ordered) as they cool; the environments most likely to have preservedtemperature information are either those in which cooling occurred rapidly under relatively dryconditions, or ones in which temperatures never were very high.
DATA COLLECTION
Each student should obtain a monoclinic alkali feldspar from the instructor and prepare thesample for X-ray analysis. If students have been instructed on the use of an "internal standard"(silicon makes a good one), include it in the sample, otherwise ignore the internal standard. If youdo not use an internal standard, however, your X-ray system must be relatively well aligned,because errors in 29 will produce errors in both peak positions and unit-cell dimensions.
1. Ifusing CuKa radiation, collect X-ray data from 18° to 60° 29. Ifusing another type ofradiation, adjust these values appropriately. Ifusing a diffractometer, a scan rate of 1°/minproduces better data, but rates up to SO/minmay be employed.
108
2. Measure and record the positions and intensities of as many peaks/lines as possible. If aninternal standard was mixed with the sample, correct all peak positions using data from thestandard.
3. Identify the Miller Indices of each peak/line. The data in Borg and Smith (1969) foradularia, orthoclase, and sanidine will be helpful. If you cannot determine which of thelatter data sets is most closely comparable to yours, index peaks using the data fororthoclase. Peaks also can be indexed using information in the JCPDS data base.
4. Using a lattice constant refinement program such as LCLSQ (Burnham, 1962), or the"electronic spreadsheet" of Novak and Colville (1989) or software included with anautomated X-ray system, compute the unit-cell dimensions of your sample. In making thiscalculation, you should ignore "overlapping" peaks/lines (i.e., those for which there ismore than one set of Miller Indices) should be ignored. Remember to refine the unit-celldimensions in the monoclinic crystal system.
5. Record the position of the (20 I) peak, found in the general vicinity of 21 0 29 for CuKaradiation.
PART I: COMPOSITION DETERMINATION
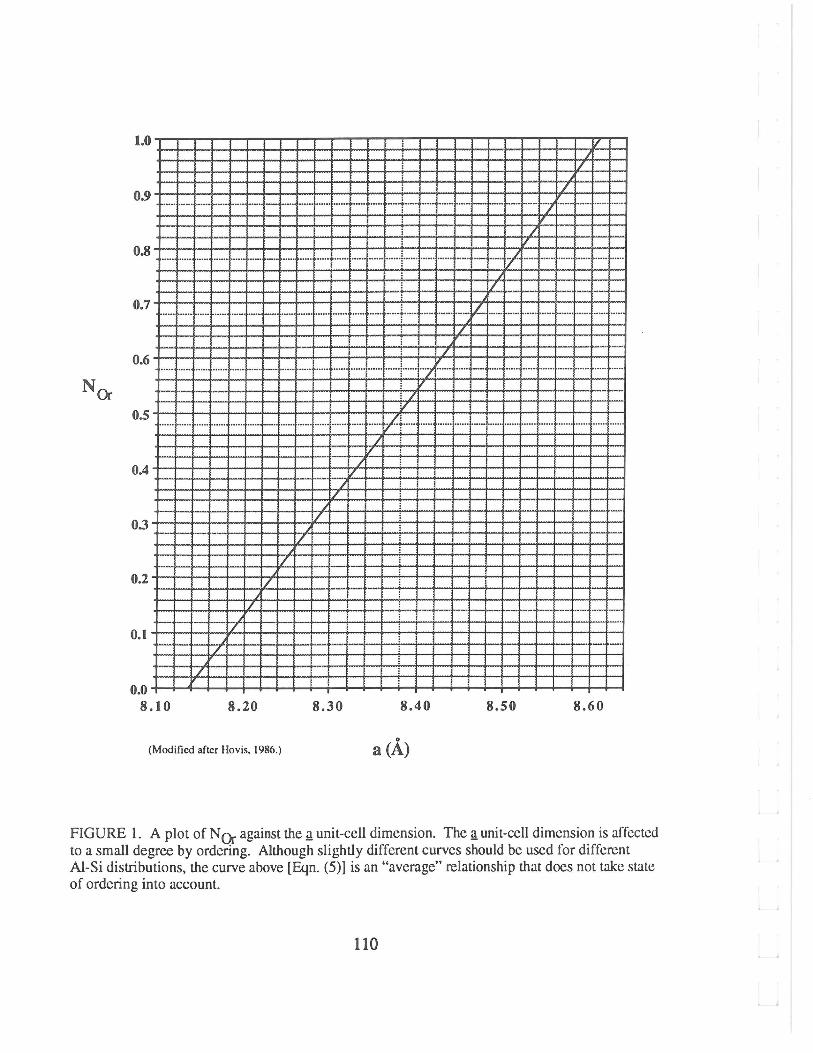
Remember that the principal chemical substitution in alkali feldspars is K = Na. As largerpotassium ions replace smaller sodium ions, the interplanar spacings (dhkl) generally increase, andas a result all three of the unit-cell axes (Q, f6 Q) expand. Of these a is the most sensitive tocomposition (Fig. 1). Furthermore, as anyone interplanar spacing increases, the ~orresponding29 decreases (a function of the Bragg equation). As an individual peak/line, the (201) isespecially sensitive to K = Na substitution, changing from about 220 29 for pure-Na feldspar to 210
for pure-K feldspar (CuKa radiation; see Fig. 3 of Hovis, this publication).
A. Use the (201) peak of your feldspar and the equation below (Hovis, 1989) to computeNOr. (Values of29 should be for CuKa radiation.)
B. Substitute the a unit-cell dimension of your feldspar into the equation below (Hovis, 1986)as a second method of computing No6 this should produce a value similar to that in Part A.
NOr = -366.3261 + 129.2335 a - 15.42053 g_2 + 0.6232109 g_3 Eqn. (5)
C. The two methods will not compare perfectly, but they should be close. How well do thetwo NOr values agree?
D. If they do not agree well, what might be the reason(s)?
PART II: DETERMINATION OF STATE OF ORDER
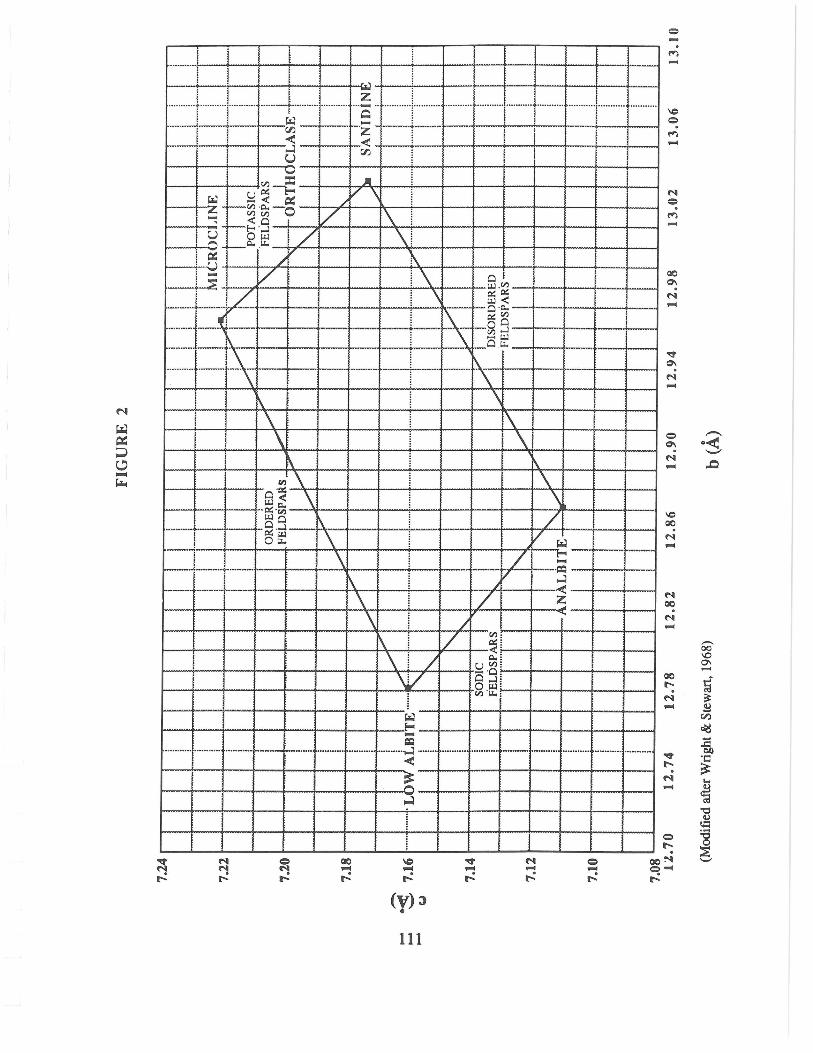
Just as with composition, peak positions and unit-cell dimensions are affected by theinterchange of Al and Si ions between T1 and T2 tetrahedral sites. At anyone composition,disorder causes the Q dimension to shorten and the b. dimension to lengthen. A plot of Q against b.
70.0 I I 4' I I I I I I I Iii iii i I : : I I I I I I I I8.10 8.20 8.30 8.40 8.50 8.60
(Modified after Hovis. 1986.) a (A.)
FIGURE I. A plot of NOr against the i!unit-cell dimension. The i!unit-cell dimension is affectedto a small degree by ordering. Although slightly different curves should be used for differentAI-Si distributions, the curve above [Eqn. (5)] is an "average" relationship that does not take stateof ordering into account.
110
I 1 I 1 J~1 ; 11 TIT : _J-l I '- + + 1 Ie1 I J., -~, _ _ _ 1 1 1 '"-L. I !;......+ .... _......... ~ ..;f- I I .-t _ Q , J _
--- '. ,_ I I _..•... r-- ; _~ I... _.. 1 t-- 1 I I_6 '-. 1 I I: \.._.. I f
to •
\~\
\
(I)
~-ec..
~.;g.I I I ..T--I ~Q ~i
~'~1 ....
\ j /v! 1 Iw ! • , tCI+-+-t-t-r.r
~
I I I I I I _.__L_I =l"'-.~ N = CIC) Ie ~ N = CIC)~N N N .... .... .... .... .... = ....r..: r..: ...: r..: ...: ...: r..: r..: r..:
(V)~•
111
=-
NCIC).N....
QK = ~bs + 0.038 (1 - NOr) Eqn. (6)
(Fig. 2; similar to Wright and Stewart, 1968, and Kroll and Ribbe, 1983) illustrates this point well;note, for example, the changes of b. and Qfor pure-K feldspars in the conversion of orthoclase(relatively ordered) to sanidine (disordered).
You will see from Figure 2 that b. and Qalso are affected by composition; both parametersexpand with increased potassium content in the feldspar. Because b. and £ are functions of bothordering and composition, neither can be used alone to determine either the state of AI-Si order orcomposition. Nevertheless, it is relatively easy to obtain the information we need. We shall takeadvantage of the fact that we now have compositional information determined in Part I.
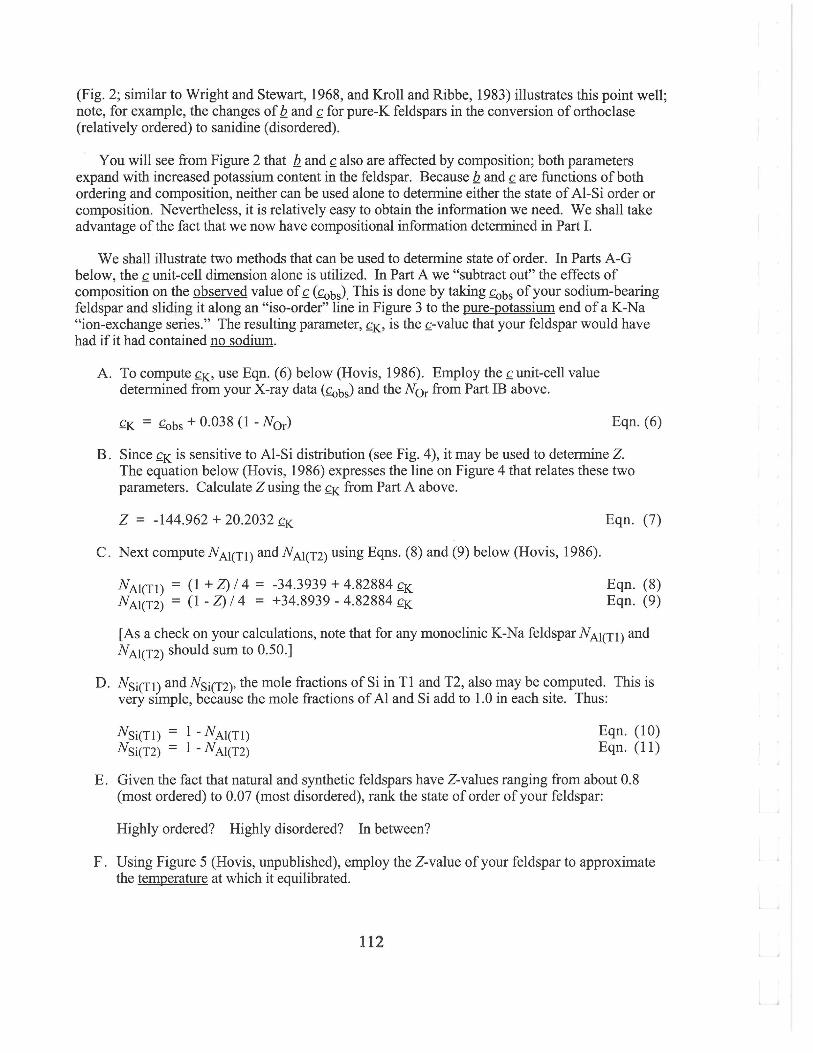
We shall illustrate two methods that can be used to determine state of order. In Parts A-Gbelow, the Qunit-cell dimension alone is utilized. In Part A we "subtract out" the effects ofcomposition on the observed value of Q (~bs). This is done by taking ~bs of your sodium-bearingfeldspar and sliding it along an "iso-order" line in Figure 3 to the pure-potassium end of a K-Na"ion-exchange series." The resulting parameter, QK,is the Q-value that your feldspar would havehad if it had contained no sodium.
A. To compute QK,use Eqn. (6) below (Hovis, 1986). Employ the Qunit-cell valuedetermined from your X-ray data (~bs) and the NOr from Part IE above.
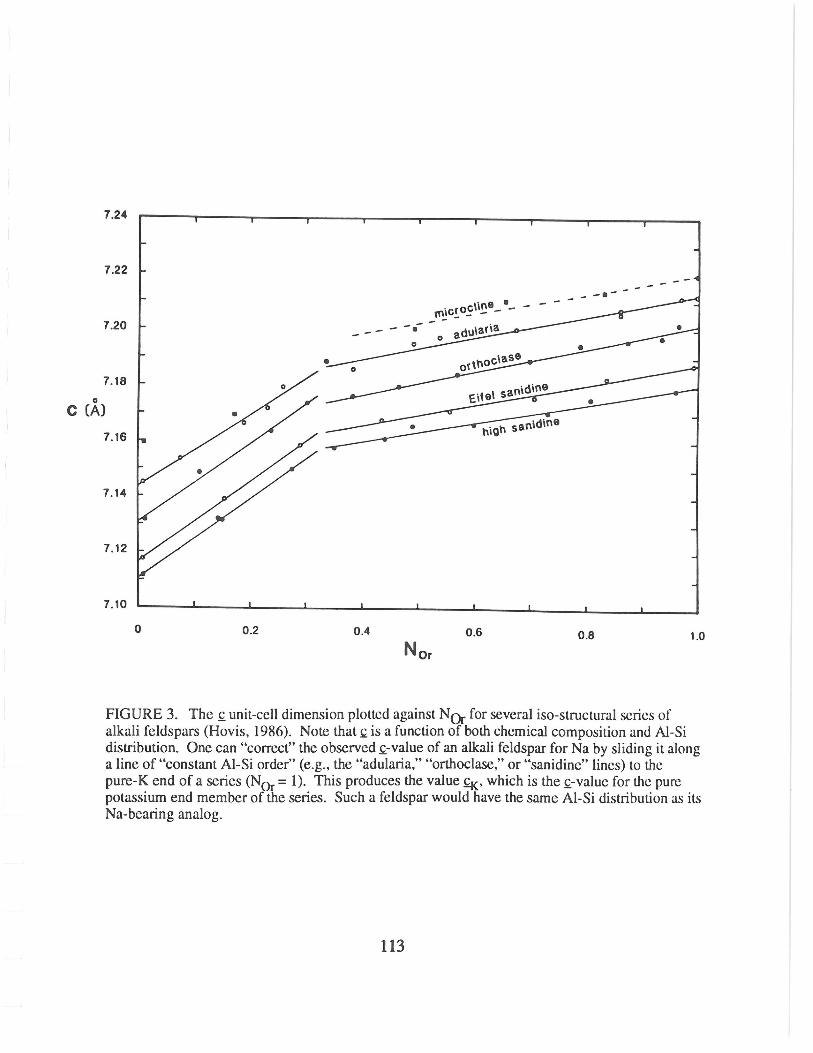
B. Since £K is sensitive to AI-Si distribution (see Fig. 4), it may be used to determine Z.The equation below (Hovis, 1986) expresses the line on Figure 4 that relates these twoparameters. Calculate Z using the QKfrom Part A above.
Z = -144.962 + 20.2032 QK Eqn. (7)
C. Next compute NAl(Tl) and NAl(T2) using Eqns. (8) and (9) below (Hovis, 1986).
[As a check on your calculations, note that for any monoclinic K-Na feldspar NAl(Tl) andNA1(T2) should sum to 0.50.]
D. NSi(Tl) and NSi(T2), the mole fractions of Si in T1 and T2, also may be computed. This isvery snnple, because the mole fractions of Al and Si add to 1.0 in each site. Thus:
NSi(Tl) = 1 - NA1(Tl)NSi(T2) = 1 - N Al(T2)
Eqn. (10)Eqn. (11)
E. Given the fact that natural and synthetic feldspars have Z-values ranging from about 0.8(most ordered) to 0.07 (most disordered), rank the state of order of your feldspar:
Highly ordered? Highly disordered? In between?
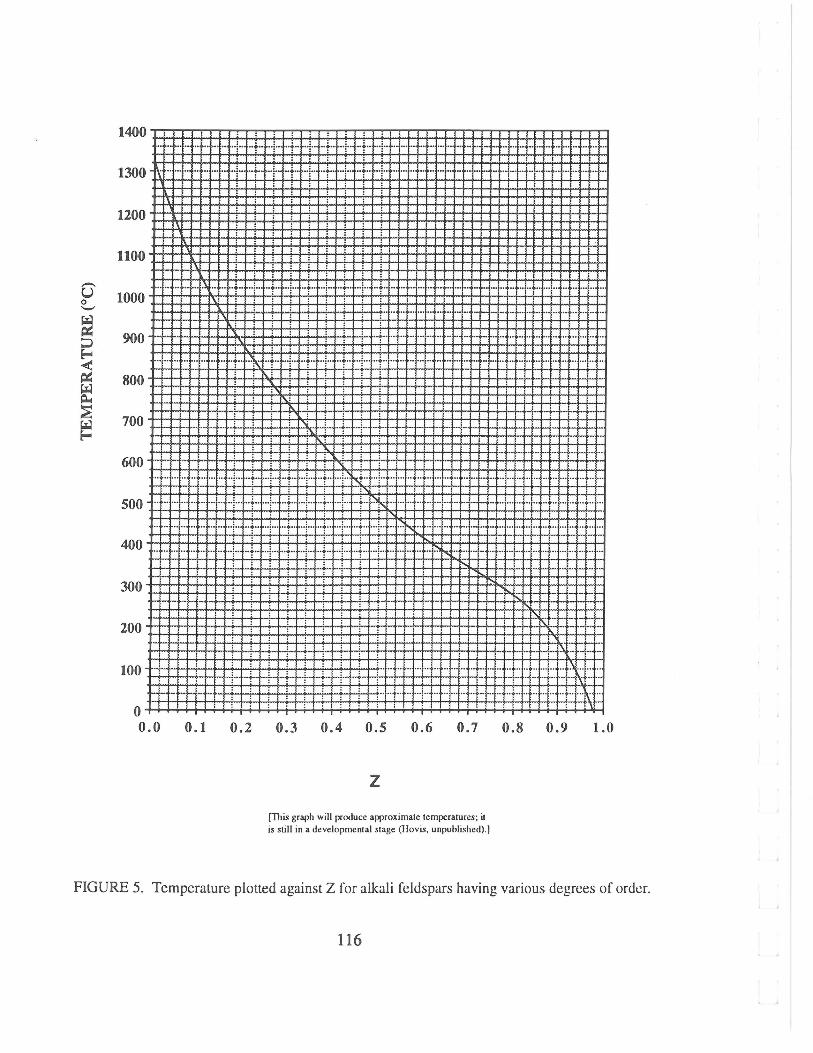
F. Using Figure 5 (Hovis, unpublished), employ the Z-value of your feldspar to approximatethe temperature at which it equilibrated.
112
7.22
7.24
7.20
7.18
oC CA)
7.16
7.12
7.14
7.10
o 0.2 0.4 0.6 0.8 1.0
FIGURE 3. The.£ unit-cell dimension plotted against NOr for several iso-structural series ofalkali feldspars (Hovis. 1986). Note that ~ is a function of both chemical composition and Al-Sidistribution. One can "correct" the observed ~-value of an alkali feldspar for Na by sliding it alonga line of "constant AI-Si order" (e.g., the "adularia," "orthoclase," or "sanidine" lines) to thepure-K end of a series (NOr = 1). This produces the value £K. which is the .£-value for the purepotassium end member of the series. Such a feldspar would have the same AI-Si distribution as itsNa-bearing analog.
113
z
o
oo
•
7.23
0.1
• Monoclinic feldspars
FIGURE 4. Plot of Z against £K for alkali feldspars having various degrees of order (Hovis,1986). Separate (light dashed) lines represent data for feldspars with triclinic and monoclinicAI-Si distributions; however, these have virtually the same slope. The heavy line is based on datafor all feldspars and is expressed by Eqn. (7).
0.2
0.3
0.4
0.5
0.6
o0.7 •
0.8
o Triclinic feldspars
0.9
1.0
7.16 7.17 7.18 7.19 7.20 7.227.21
114
G. Is it more likely that your alkali feldspar came from a (a) hydrothermal vein, (b) pegmatite,or (c) high-temperature lava?
Research on the use of unit-cell dimensions to estimate AI-Si distribution in alkali feldspars hasbeen pioneered by a number of workers, including Wright and Stewart (1968), Stewart and Ribbe(1969), and Kroll and Ribbe (1983). A commonly used method for simultaneously estimatingboth the composition and state of order of an alkali feldspar is to plot its k unit-cell dimension (thatis, ~bs) against its b. dimension:
H. Plot on Figure 2 the b. versus the Q (~bs) unit-cell dimension of your feldspar.
I. Does the position of the plotted point make sense for the NOr and AI-Si distributioncomputed above for your feldspar? Briefly discuss.
PART III: MOLAR VOLUME AND DENSITY DETERMINATION
Volume and density are important properties of minerals and rocks. Molar volume, the spaceoccupied by one "mole" of a substance, relates closely to the conditions of stability of a mineral; aspressure increases with depth in the Earth, materials that occupy less volume are favored. Densitytoo is a fundamental property of any material and an important parameter to which geophysicistsrelate both gravity and seismic data. It is density differences among materials that help geologistsinterpret the structure and composition of rocks that exist below the Earth's surface. The molarvolume of a mineral can be determined directly from X-ray data, and with accompanying chemicalinformation density also can be estimated.
The output from the unit-cell dimension calculations should include information on unit-cellvolume, that is, the volume occupied by one unit cell of your feldspar. Since there are fourformula units in each unit cell, you can easily compute how much volume one formula unit takesup. If you multiply the latter number by Avogadro's constant (6.022 X 10²³), you would knowhow much volume one mole of your feldspar occupies (molar volume). All that remains, then, isto convert volume in A3 to volume inmore familiar units of cm-' (a conversion factor of 10-24). Allthese conversions can be accomplished simultaneously by multiplying unit-cell volume by0.15055. Then, once you know molar volume, you can take advantage of chemical information tocompute density. Just follow the instructions below.
A. Multiply the unit-cell volume (A3/unit cell) by 0.15055 to convert to molar volume incm-/mole.
B. Write out the chemical formula determined in Part IE above, based upon eight oxygens.Now take the atomic weights of chemical elements in the formula (K, Na, AI, Si, and 0)and multiply each by the relevant subscript, then add the resulting five numbers. This sumis the gram formula weight, that is the weight of one mole, of your feldspar.
c. You now know both the volume (Part A) and the weight (Part B) of one mole of yourfeldspar. In order to compute its density, simply divide the gram formula weight (glmole)by the molar volume (cm-/mole). Note that the resulting units will be in g/cm-'.
900 1! tIll t t fN t I fill t t II t I j I H·++·!·++++-++t+·!·++·I+·j·..!·+++++-J························,··f::r\++++:·!··f·· ··f::r::F::f::!··~········~···~········~···~..•··•..~···h ~ ~..•..•.. " ~..•..
. I . t . I . j . I . j . I : I ..........~ "' ,..•..: ··f.. .,;,.. ··f·· ..-i- •• ··f·· ..-i- ••• ,!,. ···:··t··i··~···. . . . ~ . ~ . .400 l·f··I ...I..ll·j..·'··i ..l·..I..t..t··l..l-f··t..l..f ..f ..j· ..l··P ..I...j..f ..j..·!..1..f.t4U ..I···I..l·f··I ..·I..f.·t·.{..! ..j·..I·-i--f··j···,
o mt ! 11tit I ! 1111111! ! till tllllllllllllllllllllll""hH0.0 0.1 0.60.2 0.3 0.4 0.5 0.7 0.8 0.9 1.0
z[This graph will produce approximate temperatures; itis still in a developmental stage (Hovis. unpublishcdj.]
FIGURE 5. Temperature plotted against Z for alkali feldspars having various degrees of order.
116
D. Check the density (or specific gravity) of alkali feldspar (or microcline, orthoclase, orsanidine) in an appropriate reference book, such as your Mineralogy textbook. What valueis given?
How does your value compare? [It should be close; ifit isn't, check your calculations.]
E. How does the density of an alkali feldspar compare to those of minerals such as forsterite(olivine), enstatite (pyroxene), and pyrope (garnet)?
F. Based on the comparison made in Part E, would you expect alkali feldspars to be moreabundant in the Earth's crust or the Earth's mantle?
REFERENCES CITED
Borg, LY., and Smith, D.K. (1969) Calculated X-ray powder patterns for silicate minerals.Geological Society of America Memoir 122, 896 pp.
Burnham, C.W. (1962) Lattice constant refinement. Carnegie Institution of Washington YearBook 61, 132-135.
Hovis, G.L. (1986) Behavior of alkali feldspars: Crystallographic properties and characterizationof composition and AI-Si distribution. American Mineralogist, 71, 869-890.
Hovis, G.L. (1989) Effect of AI-Si distribution on the X-ray powder diffraction maxima of alkalifeldspars and an easy method to determine T1 and T2 site occupancies. Canadian Mineralogist,27, 107-118.
Kroll, H., and Ribbe, P.H. (1983) Lattice parameters, composition, and AI,Si order in alkalifeldspars. In P. H. Ribbe, Ed., Feldspar Mineralogy, 57-99. Mineralogical Society of AmericaReviews in Mineralogy, 2 (2nd edition).
Novak, G.A., and Colville, A.A. (1989) A practical interactive least-squares cell-parameterprogram using an electronic spreadsheet and a personal computer. American Mineralogist, 74,488-490.
Stewart, D.B., and Ribbe, P.H. (1969) Structural explanation for variations in cell parameters ofalkali feldspar with AliSi ordering. American Journal of Science, 267-A, 444-462.
Thompson,1. B., Jr. (1969) Chemical reactions in crystals. American Mineralogist, 54, 341-375.
Thompson, 1. B., Jr. (1970) Chemical reactions in crystals: Corrections and clarification.American Mineralogist, 55, 528-532.
Wright, T.L., and Stewart, D.B. (1968) X-ray and optical study of alkali feldspar: LDetermination of composition and structural state from refined unit-cell parameters and 2V.American Mineralogist, 53, 38-87.
117
NOTES TO THE INSTRUCTOR
1. It is important that the feldspar you give each student is monoclinic. To differentiate orthoclaseand sanidine (monoclinic) from rnicrocline (triclinic), compare X-ray data between 18° and 35°29 (CuKa radiation) using Borg and Smith (1969) or other data.
2. It also is important to give students single-phase specimens. To identify perthitic samples,look at the (201) peak; for two-phase specimens the latter will be double, or very broad.
3. The best material for highly ordered K-feldspar is probably "adularia," such as the Swiss veindeposits. Be careful, though, in some cases these are triclinic.
Single-phase intermediately-ordered orthoclase can be hard to find, because in plutonic(including pegmatitic) environments it often re-equilibrates to micro cline during cooling.The Benson pegmatite in New York provides good material, and the yellowish or greenishorthoclases from Madagascar pegmatites are excellent. As highly potassic materials, thesefeldspars beat mother nature by hitting the solvus at a temperature that was too low forexsolution to occur.
Highly disordered sanidine can be obtained from phenocrysts in lavas, or you can synthesize ityourself by cooking K-rich feldspar at l050°C for about three weeks.
4. If your X-ray system is out of alignment, the resulting unit-cell dimensions will be in error.Obviously, this will adversely affect the results.
5. In addition to (or in place of) the equations given, you also can have your students graphicallydetermine parameters such as NOr> QK, and Z from the figures.
6. Obviously, this exercise is fairly sophisticated. However, my students have done well with it.One place you might have to help them is with inspection ofthe X-ray data once the unit-celldimensions have been calculated, showing them what to look for in the way of mistakes. Ifin calculating unit-cell dimensions a student has made a mistake in typing a 28 value (e.g.,21.148° instead of 20.148°), or in indexing a peak, it is likely to have very significantconsequences on the results. So, it would be good to check on quality somewhere along theline, or to give students an idea of how to identify mistakes, e.g., by looking at "residuals"(calculated versus observed peak positions), or by inspecting the magnitudes of the "standarderrors" that the calculations produce).
7. Remember that some feldspars re-equilibrate as they cool, especially in slow-coolingenvironments. Therefore, I have been careful to communicate the concept that AI-Sidistribution represents the temperature of "equilibration" as opposed to the temperature of"formation. "