Page 1
DETERMINATION OF CONTACT ANGLES OF POWDERS BY
CAPILLARIC DEWATERING OF FILTER CAKES
A THESIS SUBMITTED TO
THE GRADUATE SCHOOL OF NATURAL AND APPLIED SCIENCES
OF
MIDDLE EAST TECHNICAL UNIVERSITY
BY
ÖZLEM DENİZ ERATAK
IN PARTIAL FULFILLMENT OF THE REQUIREMENTS
FOR
THE DEGREE OF MASTER OF SCIENCE
IN
DEPARTMENT OF MINING ENGINEERING
JANUARY 2005
Page 2
I hereby declare that all information in this document has been obtained and presented in accordance with academic rules and ethical conduct. I also declare that, as required by these rules and conduct, I have fully cited and referenced all material and results that are not original to this work.
Name, Last name :
Signature :
iii
Page 3
ABSTRACT
DETERMINATION OF CONTACT ANGLES OF POWDERS BY
CAPILLARIC DEWATERING OF FILTER CAKES
Eratak, Özlem Deniz
M. Sc., Department of Mining Engineering
Supervisor: Prof. Dr. Çetin Hoşten
January 2005, 140 pages
Solid-liquid contact angle is an important parameter in many particulate processes
of the mineral, ceramic and chemical industries. In particular, modification of the
contact angle through surface active agents plays a crucial role in froth flotation
of minerals. In the case of flat solid surfaces, direct measurement of the contact
angle is possible. However, such flat surfaces can not be obtained with finely
divided solids typically encountered in flotation applications. Then, indirect
methods based on powder beds as thin layers of powders deposited on glass
plates or packed columns are used for the determination of apparent contact
angles.
This thesis presents an alternative novel method based on the capillaric
dewatering of filter cakes for the measurement of the receding contact angle and
correlates the contact angles measured as such with column wicking and micro-
flotation test results of zircon and rutile mineral particles. The experimental
procedure is simple and fast. The results have proven that the proposed method is
reliable and give a good measure of the contact angle in the absence and presence
of surface active non-wetting agents.
Keywords: Contact Angle, Cake Dewatering, Column Wicking, Microflotation
iv
Page 4
ÖZ
FİLTRE KEKLERİNİN SUSUZLANDIRILMASI ÖZELLİKLERİNDEN
YARARLANARAK KATI TANECİKLERİNİN SIVILARLA TEMAS
AÇILARININ BELİRLENMESİ
Eratak, Özlem Deniz
Yüksek Lisans, Maden Mühendisliği Bölümü
Tez Yöneticisi: Prof. Dr. Çetin Hoşten
Ocak 2005, 140 sayfa
Katı-sıvı temas açısı, bir çok mineral,seramik ve kimya endüstrilerinin katı
tanecikli işlemlerinde önemli bir parametredir. Özellikle de, yüzey aktif
reaktiflerin ilavesi ile değişen temas açısı, minerallerin köpüklü flotasyonunda
çok önemli bir rol oynar. Katı yüzeyi düz olduğu takdirde, temas açısının
doğrudan ölçümü mümkündür. Ancak, bu tür düz yüzeylere, flotasyon
uygulamalarında toz haline gelmis katılarda rastlamak mümkün değildir. Bu
durumda, temas açıları ince tane yataklarına veya kolonlarına dayanan
yöntemlerle dolaylı olarak belirlenir.
Bu tezde, temas açısı ölçümü için filtre keklerinin kapiler susuzlandırılmasına
dayanan yeni bir yöntem önerilmekte ve sonuçları kolona emme ve mikro
flotasyon yöntemleri ile karşılaştırılmaktadır. Deneysel yöntem basit ve hızlı olup
elde edilen sonuçlar, yüzey aktif maddelerin yokluğunda veya varlığında
güvenilir temas açısı değerleri verdiğini göstermiştir.
Anahtar Kelimaler: Temas Açısı, Filtre Keki Susuzlandırma, Kolona Emme,
Mikro Flotasyon
v
Page 5
To My Grandparents
vi
Page 6
ACKNOWLEDGEMENTS
I wish to express my deepest gratitude to my supervisor Prof. Dr. Çetin Hoşten
for his valuable advice and guidance of this work. I wish also to express my
special thanks and gratitude to Prof. Dr. Ali İhsan Arol, Prof. Dr. Cahit
Hiçyılmaz, Prof. Dr. Gülhan Özbayoğlu and Prof. Dr. Ümit Atalay for their
suggestions and comments.
I want to express my appreciation to my friend Ayşe Yasemin Yeşilay for
sharing her ideas with me, helping me for this thesis and her great friendship
and I wish also to express my thanks to research assistants for their help.
I wish to thank to technical staff of Department of Mining Engineering,
especially Tahsin Işıksal, Tuncer Gençtan, Mehmet Çakır, Aytekin Arslan and
İsmail Kaya.
I would like to sincerely thank to my family for their support and help
throughout this job.
Especially, I would like to give my special thanks to Hidayet Doğan for his
support, patience, partnership and understanding
The grant provided by the research fund of the Middle East Technical
University through the project BAP-2002-03-05-01 is gratefully
acknowledged.
vii
Page 7
TABLE OF CONTENTS
PLAGIARISM................................................................................... iii
ABSTRACT ...................................................................................... iv
ÖZ ...................................................................................................... v
ACKNOWLEDGEMENTS ............................................................ vii
TABLE OF CONTENTS ................................................................ viii
LIST OF TABLES ........................................................................... x
LIST OF FIGURES ......................................................................... xx
CHAPTER
INTRODUCTION ............................................................................ 1
1.1 Objective of Thesis ...................................................................... 4
THEORETICAL BACKGROUND ............................................... 5
2.1 General ......................................................................................... 5
2.2 Contact Angle and Wetting .......................................................... 5
2.2.1 Adhesion, cohesion and spreading .................................... 8
2.2.2 Critical surface tension of wetting .................................... 9
2.3 Contact Angle Measurements ...................................................... 10
2.3.1 Direct measurements of contact angle .............................. 10
2.3.2 Column wicking method ................................................... 11
2.3.3 Thin layer wicking method ............................................... 12
2.3.4 Hysteresis in contact angle ............................................... 13
2.4 The theory of the proposed method of contact angle
measurement ...................................................................................... 15
EXPERIMENTAL MATERIAL AND METHODS ..................... 18
3.1 Preparation of Samples ................................................................ 18
viii
Page 8
3.2 Reagents ....................................................................................... 19
3.3 Experimental Procedure and Methods ......................................... 19
3.3.1 Dewatering of filter cakes ................................................. 19
3.3.2 Column Wicking ............................................................... 20
3.3.3 Microflotation Experiments .............................................. 22
EXPERIMENTAL RESULTS AND DISCUSSION ..................... 23
4.1 Capillaric dewatering experiments ............................................... 23
4.1.1 Experiments with zircon ................................................... 23
4.1.2 Experiments with Rutile ................................................... 32
4.2 Column Wicking Experiments ..................................................... 38
4.3 Microflotation Experiments ......................................................... 48
CONCLUSIONS .............................................................................. 52
REFERENCES ................................................................................. 54
APPENDICES .................................................................................. 58
ix
Page 9
LIST OF TABLES
4.1. The contact angle and k.cosθ values for the zircon sample as
obtained from cake dewatering tests using water-methanol
mixtures..................................................................................................
28
4.2. The contact angle and k.cosθ values from the cake dewatering
experiments with -150+200 mesh zircon by using 10-5 M
dodecylamine at various pH values of the solution. ..............................
30
4.3. The contact angle and k.cosθ values for the rutile sample as
obtained from cake dewatering tests using water-methanol mixtures....
37
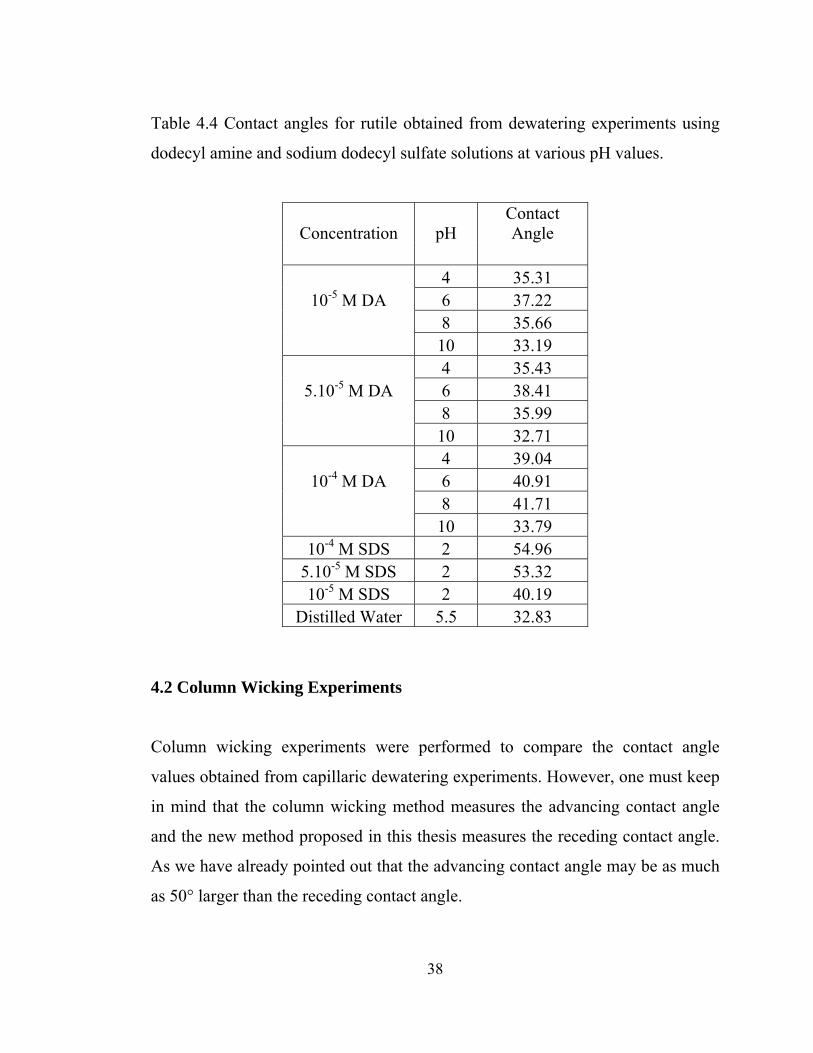
4.4. Contact angles for rutile obtained from dewatering experiments
using dodecyl amine and sodium dodecyl sulfate solutions at various
pH values................................................................................................
38
4.5. The advancing and receding contact angles of zircon with water-
methanol mixtures in the column wicking experiments.........................
42
4.6. The advancing and receding contact angles of rutile with water-
methanol mixtures in the column wicking experiments.........................
42
4.7. The advancing and receding contact angles of zircon from
column wicking (θA) and cake dewatering experiments (θR)...............
44
4.8. The advancing and receding contact angles of rutile from column
wicking (θA) and cake dewatering experiments (θR)............................
47
A 1. -100+200 mesh quartz experimented with methanol...................... 58
A.2. -100+200 mesh quartz experimented with water............................ 58
A.3. -100+200 mesh quartz experimented with 80% methanol............. 59
A.4. -100+200 mesh quartz experimented with 65% methanol............. 59
A.5. -100+200 mesh quartz experimented with 50% methanol............. 60
x
Page 10
A.6. -100+200 mesh quartz experimented with 40% methanol............. 60
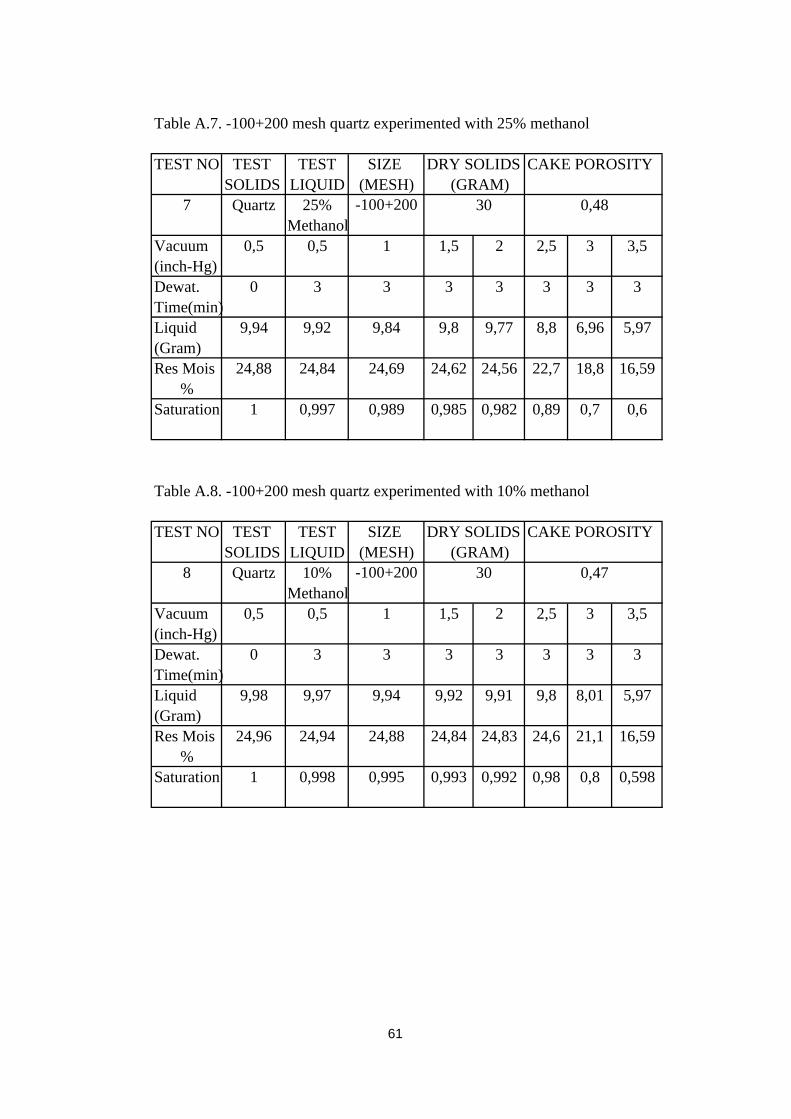
A.7. -100+200 mesh quartz experimented with 25% methanol............. 61
A.8. -100+200 mesh quartz experimented with 10% methanol............. 61
A.9. -100+200 mesh quartz experimented with water............................ 62
A.10. -200+400 mesh quartz experimented with water.......................... 62
A.11. -100+200 mesh quartz experimented with hexane....................... 63
A.12. -100+200 mesh quartz experimented with hexane....................... 63
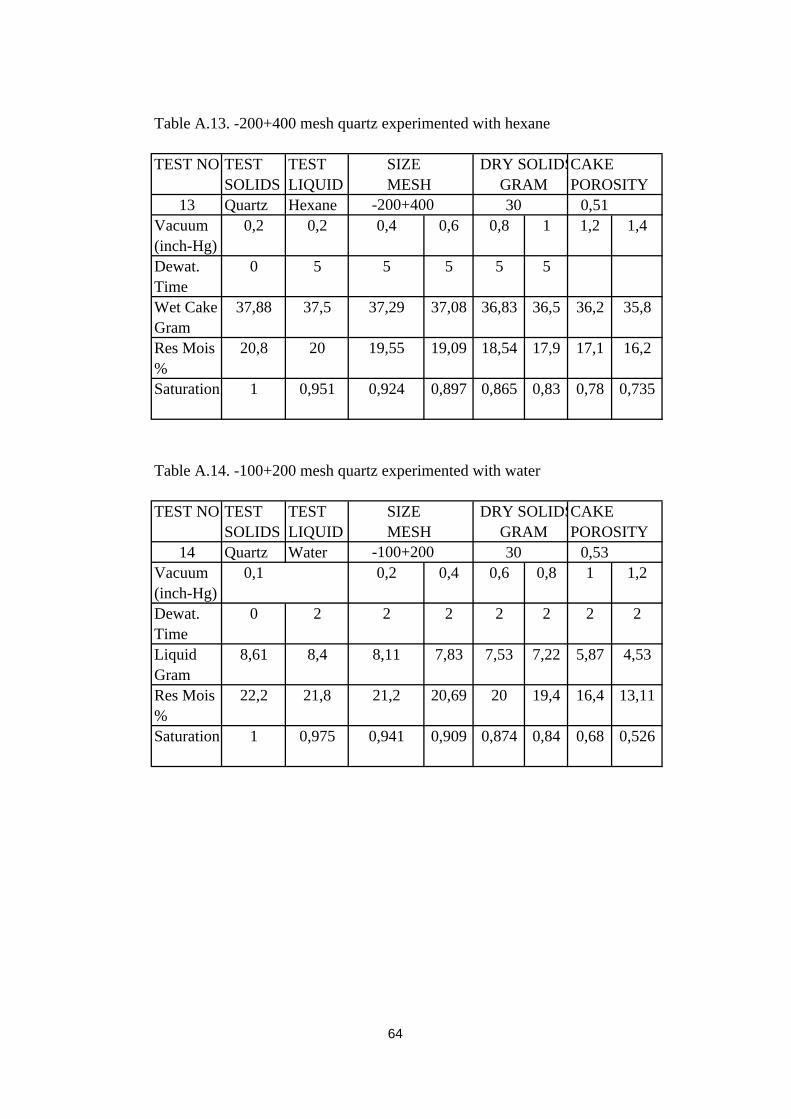
A.13. -200+400 mesh quartz experimented with hexane....................... 64
A.14. -100+200 mesh quartz experimented with water.......................... 64
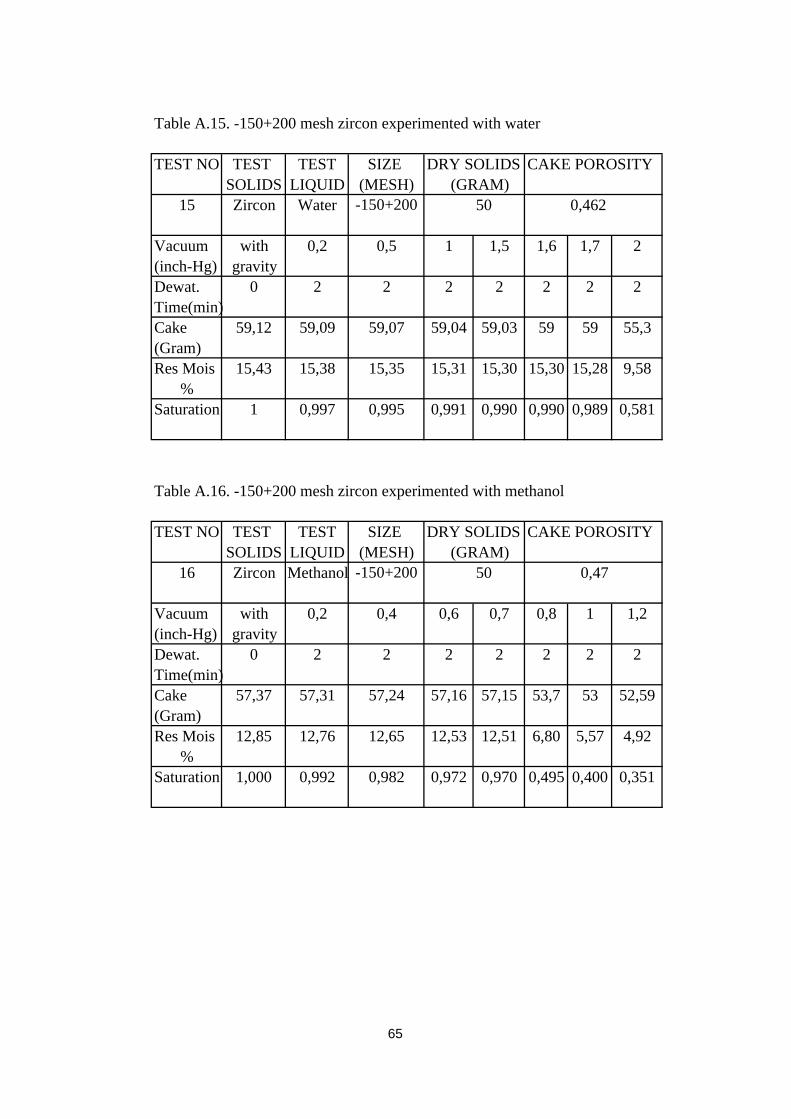
A.15. -150+200 mesh zircon experimented with water.......................... 65
A.16. -150+200 mesh zircon experimented with methanol.................... 65
A.17. -150+200 mesh zircon experimented with methanol.................... 66
A.18. -150+200 mesh zircon experimented with 10% methanol........... 66
A.19. -150+200 mesh zircon experimented with 10% methanol........... 67
A.20. -150+200 mesh zircon experimented with 25% methanol........... 67
A.21. -150+200 mesh zircon experimented with 25% methanol........... 68
A.22. -150+200 mesh zircon experimented with 40% methanol........... 68
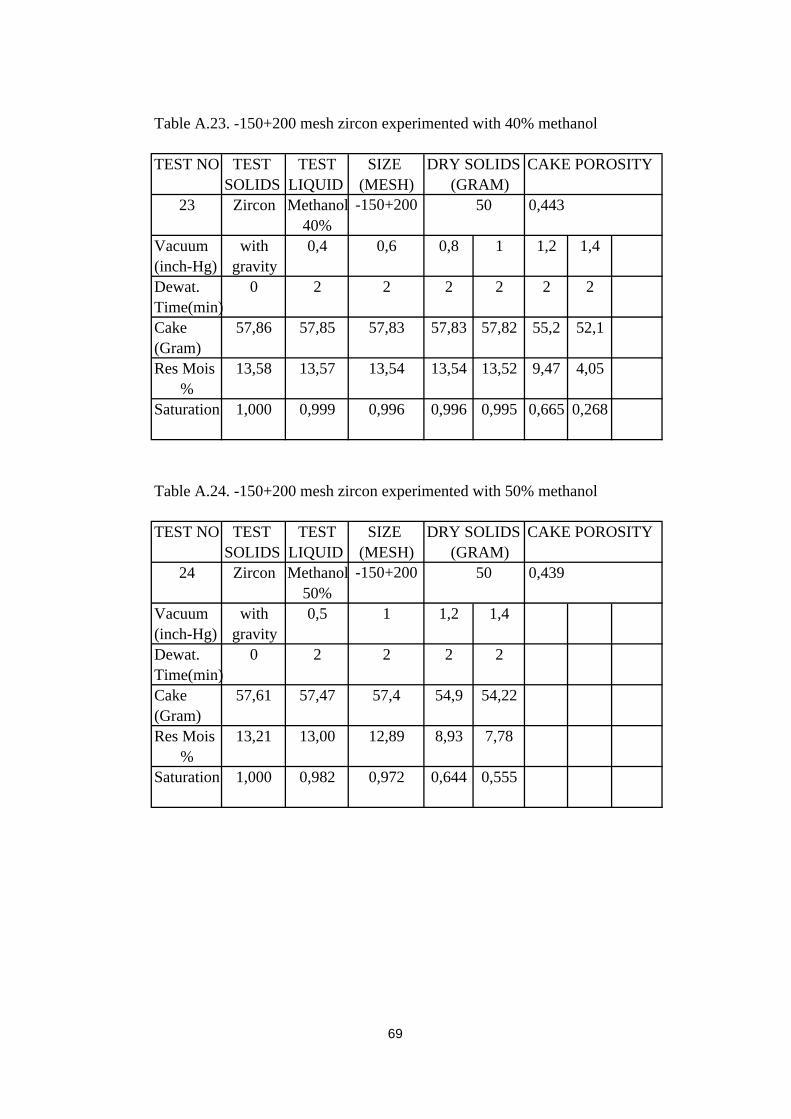
A.23. -150+200 mesh zircon experimented with 40% methanol........... 69
A.24. -150+200 mesh zircon experimented with 50% methanol........... 69
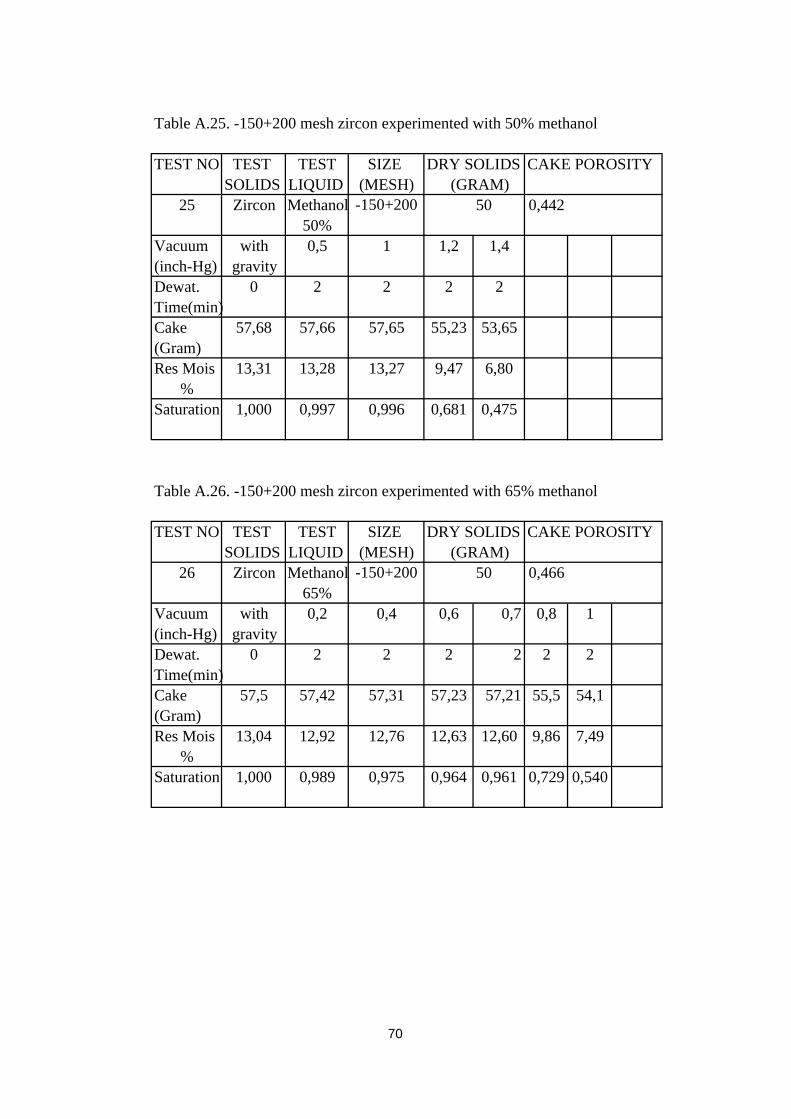
A.25. -150+200 mesh zircon experimented with 50% methanol........... 70
A.26. -150+200 mesh zircon experimented with 65% methanol........... 70
A.27. -150+200 mesh zircon experimented with 65% methanol........... 71
A.28. -150+200 mesh zircon experimented with 80% methanol........... 71
A.29. -150+200 mesh zircon experimented with 80% methanol........... 72
A.30. -150+200 mesh zircon experimented with 5.10-5 M DA at
pH 4.......................................................................................................
72
A.31. -150+200 mesh zircon experimented with 5.10-5 M DA at
pH 4.......................................................................................................
73
xi
Page 11
A.32. -150+200 mesh zircon experimented with 5.10-5 M DA at
pH 6.......................................................................................................
73
A.33. -150+200 mesh zircon experimented with 5.10-5 M DA at
pH 6....................................................................................................... 74
A.34. -150+200 mesh zircon experimented with 5.10-5 M DA at pH 8 74
A.35. -150+200 mesh zircon experimented with 5.10-5 M DA at
pH 10......................................................................................................
75
A.36. -150+200 mesh zircon experimented with 5.10-5 M DA at
pH 10......................................................................................................
75
A.37. -150+200 mesh zircon experimented with 10-5 M DA at pH 4... 76
A.38. -150+200 mesh zircon experimented with 10-5 M DA at pH 4... 76
A.39. -150+200 mesh zircon experimented with 10-5 M DA at pH 6... 77
A.40. -150+200 mesh zircon experimented with 10-5 M DA at pH 6... 77
A.41. -150+200 mesh zircon experimented with 10-5 M DA at pH 8... 78
A.42. -150+200 mesh zircon experimented with 10-5 M DA at pH 8... 78
A.43. -150+200 mesh zircon experimented with 10-5 M DA at pH 10. 79
A.44. -150+200 mesh zircon experimented with 10-5 M DA at pH 10. 79
A.45. -150+200 mesh zircon experimented with 10-4 M SDS at pH 2.. 80
A.46. -150+200 mesh zircon experimented with 10-4 M SDS at pH 4.. 80
A.47. -150+200 mesh zircon experimented with 10-4 M SDS at pH 6.. 81
A.48. -150+200 mesh zircon experimented with 10-4 M SDS at pH 8.. 81
A.49. -150+200 mesh zircon experimented with 5.10-5 M SDS at
pH 2.........................................................................................................
82
A.50. -150+200 mesh zircon experimented with 5.10-5 M SDS at
pH 4.........................................................................................................
82
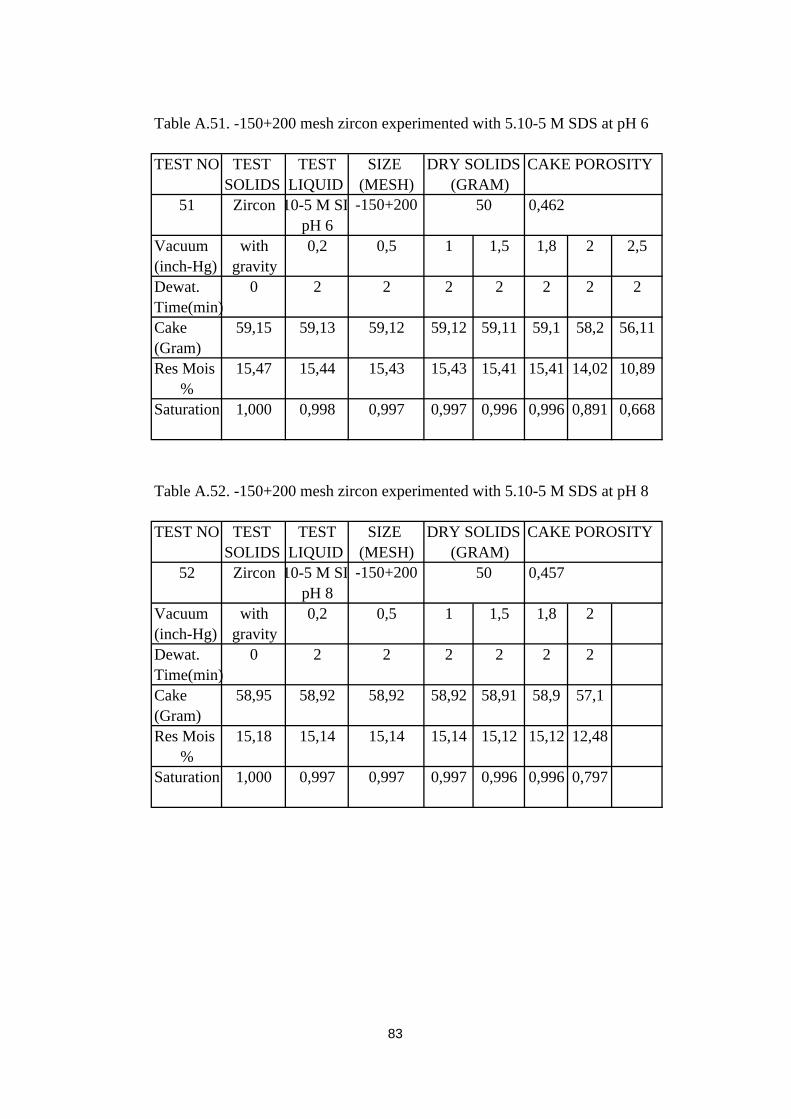
A.51. -150+200 mesh zircon experimented with 5.10-5 M SDS at
pH 6.........................................................................................................
83
xii
Page 12
A.52. -150+200 mesh zircon experimented with 5.10-5 M SDS at
pH 8......................................................................................................... 83
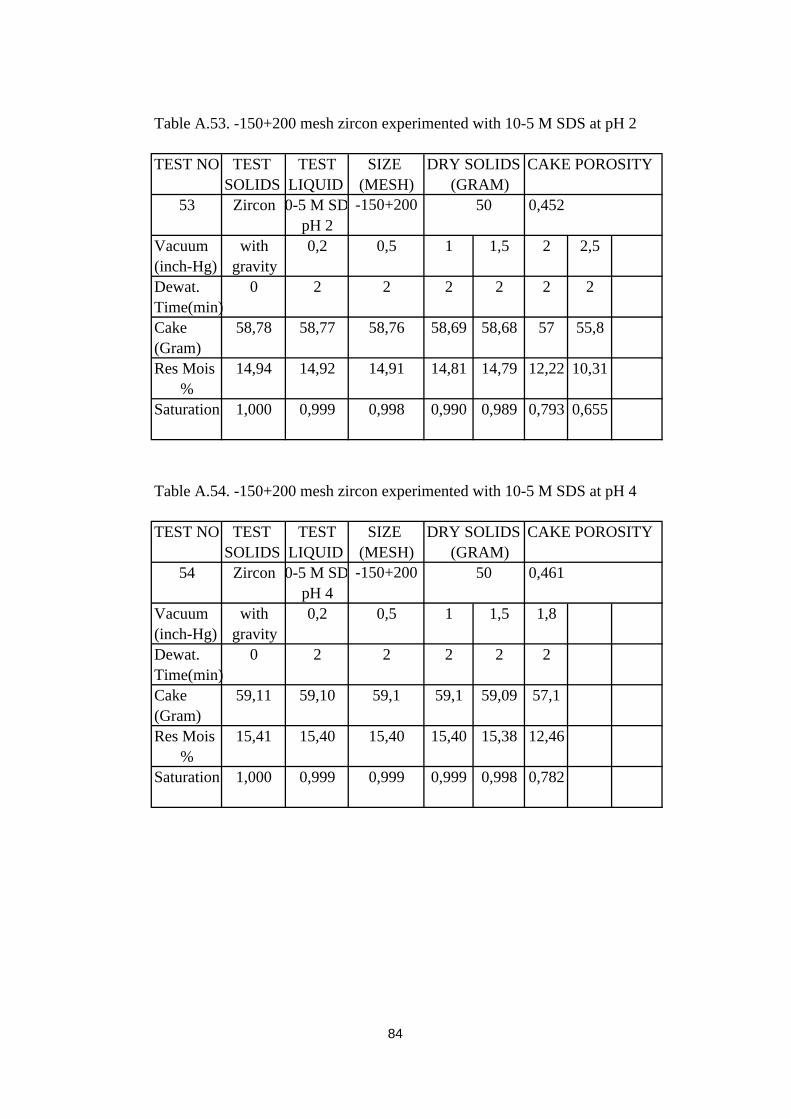
A.53. -150+200 mesh zircon experimented with 10-5 M SDS at pH 2.. 84
A.54. -150+200 mesh zircon experimented with 10-5 M SDS at pH 4.. 84
A.55. -150+200 mesh zircon experimented with 10-5 M SDS at pH 6.. 85
A.56. -150+200 mesh zircon experimented with 10-5 M SDS at pH 8.. 85
A.57. -150+200 mesh rutile experimented with water........................... 86
A.58. -150+200 mesh rutile experimented with water........................... 86
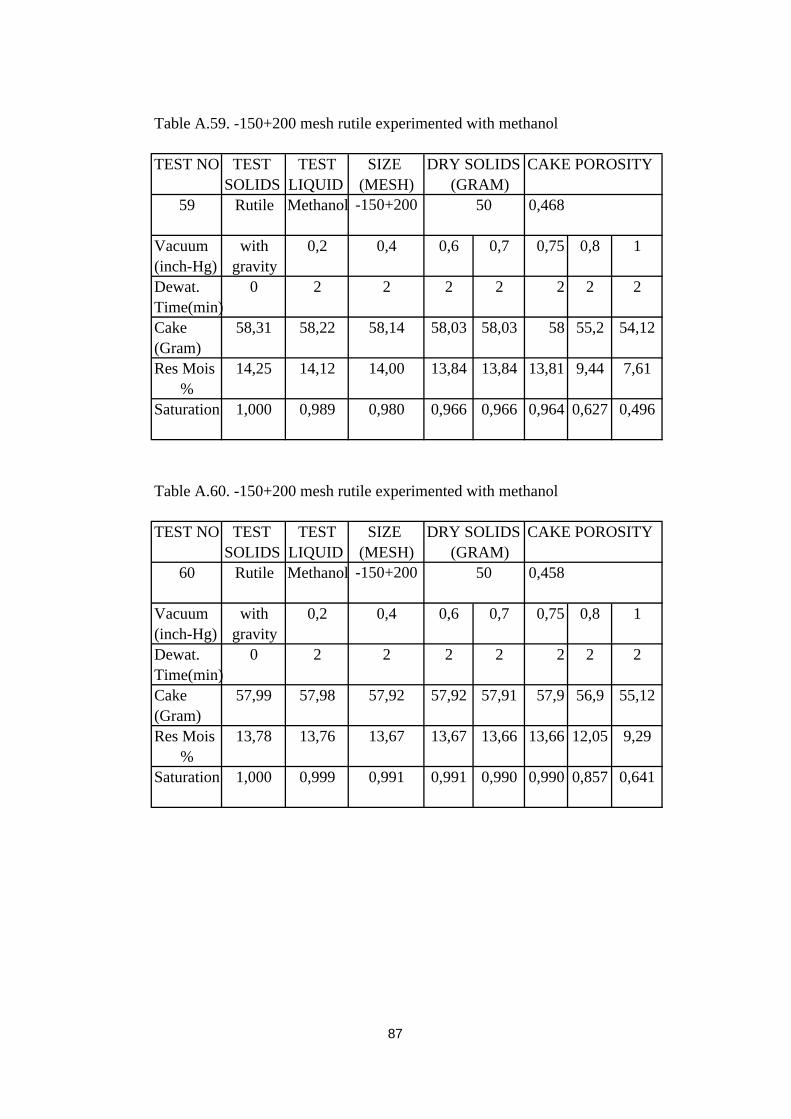
A.59. -150+200 mesh rutile experimented with methanol..................... 87
A.60. -150+200 mesh rutile experimented with methanol..................... 87
A.61. -150+200 mesh rutile experimented with 10% methanol............. 88
A.62. -150+200 mesh rutile experimented with 10% methanol............. 88
A.63. -150+200 mesh rutile experimented with 25% methanol............. 89
A.64. -150+200 mesh rutile experimented with 25% methanol............. 89
A.65. -150+200 mesh rutile experimented with 40% methanol............. 90
A.66. -150+200 mesh rutile experimented with 40% methanol............. 90
A.67. -150+200 mesh rutile experimented with 50% methanol............. 91
A.68. -150+200 mesh rutile experimented with 50% methanol............. 91
A.69. -150+200 mesh rutile experimented with 65% methanol............. 92
A.70. -150+200 mesh rutile experimented with 65% methanol............. 92
A.71. -150+200 mesh rutile experimented with 80% methanol............. 93
A.72. -150+200 mesh rutile experimented with 80% methanol............. 93
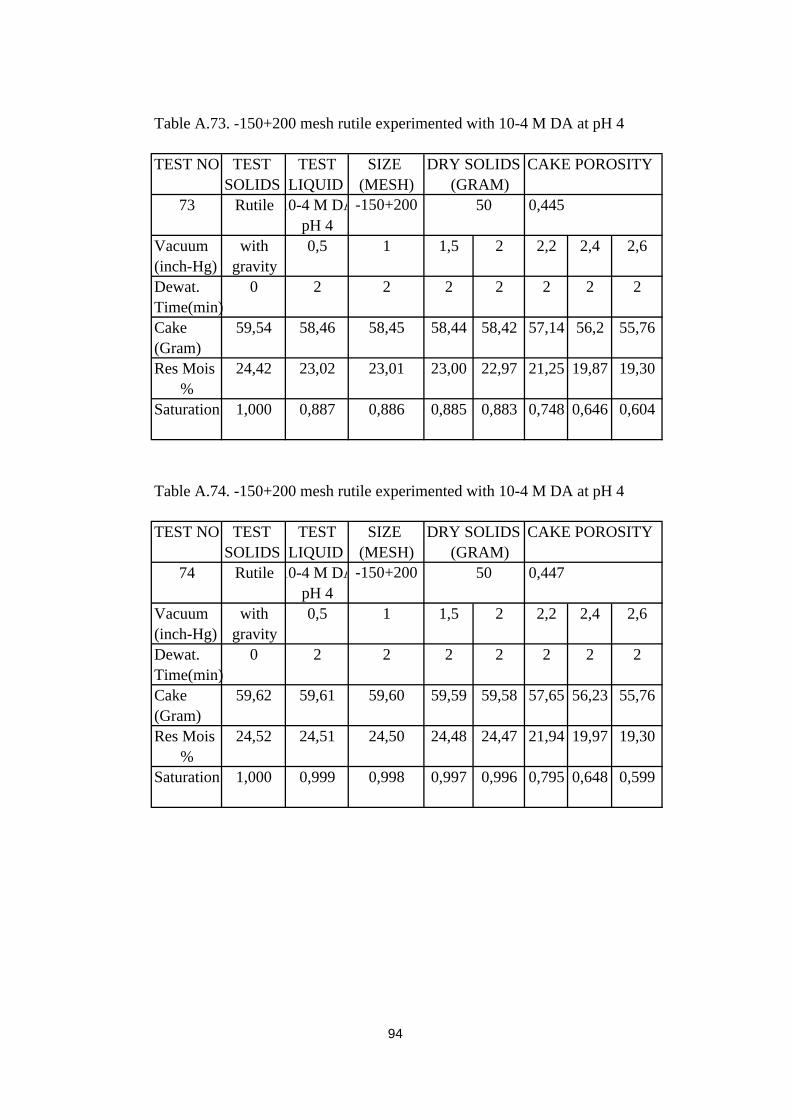
A.73. -150+200 mesh rutile experimented with 10-4 M DA at pH 4..... 94
A.74. -150+200 mesh rutile experimented with 10-4 M DA at pH 4..... 94
A.75. -150+200 mesh rutile experimented with 10-4 M DA at pH 6..... 95
A.76. -150+200 mesh rutile experimented with 10-4 M DA at pH 6..... 95
A.77. -150+200 mesh rutile experimented with 10-4 M DA at pH 8..... 96
A.78. -150+200 mesh rutile experimented with 10-4 M DA at pH 8..... 96
A.79. -150+200 mesh rutile experimented with 10-4 M DA at pH 10... 97
xiii
Page 13
A.80. -150+200 mesh rutile experimented with 10-4 M DA at pH 10... 97
A.81. -150+200 mesh rutile experimented with 5.10-5 M DA at pH 4.. 98
A.82. -150+200 mesh rutile experimented with 5.10-5 M DA at pH 4.. 98
A.83. -150+200 mesh rutile experimented with 5.10-5 M DA at pH 6.. 99
A.84. -150+200 mesh rutile experimented with 5.10-5 M DA at pH 6.. 99
A.85. -150+200 mesh rutile experimented with 5.10-5 M DA at pH 8.. 100
A.86. -150+200 mesh rutile experimented with 5.10-5 M DA at pH 8.. 100
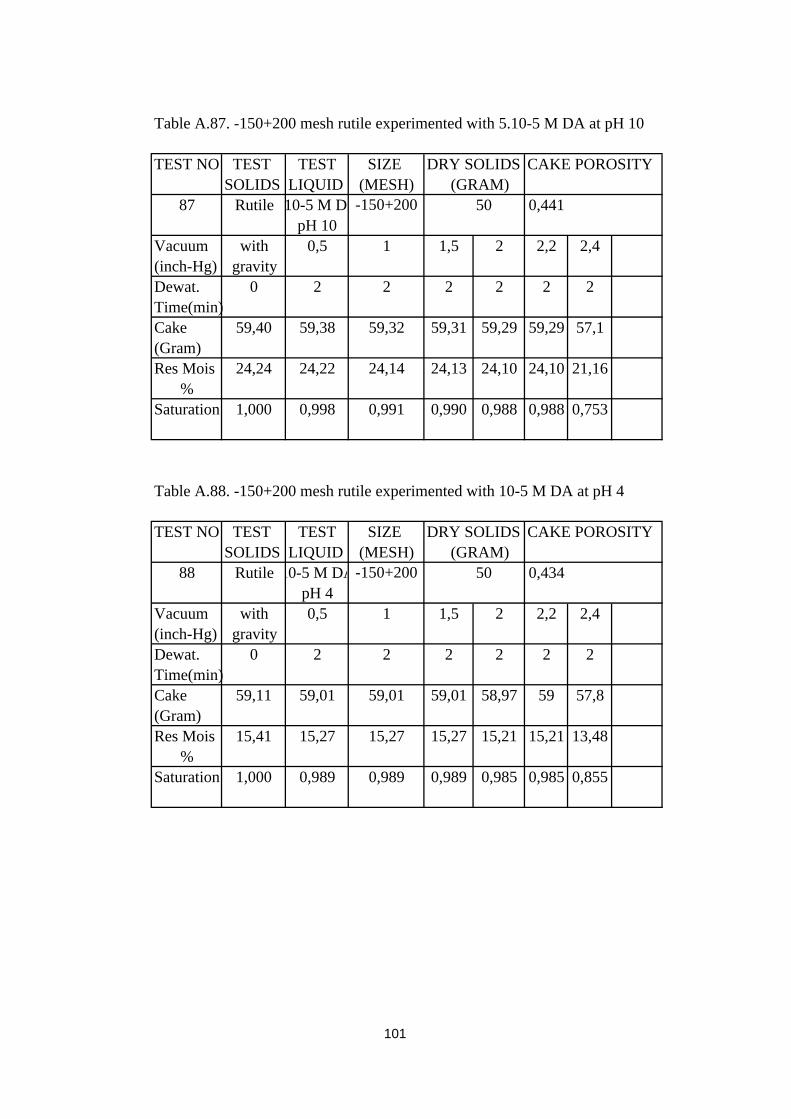
A.87. -150+200 mesh rutile experimented with 5.10-5 M DA at pH 10 101
A.88. -150+200 mesh rutile experimented with 10-5 M DA at pH 4..... 101
A.89. -150+200 mesh rutile experimented with 10-5 M DA at pH 4..... 102
A.90. -150+200 mesh rutile experimented with 10-5 M DA at pH 6..... 102
A.91. -150+200 mesh rutile experimented with 10-5 M DA at pH 6..... 103
A.92. -150+200 mesh rutile experimented with 10-5 M DA at pH 8..... 103
A.93. -150+200 mesh rutile experimented with 10-5 M DA at pH 8..... 104
A.94. -150+200 mesh rutile experimented with 10-5 M DA at pH 10... 104
A.95. -150+200 mesh rutile experimented with 10-5 M DA at pH 10... 105
A.96. -150+200 mesh rutile experimented with 10-4 M SDS at pH 2... 105
A.97. -150+200 mesh rutile experimented with 10-4 M SDS at pH 4... 106
A.98. -150+200 mesh rutile experimented with 10-4 M SDS at pH 6... 106
A.99. -150+200 mesh rutile experimented with 10-4 M SDS at pH 8... 107
A.100. -150+200 mesh rutile experimented with 5.10-5 M SDS at
pH 2........................................................................................................
107
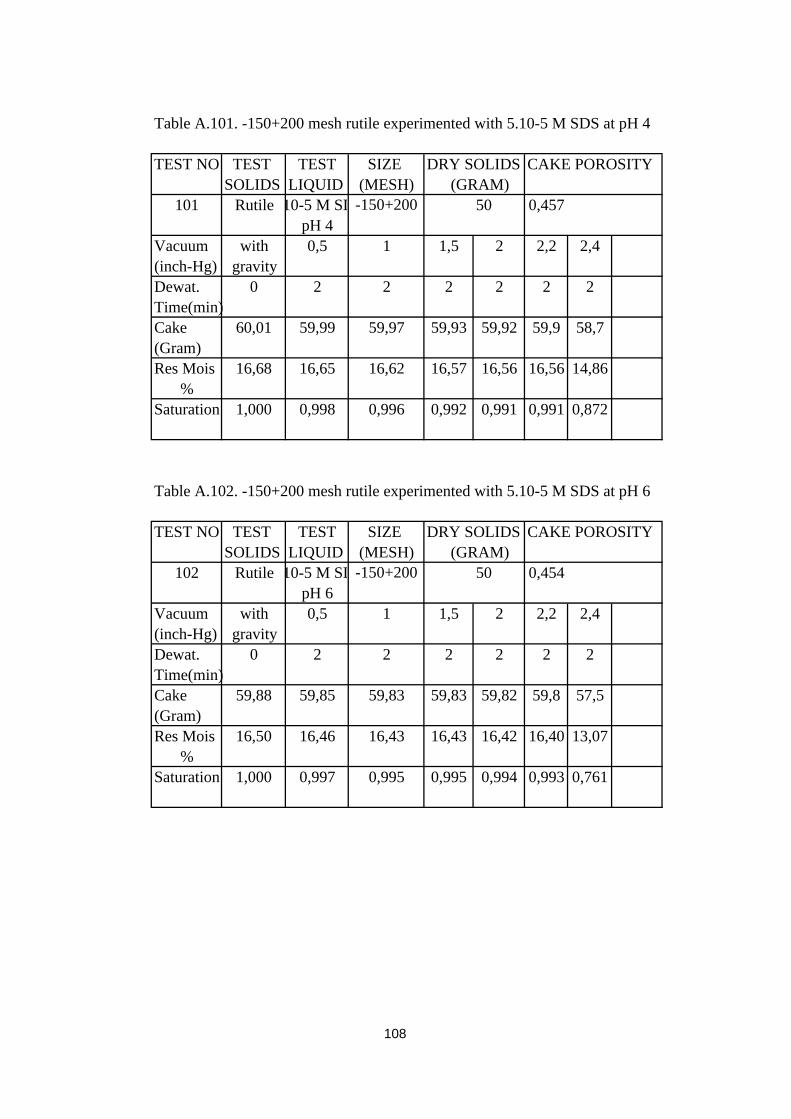
A.101. -150+200 mesh rutile experimented with 5.10-5 M SDS at
pH 4........................................................................................................
108
A.102. -150+200 mesh rutile experimented with 5.10-5 M SDS at
pH 6........................................................................................................
108
A.103. -150+200 mesh rutile experimented with 5.10-5 M SDS at
pH 8........................................................................................................
109
A.104. -150+200 mesh rutile experimented with 10-5 M SDS at pH 2 109
xiv
Page 14
A.105. -150+200 mesh rutile experimented with 10-5 M SDS at pH 4 110
A.106. -150+200 mesh rutile experimented with 10-5 M SDS at pH 6 110
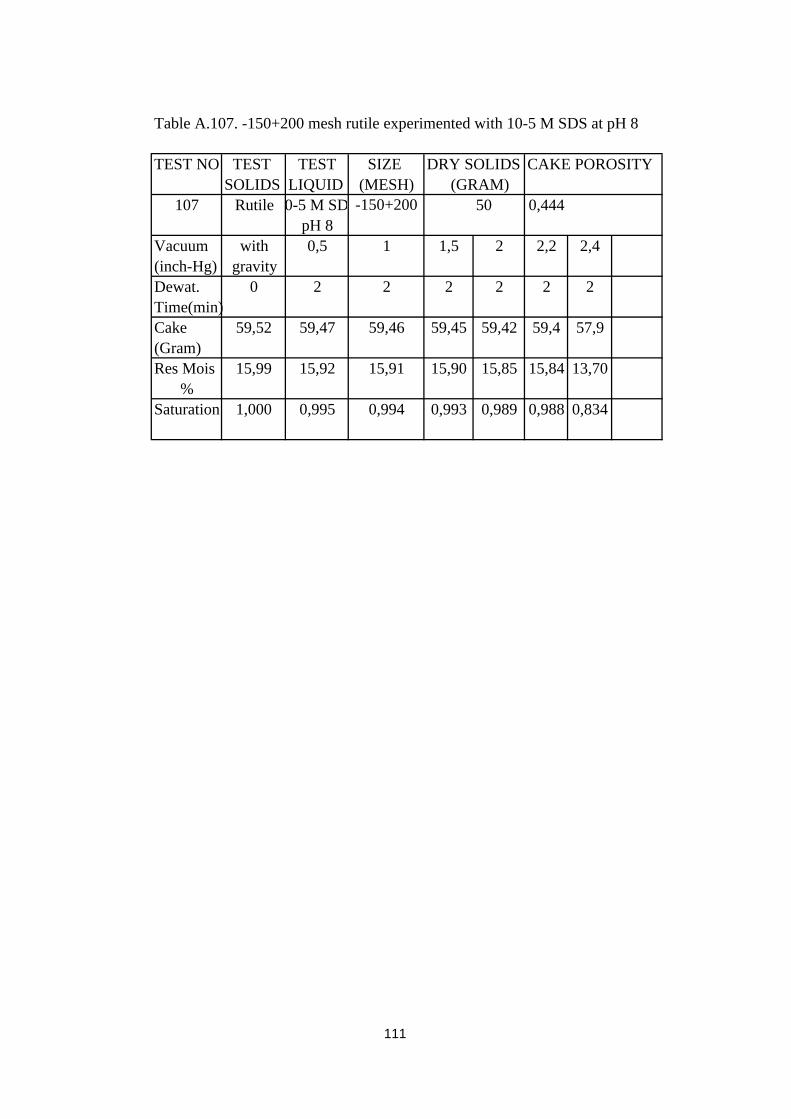
A.107. -150+200 mesh rutile experimented with 10-5 M SDS at pH 8 111
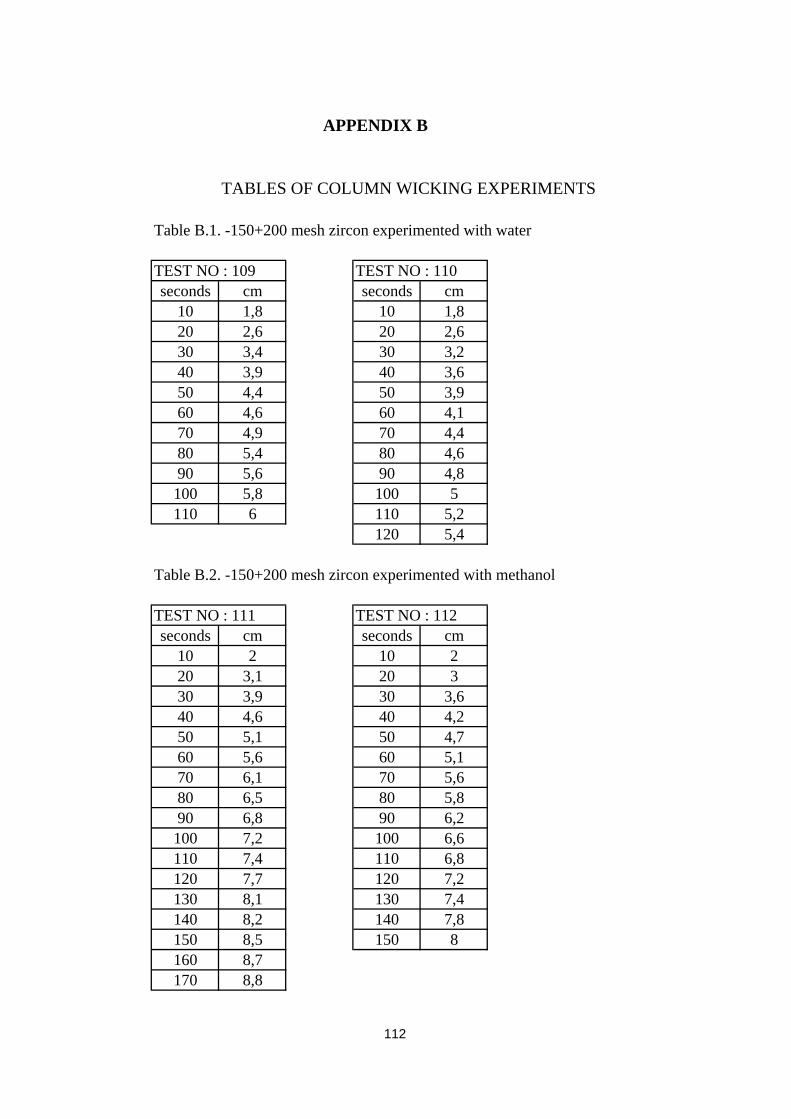
B.1. -150+200 mesh zircon experimented with water............................ 112
B.2. -150+200 mesh zircon experimented with methanol...................... 112
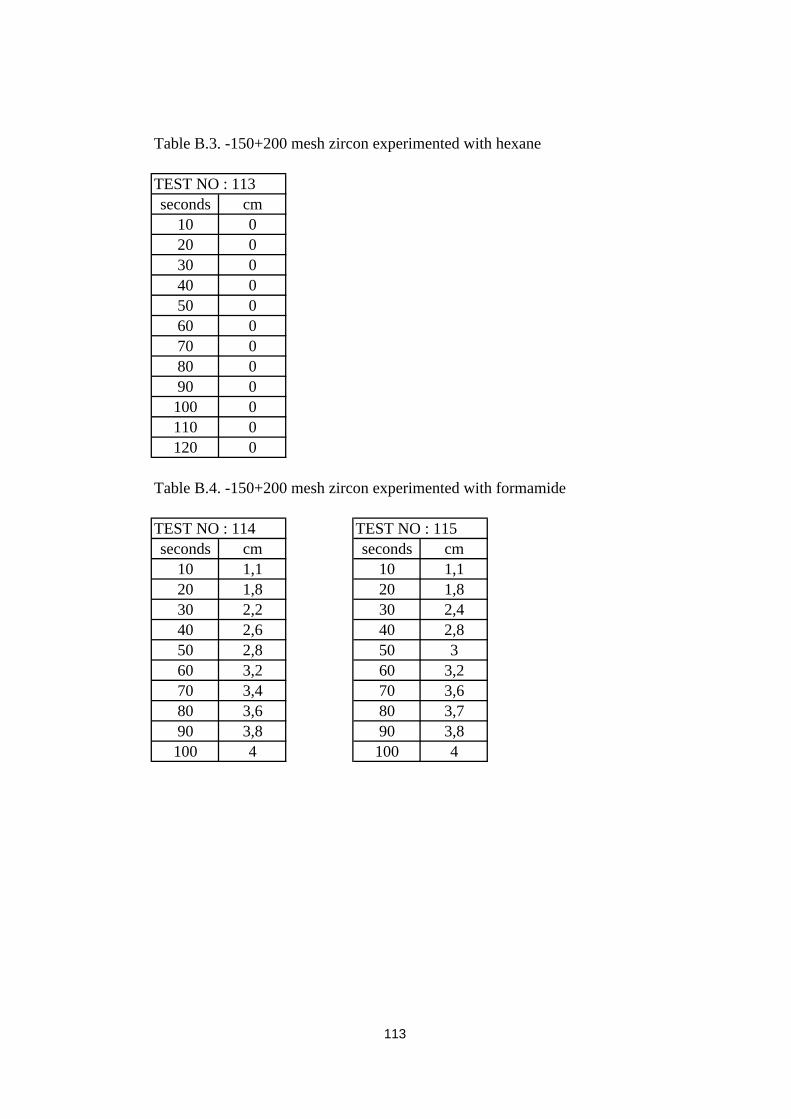
B.3. -150+200 mesh zircon experimented with hexane......................... 113
B.4. -150+200 mesh zircon experimented with formamide................... 113
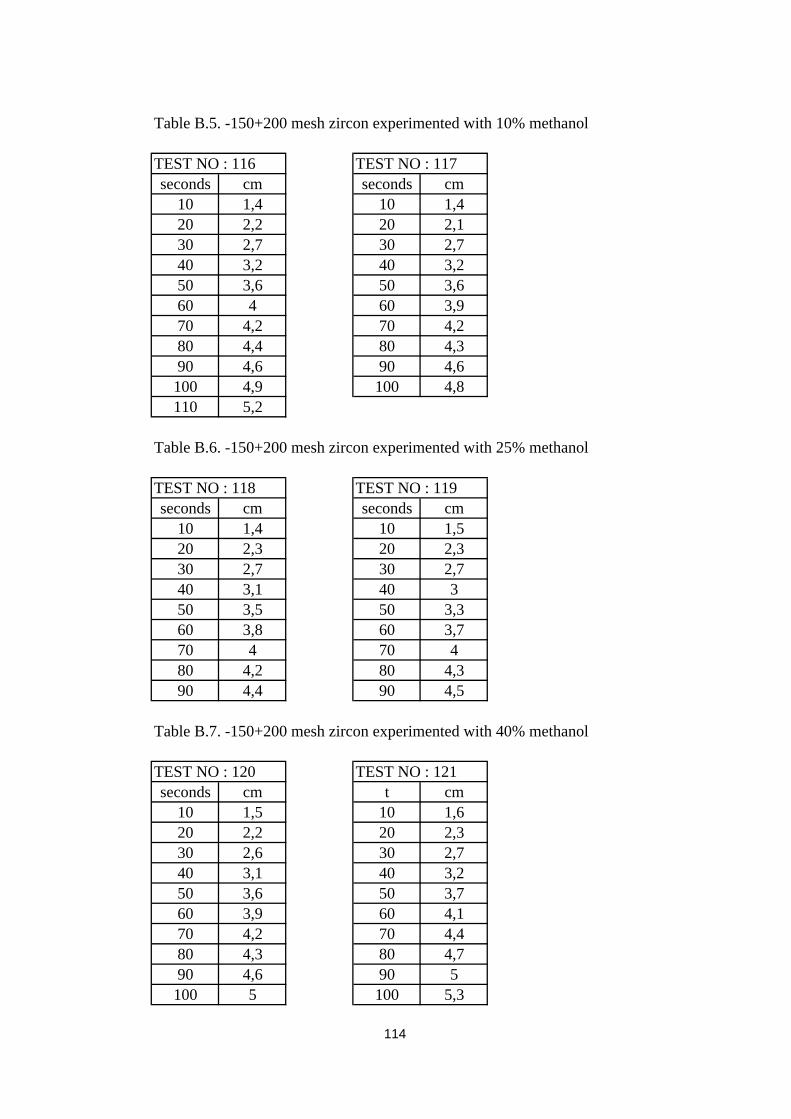
B.5. -150+200 mesh zircon experimented with 10% methanol.............. 114
B.6. -150+200 mesh zircon experimented with 25% methanol.............. 114
B.7. -150+200 mesh zircon experimented with 40% methanol.............. 114
B.8. -150+200 mesh zircon experimented with 50% methanol.............. 115
B.9. -150+200 mesh zircon experimented with 65% methanol.............. 115
B.10. -150+200 mesh zircon experimented with 80% methanol............ 116
B.11. -150+200 mesh zircon experimented with 5.10-5 M DA at pH 4 116
B.12. -150+200 mesh zircon experimented with 5.10-5 M DA at pH 6 117
B.13. -150+200 mesh zircon experimented with 5.10-5 M DA at pH 8 117
B.14. -150+200 mesh zircon experimented with 5.10-5 M DA at
pH 10.......................................................................................................
118
B.15. -150+200 mesh zircon experimented with 10-5 M DA at pH 4... 118
B.16. -150+200 mesh zircon experimented with 10-5 M DA at pH 6... 119
B.17. -150+200 mesh zircon experimented with 10-5 M DA at pH 8... 119
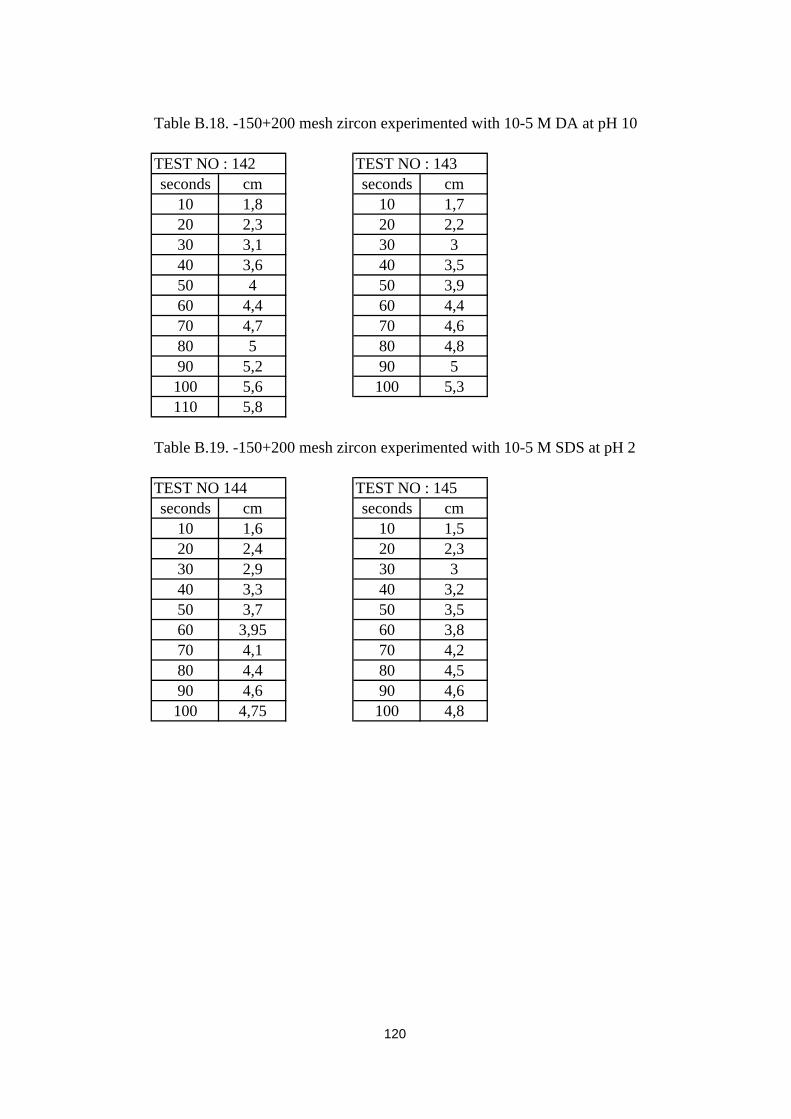
B.18. -150+200 mesh zircon experimented with 10-5 M DA at pH 10 120
B.19. -150+200 mesh zircon experimented with 10-5 M SDS at pH 2 120
B.20. -150+200 mesh zircon experimented with 5.10-5 M SDS at
pH 2.........................................................................................................
121
B.21. -150+200 mesh zircon experimented with 10-4 M SDS at pH 2 121
B.22. -150+200 mesh rutile experimented with water........................... 122
B.23. -150+200 mesh rutile experimented with methanol..................... 123
B.24. -150+200 mesh rutile experimented with 10% methanol............. 123
xv
Page 15
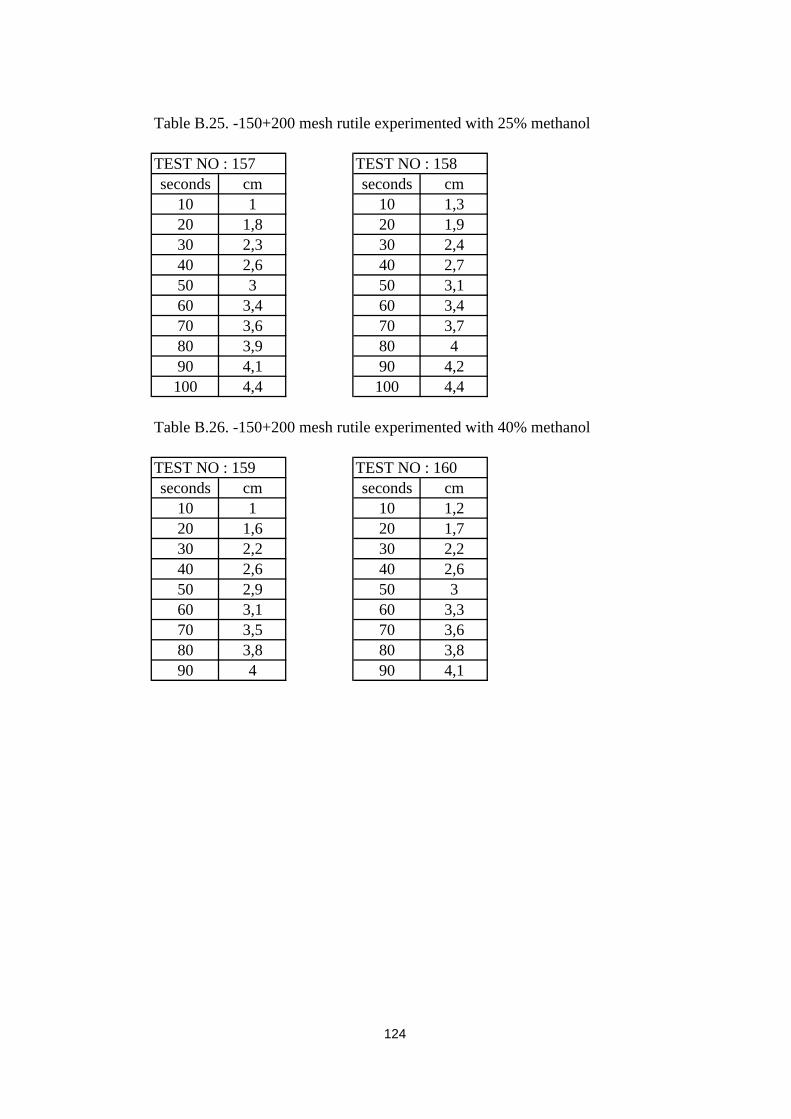
B.25. -150+200 mesh rutile experimented with 25% methanol............. 124
B.26. -150+200 mesh rutile experimented with 40% methanol............. 124
B.27. -150+200 mesh rutile experimented with 50% methanol............. 125
B.28. -150+200 mesh rutile experimented with 65% methanol............. 125
B.29. -150+200 mesh rutile experimented with 80% methanol............. 126
B.30. -150+200 mesh rutile experimented with 10-4 M DA at pH 4..... 126
B.31. -150+200 mesh rutile experimented with 10-4 M DA at pH 6..... 126
B.32. -150+200 mesh rutile experimented with 10-4 M DA at pH 8..... 127
B.33. -150+200 mesh rutile experimented with 10-4 M DA at pH 10... 127
B.34. -150+200 mesh rutile experimented with 5.10-5 M DA at pH 4.. 127
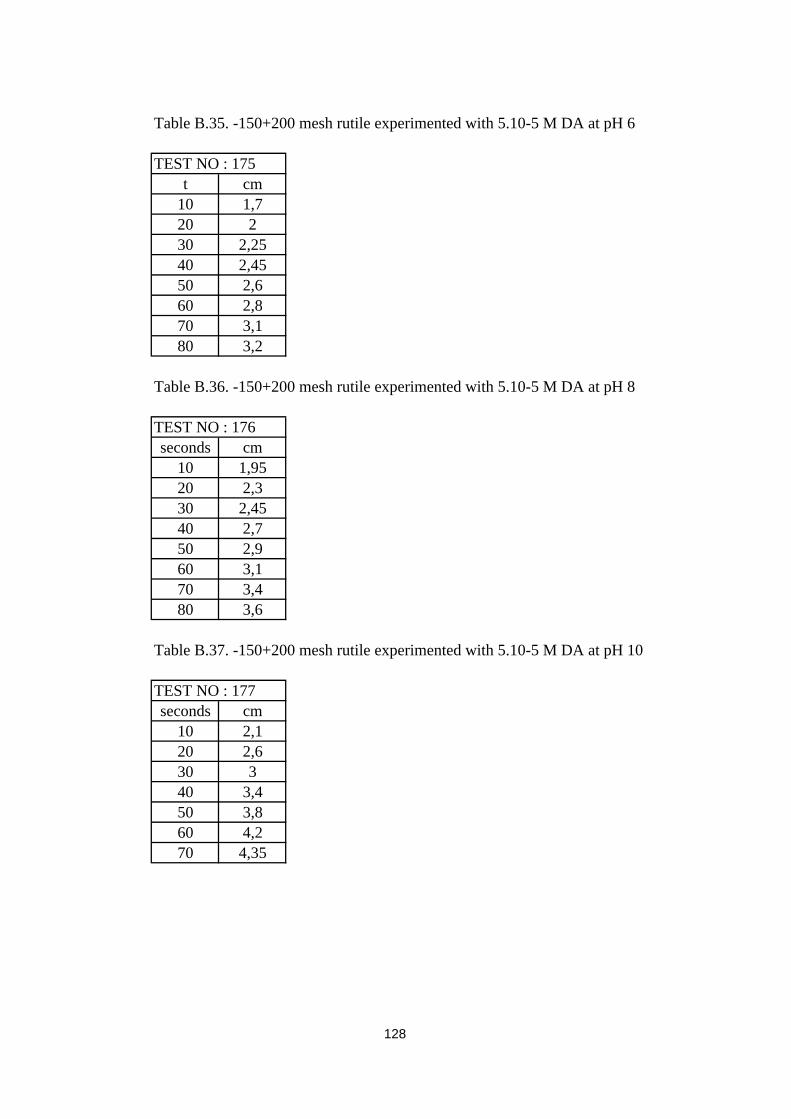
B.35. -150+200 mesh rutile experimented with 5.10-5 M DA at pH 6.. 128
B.36. -150+200 mesh rutile experimented with 5.10-5 M DA at pH 8.. 128
B.37. -150+200 mesh rutile experimented with 5.10-5 M DA at pH 10 128
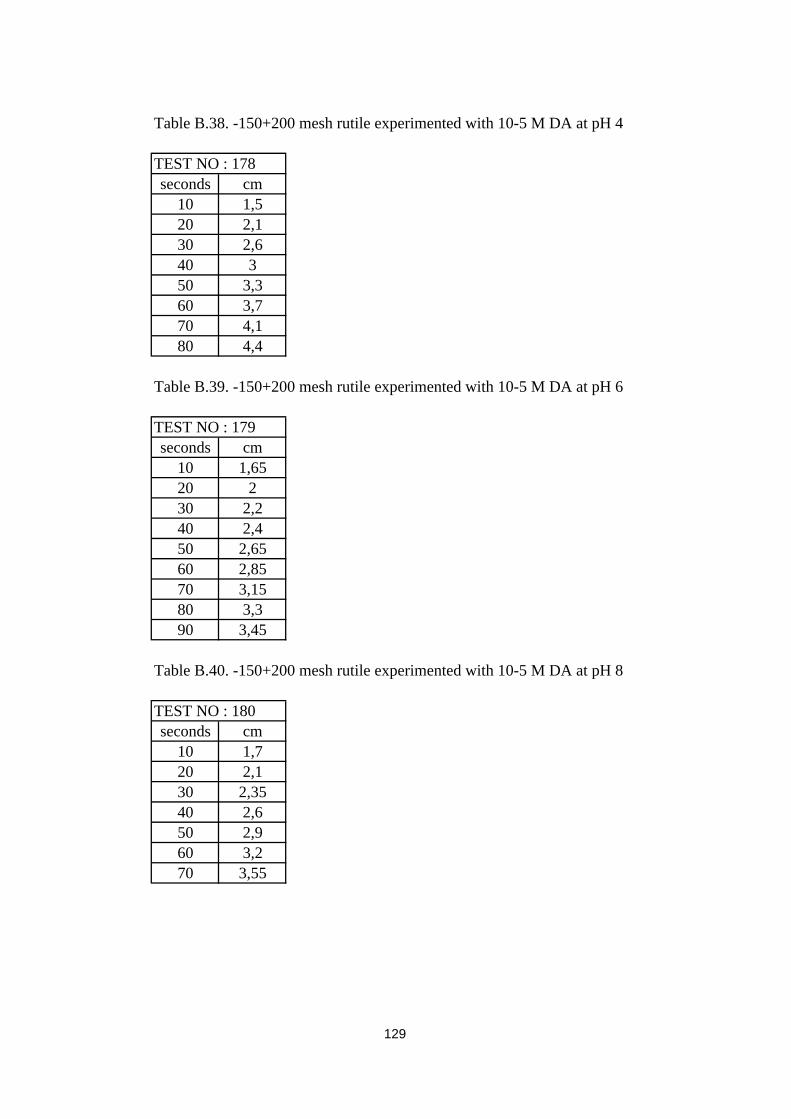
B.38. -150+200 mesh rutile experimented with 10-5 M DA at pH 4..... 129
B.39. -150+200 mesh rutile experimented with 10-5 M DA at pH 6..... 129
B.40. -150+200 mesh rutile experimented with 10-5 M DA at pH 8..... 129
B.41. -150+200 mesh rutile experimented with 10-5 M DA at pH 10... 130
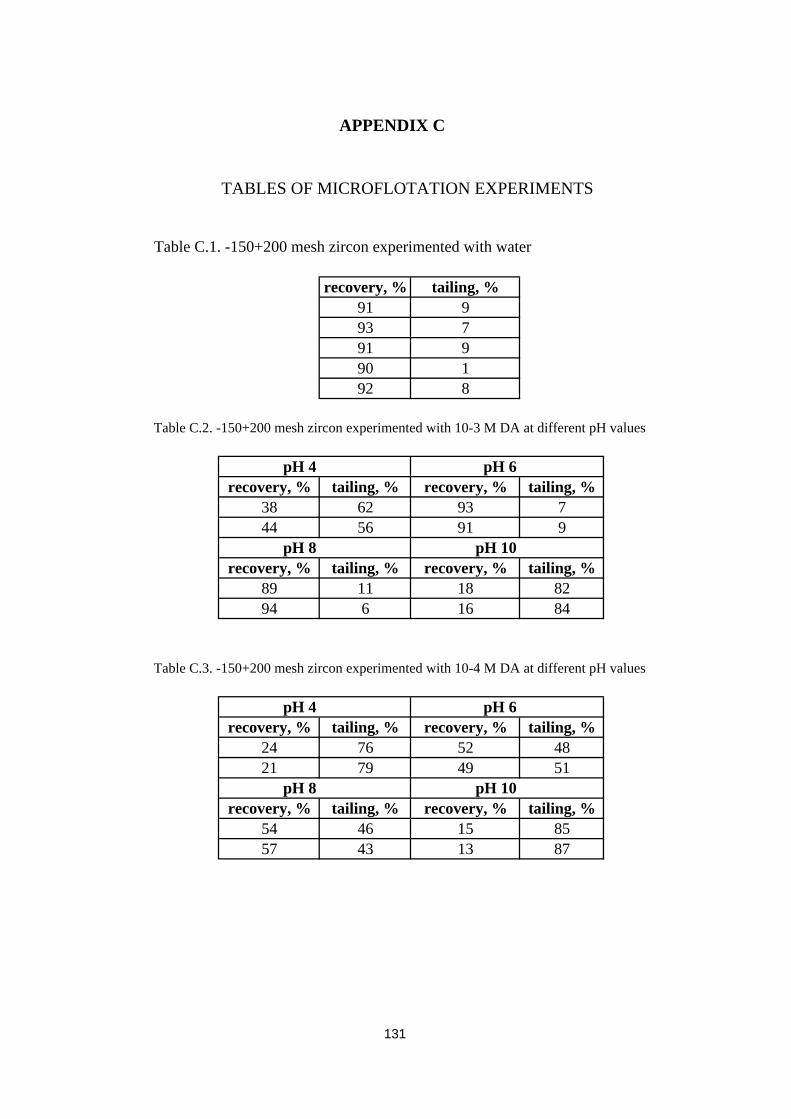
C.1. -150+200 mesh zircon experimented with water............................ 131
C.2. -150+200 mesh zircon experimented with 10-3 M DA at different
pH values
................................................................................................ 131
C.3. -150+200 mesh zircon experimented with 10-4 M DA at different
pH values
................................................................................................ 131
C.4. -150+200 mesh zircon experimented with 5.10-5 M DA at
different pH values.................................................................................
132
C.5. -150+200 mesh zircon experimented with 10-5 M DA at different
pH values
................................................................................................ 132
C.6. -150+200 mesh zircon experimented with 10-3 M SDS at
different pH values..................................................................................
132
xvi
Page 16
C.7. -150+200 mesh zircon experimented with 10-4 M SDS at
different pH values..................................................................................
132
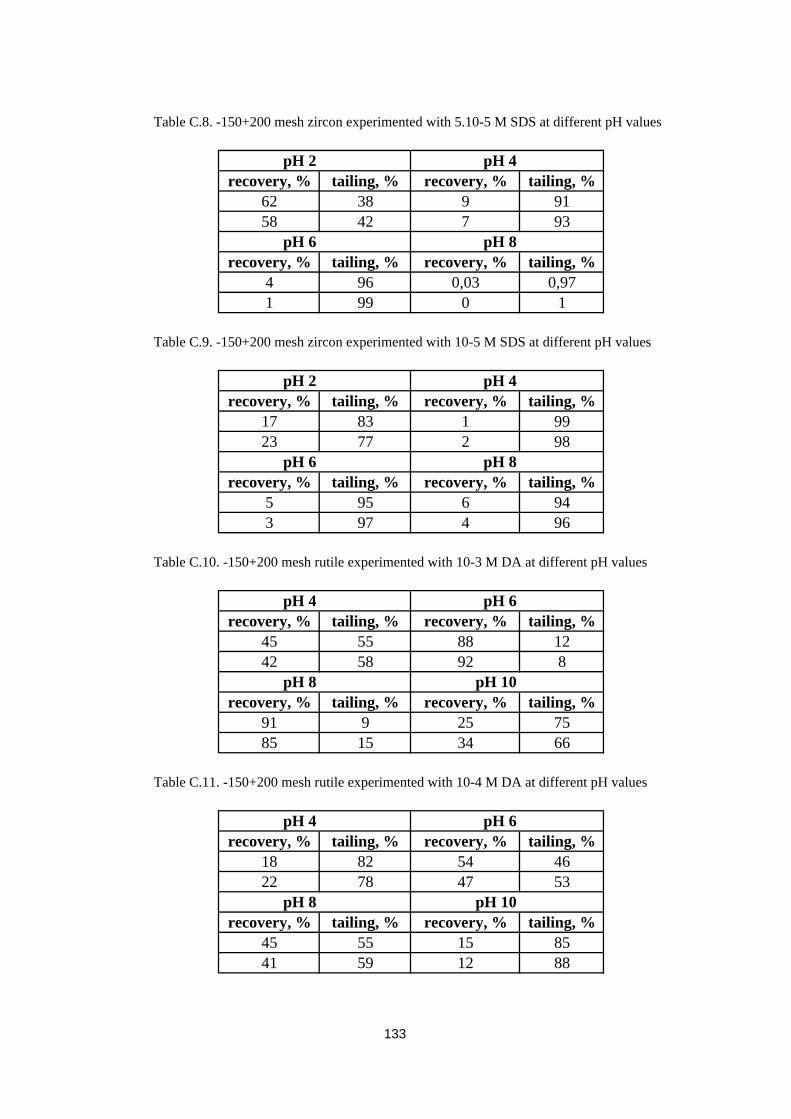
C.8. -150+200 mesh zircon experimented with 5.10-5 M SDS at
different pH values..................................................................................
133
C.9. -150+200 mesh zircon experimented with 10-5 M SDS at
different pH values..................................................................................
133
C.10. -150+200 mesh rutile experimented with 10-3 M DA at
different pH values..................................................................................
133
C.11. -150+200 mesh rutile experimented with 10-4 M DA at
different pH values..................................................................................
133
C.12. -150+200 mesh rutile experimented with 5.10-5 M DA at
different pH values..................................................................................
134
C.13. -150+200 mesh rutile experimented with 10-5 M DA at
different pH values..................................................................................
134
C.14. -150+200 mesh rutile experimented with 10-3 M SDS at
different pH values..................................................................................
134
C.15. -150+200 mesh rutile experimented with 10-4 M SDS at
different pH values..................................................................................
134
C.16. -150+200 mesh rutile experimented with 5.10-5 M SDS at
different pH values..................................................................................
135
C.17. -150+200 mesh rutile experimented with 10-5 M SDS at
different pH values..................................................................................
135
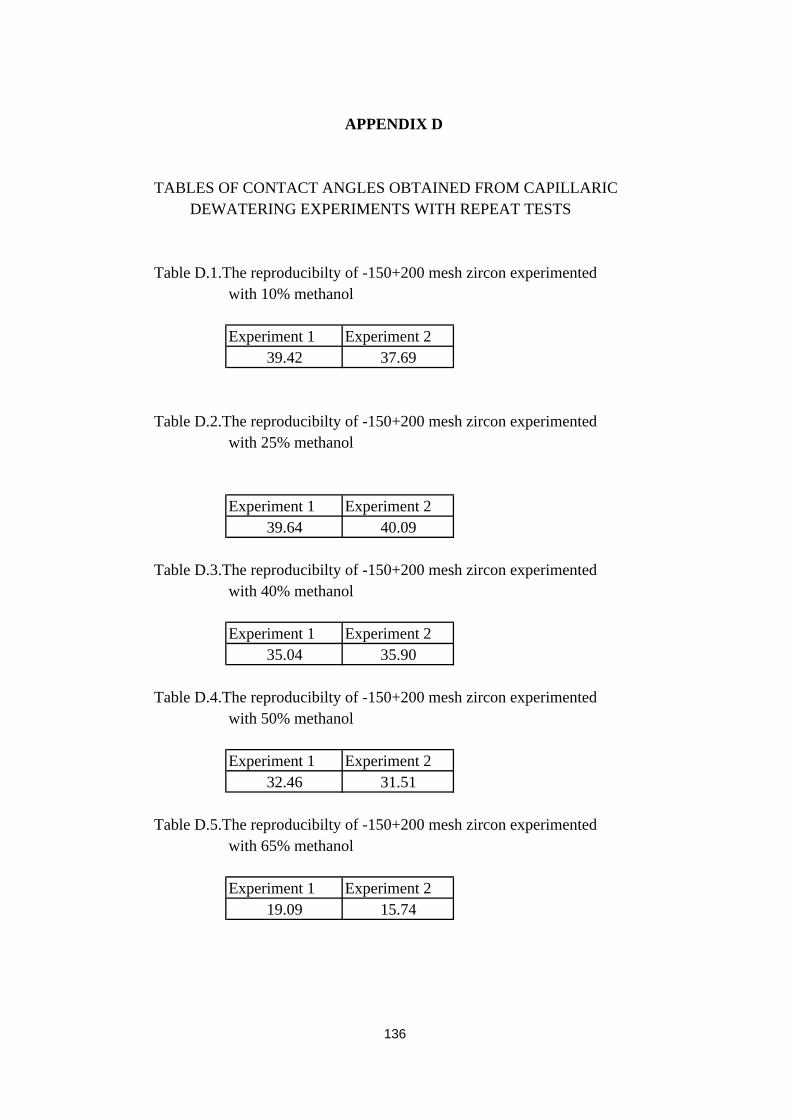
D.1. The reproducibility of -150+200 mesh zircon experimented with
10% methanol......................................................................................... 136
D.2 The reproducibility of -150+200 mesh zircon experimented with
25% methanol....................................................................................... 136
D.3. The reproducibility of -150+200 mesh zircon experimented with
40% methanol..................................................................................... 136
xvii
Page 17
D.4. The reproducibility of -150+200 mesh zircon experimented with
50% methanol..................................................................................... 136
D.5. The reproducibility of -150+200 mesh zircon experimented with
65% methanol..................................................................................... 136
D.6. The reproducibility of -150+200 mesh zircon experimented with
80% methanol.....................................................................................
137
D.7. The reproducibility of -150+200 mesh zircon experimented with
5.10-5 M DA at pH 4.............................................................................. 137
D.8. The reproducibility of -150+200 mesh zircon experimented with
5.10-5 M DA at pH 6.............................................................................. 137
D.9. The reproducibility of -150+200 mesh zircon experimented with
5.10-5 M DA at pH 8.............................................................................. 137
D.10. The reproducibility of -150+200 mesh zircon experimented
with 5.10-5 M DA at pH 10.................................................................... 137
D.11. The reproducibility of -150+200 mesh zircon experimented
with 10-5 M DA at pH 4....................................................................... 137
D.12. The reproducibility of -150+200 mesh zircon experimented
with 10-5 M DA at pH 6....................................................................... 138
D.13. The reproducibility of -150+200 mesh zircon experimented
with 10-5 M DA at pH 8....................................................................... 138
D.14. The reproducibility of -150+200 mesh zircon experimented
with 10-5 M DA at pH 10....................................................................... 138
D.15. The reproducibility of -150+200 mesh rutile experimented with
water............................................................................................... 138
D.16. The reproducibility of -150+200 mesh rutile experimented with
10% methanol................................................................................ 138
D.17. The reproducibility of -150+200 mesh rutile experimented with
25% methanol................................................................................ 138
xviii
Page 18
D.18. The reproducibility of -150+200 mesh rutile experimented with
40% methanol................................................................................ 138
D.19. The reproducibility of -150+200 mesh rutile experimented with
50% methanol................................................................................ 139
D.20. The reproducibility of -150+200 mesh rutile experimented with
65% methanol................................................................................
139
D.21. The reproducibility of -150+200 mesh rutile experimented with
10-4 M DA at pH 4................................................................................ 139
D.22. The reproducibility of -150+200 mesh rutile experimented with
10-4 M DA at pH 6................................................................................ 139
D.23. The reproducibility of -150+200 mesh rutile experimented with
10-4 M DA at pH 8................................................................................ 139
D.24. The reproducibility of -150+200 mesh rutile experimented with
10-4 M DA at pH 10.............................................................................. 139
D.25. The reproducibility of -150+200 mesh rutile experimented with
5.10-5 M DA at pH 4.............................................................................. 139
D.26. The reproducibility of -150+200 mesh rutile experimented with
5.10-5 M DA at pH 6.............................................................................. 140
D.27. The reproducibility of -150+200 mesh rutile experimented with
5.10-5 M DA at pH 8.............................................................................. 140
xix
Page 19
LIST OF FIGURES
2.1. The contact angle formed by solid, liquid and gas ......................... 6
3.1. The illustration of capillaric dewatering experiments .................... 21
3.2. The illustration of column wicking experiments ............................ 21
3.3. The illustration of Hallimond tube. ................................................ 22
4.2. Residual cake saturation versus k.cosθ plots for -150 + 200 mesh
zircon when methanol or a water-methanol mixture was used as the
liquid. ..................................................................................................... 25
4.3. Residual cake saturation versus k.cosθ plots for -150 + 200 mesh
zircon when methanol or a water-methanol mixture was used as the
liquid. ..................................................................................................... 25
4.4. Residual cake saturation versus k.cosθ plots for -150 + 200 mesh
zircon when methanol or a water-methanol mixture was used as the
liquid. ..................................................................................................... 26
4.5. Residual cake saturation versus k.cosθ plots for -150 + 200 mesh
zircon when methanol or a water-methanol mixture was used as the
liquid. ..................................................................................................... 26
4.6. Residual cake saturation versus k.cosθ plots for -150 + 200 mesh
zircon when methanol or a water-methanol mixture was used as the
liquid. ..................................................................................................... 27
4.7. Residual cake saturation versus k.cosθ plots for -150 + 200 mesh
zircon when methanol or a water-methanol mixture was used as the
liquid. ..................................................................................................... 27
xx
Page 20
4.8. Contact angle values obtained with zircon by using methanol-
water mixtures. ...................................................................................... 28
4.9. Residual cake saturation versus k.cosθ plots for -150 + 200 mesh
zircon when 10-5M dodecylamine solution was used as the liquid. ..... 29
4.10. The contact angle values for the -150+200 mesh zircon sample
in contact with 10-5M dodecylamine solutions at various pH values. .. 30
4.11. Residual cake saturation versus k.cosθ plots for -150 + 200
mesh zircon when 10-4M sodium dodecyl sulfate solution was used as
the liquid. ............................................................................................... 32
4.12. Residual cake saturation versus k.cosθ plots for -150 + 200
mesh rutile when water or methanol was used as the liquid. ................ 33
4.13. Residual cake saturation versus k.cosθ plots for -150 + 200
mesh rutile when methanol or a water-methanol mixture was used as
the liquid. ............................................................................................... 33
4.14. Residual cake saturation versus k.cosθ plots for -150 + 200
mesh rutile when methanol or a water-methanol mixture was used as
the liquid. ............................................................................................... 34
4.15. Residual cake saturation versus k.cosθ plots for -150 + 200
mesh rutile when methanol or a water-methanol mixture was used as
the liquid. ............................................................................................... 34
4.16. Residual cake saturation versus k.cosθ plots for -150 + 200
mesh rutile when methanol or a water-methanol mixture was used as
the liquid. ............................................................................................... 35
4.17. Residual cake saturation versus k.cosθ plots for -150 + 200
mesh rutile when methanol or a water-methanol mixture was used as
the liquid. ............................................................................................... 35
xxi
Page 21
4.18. Residual cake saturation versus k.cosθ plots for -150 + 200
mesh rutile when methanol or a water-methanol mixture was used as
the liquid. ............................................................................................... 36
4.19. Surface tension values of methanol mixtures. .............................. 36
4.20. Column wicking plots for -150+200 mesh zircon particles with
completely-wetting organic liquids and partially-wetting liquid water. 40
4.21. Column wicking plots for -150+200 mesh rutile particles with
completely-wetting organic liquids and partially-wetting liquid water. 40
4.22. Column wicking plots for -150+200 mesh zircon particles with
water-methanol mixtures. ...................................................................... 41
4.23. Column wicking plots for -150+200 mesh rutile particles with
water-methanol mixtures. ...................................................................... 41
4.24. Column wicking plots for -150+200 mesh zircon particles with
10-5 M dodecyl amine at different pH values. ...................................... 43
4.25. Column wicking plots for -150+200 mesh zircon particles with
10-5 M dodecyl amine at different pH values. ....................................... 43
4.26. Column wicking plots for -150+200 mesh zircon particles with
different concentrations of sodium dodecyl sulfate at pH 2. ................. 44
4.27. Column wicking plots for -150+200 mesh rutile particles with
10-5 M dodecyl amine at different pH values. ...................................... 45
4.28. Column wicking plots for -150+200 mesh rutile particles with
5x10⁻⁵ M dodecyl amine at different pH values. .................................. 45
4.29. Column wicking plots for -150+200 mesh rutile particles with
10-4 M dodecyl amine at different pH values. ...................................... 46
4.30. Column wicking plots for -150+200 mesh rutile particles with
different concentrations of sodium dodecyl sulfate at pH 2. .................
46
4.31. Flotation response of -150+200 mesh zircon with dodecyl amine
at different pH values. R denotes repeat experiments. .......................... 48
xxii
Page 22
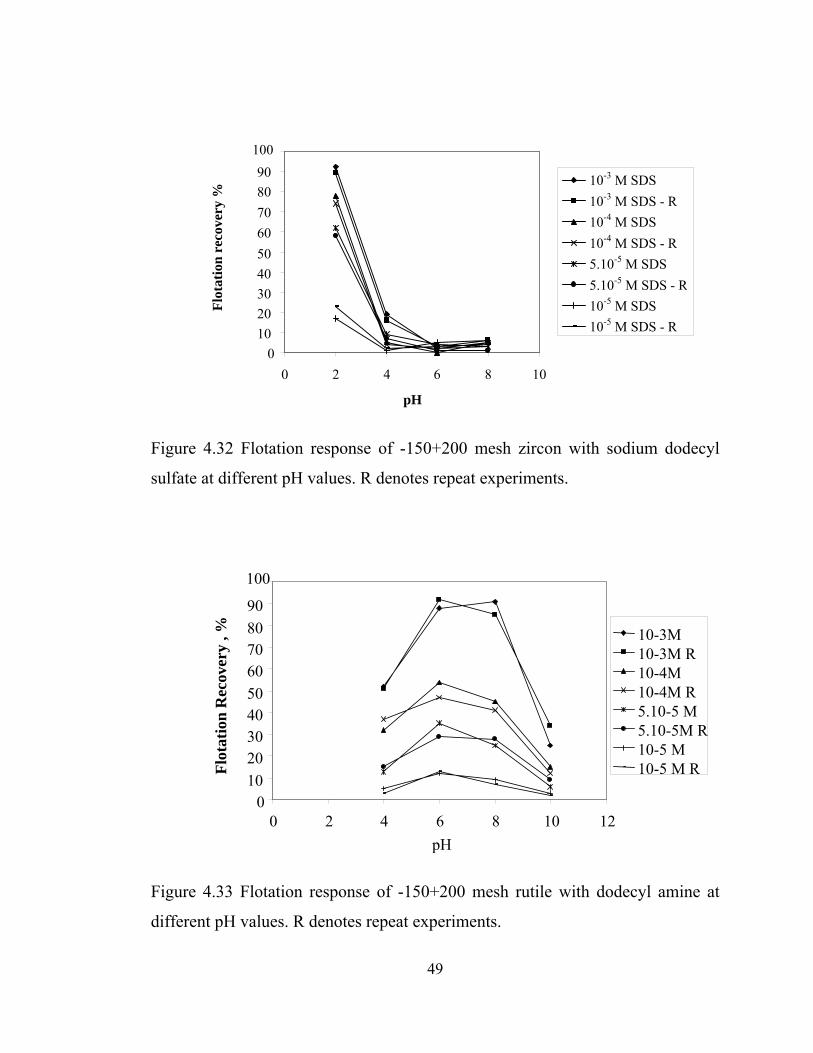
4.32. Flotation response of -150+200 mesh zircon with sodium
dodecyl sulfate at different pH values. R denotes repeat experiments... 49
4.33. Flotation response of -150+200 mesh rutile with dodecyl amine
at different pH values. R denotes repeat experiments. .......................... 49
4.34. Flotation response of -150+200 mesh rutile with sodium dodecyl
sulfate at different pH values. R denotes repeat experiments. ............... 50
xxiii
Page 23
CHAPTER 1
INTRODUCTION
The solid-liquid contact angle is used as a measure of wettability and the surface
free energy of solids in many diverse fields such as mineral and coal benefication,
petroleum engineering, and the manufacture of pharmaceutical powders,
cosmetics, pigments, paints and paper. Therefore, contact angle measurements are
fundamental to many processes. Contact angle measurements on finely divided
solids are much more difficult than those on moderately large, uniform solid
surfaces, but the former is often more desired and more important since many
industrial applications involve processing of particulate solids. For example, the
froth flotation separation of minerals is controlled to a large extent by the relative
wettabilities of finely divided mineral particles in an aqueous suspension, which
generally requires the use of surface active agents (surfactants) to selectively
modify the wettability or the contact angle of highly irregular mineral particles.
Two general methods exist for determining powder contact angles [Adamson,
1967]: (i) the Washburn equation (or dynamic) method which is based on the rate
of liquid flow into a packed bed or porous plug of particulate solids; (ii) the
Bartell (or static) method which is based on equilibrium measurements of the
capillary pressure increment required to prevent liquid from penetrating the
packed bed. The principles of the measurement methods are simple but they both
suffer some experimental and fundamental difficulties. One experimental
difficulty is that both methods in their simplest form require visual observation of
the wetting liquid from inside the porous bed, which may be skewed in the case
1
Page 24
of irregulary shaped polydisperse particles or its exact position may not be
clearly visible due to wall effects of the enclosing glassware. A fundamental
limitation with measurements in packed beds is the assumption that the packing
density will not change with nature of the penetrating ( or receding) liquid, as the
methods require an additional calibrating liquid, perfectly wetting the solids, to
determine the effective pore radius in the bed. This limitation is of more concern
in systems where surfactants are present in the penetrating liquid. Flocculation or
dispersion produced by surfactant solutions can change the packing density.
Furthermore, the depletion of surfactant molecules from the liquid phase by
adsorption on the powder surface area in the region of liquid front can seriously
affect the contact angle and the liquid surface tension in rate-measuring methods.
Modified versions to circumvent difficulties of the two general measurement
methods have been reported in the literature. Good R.J. et al (1993) developed the
thin layer wicking method to measure the rate of advance of wetting liquids
through a thin layer of solid particles deposited onto a glass slide. This method
uses the Washburn equation to determine the cosine of the contact angle and
requires calibration tests with a perfectly wetting liquid to calculate the effective
interstitial pore radius of the thin layer. Chibowski and Perea-Carpio (2001)
developed a technique involving the measurement of the weight of liquid
penetrating into a powder bed, instead of monitoring the movement of the liquid
front, for the determination of the solid surface free-energy components, but did
not propose to derive the contact angle from such data. The powder contact angle
device of Dunstan and White (1986) and that of Diggins et al. (1990) both used
the Bartell concept; however, rather than applying an external pressure difference
to prevent capillary rise, the penetrating liquid was allowed to rise causing a
gradual increase in the pressure of air enclosed above the wetting front. The
2
Page 25
capillary pressure was calculated by measuring the air pressure to stop the rise of
liquid up the packed bed and subtracting any hydrostatic head, if present.
Capillary pressure determinations in packed beds are equilibrium measurements
with incremental changes in the applied air pressure and generally require long
equilibrium times. Furthermore, most of the practical wetting or dewetting
processes are of nonequilibrium nature. For example, the act of particle-air
bubble attachment in froth flotation and filter cake dewatering upon rapid
application of a certain pressure difference is governed by nonequilibrium
receding contact angles. Therefore, a simple, fast method combining the dynamic
and the static methods of the contact angle measurement may be of practical
value for determining apparent contact angles.
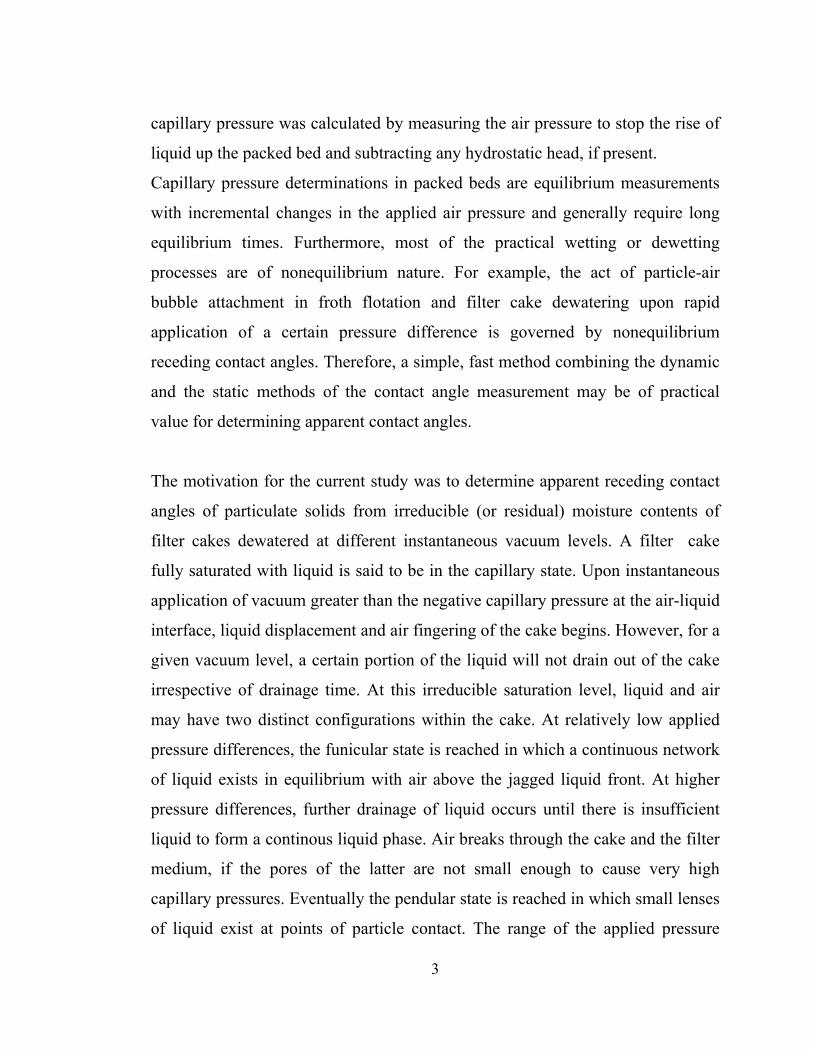
The motivation for the current study was to determine apparent receding contact
angles of particulate solids from irreducible (or residual) moisture contents of
filter cakes dewatered at different instantaneous vacuum levels. A filter cake
fully saturated with liquid is said to be in the capillary state. Upon instantaneous
application of vacuum greater than the negative capillary pressure at the air-liquid
interface, liquid displacement and air fingering of the cake begins. However, for a
given vacuum level, a certain portion of the liquid will not drain out of the cake
irrespective of drainage time. At this irreducible saturation level, liquid and air
may have two distinct configurations within the cake. At relatively low applied
pressure differences, the funicular state is reached in which a continuous network
of liquid exists in equilibrium with air above the jagged liquid front. At higher
pressure differences, further drainage of liquid occurs until there is insufficient
liquid to form a continous liquid phase. Air breaks through the cake and the filter
medium, if the pores of the latter are not small enough to cause very high
capillary pressures. Eventually the pendular state is reached in which small lenses
of liquid exist at points of particle contact. The range of the applied pressure
3
Page 26
differences corresponding to the funicular state will depend on the particle size
and its distribution and the solid-liquid contact angle. As the size distribution
becomes wider, there will also be a wider variation of pore radii in the filter cake,
consequently, the funicular state will extend over a wider pressure range.
1.1 Objective of Thesis
The aim of the present work was to develop a simple, fast technique for the
determination of apparent contact angles of particulate solids from
nonequilibrium filter cake drainage tests. The residual saturation of filter cakes in
the funicular state of cake drainage was correlated with the applied vacuum to
determine the contact angle of particulate solids constituting the filter cake.
4
Page 27
CHAPTER 2
THEORETICAL BACKGROUND
2.1 General
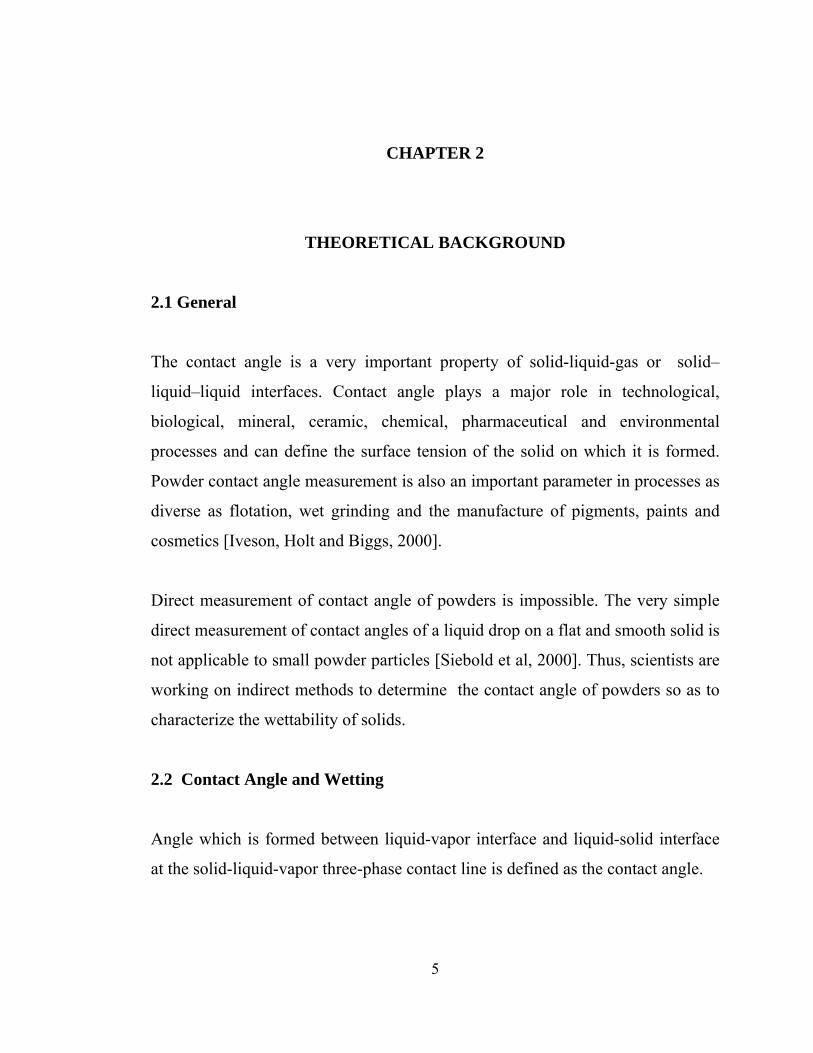
The contact angle is a very important property of solid-liquid-gas or solid–
liquid–liquid interfaces. Contact angle plays a major role in technological,
biological, mineral, ceramic, chemical, pharmaceutical and environmental
processes and can define the surface tension of the solid on which it is formed.
Powder contact angle measurement is also an important parameter in processes as
diverse as flotation, wet grinding and the manufacture of pigments, paints and
cosmetics [Iveson, Holt and Biggs, 2000].
Direct measurement of contact angle of powders is impossible. The very simple
direct measurement of contact angles of a liquid drop on a flat and smooth solid is
not applicable to small powder particles [Siebold et al, 2000]. Thus, scientists are
working on indirect methods to determine the contact angle of powders so as to
characterize the wettability of solids.
2.2 Contact Angle and Wetting
Angle which is formed between liquid-vapor interface and liquid-solid interface
at the solid-liquid-vapor three-phase contact line is defined as the contact angle.
5
Page 28
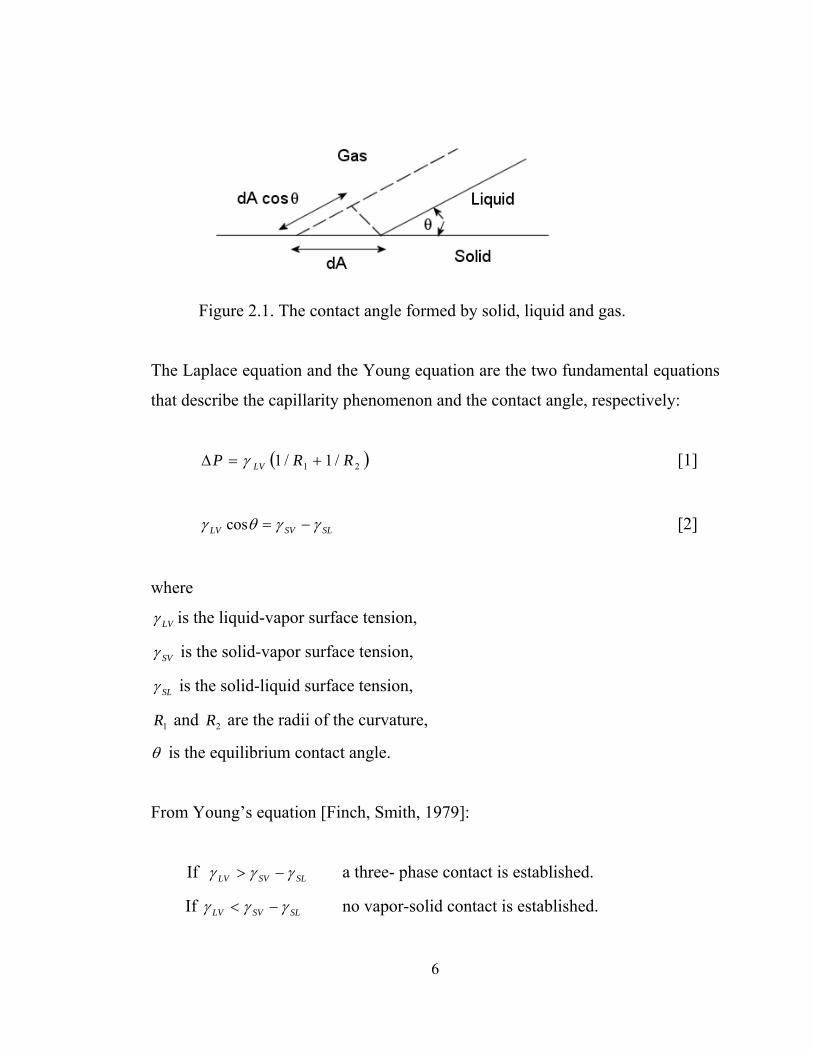
Figure 2.1. The contact angle formed by solid, liquid and gas.
The Laplace equation and the Young equation are the two fundamental equations
that describe the capillarity phenomenon and the contact angle, respectively:
( 21 /1/1 RRP LV +=∆ )γ [1]
SLSVLV γγθγ −=cos [2]
where
LVγ is the liquid-vapor surface tension,
SVγ is the solid-vapor surface tension,
SLγ is the solid-liquid surface tension,
1R and are the radii of the curvature, 2R
θ is the equilibrium contact angle.
From Young’s equation [Finch, Smith, 1979]:
If SLSVLV γγγ −> a three- phase contact is established.
If SLSVLV γγγ −< no vapor-solid contact is established.
6
Page 29
The solid-liquid interfacial tension and liquid-vapor interfacial tension must be
high and solid-vapor interfacial tension must be low for good flotation.
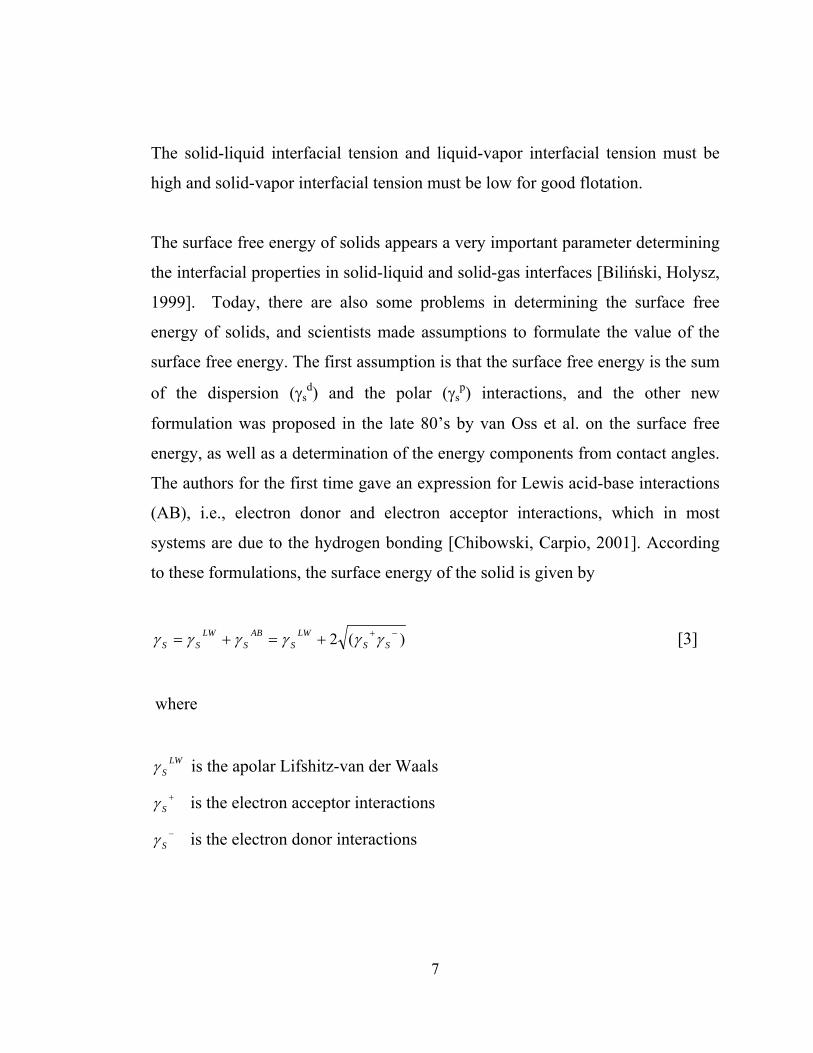
The surface free energy of solids appears a very important parameter determining
the interfacial properties in solid-liquid and solid-gas interfaces [Biliński, Holysz,
1999]. Today, there are also some problems in determining the surface free
energy of solids, and scientists made assumptions to formulate the value of the
surface free energy. The first assumption is that the surface free energy is the sum
of the dispersion (γsd) and the polar (γs
p) interactions, and the other new
formulation was proposed in the late 80’s by van Oss et al. on the surface free
energy, as well as a determination of the energy components from contact angles.
The authors for the first time gave an expression for Lewis acid-base interactions
(AB), i.e., electron donor and electron acceptor interactions, which in most
systems are due to the hydrogen bonding [Chibowski, Carpio, 2001]. According
to these formulations, the surface energy of the solid is given by
)(2 −++=+= SSLW
SAB
SLW
SS γγγγγγ [3]
where
LW
Sγ is the apolar Lifshitz-van der Waals +
Sγ is the electron acceptor interactions −
Sγ is the electron donor interactions
7
Page 30
The solid liquid interaction is given by the following equation :
⎥⎦⎤
⎢⎣⎡ ++−+= +−−+ )()()(2 SSSS
LWL
LWSLSSL γγγγγγγγγ [4]
when combined with the Young equation
SLaLS γθγγ += cos. [5]
and
aLSSL W−+= γγγ [6]
where θa is the advancing contact angle and,
Wa is the work of adhesion
⎥⎦⎤
⎢⎣⎡ ++=+= +−−+ )()()(2)cos1( LSLS
LWL
LWSaLaW γγγγγγθγ [7]
These equations help to determine the surface properties and the surface free
energy components.
2.3.1 Adhesion, cohesion and spreading
When generating 2 new interfaces of unit area the free energy is
∆G = 2γA = WAA [8]
WAA is the work of cohesion and it measures the attraction between the molecules
of the liquid. The free energy change between two liquids is given by
8
Page 31
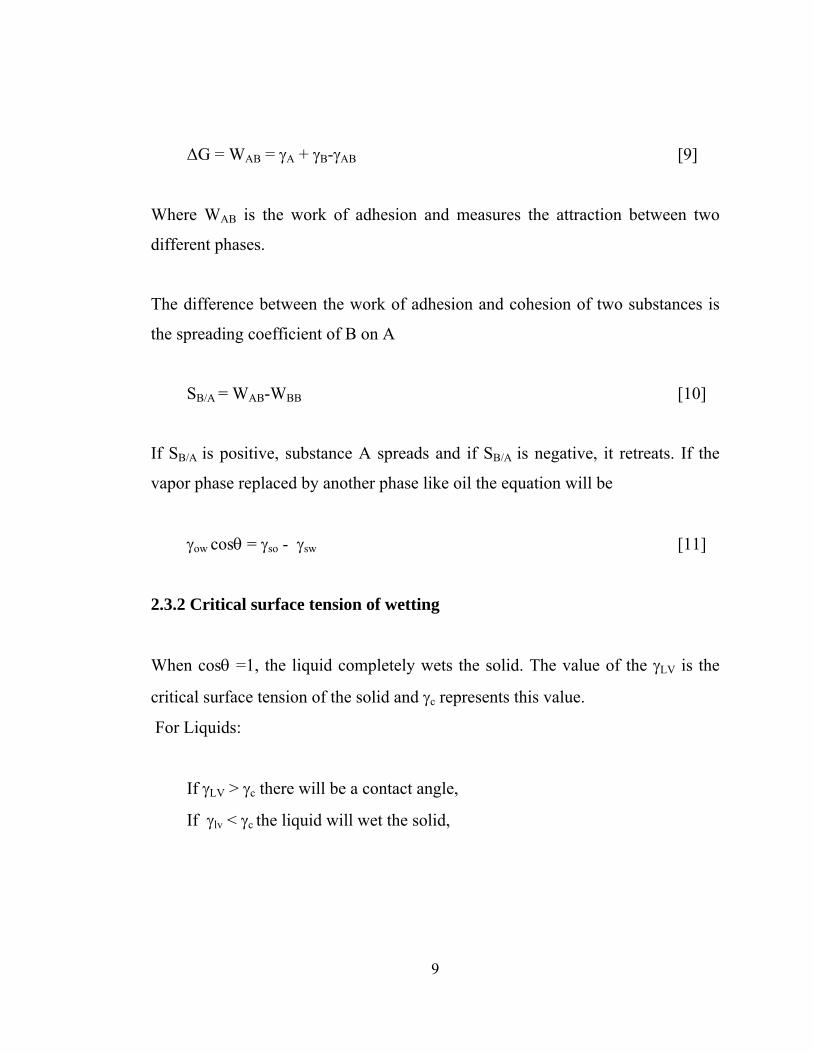
∆G = WAB = γA + γB-γAB [9]
Where WAB is the work of adhesion and measures the attraction between two
different phases.
The difference between the work of adhesion and cohesion of two substances is
the spreading coefficient of B on A
SB/A = WAB-WBB [10]
If SB/A is positive, substance A spreads and if SB/A is negative, it retreats. If the
vapor phase replaced by another phase like oil the equation will be
γow cosθ = γso - γsw [11]
2.3.2 Critical surface tension of wetting
When cosθ =1, the liquid completely wets the solid. The value of the γLV is the
critical surface tension of the solid and γc represents this value.
For Liquids:
If γLV > γc there will be a contact angle,
If γlv < γc the liquid will wet the solid,
9
Page 32
and the cosθe is related to γlv by
cosθe = 1 – b (γlv - γc) [12]
where b is the constant, and the cosθ versus γlv plot is the Zisman plot and the
equation is the Zisman equation.
2.3. Contact Angle Measurements
2.3.1 Direct measurements of contact angle
It is observed that in most instances a liquid placed on a solid will not wet but it
remains as a drop having a definite angle of contact between the liquid and solid
phases [Adamson, 1967]. The direct measurement of the contact angles can be
applicable for large sample of solids. The tilting plate method has given the most
reproducible and probably the most accurate contact angle values. A several
centimeter wide plate of the solid dips into the liquid, and its position is altered by
means of an adjustable mount until the angle such that the liquid surface appears
to remain perfectly flat right up to the surface of the solid [Adamson, 1967].
The other technique for measuring the contact angles directly is the sessile drop
method. Sessile drop technique is a widely used for measuring the direct contact
angle. For this measurement the surface of the solid must be smooth and clean
then the solid dips into the liquid and on the surface a bubble is formed, the angle
between sessile drop and solid can be read from goniometer.
10
Page 33
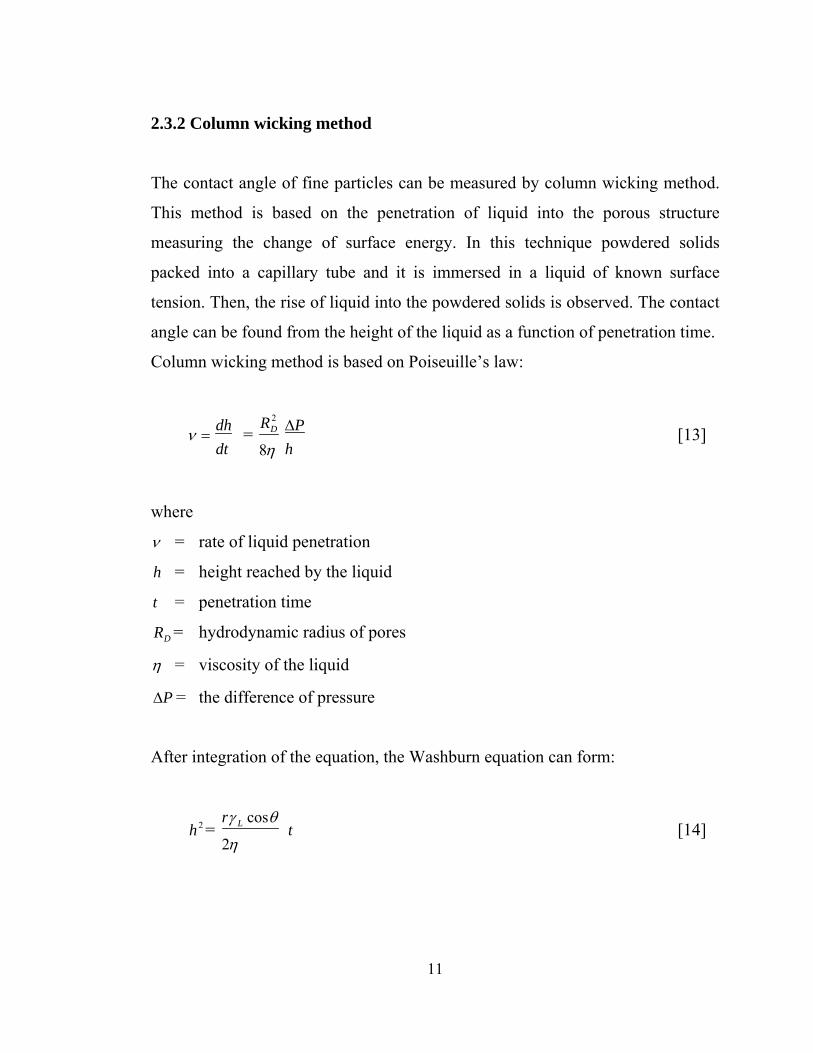
2.3.2 Column wicking method
The contact angle of fine particles can be measured by column wicking method.
This method is based on the penetration of liquid into the porous structure
measuring the change of surface energy. In this technique powdered solids
packed into a capillary tube and it is immersed in a liquid of known surface
tension. Then, the rise of liquid into the powdered solids is observed. The contact
angle can be found from the height of the liquid as a function of penetration time.
Column wicking method is based on Poiseuille’s law:
=νdtdh =
η8
2DR
hP∆ [13]
where
ν = rate of liquid penetration
h = height reached by the liquid
t = penetration time
DR = hydrodynamic radius of pores
η = viscosity of the liquid
P∆ = the difference of pressure
After integration of the equation, the Washburn equation can form:
2h = η
θγ
2
cosLr t [14]
11
Page 34
There are some modifications of the column wicking method which are based on
the equation
W = 2πrγcosθ [15]
When the contact angle is zero:
W = mg = 2πrγ [16]
Where m is the mass of the liquid and g is the gravitational acceleration.
If there is a contact angle liquid enters the capillary at dynamic advancing contact
angle, the equation will be:
ma g = 2πrγcos θa = 2rπ∆Ga [17]
where ∆Ga the specific free energy change. For the receding contact angle, the
above equation takes the form
mrg = 2πrγcosθr = 2rπ∆Gr [18]
2.3.3 Thin layer wicking method
Thin layer technique is based on the phenomena of a liquid penetration (wicking)
into a solid porous layer deposited on a glass plate, e.g. microscope slide. The
surface free energy components are then calculated from the proper form of the
Washburn equation [Teixeira, et al, 1998].
12
Page 35
In the thin layer technique, the powdered solid deposited on a microscopic slide
in the form of aqueous slurry then the sample is dried and one side of the slide is
immersed in a liquid in the vertical position and the liquid penetrates into the
solid slowly.
Thin layer wicking method also uses the Washburn equation. The only problem
in these experiments is the calculation of r value. r value can be determined from
the low energy liquids such as hexane, benzene, methanol, formamide.
The methods which are based on Washburn equation give only advancing contact
angles rather than equilibrium contact angles.
Contact angle can be measured directly by compressing the powders into pellets
but this method is not recommended. The surface properties such as surface
roughness, liquid adsorption and porosity can change in the pressing phase so the
measurement of contact angle using pellets is only an assumption.
2.3.4 Hysteresis in contact angle
From the contact angle studies, it is observed that the receding and advancing
contact angles can be different. The past experiments show that θA (Advancing
Contact Angle) should be bigger than θR (Receding Contact Angle) and the
difference between θA and θR called contact angle hysteresis. The effect can be
quite large, for water on surfaces of minerals the advancing contact angle may be
as much as 50° larger than the receding one [Adamson, 1967].
13
Page 36
There are some causes of contact angle hysteresis. One of them is the liquid or
solid contamination. The scientists studied with graphite and they found that
cleaning can prevent the hysteresis [Fowkes 1964, Harkins, 1922].
Surface roughness is another effect of hysteresis. Johnson and Dettre studied
surface roughness for water on a polytetrafluoroethylene wax and from their
experiments they found the given equation [Finch, Smith, 1979].
cosθr = r.cosθe [19]
where θr is the contact angle observed on a surface roughness r, θe is the
equilibrium contact angle, and r is the ratio of real surface area to the area
assuming a smooth surface.
There are some scientists who studied the roughness effect on the contact angle.
Oliver and Mason studied microspreading on rough surfaces by scanning electron
microscopy, Cox also made equilibrium configurations during liquid spreading
over periodic and randomly surfaces [Osipow, 1962].
Surface heterogeneity is the other effect for hysteresis . Cassie and Baxter studied
for the effect of surface heterogeneity and they found an equation which was
obtained from Wenzel equation:
2211 coscoscos θθθ ffh += [20]
14
Page 37
where
θh is the thermodynamic equivalent of θ for a heterogeneous surface.
1f and are the respective fractional surface area of region 1 and 2. 2f
θ1 is the contact angle in region 1.
θ2 is the contact angle in region 2.
The local contact angle will depend on the surface energy of the region with
which liquid is in contact [Finch, Smith, 1979].
2.4 The theory of the proposed method of contact angle measurement
The pressure required to prevent a liquid from penetrating a single capillary tube
of radius r, or that required to drain the capillary , is given by the Laplace
equation:
∆P = r
LA θγ cos2 [21]
where γLA is the liquid surface tension, and θ is the solid-liquid contact angle.
Using the Laplace equation for packed particle beds requires a properly chosen
equivalent radius. Kozeny assumed that the pore space of packed beds could be
regarded as equivalent to a bundle of parallel capillaries with a common
equivalent radius, and with a cross-sectional shape representative of the average
shape of the pore cross section. The equivalent radius, re, for a packed bed was
formulated as [Allen, 1977]:
15
Page 38
re = 2 × solidsof area surface
voidsof volume = 2× VSe
e)1(
− [22]
where e is the packed ped porosity (volume fraction of voids), and SV is the
volume specific surface area of solids, which may be related to an equivalent
diameter, dp, or irregularly shaped particles of the particle bed by the equation
VS = p
SV
d
α [23]
where αSV is the ratio of surface to volume shape factor of particles and is
specific to definition of the equivalent diameter (sieve diameter, surface diameter,
volume diameter, etc). Furthermore, one has to allow for random orientation of
capillaries in a packed bed by introducing a correction factor c [Heertjes and
Kossen, 1967]. The Laplace equation for the capillary pressure of a packed bed
then takes the form.
∆P = k Pde
e
.
)1( − θγ cosLA [24]
where the entry pressure coefficient k is 2αSV /c. This form of the Laplace
equation has been used as means of studying the moisture-retention
characteristics of porous masses. For example, attemps have been made to
correlate the lowest pressure drop, or the so-called entry pressure, required to
dewater an initially saturated filter cake [Wakeman, 1976; Puttock et al.,1986;
Hosten and Sastry, 1989; Condie et al.,1996; Besra et al.,200; Hosten and San,
2002]
16
Page 39
For a filter cake of unknown entry pressure coefficient k, it is appropriate to
correlate the residual saturation of the cake in its funicular drainage state against
the group of terms on the left side of the following rearranged form of Eq (24).
LA
P
e
Pde
γ)1(
.
−
∆= θcos.k [25]
Plots of residual cake saturation versus the adjusted pressure on the left-hand side
of the above equation yield straight lines for residual saturations between 1.0 and
0.60 of vacuum-dewatered filter cakes [Hosten and Sastry, 1989; Hosten and San,
2002]. This cake saturation range corresponds to the funicular state of the filter
cake in which the liquid front recedes to its equilibrium capillary drain height
without any air breakthrough. By definition of the entry pressure in Eq (24), the
value of the adjusted pressure corresponding to the intercept of the linear portion
of the plots with the full saturation line should yield the coefficient k for the cake,
provided that a perfectly wetting probe liquid (cosθ = 1) is used. Having
determined the value of k, cake drainage tests may be repeated with partially
wetting liquids or surfactant solutions of interest on equivalent powders to
determine apparent contact angles by comparing full-saturation intercepts of the
linear plots.
17
Page 40
CHAPTER 3
EXPERIMENTAL MATERIAL AND METHODS
3.1 Preparation of Samples
The samples of zircon (ZrSiO4) and rutile (TiO2) which were used in this research
were obtained from DuPont Starke, Florida Operations. The zircon sample
contained 67.22 % ZrO2 , 31.11 % SiO2, 0.11 % TiO2. The rutile sample
contained 96.66 % TiO2, 0.48 % SiO2, 0.39 % ZrO2 and 0.32 % Fe2O3.
Zircon and rutile samples were prepared for experiments by reducing the size in a
porcelain mortar to avoid iron contamination. After reducing the sizes, zircon and
rutile samples dry screened to yield 150x200 mesh for capillaric dewatering,
column wicking and microflotation experiments.
Zircon and rutile samples were purified with dry magnetic separator to eliminate
the iron impurities. After purifying with magnetic separator, the samples cleaned
by rinsing in warm HNO3. Nitric acid ensured to remove the other powders and
cleaned the rutile, zircon samples. The rutile, zircon samples which were treated
with warm nitric acid were washed with distilled water several times until the
samples were completely purified from HNO3. Samples were dried in an oven
with 50° C temperature after cleaning procedure. The zircon and rutile samples
are known to have iso-electric points at pH 4.4 and pH 3.5, respectively.
18
Page 41
All the materials (crucible, rod, glasses, etc.) which were used for experiments
were cleaned with hot chromic acid, then washed with distilled water until the
green colour of chromic acid disappeared.
3.2 Reagents
Dodecyl amine (CH3(CH2)11NH2), sodium dodecyl sulfate (C12H25SO4Na),
methanol and distilled water were used in capillaric dewatering, column wicking
and microflotation experiments. HCl and NaOH were used as pH regulators.
Dodecyl amine was used as a non-wetting agent in the experiments. An amount
of dodecyl amine which would be used for stock solution was taken and heated
in a pH 4.5-5 solution (distilled water and HCl) to dissolve dodecyl amine and
make the solution homogeneous, then 10-1 M stock solution was prepared. The
required concentrations were prepared from the stock solution.
Sodium dodecyl sulfate was used as another non-wetting chemical in the
experiments. 10-1 M stock solution was prepared from dry powder of the chemical
and the required concentrations were prepared from the stock solutions.
3.3 Experimental Procedure and Methods
3.3.1 Dewatering of filter cakes
Dewatering experiments were conducted in a glass filter crucible of 50 ml
capacity, the bottom of which consisted of a sintered disc of 40-mm diameter and
a porosity index No. 4. Following the cleaning procedure, 50 g of dry particulate
sample was put in the crucible and the crucible was filled with liquid until the
19
Page 42
level of the liquid was enough to mix the sample with liquid. The sample was
mixed with liquid (water, surfactant solution or methanol) by the help of a glass,
stirring rod to form a slurry. The crucible was then securely fitted to a vacuum
flask by means of a rubber stopper and the thoroughly mixed slurry was allowed
to drain by gravity, or by applying a slight vacuum, forming a fully saturated
filter cake on the sintered disc (Figure 3.1). At this moment, the crucible was
removed from the flask and quickly weighed on an electronic balance without
disturbing the filter cake. Any excess liquid remaining on the bottom of the
crucible or the porous disc was wiped off before the weighing process.
Immediately after the weighing the crucible was placed back on the vacuum flask
and a small vacuum (0.5 in Hg) was applied to dewater the filter cake to its
residual saturation level, which generally took around two minutes of dewatering
time. The vacuum was then shut off, the crucible was removed and quickly
weighed, and placed back on the vacuum system. The vacuum level was
incremented by another 0.5 in Hg and the cake was again dewatered to it new
residual saturation level and then weighed. This procedure was repeated several
times to obtain residual saturation data at various vacuum levels within the
capillaric (or funicular) dewatering regime.
3.3.2 Column Wicking
Column wicking experiments were conducted in a clear plastic tube of 10 cm
height and 2 mm width, the bottom of which was closed with a fritted disc. The
dried powder was packed into the tube by tapping. The tube was then placed
vertically so that the bottom of the tube was just in contact with the liquid. The
rise of the liquid up the packed bed of particles was measured as a function of
time.
20
Page 43
Figure 3.1. The illustration of capillaric dewatering experiments
Figure 3.2. The illustration of column wicking experiments
21
Page 44
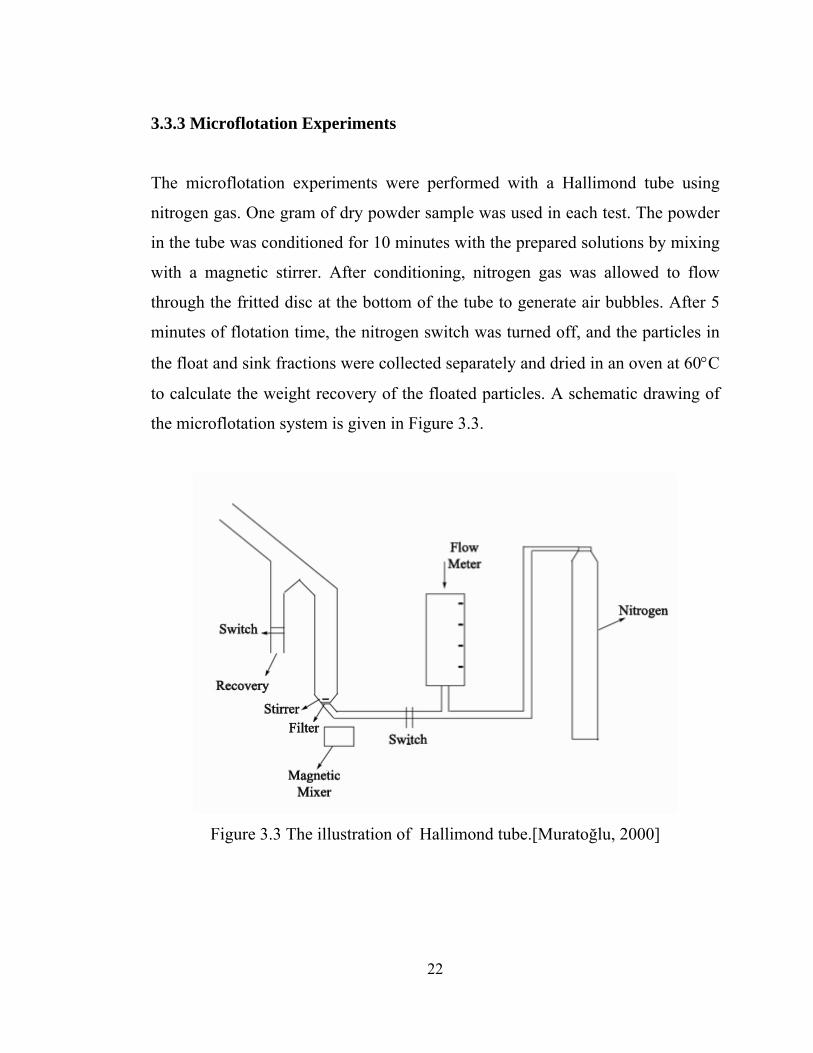
3.3.3 Microflotation Experiments
The microflotation experiments were performed with a Hallimond tube using
nitrogen gas. One gram of dry powder sample was used in each test. The powder
in the tube was conditioned for 10 minutes with the prepared solutions by mixing
with a magnetic stirrer. After conditioning, nitrogen gas was allowed to flow
through the fritted disc at the bottom of the tube to generate air bubbles. After 5
minutes of flotation time, the nitrogen switch was turned off, and the particles in
the float and sink fractions were collected separately and dried in an oven at 60°C
to calculate the weight recovery of the floated particles. A schematic drawing of
the microflotation system is given in Figure 3.3.
Figure 3.3 The illustration of Hallimond tube.[Muratoğlu, 2000]
22
Page 45
CHAPTER 4
EXPERIMENTAL RESULTS AND DISCUSSION
In this chapter the results of capillaric dewatering experiments, column wicking
experiments and microflotation experiments are given and compared by the help
of figures.
4.1 Capillaric dewatering experiments
First the capillaric dewatering experiments were performed with methanol (the
completely wetting liquid), water and water-methanol mixtures for zircon and
rutile samples.
4.1.1 Experiments with zircon
It is shown in Figure 4.1 that, from the capillaric dewatering experiments by
using methanol, we can find the value of k.cosθ = 8.00. It is known that methanol
is a completely wetting liquid and therefore θ = 0. Hence,
k.cosθ = 8.00, θ = 0 ⇒ k = 8.00
23
Page 46
This k value for the zircon sample will be used in all calculations in the rest of the
thesis. The contact angle of zircon with water can then be found from the
equation
k.cosθ = 6.02 ⇒ 8.00. cosθ = 6.02 ⇒ θ = 41.19° for water
F
igure 4.1 Residual cake saturation versus k.cosθ plots for -150 + 200 mesh zircon
when water or methanol was used as the liquid.
6.02 8.00
Zircon - WaterZircon - Methanol
1.000
Satu
ratio
n 0.800
0.600
0.400
0.200
0.0000.00 5.00 10.00 15.00
k.cosθ
Figures 4.2 through 4.7 show the experimental results obtained with the cake
dewatering of zircon samples when various mixtures of water and methanol were
used as the medium liquid. The purpose of these experiments was to find critical
(k.cosθ) values from which the contact angle values could be obtained for the
liquids of varying surface tension.
24
Page 47
6.18
1.000
0.800Sa
tura
tion
Zircon-10% Methanol0.600
Zircon- Methanol0.400
0.200
0.0000.00 5.00 10.00 15.00
k cos θ
Figure 4.2 Residual cake saturation versus k.cosθ plots for -150 + 200 mesh
zircon when methanol or a water-methanol mixture was used as the liquid.
6.16
Zircon - MethanolZircon-25% Methanol
1.000
0.800
Satu
ratio
n
0.600
0.400
0.200
0.0000.00 5.00 10.00 15.00
k cosθ
Figure 4.3 Residual cake saturation versus k.cosθ plots for -150 + 200 mesh
zircon when methanol or a water-methanol mixture was used as the liquid.
25
Page 48
6.55
1.0000.800
Satu
ratio
n
Zircon-40% Methanol0.600
Zircon - Methanol0.4000.2000.000
0.00 5.00 10.00 15.00
k cosθ
Figure 4.4 Residual cake saturation versus k.cosθ plots for -150 + 200 mesh
zircon when methanol or a water-methanol mixture was used as the liquid.
6.75
Zircon - MethanolZircon-50% Methanol
1.0000.800
Satu
ratio
n 0.6000.4000.2000.000
0.00 5.00 10.00 15.00
k cosθ
Figure 4.5 Residual cake saturation versus k.cosθ plots for -150 + 200 mesh
zircon when methanol or a water-methanol mixture was used as the liquid.
26
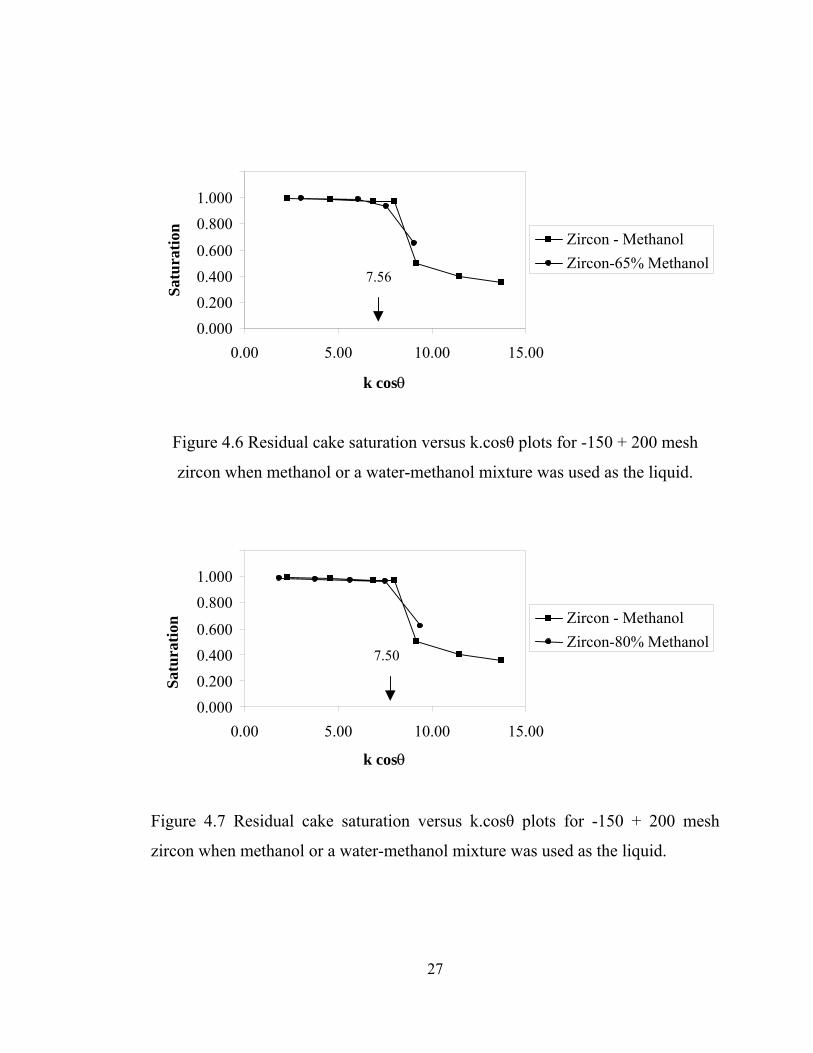
Page 49
7.56
1.0000.800
Satu
ratio
n
Zircon - Methanol0.600
Zircon-65% Methanol0.4000.2000.000
0.00 5.00 10.00 15.00
k cosθ
Figure 4.6 Residual cake saturation versus k.cosθ plots for -150 + 200 mesh
zircon when methanol or a water-methanol mixture was used as the liquid.
7.50
1.0000.800
Zircon - MethanolZircon-80% Methanol
Satu
ratio
n 0.6000.4000.2000.000
0.00 5.00 10.00 15.00
k cosθ
Figure 4.7 Residual cake saturation versus k.cosθ plots for -150 + 200 mesh
zircon when methanol or a water-methanol mixture was used as the liquid.
27
Page 50
Knowing the previously found k = 8.0 value for the zircon filter cakes, we can
calculate the contact angle values from the k.cosθ values obtained from the
figures for the cases where we have different liquid surface tensions resulting
from using varying amounts of methanol in mixture with water. Table 4.1 and
Figure 4.8 present the contact angle values found by this procedure.
Table 4.1 The contact angle and k.cosθ values for the zircon sample as obtained
from cake dewatering tests using water-methanol mixtures.
Methanol
% in water
100 80 65 50 40 25 10 0
k.cosθ 8.00 7.50 7.56 6.75 6.55 6.16 6.18 6.02
Contact angle, ° 0 20.36 19.09 32.46 35.04 39.64 39.42 41.19
05
1015202530354045
0 20 40 60 80 100 120
Methanol, %
θ
Figure 4.8 Contact angle values obtained with zircon by using methanol-water
mixtures.
28
Page 51
These results give us an idea that the capillaric dewatering method can be an
applicable method for contact angle measurements because we know that
methanol is a completely wetting liquid and always gives zero contact angle with
all minerals. When the proportion of methanol in the mixture increases, the
surface tension of the contacting liquid decreases, and, therefore, the contact
angle of the methanol-water mixture on the zircon particle surfaces decreases.
Having proven the applicability of the new method with methanol, similar tests
were conducted with a surfactant, dodecyl amine (DA), which is a common
flotation collector. Figures 4.9 and 4.10 show the contact angles of zircon, as a
function of pH when 10-5 M dodecylamine solutions were used as the liquid in
cake dewatering tests. The k.cosθ values obtained from the point where the sharp
decrease of saturation occurred and the known value of k = 8.0 for the zircon
filter cakes were again used to calculate the contact angle values. Table 4.2 and
Figure 4.10 summarize the results obtained as such.
5.28 6.01 6.21
pH 10pH 6pH 4
0.000
0.00
1.000
0.8000.600
0.4000.200
Satu
ratio
n
2.00 4.00 6.00 8.00 10.00
k.cosθ
Figure 4.9 Residual cake saturation versus k.cosθ plots for -150 + 200 mesh
zircon when 10-5M dodecylamine solution was used as the liquid.
29
Page 52
Table 4.2. The contact angle and k.cosθ values from the cake dewatering experiments with -150+200 mesh zircon by using 10-5 M dodecylamine at various pH values of the solution. pH 4 6 8 10 Contact angle, θ° 41.30 48.70 49.74 39.8 k.cosθ 6.01 5.28 5.17 6.21
55.0050.0045.00θ
40.0035.0030.00
0 2 6 8 10 12 4
pH
Figure 4.10 The contact angle values for the -150+200 mesh zircon sample in
contact with 10-5M dodecylamine solutions at various pH values.
It is obvious from the contact angle values that the highest hydrophobicity was
obtained in a pH range 6 to 8. This must be the range where maximum adsorption
of cationic dodecylamine ions occurred on negatively charged zircon surfaces, the
iso-electric point of which was known to be pH 4.4.
Similar dewatering experiments were also performed with zircon by using
5.10-5 M dodecylamine solutions at different pH values, and the results obtained
were almost identical with those obtained by using 10-5 M dodecyl amine.
Therefore, figures and the contact angle values pertinent to the experiments with
10-5 M dodecyl amine solutions were not included here in the text to avoid
30
Page 53
repetition, but the data can be found in the appendix. The contact angle
measurements could not performed with 10-4 M dodecylamine because of particle
aggregation problems at such a high concentration of the surfactant.
Another common surfactant, but of anionic type, namely, sodium dodecyl sulfate
(SDS), was also tested for generating zircon surfaces with different degrees of
hydrophobicity. Figure 4.11 presents the experimental results from the
dewatering of filter cakes of zircon particles treated with sodium dodecyl sulfate
at various pH values. This surfactant is known to adsorb on the silicate or oxide
mineral surfaces dominantly by electrostatic interaction; therefore, no effect on
the contact angle was observed at pH values of 4, 6, and 8 as the zircon particle
surfaces are either neutral or negatively charged at these pH values (i.e.p. is
around pH4.4). On the other hand, the surfaces are positively charged at pH 2,
and the anionic SDS can adsorb on the surfaces and make them more
hydrophobic. The measured contact angles with SDS at pH 2 were 49.6°, 52°, and
53.2° for 10-5 M, 5x10⁻⁵ M, and 10-4 M solutions, respectively. It is obvious that an
order of magnitude increase in SDS concentration beyond 10-5M can cause only a
slight increase in the contact angle.
31
Page 54
4.79
0.0000.2000.4000.6000.8001.000
Satu
ratio
n
pH 8pH 6pH 4pH 2
0.00 2.00 4.00 6.00 8.00 10.00
k.cosθ
Figure 4.11 Residual cake saturation versus k.cosθ plots for -150 + 200 mesh
zircon when 10-4 M sodium dodecyl sulfate solution was used as the liquid.
4.1.2 Experiments with Rutile
It is shown in Figure 4.12 that, from the capillaric dewatering experiments by
using the completely wetting (θ = 0°) liquid methanol, we can find the value of k
as 8.64. This value is again a fixed reference for all the other experiments
preformed with the rutile sample. Referring the k.cosθ = 7.26 value and knowing
the k value, we can calculate that the contact angle between rutile and water is
32.83° which is almost 10° lower than that found for zircon.
Figures 4-13 through 4.18 present the residual cake saturation versus k.cosθ plots
for the rutile sample treated with water-methanol mixtures of varying methanol
proportions to change the surface tension of the mixture liquid. Figure 4-19
shows the surface tension of the water-methanol mixtures.
32
Page 55
Table 4.3 summarizes the information derived from the figures. Again, the
contact angle increases with the increase in the liquid surface tension, or with the
decrease in the proportion of methanol in the mixture. It is obvious that water is a
partially-wetting liquid for rutile as well as zircon, because we observe finite
contact angles with the use of water as the liquid in dewatering experiments.
7.26 8.64
Rutile - WaterRutile - Methanol
1.0000.800
Satu
ratio
n
0.6000.4000.2000.000
0.00 5.00 10.00 15.00
k.cosθ
Figure 4.12 Residual cake saturation versus k.cosθ plots for -150 + 200 mesh
rutile when water or methanol was used as the liquid.
7.91
1.000
Satu
ratio
n 0.800Rutile-10% Methanol
0.600Rutile - Methanol
0.400
0.200
0.0000.00 5.00 10.00 15.00
k.cosθ
Figure 4.13 Residual cake saturation versus k.cosθ plots for -150 + 200 mesh
rutile when methanol or a water-methanol mixture was used as the liquid.
33
Page 56
8.04
1.000
0.800Sa
tura
tion
Rutile-25% Methanol0.600
Rutile - Methanol0.400
0.200
0.0000.00 5.00 10.00 15.00
k.cosθ
Figure 4.14 Residual cake saturation versus k.cosθ plots for -150 + 200 mesh
rutile when methanol or a water-methanol mixture was used as the liquid.
7.81
Rutile-40% MethanolRutile - Methanol
0.000
5.000.00
1.000
0.800
0.600
0.400
0.200
Satu
ratio
n
10.00 15.00
k.cosθ
Figure 4.15 Residual cake saturation versus k.cosθ plots for -150 + 200 mesh
rutile when methanol or a water-methanol mixture was used as the liquid.
34
Page 57
Figure 4.16 Residual cake saturation versus k.cosθ plots for -150 + 200 mesh
rutile when methanol or a water-methanol mixture was used as the liquid.
Figure 4.17 Residual cake saturation versus k.cosθ plots for -150 + 200 mesh
rutile when methanol or a water-methanol mixture was used as the liquid.
8.05
0.000
1.200
1.000
0.800Sa
tura
tion
Rutile-50% Methanol0.600
Rutile - Methanol0.400
0.200
0.00 5.00 10.00 15.00
k.cosθ
8.25
Rutile-65% MethanolRutile - Methanol
0.000
5.000.00
1.200
1.000
0.800
0.600
0.400
0.200
Satu
ratio
n
10.00 15.00
k.cosθ
35
Page 58
8.29
Rutile-80% MethanolRutile - Methanol
0.000
5.000.00
1.200
1.000
0.800
0.600
0.400
0.200
Satu
ratio
n
10.00 15.00
k.cosθ
Figure 4.18 Residual cake saturation versus k.cosθ plots for -150 + 200 mesh
rutile when methanol or a water-methanol mixture was used as the liquid.
00.010.020.030.040.050.060.070.08
0 20 40 60 80 100 120
Methanol, %
Surfa
ce te
nsio
n, N
/M
Figure 4.19 Surface tension values of methanol mixtures.
36
Page 59
Table 4.3 The contact angle and k.cosθ values for the rutile sample as obtained
from cake dewatering tests using water-methanol mixtures.
Methanol Contact Angle k.cosθ
% θ
100 0 8.64
80 16.36 8.29
65 17.28 8.25
50 21.29 8.05
40 25.31 7.81
25 21.47 8.04
10 23.72 7.91
0 32.83 7.26
Cake dewatering experiments using dodecyl amine and sodium dodecyl sulfate
solutions at various pH values were also conducted with the rutile sample. The
data obtained were again plotted as saturation-versus-k.cosθ graphs, critical
points on the plots were found, and the contact angles were calculated. Table 4.4
summarizes the results.
Dodecyl amine is again most effective at around pH 6 in increasing the contact
angle, but the angle is almost 10° smaller than the maximum angle obtained in
the case of zircon-dodecyl amine system. Sodium dodecyl sulfate was again
effective only at pH 2 where the rutile surface is positively charged and led to
more or less the same contact angles (54°) as the zircon-sodium dodecyl sulfate
system at the optimal addition of the surfactant (10-4M).
37
Page 60
Table 4.4 Contact angles for rutile obtained from dewatering experiments using
dodecyl amine and sodium dodecyl sulfate solutions at various pH values.
Concentration pH Contact Angle
4 35.31
10-5 M DA 6 37.22 8 35.66 10 33.19 4 35.43
5.10-5 M DA 6 38.41 8 35.99 10 32.71 4 39.04
10-4 M DA 6 40.91 8 41.71 10 33.79
10-4 M SDS 2 54.96 5.10-5 M SDS 2 53.32 10-5 M SDS 2 40.19
Distilled Water 5.5 32.83
4.2 Column Wicking Experiments
Column wicking experiments were performed to compare the contact angle
values obtained from capillaric dewatering experiments. However, one must keep
in mind that the column wicking method measures the advancing contact angle
and the new method proposed in this thesis measures the receding contact angle.
As we have already pointed out that the advancing contact angle may be as much
as 50° larger than the receding contact angle.
38
Page 61
Figure 4.20 shows the plots obtained from the column wicking experiments with
the zircon sample when methanol, hexane, formamide, and water are individually
used as the liquid. Coinciding plots of methanol, hexane, and formamide justify
that the methanol is, in fact, a completely-wetting liquid since it is known from
the pertinent literature that hexane has been used as a completely-wetting liquid.
The quantity A in the vertical axis of the figure is given by
A = ⎟⎟⎠
⎞⎜⎜⎝
⎛
L
h
γ
η..2 2
[26]
so that the slope of the linear plot is equal to R.cosθ, where R is the effective
interstitial pore radius between the packed particles in the column. Since cosθ = 1
for a completely-wetting liquid, the value of R for a certain packed bed of
particles can be directly calculated from the slope of the plot of the completely-
wetting liquid. Knowing the value of R, the contact angle for a partially-wetting
liquid may be found agin by the slope of its linear plot. For example, from the
column wicking plot of methanol-zircon system R = 0.02405, and for the water-
zircon system
R.cosθ = 0.00826
0.02405. cosθ = 0.00687 ⇒ θ = 69.91°
This is the advancing contact angle for water-zircon system and, as expected, it is
greater than the receding contact angle (41.19°) obtained by the cake dewatering
method by almost a difference of 29°.
A similar set of column wicking plots are given for rutile in Figure 4.21, from
which it can be calculated that the advancing contact angle for water-rutile system
is 63.55° which is approximately 30° greater than the receding contact angle
found by the dewatering method. The resemblence with the zircon-water system
is quite striking.
39
Page 62
0
0.5
1
1.5
2
2.5
3
3.5
4
0 50 100 150 200
seconds
AZircon - WaterZircon - MethanolZircon - HexaneZircon -Formamide
Figure 4.20 Column wicking plots for -150+200 mesh zircon particles with
completely-wetting organic liquids and partially-wetting liquid water.
0
0.5
1
1.5
2
2.5
3
3.5
4
0 100 200 300
Seconds
A
Rutil-HexaneRutil-MethanolRutil-Water
Figure 4.21 Column wicking plots for -150+200 mesh rutile particles with
completely-wetting organic liquids and partially-wetting liquid water.
40
Page 63
Figures 4.22 and 4.23 show the column wicking plots for zircon and rutile,
respectively, with the use of water-methanol mixtures. The receding contact
angles derived from these figures are presented in Table 4.5 and Table 4.6.
0
0.5
1
1.5
2
2.5
0 50 100 150
seconds
A
Zircon - % 10 MZircon - % 25 MZircon - % 40 MZircon - % 50 MZircon - % 65 MZircon - % 80 MZircon - MZircon - Water
Figure 4.22 Column wicking plots for -150+200 mesh zircon particles with water-methanol mixtures.
0
0.2
0.4
0.6
0.8
1
1.2
1.4
1.6
0 50 100 150
seconds
A
% 10 Methanol% 25 Methanol%40 Methanol% 50 Methanol% 65 Methanol% 80 Methanol
Figure 4.23 Column wicking plots for -150+200 mesh rutile particles with water-methanol mixtures.
41
Page 64
Table 4.5 The advancing and receding contact angles of zircon with water-methanol mixtures in the column wicking experiments.
Liquid θA θR θA – θR
Water 69.91 41.19 28.72 10% Methanol 69.49 39.42 30.07 25% Methanol 65.32 39.64 25.68 40% Methanol 66.91 35.04 31.87 50 % Methanol 60.66 32.46 28.2 65% Methanol 52.92 19.09 33.83 80 % Methanol 51.32 20.36 30.96 Methanol 0 0 0
Table 4.6 The advancing and receding contact angles of rutile with water-
methanol mixtures in the column wicking experiments.
Liquid θA θR θA – θR
Water 63.55 32.83 30.72 10% Methanol 62.14 23.72 38.42 25% Methanol 61.99 21.47 40.72 40% Methanol 59.10 25.31 33.79 50 % Methanol 56.46 21.29 35.17 65% Methanol 45.95 17.28 28.67 80 % Methanol 34.94 16.36 18.58 Methanol 0 0 0
We can see from the tables that there is a difference of 20° to 40° between the
advancing contact angles obtained from column wicking experiments and the
receding contact angles obtained from cake dewatering experiments.
Column wicking experiments were also conducted with dodecyl amine and
sodium dodecyl sulfate solutions to make a comparison with the cake dewatering
experiments, and the results are presented in Figures 4.24-4.30 and Tables 4.7 and
4.8
42
Page 65
1.2
1
0.810-5 M - pH 4 10-5 M - pH 6 10-5 M - pH 8 10-5 M - pH 10
A0.6
0.4
0.2
00 50 100 150
seconds
Figure 4.24 Column wicking plots for -150+200 mesh zircon particles with
10-5 M dodecyl amine at different pH values.
1.2
1
0.85.10-5 M - pH 4 5.10-5 M - pH6 A
0.65.10-5 M - pH 8 5.10-5 M - pH 10
0.4
0.2
00 50 100 150
seconds
Figure 4.25 Column wicking plots for -150+200 mesh zircon particles with
5.10-5 M dodecyl amine at different pH values
43
Page 66
0.8
0.7
0.6
0.5
5.10-5 M - pH210-4 M SDS- pH 2
10-5 MA0.4
0.3
0.2
0.1
00 50 100 150
seconds
Figure 4.26 Column wicking plots for -150+200 mesh zircon particles with
different concentrations of sodium dodecyl sulfate at pH 2.
Table 4.7 The advancing and receding contact angles of zircon from column
wicking (θA) and cake dewatering experiments (θR).
Liquid pH θA θR θA – θR 10-5 M DA 4 72.13 41.3 30.83 6 80.7 48.7 32 8 82.07 49.74 32.33 10 67.85 39.08 28.77 5.10-5 M DA 4 79.6 42.48 37.12 6 82.5 49.83 32.67 8 84.7 51.31 33.39 10 69.33 39.98 29.35 10-4 M SDS 2 81.06 53.22 27.84 5.10-5 M SDS 2 75.49 51.95 23.54 10-5 M SDS 2 71.52 49.64 21.88
44
Page 67
0
0.1
0.2
0.3
0.4
0.5
0.6
0 20 40 60 80 100
seconds
A
pH4pH6pH8pH10
Figure 4.27 Column wicking plots for -150+200 mesh rutile particles with 10-5 M
dodecyl amine at different pH values.
0
0.1
0.2
0.3
0.4
0.5
0.6
0 20 40 60 80 100
t
A
pH4pH6pH8pH10
Figure 4.28 Column wicking plots for -150+200 mesh rutile particles with
5x10⁻⁵ M dodecyl amine at different pH values.
45
Page 68
0
0.1
0.2
0.3
0.4
0.5
0.6
0 50 100 150
seconds
A
pH4pH6pH8pH10
Figure 4.29 Column wicking plots for -150+200 mesh rutile particles with 10-4 M
dodecyl amine at different pH values.
0.05
.10
0.15
.20
0.25
.30
0.35
.40
0.45
0.5
pH2 - 10-4 M SDS
pH2 - 5.10-5 M SDS
pH2 - 10-5 M SDS
A
00 50 100 150
seconds
Figure 4.30 Column wicking plots for -150+200 mesh rutile particles with
different concentrations of sodium dodecyl sulfate at pH 2.
46
Page 69
Table 4.8 The advancing and receding contact angles of rutile from column
wicking (θA) and cake dewatering experiments (θR).
Liquid pH θA θR θA – θR 10-5 M DA 4 65.37 35.31 30.06 6 78.42 37.22 41.2 8 73.57 35.66 37.91 10 63.25 33.19 30.06 5.10-5 M DA 4 72.11 35.43 36.68 6 80.19 38.41 41.78 8 77.19 35.99 41.2 10 63.02 32.71 30.31 10-4 M SDS 4 74.39 39.04 35.35 6 83.07 40.91 42.16 8 79.08 41.71 37.37 10 63.48 33.79 29.69 10-4 M SDS 2 77.97 54.96 23.01 5.10-5 M SDS 2 76.84 53.32 23.52 10-5 M SDS 2 75.52 40.19 35.33
When the receding and advancing contact angles given in Table 4.7 and Table 4.8
are compared, we may see that there are differences between advancing and
receding contact angles. There is an agreement between the results of column
wicking and cake dewatering experiments. At pH 8, in all concentrations of
dodecyl amine, both receding and advancing contact angles gave a higher degree.
In the experiments with sodium dodecyl sulfate, we can see that, at pH 2, the
degree of contact angle is getting higher with the increase of collector and also
47
Page 70
the receding contact angles are parallel to advancing contact angles from the
column wicking experiments.
4.3 Microflotation Experiments
Microflotation experiments were performed whether the contact angles obtained
from cake dewatering experiments are reliable and correlate well with the
flotation behavior of the zircon and rutile particles. Figure 4.31-4.34 present the
flotation recoveries obtained at various conditions which were also tested in
contact angle measurement experiments.
100
Flot
atio
n R
ecov
ery
, %
90
80
10-5 M10-5 M R
5.10-5M R5.10-5 M
10-4M10-4M R
10-3M10-3M R70
60
50
4030
20
10
00 2 4 6 8 10 12
pH
Figure 4.31 Flotation response of -150+200 mesh zircon with dodecyl amine at
different pH values. R denotes repeat experiments.
48
Page 71
10090 10-3 M SDS
Flot
atio
n re
cove
ry %
80
10-3 M SDS - R70
10-4 M SDS60
10-4 M SDS - R50
5.10-5 M SDS40
5.10-5 M SDS - R10
30 -5 M SDS2010-5 M SDS - R10
00 2 4 6 8 10
pH
Figure 4.32 Flotation response of -150+200 mesh zircon with sodium dodecyl
sulfate at different pH values. R denotes repeat experiments.
100
90
Flot
atio
n R
ecov
ery
, %
80 10-3M10-3M R10-4M10-4M R5.10-5 M5.10-5M R10-5 M10-5 M R
70605040302010
00 2 4 6 8 10 12
pH
Figure 4.33 Flotation response of -150+200 mesh rutile with dodecyl amine at
different pH values. R denotes repeat experiments.
49
Page 72
10090
Flot
atio
n re
cove
ry, %
10-5 M SDS5.10-5 M SDS - R
5.10-5 M SDS5.10-5 M SDS - R
10-4 M SDS10-4 M SDS - R
10-3 M SDS10-3 M SDS - R
80
70
60
50
40
30
20
10
00 2 4 6 8 10
pH
Figure 4.34 Flotation response of -150+200 mesh rutile with sodium dodecyl
sulfate at different pH values. R denotes repeat experiments.
It can be seen from the figures that the flotation recovery of minerals are
consistent with the contanct angles obtained from the proposed method of
measurement in the sense that maximum flotation recovery ranges are in very
good agreement with maximum contact angle ranges where we expect highest
degrees of hydrophobicity, and, hence, maximum floatability. The only difference
between the microflotation tests and capillaric dewatering tests is the amount of
collector which adsorbed by the solid, in microflotation 1 gr of solid was used
while in dewatering 50 gr of solid was used. This is the reason of high percent of
flotation.
50
Page 73
These results suggest that, instead of carrying out tedious microflotation tests
requiring special experimental set-ups, we may conduct simple and fast filtration
experiments to study the wetting characteristics of solid particulates treated with
various chemicals. Furthermore, the proposed method of measurement yields the
receding contact angles, which represent the true physical event taking place in
froth flotation in which air replaces water at already wetted surfaces.
51
Page 74
CHAPTER 5
CONCLUSIONS
In this research, the determination of the contact angle by capillaric dewatering of
filter cakes was studied on zircon and rutile powders and the findings are
compared with column wicking and microflotation experiments. As a result of
this study, the following conclusions can be drawn:
- Capillaric dewatering method can be used for determining the receding
contact angle of powders. Capillaric dewatering method is an easily applicable
technique to determine the contact angles of powders and also for determining the
contact angles for flotation applications.
- Comparing column wicking experiments and capillaric dewatering
experiments, it is observed that the maximum contact angle range for zircon by
using dodecyl amine is from pH 6 to pH 8, and by using sodium dodecyl sulfate it
is below pH 3,and comparing the column wicking experiments and capillaric
dewatering experiments, it is observed that the maximum contact angle range for
rutile by using dodecyl amine is from pH 6 to pH 8, and by using sodium dodecyl
sulfate is below 3.
- The difference between advancing and receding contact angles can be
higher than 40°.
52
Page 75
- Zircon gives a higher contact angle than rutile for the systems studied.
- Highly acidic and highly alkaline conditions are not suitable for flotation
of zircon and rutile by using dodecyl amine, as verified by the very low value of
the contact angle at these conditions.
53
Page 76
REFERENCES
1. Adamson A.W., Physical Chemistry of Surfaces, 2nd Ed., Interscience
Publishers, California, 1967
2. Besra L., Sengupta D.K., Roy S.K., Particle characteristics and their influence
on dewatering of kaolin, calcite and quartz suspensions, International Journal of
Mineral Processing, Volume 59, Issue 2, May 2000, Pages 89-112
3. Biliński B., Holysz L., Some Theoretical and Experimental Limitations in the
Determination of Surface Free Energy of Siliceous Solids, Powder Technology,
Volume 102, 1999, Pages 120-126
4. Chibowski E., Carpio R.P., A Novel Method for Surface Free-Energy
Determination of Powdered Solids, Journal of Colloid and Interface Science,
Volume 240, 2001, Pages 473-479
5. Chibowski E., Carpio R.P., Problems of contact angle and solid surface free
energy determination, Advances in Colloid and Interface Science, Volume 98,
2002, Pages 245-264
6. Condie D.J., Hinkel M., Veal C.J., Modelling the vacuum filtration of fine coal,
Filtration & Separation, Volume 33, Issue 9, October 1996, Pages 825-834
7. Diggins D., Fokkink L.G.J., Ralston J., The wetting of angular quartz
particles: Capillary pressure and contact angles, Colloids and Surfaces, Volume
44, 1990, Pages 299-313
54
Page 77
8. Douillard J.M., Zajac J., Malandrini H., et al., Contact angle and film pressure:
Study of a talc surface, Journal of Colloid and Interface Science, Volume 255,
November 2002, Pages 341-351
9. Dunstan D., White L.R., A Capillary Pressure Method for Measurement of
Contact Angles in Powders and Porous Media, Journal of Colloid and Interface
Science, Volume 111, May 1986, Pages 60-64
10. Finch J.A., Smith G.W., Contact Angle and Wetting, Minerals Sci.Engng,
Volume 11, January 1979, Pages 36-63
11. Fowkes F.M, ed., 1964 Dispersion force contributions to surface and
interfacial tensions, Contact angles and heats of immersion, Advances in
Chemistry series, Volume 43, Pages 99ff
12. Good R.J., Mittal K.L., Contact Angle, Wettability and Adhesion,
Netherlands, 1993
13. Harkins W.D., Feldman, A., 1922, Spreading of liquids and the spreading
coefficient, Journal of the American Chemical Society, Volume 44, No 12, Pages
2665ff.
14. Heertjes P.M., Kossen N.W.F., Measuring the contact angles of powder-
liquid systems, Powder Technology, Volume 1, Issue 1, February 1967, Pages 33-
42
55
Page 78
15. Hoşten, Ç., Micro-floatability of rutile and zircon with soap and amine type
collectors, Physicochemical Problems of Mineral Processing, Volume 35, 2001,
Pages 161-170
16. Hoşten Ç., Sastry K.V.S., Empirical correlations for the prediction of cake
dewatering characteristics, Minerals Engineering, Volume 2, Issue 1, 1989,
Pages 111-119
17. Iveson S.M., Holt S., Biggs S., Contact angle measurements of iron ore
powders, Colloids and Surfaces, Volume 166, 2000, Pages 203-214
18. Krajewski S.R., Kujawski W., Dijioux F., et al., Grafting of ZrO2 powder and
ZrO2 membrane by fluoroalkylsilane, Colloids and Surfaces A: Physicochemical
and Engineering Aspects, Volume 243, Issues 1-3, August 2004, Pages 43-47
19. Muratoğlu R.A., Floatability and adsorption characteristics of zircon with
sodium oleate, Ankara, Metu, 2000
20. Osipow L.I., Surface Chemistry, Theory and Industrial Applications,
Reinfold Pub. Corp., New York, 1962
21. Puttock S. J., Fane A.G., Fell C. J. D., et al., Vacuum filtration and
dewatering of alumina trihydrate — The role of cake porosity and interfacial
phenomena, International Journal of Mineral Processing, Volume 17, Issues 3-4,
July 1986, Pages 205-224
56
Page 79
22. Rondeau X., Affolter C., Kommunjer L., et al., Experimental determination of
capillary forces by crushing strength measurements, Powder Technology,
Volume 130, February 2003, Pages 124-131
23. Siebold A., Nardin M., Schultz J., et al., Effect of Dynamic Contact Angle on
Capillary Rise Phenomena, Colloids and Surfaces, Volume 161, 2000, Pages 81-
87
24. Şan O., Hoşten Ç., Filtration testing of a ceramic capillary filter produced
from a high-silica glaze, Minerals Engineering, Volume 15, Issue 7, July 2002,
Pages 553-556
25. Teixeira P., Azeredo J., Oliveira R., et al., Interfacial Interactions between
Nitrifying Bacteria and Mineral Carriers in Aqueous Media Determined by
Contact Angle Measurements and Thin Layer Wicking, Colloids and Surfaces B:
Biointerfaces, Volume 12, 1998, Pages 69-75
26. Wakeman R.J., Vacuum dewatering and residual saturation of incompressible
filter cakes, International Journal of Mineral Processing, Volume 3, Issue 3,
September 1976, Pages 193-206
57
Page 80
APPENDIX A
TABLES OF CAPILLARIC DEWATERING EXPERIMENTS
Table A 1. -100+200 mesh quartz experimented with methanol
TEST NO TEST TEST SIZE DRY SOLIDS CAKE POROSITYSOLIDS LIQUID (MESH) (GRAM)
1 Quartz 100% .-100+200 30 0,53Methanol
Vacuum 0,2 0,2 0,6 1 1,5 2 2,5 3(inch-Hg)Dewat. 0 2 2 2 2 2 2 2Time(min)Liquid 10,23 10,18 10,09 10,01 9,93 8,71 5,84 4,76(Gram)Res Mois 25,42 25,33 25,16 25,01 24,86 22,50 16,3 13,69
%Saturation 1 0,995 0,986 0,978 0,970 0,85 0,570 0,465
Table A.2. -100+200 mesh quartz experimented with water
TEST NO TEST TEST SIZE DRY SOLIDS CAKE POROSITYSOLIDS LIQUID (MESH) (GRAM)
2 Quartz Water .-100+200 30,02 0,47
Vacuum 1 1 1,5 2 2,5 3 3,5 4(inch-Hg)Dewat. 0 3 3 3 3 3 3 3Time(min)Cake 39,91 39,88 39,86 39,7 39,68 38,7 36,2 34(Gram)Res Mois 24,78 24,72 24,68 24,38 24,34 22,36 17 11,7
%Saturation 1 0,997 0,994 0,978 0,976 0,87 0,619 0,402
58
Page 81
Table A.3. -100+200 mesh quartz experimented with 80% methanol
TEST NO TEST TEST SIZE DRY SOLIDS CAKE POROSITYSOLIDS LIQUID (MESH) (GRAM)
3 Quartz 80% .-100+200 30 0,47Methanol
Vacuum 0,5 0,5 1 1,5 2 2,5 3 3,5(inch-Hg)Dewat. 0 2 2 2 2 2 2 2Time(min)Liquid 8,51 8,47 8,42 7,71 5,08 4,41 3,91 3,47(Gram)Res Mois 22,09 22,01 21,91 20,44 14,48 12,8 11,5 10,36
%Saturation 1 0,995 0,989 0,905 0,596 0,52 0,46 0,407
Table A.4. -100+200 mesh quartz experimented with 65% methanol
TEST NO TEST TEST SIZE DRY SOLIDS CAKE POROSITYSOLIDS LIQUID (MESH) (GRAM)
4 Quartz 65% .-100+200 30 0,45Methanol
Vacuum 0,5 0,5 1 1,5 2 2,5 3 3,5(inch-Hg)Dewat. 0 2 2 2 2 2 2 2Time(min)Liquid 8,06 7,77 7,66 7,02 5,31 4,47 4,02 3,58(Gram)Res Mois 21,17 20,57 20,33 18,96 15,03 13 11,8 10,66
%Saturation 1 0,964 0,95 0,87 0,658 0,55 0,5 0,444
59
Page 82
Table A.5. -100+200 mesh quartz experimented with 50% methanol
TEST NO TEST TEST SIZE DRY SOLIDS CAKE POROSITYSOLIDS LIQUID (MESH) (GRAM)
5 Quartz 50% .-100+200 30 0,45Methanol
Vacuum 0,5 0,5 1 1,5 2 2,5 3 3,5(inch-Hg)Dewat. 0 2 2 2 2 2 2 2Time(min)Liquid 8,32 8,27 8,24 8,21 7,96 6,85 5,08 4,06(Gram)Res Mois 21,71 21,6 21,54 21,48 20,96 18,6 14,5 11,92
%Saturation 1 0,993 0,99 0,986 0,956 0,82 0,61 0,487
Table A.6. -100+200 mesh quartz experimented with 40% methanol
TEST NO TEST TEST SIZE DRY SOLIDS CAKE POROSITYSOLIDS LIQUID (MESH) (GRAM)
6 Quartz 40% .-100+200 30 0,48Methanol
Vacuum 0,5 0,5 1 1,5 2 2,5 3 3,5(inch-Hg)Dewat. 0 2 2 2 2 2 2 2Time(min)Liquid 9,85 9,82 9,78 9,76 9,06 7,41 5,94 5,37(Gram)Res Mois 24,71 24,66 24,58 24,54 23,19 19,8 16,5 15,18
%Saturation 1 0,996 0,992 0,99 0,919 0,75 0,6 0,545
60
Page 83
Table A.7. -100+200 mesh quartz experimented with 25% methanol
TEST NO TEST TEST SIZE DRY SOLIDS CAKE POROSITYSOLIDS LIQUID (MESH) (GRAM)
7 Quartz 25% .-100+200 30 0,48Methanol
Vacuum 0,5 0,5 1 1,5 2 2,5 3 3,5(inch-Hg)Dewat. 0 3 3 3 3 3 3 3Time(min)Liquid 9,94 9,92 9,84 9,8 9,77 8,8 6,96 5,97(Gram)Res Mois 24,88 24,84 24,69 24,62 24,56 22,7 18,8 16,59
%Saturation 1 0,997 0,989 0,985 0,982 0,89 0,7 0,6
Table A.8. -100+200 mesh quartz experimented with 10% methanol
TEST NO TEST TEST SIZE DRY SOLIDS CAKE POROSITYSOLIDS LIQUID (MESH) (GRAM)
8 Quartz 10% .-100+200 30 0,47Methanol
Vacuum 0,5 0,5 1 1,5 2 2,5 3 3,5(inch-Hg)Dewat. 0 3 3 3 3 3 3 3Time(min)Liquid 9,98 9,97 9,94 9,92 9,91 9,8 8,01 5,97(Gram)Res Mois 24,96 24,94 24,88 24,84 24,83 24,6 21,1 16,59
%Saturation 1 0,998 0,995 0,993 0,992 0,98 0,8 0,598
61
Page 84
Table A.9. -100+200 mesh quartz experimented with water
TEST NO TEST TEST SIZE DRY SOLIDSCAKESOLIDS LIQUID MESH GRAM POROSITY
9 Quartz Water .-100+200 20 0,463Vacuum 1 1 1,5 2 2,5 3 3,5 4(inch-Hg)Dewat. 0 5 5 5 5 5 5 5TimeWet Cake 26,8 26,51 26,5 26,48 26,47 25,3 22,9 22,52GramRes Mois 24,64 24,55 24,52 24,47 24,44 20,9 12,8 11,19
%Saturation 1 0,99 0,99 0,99 0,98 0,8 0,45 0,38
Table A.10. -200+400 mesh quartz experimented with water
TEST NO TEST TEST SIZE DRY SOLIDSCAKESOLIDS LIQUID MESH GRAM POROSITY
10 Quartz Water .-200+400 30 0,551Vacuum 1 1 1,5 2 2,5 3 3,5 4(inch-Hg)Dewat. 0 6 6 6 6 6 6 6TimeWet Cake 43,96 42,76 42,69 42,67 42,66 42,7 42,6 42,62GramRes Mois 31,75 29,84 29,72 29,69 29,67 29,7 29,6 29,61%Saturation 1 0,91 0,909 0,907 0,906 0,91 0,91 0,904
62
Page 85
Table A.11. -100+200 mesh quartz experimented with hexane
TEST NO TEST TEST SIZE DRY SOLIDSCAKESOLID LIQUID MESH GRAM POROSITY
11 Quartz Hexane .-100+200 30 0,487Vacuum 1 1 1,5 2 2,5 3(inch-Hg)Dewat. 0 5 5 5 5 5TimeWet Cake 37,13 34,65 33,75 32,69 30,95 30GramRes Mois 19,2 13,42 11,11 8,23 3,07 0,06%Saturation 1 0,651 0,526 0,377 0,133 0
Table A.12. -100+200 mesh quartz experimented with hexane
TEST NO TEST TEST SIZE DRY SOLIDSCAKESOLIDS LIQUID MESH GRAM POROSITY
12 Quartz Hexane .-100+200 30 0,479Vacuum 1 1 1,5 2 2,5 3(inch-Hg)Dewat. 0 5 5 5 5 5TimeWet Cake 36,91 34,44 33,64 32,57 30,23 30GramRes Mois 18,72 12,89 10,82 7,89 0,76 0,03%Saturation 1 0,643 0,527 0,372 0,033 0
63
Page 86
Table A.13. -200+400 mesh quartz experimented with hexane
TEST NO TEST TEST SIZE DRY SOLIDSCAKESOLIDS LIQUID MESH GRAM POROSITY
13 Quartz Hexane .-200+400 30 0,51Vacuum 0,2 0,2 0,4 0,6 0,8 1 1,2 1,4(inch-Hg)Dewat. 0 5 5 5 5 5TimeWet Cake 37,88 37,5 37,29 37,08 36,83 36,5 36,2 35,8GramRes Mois 20,8 20 19,55 19,09 18,54 17,9 17,1 16,2%Saturation 1 0,951 0,924 0,897 0,865 0,83 0,78 0,735
Table A.14. -100+200 mesh quartz experimented with water
TEST NO TEST TEST SIZE DRY SOLIDSCAKESOLIDS LIQUID MESH GRAM POROSITY
14 Quartz Water .-100+200 30 0,53Vacuum 0,1 0,2 0,4 0,6 0,8 1 1,2(inch-Hg)Dewat. 0 2 2 2 2 2 2 2TimeLiquid 8,61 8,4 8,11 7,83 7,53 7,22 5,87 4,53GramRes Mois 22,2 21,8 21,2 20,69 20 19,4 16,4 13,11%Saturation 1 0,975 0,941 0,909 0,874 0,84 0,68 0,526
64
Page 87
Table A.15. -150+200 mesh zircon experimented with water
TEST NO TEST TEST SIZE DRY SOLIDS CAKE POROSITYSOLIDS LIQUID (MESH) (GRAM)
15 Zircon Water .-150+200 50 0,462
Vacuum with 0,2 0,5 1 1,5 1,6 1,7 2(inch-Hg) gravityDewat. 0 2 2 2 2 2 2 2Time(min)Cake 59,12 59,09 59,07 59,04 59,03 59 59 55,3(Gram)Res Mois 15,43 15,38 15,35 15,31 15,30 15,30 15,28 9,58
%Saturation 1 0,997 0,995 0,991 0,990 0,990 0,989 0,581
Table A.16. -150+200 mesh zircon experimented with methanol
TEST NO TEST TEST SIZE DRY SOLIDS CAKE POROSITYSOLIDS LIQUID (MESH) (GRAM)
16 Zircon Methanol .-150+200 50 0,47
Vacuum with 0,2 0,4 0,6 0,7 0,8 1 1,2(inch-Hg) gravityDewat. 0 2 2 2 2 2 2 2Time(min)Cake 57,37 57,31 57,24 57,16 57,15 53,7 53 52,59(Gram)Res Mois 12,85 12,76 12,65 12,53 12,51 6,80 5,57 4,92
%Saturation 1,000 0,992 0,982 0,972 0,970 0,495 0,400 0,351
65
Page 88
Table A.17. -150+200 mesh zircon experimented with methanol
TEST NO TEST TEST SIZE DRY SOLIDS CAKE POROSITYSOLIDS LIQUID (MESH) (GRAM)
17 Zircon Methanol .-150+200 50 0,463
Vacuum with 0,2 0,4 0,6 0,7 0,8 1 1,2(inch-Hg) gravityDewat. 0 2 2 2 2 2 2 2Time(min)Cake 57,29 57,28 57,28 57,21 57,19 55 52,9 51,65(Gram)Res Mois 12,72 12,71 12,71 12,60 12,57 9,06 5,41 3,19
%Saturation 1,000 0,999 0,999 0,989 0,986 0,683 0,392 0,226
Table A.18. -150+200 mesh zircon experimented with 10% methanol
TEST NO TEST TEST SIZE DRY SOLIDS CAKE POROSITYSOLIDS LIQUID (MESH) (GRAM)
18 Zircon Methanol .-150+200 50 0,45510%
Vacuum with 0,5 1 1,2 1,4 1,6 1,8(inch-Hg) gravityDewat. 0 2 2 2 2 2 2Time(min)Cake 58,72 58,64 58,42 58,4 58,28 55,7 54,3(Gram)Res Mois 14,85 14,73 14,41 14,38 14,21 10,15 7,83
%Saturation 1,000 0,991 0,966 0,963 0,950 0,648 0,487
66
Page 89
Table A.19. -150+200 mesh zircon experimented with 10% methanol
TEST NO TEST TEST SIZE DRY SOLIDS CAKE POROSITYSOLIDS LIQUID (MESH) (GRAM)
19 Zircon Methanol .-150+200 50 0,46110%
Vacuum with 0,5 1 1,2 1,4 1,6 1,8(inch-Hg) gravityDewat. 0 2 2 2 2 2 2Time(min)Cake 58,93 58,92 58,91 58,91 58,91 56,7 54,2(Gram)Res Mois 15,15 15,14 15,12 15,12 15,12 11,74 7,80
%Saturation 1,000 0,999 0,998 0,998 0,998 0,745 0,474
Table A.20. -150+200 mesh zircon experimented with 25% methanol
TEST NO TEST TEST SIZE DRY SOLIDS CAKE POROSITYSOLIDS LIQUID (MESH) (GRAM)
20 Zircon Methanol .-150+200 50 0,46125%
Vacuum with 0,5 1 1,1 1,2 1,4 1,6(inch-Hg) gravityDewat. 0 2 2 2 2 2 2Time(min)Cake 58,71 58,66 58,63 58,62 56,89 54,8 53,7(Gram)Res Mois 14,84 14,76 14,72 14,70 12,11 8,78 6,82
%Saturation 1,000 0,994 0,991 0,990 0,791 0,552 0,420
67
Page 90
Table A.21. -150+200 mesh zircon experimented with 25% methanol
TEST NO TEST TEST SIZE DRY SOLIDS CAKE POROSITYSOLIDS LIQUID (MESH) (GRAM)
21 Zircon Methanol .-150+200 50 0,45925%
Vacuum with 0,5 1 1,1 1,2 1,4 1,6(inch-Hg) gravityDewat. 0 2 2 2 2 2 2Time(min)Cake 58,65 58,65 58,64 58,62 56,53 55,8 53,3(Gram)Res Mois 14,75 14,75 14,73 14,70 11,55 10,46 6,12
%Saturation 1,000 1,000 0,999 0,997 0,755 0,675 0,377
Table A.22. -150+200 mesh zircon experimented with 40% methanol
TEST NO TEST TEST SIZE DRY SOLIDS CAKE POROSITYSOLIDS LIQUID (MESH) (GRAM)
22 Zircon Methanol .-150+200 50 0,44640%
Vacuum with 0,4 0,6 0,8 1 1,2 1,4(inch-Hg) gravityDewat. 0 2 2 2 2 2 2Time(min)Cake 57,95 57,77 57,69 57,55 57,41 55,1 54(Gram)Res Mois 13,72 13,45 13,33 13,12 12,91 9,27 7,32
%Saturation 1,000 0,977 0,967 0,950 0,932 0,643 0,497
68
Page 91
Table A.23. -150+200 mesh zircon experimented with 40% methanol
TEST NO TEST TEST SIZE DRY SOLIDS CAKE POROSITYSOLIDS LIQUID (MESH) (GRAM)
23 Zircon Methanol .-150+200 50 0,44340%
Vacuum with 0,4 0,6 0,8 1 1,2 1,4(inch-Hg) gravityDewat. 0 2 2 2 2 2 2Time(min)Cake 57,86 57,85 57,83 57,83 57,82 55,2 52,1(Gram)Res Mois 13,58 13,57 13,54 13,54 13,52 9,47 4,05
%Saturation 1,000 0,999 0,996 0,996 0,995 0,665 0,268
Table A.24. -150+200 mesh zircon experimented with 50% methanol
TEST NO TEST TEST SIZE DRY SOLIDS CAKE POROSITYSOLIDS LIQUID (MESH) (GRAM)
24 Zircon Methanol .-150+200 50 0,43950%
Vacuum with 0,5 1 1,2 1,4(inch-Hg) gravityDewat. 0 2 2 2 2Time(min)Cake 57,61 57,47 57,4 54,9 54,22(Gram)Res Mois 13,21 13,00 12,89 8,93 7,78
%Saturation 1,000 0,982 0,972 0,644 0,555
69
Page 92
Table A.25. -150+200 mesh zircon experimented with 50% methanol
TEST NO TEST TEST SIZE DRY SOLIDS CAKE POROSITYSOLIDS LIQUID (MESH) (GRAM)
25 Zircon Methanol .-150+200 50 0,44250%
Vacuum with 0,5 1 1,2 1,4(inch-Hg) gravityDewat. 0 2 2 2 2Time(min)Cake 57,68 57,66 57,65 55,23 53,65(Gram)Res Mois 13,31 13,28 13,27 9,47 6,80
%Saturation 1,000 0,997 0,996 0,681 0,475
Table A.26. -150+200 mesh zircon experimented with 65% methanol
TEST NO TEST TEST SIZE DRY SOLIDS CAKE POROSITYSOLIDS LIQUID (MESH) (GRAM)
26 Zircon Methanol .-150+200 50 0,46665%
Vacuum with 0,2 0,4 0,6 0,7 0,8 1(inch-Hg) gravityDewat. 0 2 2 2 2 2 2Time(min)Cake 57,5 57,42 57,31 57,23 57,21 55,5 54,1(Gram)Res Mois 13,04 12,92 12,76 12,63 12,60 9,86 7,49
%Saturation 1,000 0,989 0,975 0,964 0,961 0,729 0,540
70
Page 93
Table A.27. -150+200 mesh zircon experimented with 65% methanol
TEST NO TEST TEST SIZE DRY SOLIDS CAKE POROSITYSOLIDS LIQUID (MESH) (GRAM)
27 Zircon Methanol .-150+200 50 0,44165%
Vacuum with 0,4 0,8 1 1,2(inch-Hg) gravityDewat. 0 2 2 2 2Time(min)Cake 57,41 57,35 57,3 56,89 54,8(Gram)Res Mois 12,91 12,82 12,74 12,11 8,76
%Saturation 1,000 0,992 0,985 0,930 0,648
Table A.28. -150+200 mesh zircon experimented with 80% methanol
TEST NO TEST TEST SIZE DRY SOLIDS CAKE POROSITYSOLIDS LIQUID (MESH) (GRAM)
28 Zircon Methanol .-150+200 50 0,45280%
Vacuum with 0,2 0,4 0,6 0,8 1(inch-Hg) gravityDewat. 0 2 2 2 2 2Time(min)Cake 57,44 57,35 57,27 57,21 57,15 54,6(Gram)Res Mois 12,95 12,82 12,69 12,60 12,51 8,41
%Saturation 1,000 0,988 0,977 0,969 0,961 0,617
71
Page 94
Table A.29. -150+200 mesh zircon experimented with 80% methanol
TEST NO TEST TEST SIZE DRY SOLIDS CAKE POROSITYSOLIDS LIQUID (MESH) (GRAM)
29 Zircon Methanol .-150+200 50 0,46080%
Vacuum with 0,2 0,4 0,6 0,8 1(inch-Hg) gravityDewat. 0 2 2 2 2 2Time(min)Cake 57,3 57,22 57,11 57,03 57,02 55,3(Gram)Res Mois 12,74 12,62 12,45 12,33 12,31 9,52
%Saturation 1,000 0,989 0,974 0,963 0,962 0,721
Table A.30. -150+200 mesh zircon experimented with 5.10-5 M DA at pH 4
TEST NO TEST TEST SIZE DRY SOLIDS CAKE POROSITYSOLIDS LIQUID (MESH) (GRAM)
30 Zircon 10-5 M D .-150+200 50 0,485pH 4
Vacuum with 0,2 0,5 1 1,5 2 2,2(inch-Hg) gravityDewat. 0 2 2 2 2 2 2Time(min)Cake 60,01 60,01 59,99 59,99 59,98 56,4 55,7(Gram)Res Mois 33,34 33,34 33,32 33,32 33,31 29,03 28,12
%Saturation 1,000 1,000 0,998 0,998 0,997 0,635 0,564
72
Page 95
Table A.31. -150+200 mesh zircon experimented with 5.10-5 M DA at pH 4
TEST NO TEST TEST SIZE DRY SOLIDS CAKE POROSITYSOLIDS LIQUID (MESH) (GRAM)
31 Zircon 10-5 M D .-150+200 50 0,483pH 4
Vacuum with 0,2 0,5 1 1,5 2 2,2(inch-Hg) gravityDewat. 0 2 2 2 2 2 2Time(min)Cake 59,95 59,85 59,84 59,83 59,83 57,6 56,3(Gram)Res Mois 33,28 33,17 33,16 33,14 33,14 30,51 28,98
%Saturation 1,000 0,990 0,989 0,988 0,988 0,760 0,635
Table A.32. -150+200 mesh zircon experimented with 5.10-5 M DA at pH 6
TEST NO TEST TEST SIZE DRY SOLIDS CAKE POROSITYSOLIDS LIQUID (MESH) (GRAM)
32 Zircon 10-5 M D .-150+200 50 0,451pH 6
Vacuum with 0,2 0,5 1 1,5 2 2,2(inch-Hg) gravityDewat. 0 2 2 2 2 2 2Time(min)Cake 58,75 58,75 58,72 58,71 58,7 57,7 57(Gram)Res Mois 31,91 31,91 31,88 31,87 31,86 30,66 29,76
%Saturation 1,000 1,000 0,997 0,995 0,994 0,879 0,794
73
Page 96
Table A.33. -150+200 mesh zircon experimented with 5.10-5 M DA at pH 6
TEST NO TEST TEST SIZE DRY SOLIDS CAKE POROSITYSOLIDS LIQUID (MESH) (GRAM)
33 Zircon 10-5 M D .-150+200 50 0,455pH 6
Vacuum with 0,2 0,5 1 1,5 2 2,2(inch-Hg) gravityDewat. 0 2 2 2 2 2 2Time(min)Cake 58,87 58,87 58,87 58,85 58,84 57,2 56,6(Gram)Res Mois 32,05 32,05 32,05 32,03 32,02 30,06 29,27
%Saturation 1,000 1,000 1,000 0,998 0,997 0,811 0,738
Table A.34. -150+200 mesh zircon experimented with 5.10-5 M DA at pH 8
TEST NO TEST TEST SIZE DRY SOLIDS CAKE POROSITYSOLIDS LIQUID (MESH) (GRAM)
34 Zircon 10-5 M D .-150+200 50 0,443pH 8
Vacuum with 0,2 0,5 1 1,5 2 2,2(inch-Hg) gravityDewat. 0 2 2 2 2 2 2Time(min)Cake 58,47 58,46 58,45 58,43 58,41 57,1 55,7(Gram)Res Mois 31,59 31,58 31,57 31,54 31,52 29,96 28,12
%Saturation 1,000 0,999 0,998 0,995 0,993 0,839 0,667
74
Page 97
Table A.35. -150+200 mesh zircon experimented with 5.10-5 M DA at pH 10
TEST NO TEST TEST SIZE DRY SOLIDS CAKE POROSITYSOLIDS LIQUID (MESH) (GRAM)
35 Zircon 10-5 M D .-150+200 50 0,448pH 10
Vacuum with 0,2 0,5 1 1,5 1,8 2 2,2(inch-Hg) gravityDewat. 0 2 2 2 2 2 2 2Time(min)Cake 58,65 58,64 58,65 58,64 58,62 58,6 56,7 55,72(Gram)Res Mois 31,80 31,79 31,80 31,79 31,76 31,75 29,49 28,21
%Saturation 1,000 0,999 1,000 0,999 0,997 0,995 0,778 0,661
Table A.36. -150+200 mesh zircon experimented with 5.10-5 M DA at pH 10
TEST NO TEST TEST SIZE DRY SOLIDS CAKE POROSITYSOLIDS LIQUID (MESH) (GRAM)
36 Zircon 10-5 M D .-150+200 50 0,452pH 10
Vacuum with 0,2 0,5 1 1,5 1,8 2 2,2(inch-Hg) gravityDewat. 0 2 2 2 2 2 2 2Time(min)Cake 58,78 58,77 58,77 58,77 58,77 58,8 57,2 56,83(Gram)Res Mois 31,95 31,94 31,94 31,94 31,94 31,93 30,01 29,61
%Saturation 1,000 0,999 0,999 0,999 0,999 0,998 0,814 0,778
75
Page 98
Table A.37. -150+200 mesh zircon experimented with 10-5 M DA at pH 4
TEST NO TEST TEST SIZE DRY SOLIDS CAKE POROSITYSOLIDS LIQUID (MESH) (GRAM)
37 Zircon 10-5 M DA.-150+200 40 0,489pH 4
Vacuum with 0,2 0,5 1 1,5 2 2,2(inch-Hg) gravityDewat. 0 2 2 2 2 2 2Time(min)Cake 48,14 48,12 48,09 48,09 48,06 45,4 43,2(Gram)Res Mois 16,91 16,87 16,82 16,82 16,77 11,84 7,39
%Saturation 1,000 0,998 0,994 0,994 0,990 0,660 0,392
Table A.38. -150+200 mesh zircon experimented with 10-5 M DA at pH 4
TEST NO TEST TEST SIZE DRY SOLIDS CAKE POROSITYSOLIDS LIQUID (MESH) (GRAM)
38 Zircon 10-5 M DA.-150+200 50 0,476pH 4
Vacuum with 0,2 0,5 1 1,5 2 2,2(inch-Hg) gravityDewat. 0 2 2 2 2 2 2Time(min)Cake 59,65 59,64 59,64 59,63 59,62 57,7 56,9(Gram)Res Mois 32,94 32,93 32,93 32,92 32,91 30,70 29,64
%Saturation 1,000 0,999 0,999 0,998 0,997 0,800 0,710
76
Page 99
Table A.39. -150+200 mesh zircon experimented with 10-5 M DA at pH 6
TEST NO TEST TEST SIZE DRY SOLIDS CAKE POROSITYSOLIDS LIQUID (MESH) (GRAM)
39 Zircon 10-5 M DA.-150+200 50 0,460pH 6
Vacuum with 0,2 0,5 1 1,5 2 2,2(inch-Hg) gravityDewat. 0 2 2 2 2 2 2Time(min)Cake 59,07 59,07 59,06 59,06 57,12 56,1 55,1(Gram)Res Mois 15,35 15,35 15,34 15,34 12,46 10,89 9,29
%Saturation 1,000 1,000 0,999 0,999 0,785 0,674 0,564
Table A.40. -150+200 mesh zircon experimented with 10-5 M DA at pH 6
TEST NO TEST TEST SIZE DRY SOLIDS CAKE POROSITYSOLIDS LIQUID (MESH) (GRAM)
40 Zircon 10-5 M DA.-150+200 50 0,462pH 6
Vacuum with 0,2 0,5 1 1,5(inch-Hg) gravityDewat. 0 2 2 2 2Time(min)Cake 59,15 59,15 59,14 59,13 57,52(Gram)Res Mois 15,47 15,47 15,45 15,44 13,07
%Saturation 1,000 1,000 0,999 0,998 0,822
77
Page 100
Table A.41. -150+200 mesh zircon experimented with 10-5 M DA at pH 8
TEST NO TEST TEST SIZE DRY SOLIDS CAKE POROSITYSOLIDS LIQUID (MESH) (GRAM)
41 Zircon 10-5 M DA.-150+200 50 0,452pH 8
Vacuum with 0,2 0,5 1 1,5 2 2,2(inch-Hg) gravityDewat. 0 2 2 2 2 2 2Time(min)Cake 58,76 58,76 58,75 58,73 58,72 56,2 54,3(Gram)Res Mois 14,91 14,91 14,89 14,86 14,85 10,95 7,89
%Saturation 1,000 1,000 0,999 0,997 0,995 0,702 0,489
Table A.42. -150+200 mesh zircon experimented with 10-5 M DA at pH 8
TEST NO TEST TEST SIZE DRY SOLIDS CAKE POROSITYSOLIDS LIQUID (MESH) (GRAM)
42 Zircon 10-5 M DA.-150+200 50 0,451pH 8
Vacuum with 0,2 0,5 1 1,5 2(inch-Hg) gravityDewat. 0 2 2 2 2 2Time(min)Cake 58,73 58,72 58,72 58,72 58,71 56,5(Gram)Res Mois 14,86 14,85 14,85 14,85 14,84 11,49
%Saturation 1,000 0,999 0,999 0,999 0,998 0,743
78
Page 101
Table A.43. -150+200 mesh zircon experimented with 10-5 M DA at pH 10
TEST NO TEST TEST SIZE DRY SOLIDS CAKE POROSITYSOLIDS LIQUID (MESH) (GRAM)
43 Zircon 10-5 M DA.-150+200 50 0,448pH 10
Vacuum with 0,2 0,5 1 1,5 1,8 2(inch-Hg) gravityDewat. 0 2 2 2 2 2 2Time(min)Cake 58,65 58,64 58,65 58,64 58,62 58,6 56,7(Gram)Res Mois 14,75 14,73 14,75 14,73 14,70 14,69 11,86
%Saturation 1,000 0,999 1,000 0,999 0,997 0,995 0,778
Table A.44. -150+200 mesh zircon experimented with 10-5 M DA at pH 10
TEST NO TEST TEST SIZE DRY SOLIDS CAKE POROSITYSOLIDS LIQUID (MESH) (GRAM)
44 Zircon 10-5 M DA.-150+200 50 0,445pH 10
Vacuum with 0,2 0,5 1 1,5 1,8 2(inch-Hg) gravityDewat. 0 2 2 2 2 2 2Time(min)Cake 58,54 58,53 58,53 58,53 58,52 58,5 57(Gram)Res Mois 14,59 14,57 14,57 14,57 14,56 14,54 12,20
%Saturation 1,000 0,999 0,999 0,999 0,998 0,996 0,814
79
Page 102
Table A.45. -150+200 mesh zircon experimented with 10-4 M SDS at pH 2
TEST NO TEST TEST SIZE DRY SOLIDS CAKE POROSITYSOLIDS LIQUID (MESH) (GRAM)
45 Zircon 0-4 M SD .-150+200 50 0,433pH 2
Vacuum with 0,2 0,5 1 1,5 1,8 2 2,5(inch-Hg) gravityDewat. 0 2 2 2 2 2 2 2Time(min)Cake 58,11 58,11 58,07 58,05 58,05 56,5 55,9 53,43(Gram)Res Mois 13,96 13,96 13,90 13,87 13,87 11,54 10,52 6,42
%Saturation 1,000 1,000 0,995 0,993 0,993 0,804 0,725 0,423
Table A.46. -150+200 mesh zircon experimented with 10-4 M SDS at pH 4
TEST NO TEST TEST SIZE DRY SOLIDS CAKE POROSITYSOLIDS LIQUID (MESH) (GRAM)
46 Zircon 0-4 M SD .-150+200 50 0,454pH 4
Vacuum with 0,2 0,5 1 1,5 1,8 2 2,5(inch-Hg) gravityDewat. 0 2 2 2 2 2 2 2Time(min)Cake 58,85 58,85 58,81 58,8 58,78 58,8 53,9 53,43(Gram)Res Mois 15,04 15,04 14,98 14,97 14,94 14,94 7,20 6,42
%Saturation 1,000 1,000 0,995 0,994 0,992 0,992 0,438 0,388
80
Page 103
Table A.47. -150+200 mesh zircon experimented with 10-4 M SDS at pH 6
TEST NO TEST TEST SIZE DRY SOLIDS CAKE POROSITYSOLIDS LIQUID (MESH) (GRAM)
47 Zircon 0-4 M SD .-150+200 50 0,446pH 6
Vacuum with 0,2 0,5 1 1,5 1,8 2 2,5(inch-Hg) gravityDewat. 0 2 2 2 2 2 2 2Time(min)Cake 58,58 58,57 58,57 58,47 58,42 58,4 55,8 53,43(Gram)Res Mois 14,65 14,63 14,63 14,49 14,41 14,37 10,36 6,42
%Saturation 1,000 0,999 0,999 0,987 0,981 0,978 0,674 0,400
Table A.48. -150+200 mesh zircon experimented with 10-4 M SDS at pH 8
TEST NO TEST TEST SIZE DRY SOLIDS CAKE POROSITYSOLIDS LIQUID (MESH) (GRAM)
48 Zircon 0-4 M SD .-150+200 50 0,444pH 8
Vacuum with 0,2 0,5 1 1,5 1,8 2 2,5(inch-Hg) gravityDewat. 0 2 2 2 2 2 2 2Time(min)Cake 58,51 58,51 58,49 58,48 58,45 58,4 56,7 55,5(Gram)Res Mois 14,54 14,54 14,52 14,50 14,46 14,43 11,85 9,91
%Saturation 1,000 1,000 0,998 0,996 0,993 0,991 0,790 0,646
81
Page 104
Table A.49. -150+200 mesh zircon experimented with 5.10-5 M SDS at pH 2
TEST NO TEST TEST SIZE DRY SOLIDS CAKE POROSITYSOLIDS LIQUID (MESH) (GRAM)
49 Zircon 10-5 M SD.-150+200 50 0,440pH 2
Vacuum with 0,2 0,5 1 1,5 1,8 2 2,5(inch-Hg) gravityDewat. 0 2 2 2 2 2 2 2Time(min)Cake 58,35 58,34 58,34 58,33 58,31 56,9 56 53,43(Gram)Res Mois 14,31 14,30 14,30 14,28 14,25 12,05 10,68 6,42
%Saturation 1,000 0,999 0,999 0,998 0,995 0,820 0,716 0,411
Table A.50. -150+200 mesh zircon experimented with 5.10-5 M SDS at pH 4
TEST NO TEST TEST SIZE DRY SOLIDS CAKE POROSITYSOLIDS LIQUID (MESH) (GRAM)
50 Zircon 10-5 M SD.-150+200 50 0,448pH 4
Vacuum with 0,2 0,5 1 1,5 1,8 2 2,5(inch-Hg) gravityDewat. 0 2 2 2 2 2 2 2Time(min)Cake 58,65 58,63 58,63 58,62 58,61 58,6 56,8 55,14(Gram)Res Mois 14,75 14,72 14,72 14,70 14,69 14,66 11,99 9,32
%Saturation 1,000 0,998 0,998 0,997 0,995 0,993 0,787 0,594
82
Page 105
Table A.51. -150+200 mesh zircon experimented with 5.10-5 M SDS at pH 6
TEST NO TEST TEST SIZE DRY SOLIDS CAKE POROSITYSOLIDS LIQUID (MESH) (GRAM)
51 Zircon 10-5 M SD.-150+200 50 0,462pH 6
Vacuum with 0,2 0,5 1 1,5 1,8 2 2,5(inch-Hg) gravityDewat. 0 2 2 2 2 2 2 2Time(min)Cake 59,15 59,13 59,12 59,12 59,11 59,1 58,2 56,11(Gram)Res Mois 15,47 15,44 15,43 15,43 15,41 15,41 14,02 10,89
%Saturation 1,000 0,998 0,997 0,997 0,996 0,996 0,891 0,668
Table A.52. -150+200 mesh zircon experimented with 5.10-5 M SDS at pH 8
TEST NO TEST TEST SIZE DRY SOLIDS CAKE POROSITYSOLIDS LIQUID (MESH) (GRAM)
52 Zircon 10-5 M SD.-150+200 50 0,457pH 8
Vacuum with 0,2 0,5 1 1,5 1,8 2(inch-Hg) gravityDewat. 0 2 2 2 2 2 2Time(min)Cake 58,95 58,92 58,92 58,92 58,91 58,9 57,1(Gram)Res Mois 15,18 15,14 15,14 15,14 15,12 15,12 12,48
%Saturation 1,000 0,997 0,997 0,997 0,996 0,996 0,797
83
Page 106
Table A.53. -150+200 mesh zircon experimented with 10-5 M SDS at pH 2
TEST NO TEST TEST SIZE DRY SOLIDS CAKE POROSITYSOLIDS LIQUID (MESH) (GRAM)
53 Zircon 0-5 M SD .-150+200 50 0,452pH 2
Vacuum with 0,2 0,5 1 1,5 2 2,5(inch-Hg) gravityDewat. 0 2 2 2 2 2 2Time(min)Cake 58,78 58,77 58,76 58,69 58,68 57 55,8(Gram)Res Mois 14,94 14,92 14,91 14,81 14,79 12,22 10,31
%Saturation 1,000 0,999 0,998 0,990 0,989 0,793 0,655
Table A.54. -150+200 mesh zircon experimented with 10-5 M SDS at pH 4
TEST NO TEST TEST SIZE DRY SOLIDS CAKE POROSITYSOLIDS LIQUID (MESH) (GRAM)
54 Zircon 0-5 M SD .-150+200 50 0,461pH 4
Vacuum with 0,2 0,5 1 1,5 1,8(inch-Hg) gravityDewat. 0 2 2 2 2 2Time(min)Cake 59,11 59,10 59,1 59,1 59,09 57,1(Gram)Res Mois 15,41 15,40 15,40 15,40 15,38 12,46
%Saturation 1,000 0,999 0,999 0,999 0,998 0,782
84
Page 107
Table A.55. -150+200 mesh zircon experimented with 10-5 M SDS at pH 6
TEST NO TEST TEST SIZE DRY SOLIDS CAKE POROSITYSOLIDS LIQUID (MESH) (GRAM)
55 Zircon 0-5 M SD .-150+200 50 0,459pH 6
Vacuum with 0,2 0,5 1 1,5 1,8 2(inch-Hg) gravityDewat. 0 2 2 2 2 2 2Time(min)Cake 59,02 59,01 59,01 59,01 59,01 59 57,2(Gram)Res Mois 15,28 15,27 15,27 15,27 15,27 15,24 12,62
%Saturation 1,000 0,999 0,999 0,999 0,999 0,997 0,800
Table A.56. -150+200 mesh zircon experimented with 10-5 M SDS at pH 8
TEST NO TEST TEST SIZE DRY SOLIDS CAKE POROSITYSOLIDS LIQUID (MESH) (GRAM)
56 Zircon 0-5 M SD .-150+200 50 0,462pH 8
Vacuum with 0,2 0,5 1 1,5 1,8 2 2,5(inch-Hg) gravityDewat. 0 2 2 2 2 2 2 2Time(min)Cake 59,15 59,13 59,12 59,12 59,11 59,1 58,2 56,11(Gram)Res Mois 15,47 15,44 15,43 15,43 15,41 15,41 14,02 10,89
%Saturation 1,000 0,998 0,997 0,997 0,996 0,996 0,891 0,668
85
Page 108
Table A.57. -150+200 mesh rutile experimented with water
TEST NO TEST TEST SIZE DRY SOLIDS CAKE POROSITYSOLIDS LIQUID (MESH) (GRAM)
57 Rutile Water .-150+200 50 0,441
Vacuum with 0,5 1 1,5 2 2,2 2,4 2,6(inch-Hg) gravityDewat. 0 2 2 2 2 2 2 2Time(min)Cake 59,39 59,36 59,35 59,27 59,12 58,8 55,1 54,2(Gram)Res Mois 15,81 15,77 15,75 15,64 15,43 14,89 9,32 7,75
%Saturation 1,000 0,997 0,996 0,987 0,971 0,932 0,547 0,447
Table A.58. -150+200 mesh rutile experimented with water
TEST NO TEST TEST SIZE DRY SOLIDS CAKE POROSITYSOLIDS LIQUID (MESH) (GRAM)
58 Rutile Water .-150+200 50 0,457
Vacuum with 0,2 0,4 0,6 0,7 0,8 1 1,2(inch-Hg) gravityDewat. 0 2 2 2 2 2 2 2Time(min)Cake 57,94 57,93 57,92 57,91 57,91 55,7 53,7 52,11(Gram)Res Mois 13,70 13,69 13,67 13,66 13,66 10,15 6,80 4,05
%Saturation 1,000 0,999 0,997 0,996 0,996 0,712 0,460 0,266
86
Page 109
Table A.59. -150+200 mesh rutile experimented with methanol
TEST NO TEST TEST SIZE DRY SOLIDS CAKE POROSITYSOLIDS LIQUID (MESH) (GRAM)
59 Rutile Methanol .-150+200 50 0,468
Vacuum with 0,2 0,4 0,6 0,7 0,75 0,8 1(inch-Hg) gravityDewat. 0 2 2 2 2 2 2 2Time(min)Cake 58,31 58,22 58,14 58,03 58,03 58 55,2 54,12(Gram)Res Mois 14,25 14,12 14,00 13,84 13,84 13,81 9,44 7,61
%Saturation 1,000 0,989 0,980 0,966 0,966 0,964 0,627 0,496
Table A.60. -150+200 mesh rutile experimented with methanol
TEST NO TEST TEST SIZE DRY SOLIDS CAKE POROSITYSOLIDS LIQUID (MESH) (GRAM)
60 Rutile Methanol .-150+200 50 0,458
Vacuum with 0,2 0,4 0,6 0,7 0,75 0,8 1(inch-Hg) gravityDewat. 0 2 2 2 2 2 2 2Time(min)Cake 57,99 57,98 57,92 57,92 57,91 57,9 56,9 55,12(Gram)Res Mois 13,78 13,76 13,67 13,67 13,66 13,66 12,05 9,29
%Saturation 1,000 0,999 0,991 0,991 0,990 0,990 0,857 0,641
87
Page 110
Table A.61. -150+200 mesh rutile experimented with 10% methanol
TEST NO TEST TEST SIZE DRY SOLIDS CAKE POROSITYSOLIDS LIQUID (MESH) (GRAM)
61 Rutile Methanol .-150+200 50 0,45410%
Vacuum with 0,5 1 1,5 1,8 2 2,2(inch-Hg) gravityDewat. 0 2 2 2 2 2 2Time(min)Cake 59,72 59,53 59,51 59,48 59,30 55,9 54,9(Gram)Res Mois 16,28 16,01 15,98 15,94 15,68 10,47 8,96
%Saturation 1,000 0,980 0,978 0,975 0,957 0,602 0,506
Table A.62. -150+200 mesh rutile experimented with 10% methanol
TEST NO TEST TEST SIZE DRY SOLIDS CAKE POROSITYSOLIDS LIQUID (MESH) (GRAM)
62 Rutile Methanol .-150+200 50 0,44310%
Vacuum with 0,5 1 1,5 1,8 2 2,2(inch-Hg) gravityDewat. 0 2 2 2 2 2 2Time(min)Cake 59,28 59,27 59,27 59,26 59,25 57,2 56,1(Gram)Res Mois 15,65 15,64 15,64 15,63 15,61 12,63 10,91
%Saturation 1,000 0,999 0,999 0,998 0,997 0,779 0,659
88
Page 111
Table A.63. -150+200 mesh rutile experimented with 25% methanol
TEST NO TEST TEST SIZE DRY SOLIDS CAKE POROSITYSOLIDS LIQUID (MESH) (GRAM)
63 Rutile Methanol .-150+200 50 0,46725%
Vacuum with 0,5 1 1,2 1,4 1,6 1,8(inch-Hg) gravityDewat. 0 2 2 2 2 2 2Time(min)Cake 59,99 59,96 59,93 59,91 59,89 57 56,9(Gram)Res Mois 16,65 16,61 16,57 16,54 16,51 12,34 12,17
%Saturation 1,000 0,997 0,994 0,992 0,990 0,705 0,694
Table A.64. -150+200 mesh rutile experimented with 25% methanol
TEST NO TEST TEST SIZE DRY SOLIDS CAKE POROSITYSOLIDS LIQUID (MESH) (GRAM)
64 Rutile Methanol .-150+200 50 0,45825%
Vacuum with 0,5 1 1,2 1,4 1,6 1,8(inch-Hg) gravityDewat. 0 2 2 2 2 2 2Time(min)Cake 59,64 59,64 59,63 59,62 59,61 58,1 57,4(Gram)Res Mois 16,16 16,16 16,15 16,14 16,12 13,97 12,82
%Saturation 1,000 1,000 0,999 0,998 0,997 0,842 0,762
89
Page 112
Table A.65. -150+200 mesh rutile experimented with 40% methanol
TEST NO TEST TEST SIZE DRY SOLIDS CAKE POROSITYSOLIDS LIQUID (MESH) (GRAM)
65 Rutile Methanol .-150+200 50 0,44440%
Vacuum with 0,5 1 1,2 1,4 1,6 1,8(inch-Hg) gravityDewat. 0 2 2 2 2 2 2Time(min)Cake 58,85 58,81 58,68 58,61 57,23 56,78 55,3(Gram)Res Mois 15,04 14,98 14,79 14,69 12,63 11,94 9,55
%Saturation 1,000 0,995 0,981 0,973 0,817 0,766 0,597
Table A.66. -150+200 mesh rutile experimented with 40% methanol
TEST NO TEST TEST SIZE DRY SOLIDS CAKE POROSITYSOLIDS LIQUID (MESH) (GRAM)
66 Rutile Methanol .-150+200 50 0,44940%
Vacuum with 0,5 1 1,2 1,4 1,6(inch-Hg) gravityDewat. 0 2 2 2 2 2Time(min)Cake 59,01 59,01 58,98 58,97 57,12 56,12(Gram)Res Mois 15,27 15,27 15,23 15,21 12,46 10,91
%Saturation 1,000 1,000 0,997 0,996 0,790 0,679
90
Page 113
Table A.67. -150+200 mesh rutile experimented with 50% methanol
TEST NO TEST TEST SIZE DRY SOLIDS CAKE POROSITYSOLIDS LIQUID (MESH) (GRAM)
67 Rutile Methanol .-150+200 50 0,45950%
Vacuum with 0,4 0,6 0,8 1 1,1 1,2 1,4(inch-Hg) gravityDewat. 0 2 2 2 2 2 2 2Time(min)Cake 59,24 59,19 59,13 59,08 59,03 59 57,19 56,24(Gram)Res Mois 15,60 15,53 15,44 15,37 15,30 15,27 12,57 11,10
%Saturation 1,000 0,995 0,988 0,983 0,977 0,975 0,778 0,675
Table A.68. -150+200 mesh rutile experimented with 50% methanol
TEST NO TEST TEST SIZE DRY SOLIDS CAKE POROSITYSOLIDS LIQUID (MESH) (GRAM)
68 Rutile Methanol .-150+200 50 0,46650%
Vacuum with 0,4 0,6 0,8 1 1,2 1,4(inch-Hg) gravityDewat. 0 2 2 2 2 2 2Time(min)Cake 59,49 59,42 59,38 59,3 59,25 58,33 56,7(Gram)Res Mois 15,95 15,85 15,80 15,68 15,61 14,28 11,80
%Saturation 1,000 0,993 0,988 0,980 0,975 0,878 0,705
91
Page 114
Table A.69. -150+200 mesh rutile experimented with 65% methanol
TEST NO TEST TEST SIZE DRY SOLIDS CAKE POROSITYSOLIDS LIQUID (MESH) (GRAM)
69 Rutile Methanol .-150+200 50 0,44565%
Vacuum with 0,2 0,4 0,6 0,8 1 1,2 1,4(inch-Hg) gravityDewat. 0 2 2 2 2 2 2 2Time(min)Cake 58,43 58,30 58,2 58,14 58,07 57,99 56,2 55,30(Gram)Res Mois 14,43 14,24 14,09 14,00 13,90 13,78 10,97 9,58
%Saturation 1,000 0,985 0,973 0,966 0,957 0,948 0,731 0,629
Table A.70. -150+200 mesh rutile experimented with 65% methanol
TEST NO TEST TEST SIZE DRY SOLIDS CAKE POROSITYSOLIDS LIQUID (MESH) (GRAM)
70 Rutile Methanol .-150+200 50 0,46365%
Vacuum with 0,2 0,4 0,6 0,8 1 1,2 1,4(inch-Hg) gravityDewat. 0 2 2 2 2 2 2 2Time(min)Cake 59,05 58,98 58,91 58,84 58,76 58,71 56,1 55,20(Gram)Res Mois 15,33 15,23 15,12 15,02 14,91 14,84 10,81 9,42
%Saturation 1,000 0,992 0,985 0,977 0,968 0,962 0,670 0,575
92
Page 115
Table A.71. -150+200 mesh rutile experimented with 80% methanol
TEST NO TEST TEST SIZE DRY SOLIDS CAKE POROSITYSOLIDS LIQUID (MESH) (GRAM)
71 Rutile Methanol .-150+200 50 0,45780%
Vacuum with 0,2 0,4 0,6 0,8 1 1,2(inch-Hg) gravityDewat. 0 2 2 2 2 2 2Time(min)Cake 58,50 58,42 58,41 58,14 58,07 55,29 54,5(Gram)Res Mois 14,53 14,41 14,40 14,00 13,90 9,57 8,29
%Saturation 1,000 0,991 0,989 0,958 0,949 0,622 0,532
Table A.72. -150+200 mesh rutile experimented with 80% methanol
TEST NO TEST TEST SIZE DRY SOLIDS CAKE POROSITYSOLIDS LIQUID (MESH) (GRAM)
72 Rutile Methanol .-150+200 50 0,47280%
Vacuum with 0,2 0,4 0,6 0,8 1(inch-Hg) gravityDewat. 0 2 2 2 2 2Time(min)Cake 59,03 59,02 59,01 58,99 58,97 56,13(Gram)Res Mois 15,30 15,28 15,27 15,24 15,21 10,92
%Saturation 1,000 0,999 0,998 0,996 0,993 0,679
93
Page 116
Table A.73. -150+200 mesh rutile experimented with 10-4 M DA at pH 4
TEST NO TEST TEST SIZE DRY SOLIDS CAKE POROSITYSOLIDS LIQUID (MESH) (GRAM)
73 Rutile 10-4 M DA.-150+200 50 0,445pH 4
Vacuum with 0,5 1 1,5 2 2,2 2,4 2,6(inch-Hg) gravityDewat. 0 2 2 2 2 2 2 2Time(min)Cake 59,54 58,46 58,45 58,44 58,42 57,14 56,2 55,76(Gram)Res Mois 24,42 23,02 23,01 23,00 22,97 21,25 19,87 19,30
%Saturation 1,000 0,887 0,886 0,885 0,883 0,748 0,646 0,604
Table A.74. -150+200 mesh rutile experimented with 10-4 M DA at pH 4
TEST NO TEST TEST SIZE DRY SOLIDS CAKE POROSITYSOLIDS LIQUID (MESH) (GRAM)
74 Rutile 10-4 M DA.-150+200 50 0,447pH 4
Vacuum with 0,5 1 1,5 2 2,2 2,4 2,6(inch-Hg) gravityDewat. 0 2 2 2 2 2 2 2Time(min)Cake 59,62 59,61 59,60 59,59 59,58 57,65 56,23 55,76(Gram)Res Mois 24,52 24,51 24,50 24,48 24,47 21,94 19,97 19,30
%Saturation 1,000 0,999 0,998 0,997 0,996 0,795 0,648 0,599
94
Page 117
Table A.75. -150+200 mesh rutile experimented with 10-4 M DA at pH 6
TEST NO TEST TEST SIZE DRY SOLIDS CAKE POROSITYSOLIDS LIQUID (MESH) (GRAM)
75 Rutile 10-4 M DA.-150+200 50 0,438pH 6
Vacuum with 0,5 1 1,5 2 2,1 2,2(inch-Hg) gravityDewat. 0 2 2 2 2 2 2Time(min)Cake 59,28 58,35 58,35 58,32 58,30 57,32 56,45(Gram)Res Mois 24,09 22,88 22,88 22,84 22,81 21,49 20,28
%Saturation 1,000 0,900 0,900 0,897 0,894 0,789 0,695
Table A.76. -150+200 mesh rutile experimented with 10-4 M DA at pH 6
TEST NO TEST TEST SIZE DRY SOLIDS CAKE POROSITYSOLIDS LIQUID (MESH) (GRAM)
76 Rutile 10-4 M DA.-150+200 50 0,438pH 6
Vacuum with 0,5 1 1,5 2 2,1 2,2(inch-Hg) gravityDewat. 0 2 2 2 2 2 2Time(min)Cake 59,28 58,35 58,35 58,32 58,30 57,32 56,45(Gram)Res Mois 24,09 22,88 22,88 22,84 22,81 21,49 20,28
%Saturation 1,000 0,900 0,900 0,897 0,894 0,789 0,695
95
Page 118
Table A.77. -150+200 mesh rutile experimented with 10-4 M DA at pH 8
TEST NO TEST TEST SIZE DRY SOLIDS CAKE POROSITYSOLIDS LIQUID (MESH) (GRAM)
77 Rutile 10-4 M DA.-150+200 50 0,435pH 8
Vacuum with 0,5 1 1,5 2 2,1 2,2(inch-Hg) gravityDewat. 0 2 2 2 2 2 2Time(min)Cake 59,17 59,16 59,14 59,13 59,12 57,16 55,25(Gram)Res Mois 23,95 23,94 23,91 23,90 23,88 21,27 18,55
%Saturation 1,000 0,999 0,997 0,996 0,995 0,781 0,573
Table A.78. -150+200 mesh rutile experimented with 10-4 M DA at pH 8
TEST NO TEST TEST SIZE DRY SOLIDS CAKE POROSITYSOLIDS LIQUID (MESH) (GRAM)
78 Rutile 10-4 M DA.-150+200 50 0,430pH 8
Vacuum with 0,5 1 1,5 2 2,1 2,2(inch-Hg) gravityDewat. 0 2 2 2 2 2 2Time(min)Cake 58,99 58,99 58,98 58,98 58,98 57,36 55,12(Gram)Res Mois 23,72 23,72 23,70 23,70 23,70 21,55 18,36
%Saturation 1,000 1,000 0,999 0,999 0,999 0,819 0,570
96
Page 119
Table A.79. -150+200 mesh rutile experimented with 10-4 M DA at pH 10
TEST NO TEST TEST SIZE DRY SOLIDS CAKE POROSITYSOLIDS LIQUID (MESH) (GRAM)
79 Rutile 10-4 M DA.-150+200 50 0,438pH 10
Vacuum with 0,5 1 1,5 2 2,2 2,4(inch-Hg) gravityDewat. 0 2 2 2 2 2 2Time(min)Cake 59,28 59,28 59,28 59,27 59,23 59,21 56,1(Gram)Res Mois 24,09 24,09 24,09 24,08 24,02 24,00 19,83
%Saturation 1,000 1,000 1,000 0,999 0,995 0,992 0,661
Table A.80. -150+200 mesh rutile experimented with 10-4 M DA at pH 10
TEST NO TEST TEST SIZE DRY SOLIDS CAKE POROSITYSOLIDS LIQUID (MESH) (GRAM)
80 Rutile 10-4 M DA.-150+200 50 0,435pH 10
Vacuum with 0,5 1 1,5 2 2,2 2,4(inch-Hg) gravityDewat. 0 2 2 2 2 2 2Time(min)Cake 59,15 59,13 59,13 59,10 59,09 59,04 57,1(Gram)Res Mois 23,92 23,90 23,90 23,86 23,84 23,78 21,22
%Saturation 1,000 0,998 0,998 0,995 0,993 0,988 0,778
97
Page 120
Table A.81. -150+200 mesh rutile experimented with 5.10-5 M DA at pH 4
TEST NO TEST TEST SIZE DRY SOLIDS CAKE POROSITYSOLIDS LIQUID (MESH) (GRAM)
81 Rutile 10-5 M DA.-150+200 50 0,433pH 4
Vacuum with 0,5 1 1,5 2 2,2 2,4(inch-Hg) gravityDewat. 0 2 2 2 2 2 2Time(min)Cake 59,10 59,08 59,08 59,07 59,06 59,01 57,7(Gram)Res Mois 23,86 23,83 23,83 23,82 23,81 23,74 21,94
%Saturation 1,000 0,998 0,998 0,997 0,996 0,990 0,841
Table A.82. -150+200 mesh rutile experimented with 5.10-5 M DA at pH 4
TEST NO TEST TEST SIZE DRY SOLIDS CAKE POROSITYSOLIDS LIQUID (MESH) (GRAM)
82 Rutile 10-5 M DA.-150+200 50 0,438pH 4
Vacuum with 0,5 1 1,5 2 2,2 2,4(inch-Hg) gravityDewat. 0 2 2 2 2 2 2Time(min)Cake 59,26 59,25 59,21 59,19 59,18 59,17 58(Gram)Res Mois 24,06 24,05 24,00 23,97 23,96 23,95 22,43
%Saturation 1,000 0,999 0,995 0,992 0,991 0,990 0,865
98
Page 121
Table A.83. -150+200 mesh rutile experimented with 5.10-5 M DA at pH 6
TEST NO TEST TEST SIZE DRY SOLIDS CAKE POROSITYSOLIDS LIQUID (MESH) (GRAM)
83 Rutile 10-5 M DA.-150+200 50 0,447pH 6
Vacuum with 0,5 1 1,5 2 2,2 2,4(inch-Hg) gravityDewat. 0 2 2 2 2 2 2Time(min)Cake 59,63 59,58 59,57 59,57 59,55 58,55 57,1(Gram)Res Mois 24,53 24,47 24,46 24,46 24,43 23,14 21,20
%Saturation 1,000 0,995 0,994 0,994 0,992 0,888 0,738
Table A.84. -150+200 mesh rutile experimented with 5.10-5 M DA at pH 6
TEST NO TEST TEST SIZE DRY SOLIDS CAKE POROSITYSOLIDS LIQUID (MESH) (GRAM)
84 Rutile 10-5 M DA.-150+200 50 0,449pH 6
Vacuum with 0,5 1 1,5 2 2,2(inch-Hg) gravityDewat. 0 2 2 2 2 2Time(min)Cake 59,69 59,68 59,67 59,67 59,64 57,99(Gram)Res Mois 24,61 24,60 24,59 24,59 24,55 22,40
%Saturation 1,000 0,999 0,998 0,998 0,995 0,825
99
Page 122
Table A.85. -150+200 mesh rutile experimented with 5.10-5 M DA at pH 8
TEST NO TEST TEST SIZE Y SOLIDSCAKE POROSITYSOLIDS LIQUID (MESH) (GRAM)
85 Rutile 10-5 M DA.-150+200 50 0,444pH 8
Vacuum with 0,5 1 1,5 2 2,2 2,4(inch-Hg) gravityDewat. 0 2 2 2 2 2 2Time(min)Cake 59,51 59,51 59,48 59,47 59,45 57,38 56,2(Gram)Res Mois 24,38 24,38 24,34 24,33 24,31 21,58 19,97
%Saturation 1,000 1,000 0,997 0,996 0,994 0,776 0,655
Table A.86. -150+200 mesh rutile experimented with 5.10-5 M DA at pH 8
TEST NO TEST TEST SIZE Y SOLIDSCAKE POROSITYSOLIDS LIQUID (MESH) (GRAM)
86 Rutile 10-5 M DA.-150+200 50 0,443pH 8
Vacuum with 0,5 1 1,5 2 2,2 2,4(inch-Hg) gravityDewat. 0 2 2 2 2 2 2Time(min)Cake 59,45 59,43 59,42 59,42 59,42 56,25 55,1(Gram)Res Mois 24,31 24,28 24,27 24,27 24,27 20,00 18,36
%Saturation 1,000 0,998 0,997 0,997 0,997 0,661 0,542
100
Page 123
Table A.87. -150+200 mesh rutile experimented with 5.10-5 M DA at pH 10
TEST NO TEST TEST SIZE DRY SOLIDS CAKE POROSITYSOLIDS LIQUID (MESH) (GRAM)
87 Rutile 10-5 M DA.-150+200 50 0,441pH 10
Vacuum with 0,5 1 1,5 2 2,2 2,4(inch-Hg) gravityDewat. 0 2 2 2 2 2 2Time(min)Cake 59,40 59,38 59,32 59,31 59,29 59,29 57,1(Gram)Res Mois 24,24 24,22 24,14 24,13 24,10 24,10 21,16
%Saturation 1,000 0,998 0,991 0,990 0,988 0,988 0,753
Table A.88. -150+200 mesh rutile experimented with 10-5 M DA at pH 4
TEST NO TEST TEST SIZE DRY SOLIDS CAKE POROSITYSOLIDS LIQUID (MESH) (GRAM)
88 Rutile 10-5 M DA.-150+200 50 0,434pH 4
Vacuum with 0,5 1 1,5 2 2,2 2,4(inch-Hg) gravityDewat. 0 2 2 2 2 2 2Time(min)Cake 59,11 59,01 59,01 59,01 58,97 59 57,8(Gram)Res Mois 15,41 15,27 15,27 15,27 15,21 15,21 13,48
%Saturation 1,000 0,989 0,989 0,989 0,985 0,985 0,855
101
Page 124
Table A.89. -150+200 mesh rutile experimented with 10-5 M DA at pH 4
TEST NO TEST TEST SIZE DRY SOLIDS CAKE POROSITYSOLIDS LIQUID (MESH) (GRAM)
89 Rutile 10-5 M DA.-150+200 50 0,430pH 4
Vacuum with 0,5 1 1,5 2 2,2 2,4(inch-Hg) gravityDewat. 0 2 2 2 2 2 2Time(min)Cake 58,99 58,97 58,96 58,95 58,95 58,9 57,7(Gram)Res Mois 15,24 15,21 15,20 15,18 15,18 15,12 13,27
%Saturation 1,000 0,998 0,997 0,996 0,996 0,991 0,851
Table A.90. -150+200 mesh rutile experimented with 10-5 M DA at pH 6
TEST NO TEST TEST SIZE DRY SOLIDS CAKE POROSITYSOLIDS LIQUID (MESH) (GRAM)
90 Rutile 10-5 M DA.-150+200 50 0,428pH 6
Vacuum with 0,5 1 1,5 2 2,2 2,4(inch-Hg) gravityDewat. 0 2 2 2 2 2 2Time(min)Cake 58,89 58,87 58,86 58,86 58,84 58,8 56,4(Gram)Res Mois 15,10 15,07 15,05 15,05 15,02 15,02 11,38
%Saturation 1,000 0,998 0,997 0,997 0,994 0,994 0,722
102
Page 125
Table A.91. -150+200 mesh rutile experimented with 10-5 M DA at pH 6
TEST NO TEST TEST SIZE DRY SOLIDS CAKE POROSITYSOLIDS LIQUID (MESH) (GRAM)
91 Rutile 10-5 M DA.-150+200 50 0,431pH 6
Vacuum with 0,5 1 1,5 2 2,2 2,4(inch-Hg) gravityDewat. 0 2 2 2 2 2 2Time(min)Cake 59,03 59,03 59,02 59,01 58,88 58,9 57,7(Gram)Res Mois 15,30 15,30 15,28 15,27 15,08 15,07 13,33
%Saturation 1,000 1,000 0,999 0,998 0,983 0,982 0,852
Table A.92. -150+200 mesh rutile experimented with 10-5 M DA at pH 8
TEST NO TEST TEST SIZE DRY SOLIDS CAKE POROSITYSOLIDS LIQUID (MESH) (GRAM)
92 Rutile 10-5 M DA.-150+200 50 0,432pH 8
Vacuum with 0,5 1 1,5 2 2,2 2,4(inch-Hg) gravityDewat. 0 2 2 2 2 2 2Time(min)Cake 59,07 59,06 59 58,98 58,97 58,9 57(Gram)Res Mois 15,35 15,34 15,25 15,23 15,21 15,05 12,22
%Saturation 1,000 0,999 0,992 0,990 0,989 0,977 0,767
103
Page 126
Table A.93. -150+200 mesh rutile experimented with 10-5 M DA at pH 8
TEST NO TEST TEST SIZE DRY SOLIDS CAKE POROSITYSOLIDS LIQUID (MESH) (GRAM)
93 Rutile 10-5 M DA.-150+200 50 0,435pH 8
Vacuum with 0,5 1 1,5 2 2,2 2,4(inch-Hg) gravityDewat. 0 2 2 2 2 2 2Time(min)Cake 59,16 59,15 59,12 59,12 59,11 59,1 57,9(Gram)Res Mois 15,48 15,47 15,43 15,43 15,41 15,37 13,57
%Saturation 1,000 0,999 0,996 0,996 0,995 0,991 0,857
Table A.94. -150+200 mesh rutile experimented with 10-5 M DA at pH 10
TEST NO TEST TEST SIZE DRY SOLIDS CAKE POROSITYSOLIDS LIQUID (MESH) (GRAM)
94 Rutile 10-5 M DA.-150+200 50 0,440pH 10
Vacuum with 0,5 1 1,5 2 2,2 2,4(inch-Hg) gravityDewat. 0 2 2 2 2 2 2Time(min)Cake 59,35 59,33 59,32 59,32 59,3 59,3 57,4(Gram)Res Mois 15,75 15,73 15,71 15,71 15,68 15,64 12,92
%Saturation 1,000 0,998 0,997 0,997 0,995 0,991 0,794
104
Page 127
Table A.95. -150+200 mesh rutile experimented with 10-5 M DA at pH 10
TEST NO TEST TEST SIZE DRY SOLIDS CAKE POROSITYSOLIDS LIQUID (MESH) (GRAM)
95 Rutile 10-5 M DA.-150+200 50 0,442pH 10
Vacuum with 0,5 1 1,5 2 2,2 2,4(inch-Hg) gravityDewat. 0 2 2 2 2 2 2Time(min)Cake 59,44 59,41 59,41 59,39 59,38 59,4 58,1(Gram)Res Mois 15,88 15,84 15,84 15,81 15,80 15,78 13,97
%Saturation 1,000 0,997 0,997 0,995 0,994 0,993 0,860
Table A.96. -150+200 mesh rutile experimented with 10-4 M SDS at pH 2
TEST NO TEST TEST SIZE DRY SOLIDS CAKE POROSITYSOLIDS LIQUID (MESH) (GRAM)
96 Rutile 0-5 M SD .-150+200 50 0,428pH 2
Vacuum with 0,5 1 1,5 2 2,2(inch-Hg) gravityDewat. 0 2 2 2 2 2Time(min)Cake 58,89 58,85 58,85 58,86 57,16 56,1(Gram)Res Mois 15,10 15,04 15,04 15,05 12,53 10,92
%Saturation 1,000 0,996 0,996 0,997 0,805 0,690
105
Page 128
Table A.97. -150+200 mesh rutile experimented with 10-4 M SDS at pH 4
TEST NO TEST TEST SIZE DRY SOLIDS CAKE POROSITYSOLIDS LIQUID (MESH) (GRAM)
97 Rutile 0-4 M SD .-150+200 50 0,439pH 4
Vacuum with 0,5 1 1,5 2 2,2 2,4(inch-Hg) gravityDewat. 0 2 2 2 2 2 2Time(min)Cake 59,32 59,31 59,28 59,26 59,26 59,3 57,3(Gram)Res Mois 15,71 15,70 15,65 15,63 15,63 15,61 12,68
%Saturation 1,000 0,999 0,996 0,994 0,994 0,992 0,779
Table A.98. -150+200 mesh rutile experimented with 10-4 M SDS at pH 6
TEST NO TEST TEST SIZE DRY SOLIDS CAKE POROSITYSOLIDS LIQUID (MESH) (GRAM)
98 Rutile 0-4 M SD .-150+200 50 0,443pH 6
Vacuum with 0,5 1 1,5 2 2,2 2,4(inch-Hg) gravityDewat. 0 2 2 2 2 2 2Time(min)Cake 59,46 59,43 59,41 59,41 59,41 59,4 57,2(Gram)Res Mois 15,91 15,87 15,84 15,84 15,84 15,80 12,51
%Saturation 1,000 0,997 0,995 0,995 0,995 0,992 0,756
106
Page 129
Table A.99. -150+200 mesh rutile experimented with 10-4 M SDS at pH 8
TEST NO TEST TEST SIZE DRY SOLIDS CAKE POROSITYSOLIDS LIQUID (MESH) (GRAM)
99 Rutile 0-4 M SD .-150+200 50 0,434pH 8
Vacuum with 0,5 1 1,5 2 2,2 2,4(inch-Hg) gravityDewat. 0 2 2 2 2 2 2Time(min)Cake 59,12 59,11 59,11 59,11 59,08 59,1 57,6(Gram)Res Mois 15,43 15,41 15,41 15,41 15,37 15,37 13,22
%Saturation 1,000 0,999 0,999 0,999 0,996 0,996 0,836
Table A.100. -150+200 mesh rutile experimented with 5.10-5 M SDS at pH 2
TEST NO TEST TEST SIZE DRY SOLIDS CAKE POROSITYSOLIDS LIQUID (MESH) (GRAM)
100 Rutile 10-5 M SD.-150+200 50 0,441pH 2
Vacuum with 0,5 1 1,5 2 2,2 2,4(inch-Hg) gravityDewat. 0 2 2 2 2 2 2Time(min)Cake 59,38 59,37 59,37 59,36 58,16 57,2 56,2(Gram)Res Mois 15,80 15,78 15,78 15,77 14,03 12,51 11,00
%Saturation 1,000 0,999 0,999 0,998 0,870 0,762 0,659
107
Page 130
Table A.101. -150+200 mesh rutile experimented with 5.10-5 M SDS at pH 4
TEST NO TEST TEST SIZE DRY SOLIDS CAKE POROSITYSOLIDS LIQUID (MESH) (GRAM)
101 Rutile 10-5 M SD.-150+200 50 0,457pH 4
Vacuum with 0,5 1 1,5 2 2,2 2,4(inch-Hg) gravityDewat. 0 2 2 2 2 2 2Time(min)Cake 60,01 59,99 59,97 59,93 59,92 59,9 58,7(Gram)Res Mois 16,68 16,65 16,62 16,57 16,56 16,56 14,86
%Saturation 1,000 0,998 0,996 0,992 0,991 0,991 0,872
Table A.102. -150+200 mesh rutile experimented with 5.10-5 M SDS at pH 6
TEST NO TEST TEST SIZE DRY SOLIDS CAKE POROSITYSOLIDS LIQUID (MESH) (GRAM)
102 Rutile 10-5 M SD.-150+200 50 0,454pH 6
Vacuum with 0,5 1 1,5 2 2,2 2,4(inch-Hg) gravityDewat. 0 2 2 2 2 2 2Time(min)Cake 59,88 59,85 59,83 59,83 59,82 59,8 57,5(Gram)Res Mois 16,50 16,46 16,43 16,43 16,42 16,40 13,07
%Saturation 1,000 0,997 0,995 0,995 0,994 0,993 0,761
108
Page 131
Table A.103. -150+200 mesh rutile experimented with 5.10-5 M SDS at pH 8
TEST NO TEST TEST SIZE DRY SOLIDS CAKE POROSITYSOLIDS LIQUID (MESH) (GRAM)
103 Rutile 10-5 M SD.-150+200 50 0,450pH 8
Vacuum with 0,5 1 1,5 2 2,2 2,4(inch-Hg) gravityDewat. 0 2 2 2 2 2 2Time(min)Cake 59,73 59,72 59,72 59,71 59,69 59,7 58(Gram)Res Mois 16,29 16,28 16,28 16,26 16,23 16,22 13,78
%Saturation 1,000 0,999 0,999 0,998 0,996 0,995 0,821
Table A.104. -150+200 mesh rutile experimented with 10-5 M SDS at pH 2
TEST NO TEST TEST SIZE DRY SOLIDS CAKE POROSITYSOLIDS LIQUID (MESH) (GRAM)
104 Rutile 0-5 M SD .-150+200 50 0,437pH 2
Vacuum with 0,5 1 1,5 2 2,2 2,4(inch-Hg) gravityDewat. 0 2 2 2 2 2 2Time(min)Cake 59,25 59,25 59,24 59,23 59,23 57,7 55,7(Gram)Res Mois 15,61 15,61 15,60 15,58 15,58 13,33 10,27
%Saturation 1,000 1,000 0,999 0,998 0,998 0,831 0,618
109
Page 132
Table A.105. -150+200 mesh rutile experimented with 10-5 M SDS at pH 4
TEST NO TEST TEST SIZE DRY SOLIDS CAKE POROSITYSOLIDS LIQUID (MESH) (GRAM)
105 Rutile 0-5 M SD .-150+200 50 0,436pH 4
Vacuum with 0,5 1 1,5 2 2,2 2,4(inch-Hg) gravityDewat. 0 2 2 2 2 2 2Time(min)Cake 59,19 59,18 59,17 59,12 59,11 59,1 57,2(Gram)Res Mois 15,53 15,51 15,50 15,43 15,41 15,41 12,56
%Saturation 1,000 0,999 0,998 0,992 0,991 0,991 0,781
Table A.106. -150+200 mesh rutile experimented with 10-5 M SDS at pH 6
TEST NO TEST TEST SIZE DRY SOLIDS CAKE POROSITYSOLIDS LIQUID (MESH) (GRAM)
106 Rutile 0-5 M SD .-150+200 50 0,438pH 6
Vacuum with 0,5 1 1,5 2 2,2 2,4(inch-Hg) gravityDewat. 0 2 2 2 2 2 2Time(min)Cake 59,28 59,24 59,24 59,23 59,22 59,2 58,2(Gram)Res Mois 15,65 15,60 15,60 15,58 15,57 15,55 14,03
%Saturation 1,000 0,996 0,996 0,995 0,994 0,992 0,879
110
Page 133
Table A.107. -150+200 mesh rutile experimented with 10-5 M SDS at pH 8
TEST NO TEST TEST SIZE DRY SOLIDS CAKE POROSITYSOLIDS LIQUID (MESH) (GRAM)
107 Rutile 0-5 M SD .-150+200 50 0,444pH 8
Vacuum with 0,5 1 1,5 2 2,2 2,4(inch-Hg) gravityDewat. 0 2 2 2 2 2 2Time(min)Cake 59,52 59,47 59,46 59,45 59,42 59,4 57,9(Gram)Res Mois 15,99 15,92 15,91 15,90 15,85 15,84 13,70
%Saturation 1,000 0,995 0,994 0,993 0,989 0,988 0,834
111
Page 134
APPENDIX B
TABLES OF COLUMN WICKING EXPERIMENTS
Table B.1. -150+200 mesh zircon experimented with water
TEST NO : 109 TEST NO : 110seconds cm seconds cm
10 1,8 10 1,820 2,6 20 2,630 3,4 30 3,240 3,9 40 3,650 4,4 50 3,960 4,6 60 4,170 4,9 70 4,480 5,4 80 4,690 5,6 90 4,8100 5,8 100 5110 6 110 5,2
120 5,4
Table B.2. -150+200 mesh zircon experimented with methanol
TEST NO : 111 TEST NO : 112seconds cm seconds cm
10 2 10 220 3,1 20 330 3,9 30 3,640 4,6 40 4,250 5,1 50 4,760 5,6 60 5,170 6,1 70 5,680 6,5 80 5,890 6,8 90 6,2100 7,2 100 6,6110 7,4 110 6,8120 7,7 120 7,2130 8,1 130 7,4140 8,2 140 7,8150 8,5 150 8160 8,7170 8,8
112
Page 135
Table B.3. -150+200 mesh zircon experimented with hexane
TEST NO : 113seconds cm
10 020 030 040 050 060 070 080 090 0100 0110 0120 0
Table B.4. -150+200 mesh zircon experimented with formamide
TEST NO : 114 TEST NO : 115seconds cm seconds cm
10 1,1 10 1,120 1,8 20 1,830 2,2 30 2,440 2,6 40 2,850 2,8 50 360 3,2 60 3,270 3,4 70 3,680 3,6 80 3,790 3,8 90 3,8100 4 100 4
113
Page 136
Table B.5. -150+200 mesh zircon experimented with 10% methanol
TEST NO : 116 TEST NO : 117seconds cm seconds cm
10 1,4 10 1,420 2,2 20 2,130 2,7 30 2,740 3,2 40 3,250 3,6 50 3,660 4 60 3,970 4,2 70 4,280 4,4 80 4,390 4,6 90 4,6100 4,9 100 4,8110 5,2
Table B.6. -150+200 mesh zircon experimented with 25% methanol
TEST NO : 118 TEST NO : 119seconds cm seconds cm
10 1,4 10 1,520 2,3 20 2,330 2,7 30 2,740 3,1 40 350 3,5 50 3,360 3,8 60 3,770 4 70 480 4,2 80 4,390 4,4 90 4,5
Table B.7. -150+200 mesh zircon experimented with 40% methanol
TEST NO : 120 TEST NO : 121seconds cm t cm
10 1,5 10 1,620 2,2 20 2,330 2,6 30 2,740 3,1 40 3,250 3,6 50 3,760 3,9 60 4,170 4,2 70 4,480 4,3 80 4,790 4,6 90 5100 5 100 5,3
114
Page 137
Table B.8. -150+200 mesh zircon experimented with 50% methanol
TEST NO : 122 TEST NO : 123seconds cm seconds cm
10 1,4 10 1,520 2 20 2,130 2,6 30 2,640 3 40 350 3,4 50 3,460 3,7 60 3,670 4 70 480 4,4 80 4,390 4,6 90 4,6100 4,8 100 4,9110 5 110 5,1
Table B.9. -150+200 mesh zircon experimented with 65% methanol
TEST NO : 124 TEST NO : 125seconds cm seconds cm
10 1,4 10 1,520 2,2 20 2,330 2,8 30 2,840 3,4 40 3,550 3,8 50 3,960 4,2 60 4,270 4,6 70 4,580 4,9 80 4,890 5,1 90 5,2100 5,4 100 5,5110 5,6 110 5,8120 5,8 120 6,1
115
Page 138
Table B.10. -150+200 mesh zircon experimented with 80% methanol
TEST NO : 126 TEST NO : 127seconds cm seconds cm
10 1,6 10 1,520 2,2 20 2,330 2,8 30 2,840 3,2 40 3,250 3,6 50 3,660 4,2 60 470 4,4 70 4,380 4,9 80 4,690 5,2 90 4,9100 5,5 100 5,3110 5,8 110 5,6
Table B.11. -150+200 mesh zircon experimented with 5.10-5 M DA at pH 4
TEST NO : 128 TEST NO : 129seconds cm seconds cm
10 1,6 10 1,520 2 20 2,130 2,3 30 2,340 2,6 40 2,750 2,9 50 360 3,1 60 3,270 3,4 70 3,480 3,6 80 3,690 3,8 90 3,8100 4,1 100 4110 4,4 110 4,1120 4,6 120 4,3
116
Page 139
Table B.12. -150+200 mesh zircon experimented with 5.10-5 M DA at pH 6
TEST NO : 130 TEST NO : 131seconds cm seconds cm
10 1,4 10 1,420 1,8 20 1,730 2 30 240 2,2 40 2,350 2,4 50 2,560 2,6 60 2,770 2,8 70 2,980 3 80 3,190 3,25 90 3,3100 3,4 100 3,4110 3,7 110 3,6120 3,8 120 3,9
Table B.13. -150+200 mesh zircon experimented with 5.10-5 M DA at pH 8
TEST NO : 132 TEST NO : 133seconds cm seconds cm
10 1,4 10 1,320 1,6 20 1,530 1,8 30 1,740 2 40 1,950 2,2 50 2,160 2,4 60 2,370 2,55 70 2,580 2,7 80 2,690 2,8 90 2,7100 2,9 100 3110 2,95 110 3,2120 3,1 120 3,3
117
Page 140
Table B.14. -150+200 mesh zircon experimented with 5.10-5 M DA at pH 10
TEST NO : 134 TEST NO : 135seconds cm seconds cm
10 1,65 10 1,620 2,4 20 2,430 3,1 30 3,140 3,6 40 3,550 4,1 50 3,860 4,3 60 4,270 4,6 70 4,680 4,9 80 590 5,1 90 5,3100 5,3 100 5,5110 5,6 110 5,8120 5,78 120 6
Table B.15. -150+200 mesh zircon experimented with 10-5 M DA at pH 4
TEST NO : 136 TEST NO : 137seconds cm seconds cm
10 1,6 10 1,620 2,3 20 2,230 3 30 2,640 3,4 40 3,150 3,8 50 3,660 4,1 60 470 4,3 70 4,480 4,5 80 4,890 4,7 90 5,1100 5 100 5,4110 5,2 110 5,5120 5,4 120 5,7
118
Page 141
Table B.16. -150+200 mesh zircon experimented with 10-5 M DA at pH 6
TEST NO : 138 TEST NO : 139seconds cm seconds cm
10 1,5 10 1,520 2 20 230 2,4 30 2,440 2,6 40 2,650 2,8 50 2,960 3 60 3,170 3,2 70 3,380 3,4 80 3,590 3,5 90 3,7100 3,6 100 4110 3,65 110 4,1
Table B.17. -150+200 mesh zircon experimented with 10-5 M DA at pH 8
TEST NO : 140 TEST NO : 141seconds cm seconds cm
10 1,4 10 1,520 1,9 20 1,930 2,2 30 2,240 2,4 40 2,450 2,6 50 2,760 2,8 60 2,970 3 70 3,180 3,15 80 3,290 3,25 90 3,3100 3,3 100 3,4110 3,4 110 3,5
119
Page 142
Table B.18. -150+200 mesh zircon experimented with 10-5 M DA at pH 10
TEST NO : 142 TEST NO : 143seconds cm seconds cm
10 1,8 10 1,720 2,3 20 2,230 3,1 30 340 3,6 40 3,550 4 50 3,960 4,4 60 4,470 4,7 70 4,680 5 80 4,890 5,2 90 5100 5,6 100 5,3110 5,8
Table B.19. -150+200 mesh zircon experimented with 10-5 M SDS at pH 2
TEST NO 144 TEST NO : 145seconds cm seconds cm
10 1,6 10 1,520 2,4 20 2,330 2,9 30 340 3,3 40 3,250 3,7 50 3,560 3,95 60 3,870 4,1 70 4,280 4,4 80 4,590 4,6 90 4,6100 4,75 100 4,8
120
Page 143
Table B.20. -150+200 mesh zircon experimented with 5.10-5 M SDS at pH 2
TEST NO : 146 TEST NO : 147seconds cm seconds cm
10 1,4 10 1,420 2 20 230 2,4 30 2,440 2,8 40 2,750 3,1 50 2,960 3,3 60 3,270 3,7 70 3,680 4 80 3,990 4,3 90 4,2100 4,6 100 4,4110 4,7 110 4,7120 4,8 120 5
Table B.21. -150+200 mesh zircon experimented with 10-4 M SDS at pH 2
TEST NO 148 TEST NO : 149seconds cm seconds cm
10 1,2 10 1,320 1,6 20 1,730 2 30 240 2,3 40 2,350 2,6 50 2,660 2,8 60 2,970 3 70 3,180 3,2 80 3,390 3,4 90 3,5100 3,6 100 3,7110 3,7 110 3,8120 3,8 120 3,9
121
Page 144
Table B.22. -150+200 mesh rutile experimented with water
TEST NO : 150 TEST NO : 151seconds cm seconds cm
10 1,6 10 1,620 2,4 20 2,430 3 30 340 3,6 40 3,450 3,9 50 3,860 4,2 60 4,270 4,6 70 4,680 4,8 80 4,890 5 90 5100 5,2 100 5,4110 5,5 110 5,5120 5,6 120 5,6130 5,8 130 5,9140 6 140 6150 6,1 150 6,2160 6,4 160 6,4170 6,6 170 6,6
122
Page 145
Table B.23. -150+200 mesh rutile experimented with methanol
TEST NO : 153 TEST NO : 154seconds cm seconds cm
10 1,7 10 1,620 2,6 20 2,430 3,2 30 3,140 3,8 40 3,750 4,2 50 4,160 4,7 60 4,570 5 70 4,980 5,4 80 5,390 5,8 90 5,7100 6,1 100 5,8110 6,4 110 6,2120 6,6 120 6,5130 6,9 130 6,7140 7,1 140 7150 7,3 150 7,2160 7,5 160 7,4170 7,7 170 7,6180 7,9 180 7,8190 8,1 190 8200 8,3210 8,4
Table B.24. -150+200 mesh rutile experimented with 10% methanol
TEST NO : 155 TEST NO : 156seconds cm seconds cm
10 1,4 10 1,520 1,8 20 1,830 2,1 30 2,240 2,4 40 2,550 2,7 50 2,860 3 60 370 3,2 70 3,380 3,4 80 3,590 3,6 90 3,6
123
Page 146
Table B.25. -150+200 mesh rutile experimented with 25% methanol
TEST NO : 157 TEST NO : 158seconds cm seconds cm
10 1 10 1,320 1,8 20 1,930 2,3 30 2,440 2,6 40 2,750 3 50 3,160 3,4 60 3,470 3,6 70 3,780 3,9 80 490 4,1 90 4,2100 4,4 100 4,4
Table B.26. -150+200 mesh rutile experimented with 40% methanol
TEST NO : 159 TEST NO : 160seconds cm seconds cm
10 1 10 1,220 1,6 20 1,730 2,2 30 2,240 2,6 40 2,650 2,9 50 360 3,1 60 3,370 3,5 70 3,680 3,8 80 3,890 4 90 4,1
124
Page 147
Table B.27. -150+200 mesh rutile experimented with 50% methanol
TEST NO : 161 TEST NO : 162seconds cm seconds cm
10 1,4 10 1,420 2 20 230 2,5 30 2,540 2,9 40 350 3,2 50 3,360 3,6 60 3,670 3,8 70 480 4 80 4,390 4,3 90 4,6100 4,5 100 4,9110 4,8 110 5,1120 4,9 120 5,3
Table B.28. -150+200 mesh rutile experimented with 65% methanol
TEST NO : 163 TEST NO : 164seconds cm seconds cm
10 1,4 10 1,420 2,1 20 2,130 2,6 30 2,740 3 40 350 3,4 50 3,360 3,8 60 3,770 4 70 480 4,2 80 4,390 4,4 90 4,5100 4,6 100 4,7110 4,8120 5
125
Page 148
Table B.29. -150+200 mesh rutile experimented with 80% methanol
TEST NO : 165 TEST NO : 166seconds cm seconds cm
10 1,5 10 1,420 2,3 20 2,230 2,9 30 2,940 3,3 40 3,350 3,8 50 3,860 4,1 60 4,170 4,4 70 4,380 4,6 80 4,790 5 90 4,9100 5,2 100 5
Table B.30. -150+200 mesh rutile experimented with 10-4 M DA at pH 4
TEST NO : 167 TEST NO : 168seconds cm t cm
10 1,75 10 1,720 2,15 20 2,230 2,4 30 2,640 2,7 40 2,950 3 50 3,160 3,3 60 3,570 3,45 70 3,780 3,7 80 3,9
Table B.31. -150+200 mesh rutile experimented with 10-4 M DA at pH 6
TEST NO : 169 TEST NO : 170seconds cm t cm
10 1,5 10 1,420 1,75 20 1,830 2 30 2,240 2,15 40 2,550 2,3 50 2,860 2,5 60 3,170 2,6 70 3,480 2,7 80 3,690 2,8 90 3,8100 2,85110 2,95120 3
126
Page 149
Table B.32. -150+200 mesh rutile experimented with 10-4 M DA at pH 8
TEST NO : 171 TEST NO : 172seconds cm seconds cm
10 1,6 10 1,620 2 20 230 2,25 30 2,340 2,5 40 2,650 2,7 50 2,860 2,9 60 370 2,95 70 3,2
Table B.33. -150+200 mesh rutile experimented with 10-4 M DA at pH 10
TEST NO : 172 TEST NO : 173seconds cm seconds cm
10 1,7 10 1,620 2,3 20 2,330 2,8 30 2,940 3,3 40 3,250 3,7 50 3,560 4 60 3,870 4,3 70 4
Table B.34. -150+200 mesh rutile experimented with 5.10-5 M DA at pH 4
TEST NO : 174seconds cm
10 220 2,430 2,840 3,150 3,460 3,670 3,7580 3,990 3,9100 4,05
127
Page 150
Table B.35. -150+200 mesh rutile experimented with 5.10-5 M DA at pH 6
TEST NO : 175t cm
10 1,720 230 2,2540 2,4550 2,660 2,870 3,180 3,2
Table B.36. -150+200 mesh rutile experimented with 5.10-5 M DA at pH 8
TEST NO : 176seconds cm
10 1,9520 2,330 2,4540 2,750 2,960 3,170 3,480 3,6
Table B.37. -150+200 mesh rutile experimented with 5.10-5 M DA at pH 10
TEST NO : 177seconds cm
10 2,120 2,630 340 3,450 3,860 4,270 4,35
128
Page 151
Table B.38. -150+200 mesh rutile experimented with 10-5 M DA at pH 4
TEST NO : 178seconds cm
10 1,520 2,130 2,640 350 3,360 3,770 4,180 4,4
Table B.39. -150+200 mesh rutile experimented with 10-5 M DA at pH 6
TEST NO : 179seconds cm
10 1,6520 230 2,240 2,450 2,6560 2,8570 3,1580 3,390 3,45
Table B.40. -150+200 mesh rutile experimented with 10-5 M DA at pH 8
TEST NO : 180seconds cm
10 1,720 2,130 2,3540 2,650 2,960 3,270 3,55
129
Page 152
Table B.41. -150+200 mesh rutile experimented with 10-5 M DA at pH 10
TEST NO : 181seconds cm
10 1,720 2,3530 2,7540 3,250 3,660 470 4,3
130
Page 153
APPENDIX C
TABLES OF MICROFLOTATION EXPERIMENTS
Table C.1. -150+200 mesh zircon experimented with water
recovery, % tailing, %91 993 791 990 192 8
Table C.2. -150+200 mesh zircon experimented with 10-3 M DA at different pH values
pH 4 pH 6recovery, % tailing, % recovery, % tailing, %
38 62 93 744 56 91 9
pH 8 pH 10recovery, % tailing, % recovery, % tailing, %
89 11 18 8294 6 16 84
Table C.3. -150+200 mesh zircon experimented with 10-4 M DA at different pH values
pH 4 pH 6recovery, % tailing, % recovery, % tailing, %
24 76 52 4821 79 49 51
pH 8 pH 10recovery, % tailing, % recovery, % tailing, %
54 46 15 8557 43 13 87
131
Page 154
Table C.4. -150+200 mesh zircon experimented with 5.10-5 M DA at different pH values
pH 4 pH 6recovery, % tailing, % recovery, % tailing, %
11 89 28 7215 85 31 69
pH 8 pH 10recovery, % tailing, % recovery, % tailing, %
32 68 11 8931 69 9 91
Table C.5. -150+200 mesh zircon experimented with 10-5 M DA at different pH values
pH 4 pH 6recovery, % tailing, % recovery, % tailing, %
3 97 9 915 95 4 96
pH 8 pH 10recovery, % tailing, % recovery, % tailing, %
7 93 1 995 95 6 94
Table C.6. -150+200 mesh zircon experimented with 10-3 M SDS at different pH values
pH 2 pH 4recovery, % tailing, % recovery, % tailing, %
92 8 19 8189 11 16 84
pH 6 pH 8recovery, % tailing, % recovery, % tailing, %
2 98 5 953 97 6 94
Table C.7. -150+200 mesh zircon experimented with 10-4 M SDS at different pH values
pH 2 pH 4recovery, % tailing, % recovery, % tailing, %
78 22 5 9574 26 4 96
pH 6 pH 8recovery, % tailing, % recovery, % tailing, %
0 100 5 952 98 3 97
132
Page 155
Table C.8. -150+200 mesh zircon experimented with 5.10-5 M SDS at different pH values
pH 2 pH 4recovery, % tailing, % recovery, % tailing, %
62 38 9 9158 42 7 93
pH 6 pH 8recovery, % tailing, % recovery, % tailing, %
4 96 0,03 0,971 99 0 1
Table C.9. -150+200 mesh zircon experimented with 10-5 M SDS at different pH values
pH 2 pH 4recovery, % tailing, % recovery, % tailing, %
17 83 1 9923 77 2 98
pH 6 pH 8recovery, % tailing, % recovery, % tailing, %
5 95 6 943 97 4 96
Table C.10. -150+200 mesh rutile experimented with 10-3 M DA at different pH values
pH 4 pH 6recovery, % tailing, % recovery, % tailing, %
45 55 88 1242 58 92 8
pH 8 pH 10recovery, % tailing, % recovery, % tailing, %
91 9 25 7585 15 34 66
Table C.11. -150+200 mesh rutile experimented with 10-4 M DA at different pH values
pH 4 pH 6recovery, % tailing, % recovery, % tailing, %
18 82 54 4622 78 47 53
pH 8 pH 10recovery, % tailing, % recovery, % tailing, %
45 55 15 8541 59 12 88
133
Page 156
Table C.12. -150+200 mesh rutile experimented with 5.10-5 M DA at different pH values
pH 4 pH 6recovery, % tailing, % recovery, % tailing, %
13 87 35 6515 85 29 71
pH 8 pH 10recovery, % tailing, % recovery, % tailing, %
25 75 6 9428 72 9 91
Table C.13. -150+200 mesh rutile experimented with 10-5 M DA at different pH values
pH 4 pH 6recovery, % tailing, % recovery, % tailing, %
5 95 12 883 97 13 87
pH 8 pH 10recovery, % tailing, % recovery, % tailing, %
9 91 3 977 93 2 98
Table C.14. -150+200 mesh rutile experimented with 10-3 M SDS at different pH values
pH 2 pH 4recovery, % tailing, % recovery, % tailing, %
91 9 6 9493 7 8 92
pH 6 pH 8recovery, % tailing, % recovery, % tailing, %
2 98 4 964 96 7 93
Table C.15. -150+200 mesh rutile experimented with 10-4 M SDS at different pH values
pH 2 pH 4recovery, % tailing, % recovery, % tailing, %
88 12 3 9792 8 5 95
pH 6 pH 8recovery, % tailing, % recovery, % tailing, %
2 98 4 966 94 4 96
134
Page 157
Table C.16. -150+200 mesh rutile experimented with 5.10-5 M SDS at different pH values
pH 2 pH 4recovery, % tailing, % recovery, % tailing, %
25 75 6 9423 77 3 97
pH 6 pH 8recovery, % tailing, % recovery, % tailing, %
3 97 2 984 96 4 96
Table C.17. -150+200 mesh rutile experimented with 10-5 M SDS at different pH values
pH 2 pH 4recovery, % tailing, % recovery, % tailing, %
12 88 4 9615 85 1 99
pH 6 pH 8recovery, % tailing, % recovery, % tailing, %
5 95 1 993 97 3 97
135
Page 158
APPENDIX D
TABLES OF CONTACT ANGLES OBTAINED FROM CAPILLARIC DEWATERING EXPERIMENTS WITH REPEAT TESTS
Table D.1.The reproducibilty of -150+200 mesh zircon experimented with 10% methanol
Experiment 1 Experiment 239.42 37.69
Table D.2.The reproducibilty of -150+200 mesh zircon experimented with 25% methanol
Experiment 1 Experiment 239.64 40.09
Table D.3.The reproducibilty of -150+200 mesh zircon experimented with 40% methanol
Experiment 1 Experiment 235.04 35.90
Table D.4.The reproducibilty of -150+200 mesh zircon experimented with 50% methanol
Experiment 1 Experiment 232.46 31.51
Table D.5.The reproducibilty of -150+200 mesh zircon experimented with 65% methanol
Experiment 1 Experiment 219.09 15.74
136
Page 159
Table D.6.The reproducibilty of -150+200 mesh zircon experimented with 80% methanol
Experiment 1 Experiment 220.36 14.36
Table D.7.The reproducibilty of -150+200 mesh zircon experimented with 5.10-5 M DA at pH 4
Experiment 1 Experiment 242.37 42.79
Table D.8.The reproducibilty of -150+200 mesh zircon experimented with 5.10-5 M DA at pH 6
Experiment 1 Experiment 249.83 49.08
Table D.9.The reproducibilty of -150+200 mesh zircon experimented with 5.10-5 M DA at pH 8
Experiment 1 Experiment 251.41 50.39
Table D.10.The reproducibilty of -150+200 mesh zircon experimented with 5.10-5 M DA at pH 10
Experiment 1 Experiment 240.31 40.42
Table D.11.The reproducibilty of -150+200 mesh zircon experimented with 10-5 M DA at pH 4
Experiment 1 Experiment 244.56 47.56
137
Page 160
Table D.12.The reproducibilty of -150+200 mesh zircon experimented with 10-5 M DA at pH 6
Experiment 1 Experiment 248.70 48.31
Table D.13.The reproducibilty of -150+200 mesh zircon experimented with 10-5 M DA at pH 8
Experiment 1 Experiment 249.64 49.83
Table D.14.The reproducibilty of -150+200 mesh zircon experimented with 10-5 M DA at pH 10
Experiment 1 Experiment 240.09 40.97
Table D.15.The reproducibilty of -150+200 mesh rutile experimented with water
Experiment 1 Experiment 232.83 32.95
Table D.16.The reproducibilty of -150+200 mesh rutile experimented with 10% methanol
Experiment 1 Experiment 223.72 28.81
Table D.17.The reproducibilty of -150+200 mesh rutile experimented with 25% methanol
Experiment 1 Experiment 221.47 26.23
Table D.18.The reproducibilty of -150+200 mesh rutile experimented with 40% methanol
Experiment 1 Experiment 225.31 22.71
138
Page 161
Table D.19.The reproducibilty of -150+200 mesh rutile experimented with 50% methanol
Experiment 1 Experiment 221.29 16.82
Table D.20.The reproducibilty of -150+200 mesh rutile experimented with 65% methanol
Experiment 1 Experiment 222.88 17.28
Table D.21.The reproducibilty of -150+200 mesh rutile experimented with10-4 M DA at pH 4
Experiment 1 Experiment 239.04 38.41
Table D.22.The reproducibilty of -150+200 mesh rutile experimented with10-4 M DA at pH 6
Experiment 1 Experiment 240.90 40.88
Table D.23.The reproducibilty of -150+200 mesh rutile experimented with10-4 M DA at pH 8
Experiment 1 Experiment 241.71 42.98
Table D.24.The reproducibilty of -150+200 mesh rutile experimented with10-4 M DA at pH 10
Experiment 1 Experiment 233.79 34.85
Table D.25.The reproducibilty of -150+200 mesh rutile experimented with 5.10-5 M DA at pH 4
Experiment 1 Experiment 235.43 33.79
139
Page 162
Table D.26.The reproducibilty of -150+200 mesh rutile experimented with 5.10-5 M DA at pH 6
Experiment 1 Experiment 238.41 37.87
Table D.27.The reproducibilty of -150+200 mesh rutile experimented with 5.10-5 M DA at pH 8
Experiment 1 Experiment 239.25 39.57
140