DETERMINATION OF CRUDE OIL FOULING THRESHOLDS M. Yang, A. O’Meara and B. D. Crittenden * Department of Chemical Engineering, University of Bath, Bath, UK, BA2 7AY *corresponding author: [email protected]ABSTRACT A small (1 litre) batch stirred cell system has been used to study threshold conditions of crude oil fouling at surface temperatures up to 400 o C and pressures up to 30 bar. Negative fouling rates are observed at combinations of low surface temperature and high stirring speed, ie high shear stress, after a fouling deposit has accumulated to a sufficient extent on the heated test surface. Data accumulated from a set of experiments that yield both positive and negative fouling rates over a range of surface temperatures and surface shear stresses now allows the fouling threshold conditions to be determined quickly and more accurately by interpolating fouling rate data, rather than by extrapolating only the positive rate data back to zero rate conditions. Supported by CFD studies, this approach allows fouling threshold conditions of surface temperature and shear stress to be identified relatively quickly in the laboratory. INTRODUCTION In previous research (Young et al., 2011) a batch stirred cell was constructed to a design that closely followed that of Eaton and Lux (1983, 1984). This cell can be operated under conditions close to those found in crude oil preheat trains, namely a maximum pressure of 30 bar and a maximum surface temperature of around 400 o C. The principal advantage of the cell design is that it offers extraordinary flexibility. Crude oils and the operational conditions can be changed easily and relatively quickly, whilst the heat transfer surface can be easily inspected and changed. With this test system it is possible to obtain a large number of fouling experimental results within a relatively short experimental period (Young et al., 2011). Negative fouling resistances have been reported in the literature, this phenomenon commonly being explained by the enhancement of heat transfer due to the roughening of the heat transfer surface in the early stages of fouling (Crittenden and Alderman, 1988, 1992; Fahiminia et al., 2005). Nonetheless, in this work, negative fouling rates have been observed not in the early stages of a fouling process but rather in later stages when the heat transfer surface has been covered with deposit and when the surface temperature has been reduced and/or when the cell’s stirrer speed has been increased. In this instance, negative fouling happens when the shear removal rate exceeds the fouling deposit formation rate and so the fouling resistance decreases with time. Fouling rate data collected in both positive and negative values can then be used to identify the threshold conditions, namely the surface temperature and wall shear stress (Panchal et al., 1997; Knudsen et al., 1997). When coupled with results from CFD simulation, the experimental results obtained using the batch stirred cell system can be used to help predict the fouling behaviour inside round tubes, even those fitted with inserts, when the concept of equivalent Reynolds number is used (Yang et al., 2009). EXPERIMENTS Stirred Cell System Details of the stirred cell system and the heated test probe are provided by Young et al. (2011). The general arrangements are shown in Figure 1. Fig. 1 The stirred cell system (Young et al., 2011) twb, twm, and tws are thermocouples Proceedings of International Conference on Heat Exchanger Fouling and Cleaning - 2011 (Peer-reviewed) June 05 - 10, 2011, Crete Island, Greece Editors: M.R. Malayeri, A.P. Watkinson and H. Müller-Steinhagen Published online www.heatexchanger-fouling.com 1 Proceedings of International Conference on Heat Exchanger Fouling and Cleaning - 2011 (Peer-reviewed) June 05 - 10, 2011, Crete Island, Greece Editors: M.R. Malayeri, A.P. Watkinson and H. Müller-Steinhagen Proceedings of International Conference on Heat Exchanger Fouling and Cleaning - 2011 (Peer-reviewed) June 05 - 10, 2011, Crete Island, Greece Editors: M.R. Malayeri, H. Müller-Steinhagen and A.P. Watkinson
Transcript
DETERMINATION OF CRUDE OIL FOULING THRESHOLDS
M. Yang, A. O’Meara and B. D. Crittenden
*
Department of Chemical Engineering, University of Bath, Bath, UK, BA2 7AY
A small (1 litre) batch stirred cell system has been used
to study threshold conditions of crude oil fouling at surface
temperatures up to 400oC and pressures up to 30 bar.
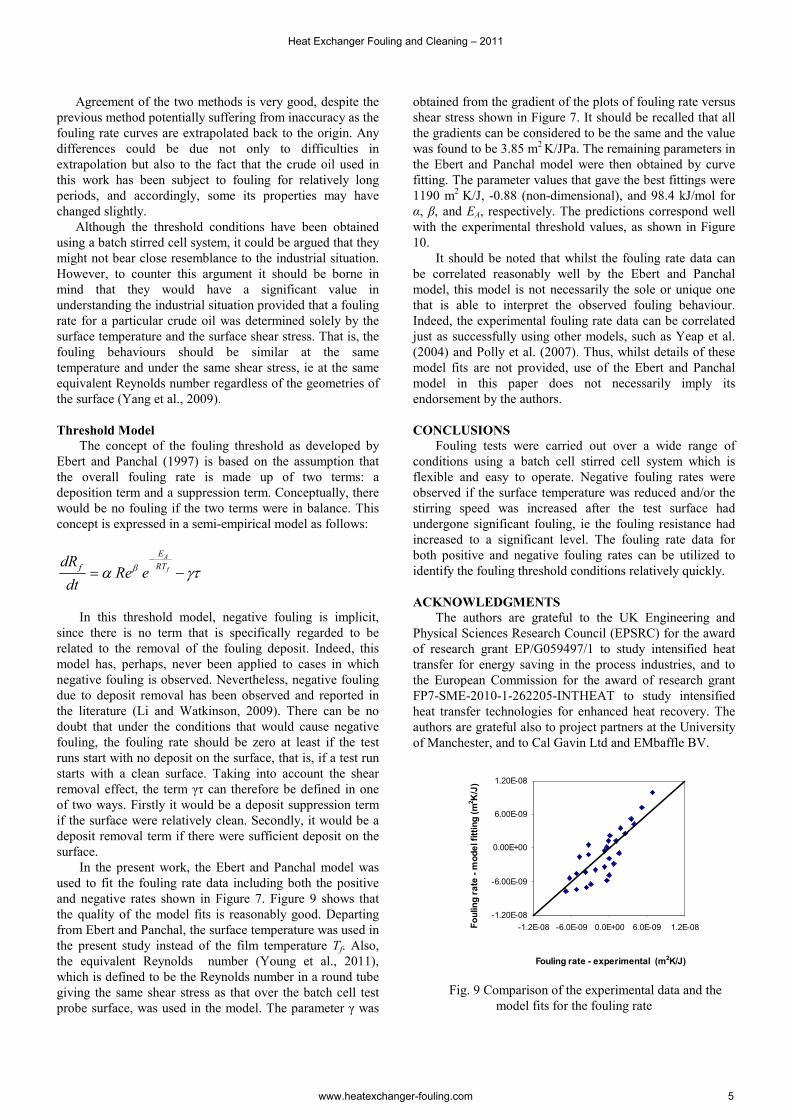
Negative fouling rates are observed at combinations of low
surface temperature and high stirring speed, ie high shear
stress, after a fouling deposit has accumulated to a sufficient
extent on the heated test surface. Data accumulated from a
set of experiments that yield both positive and negative
fouling rates over a range of surface temperatures and
surface shear stresses now allows the fouling threshold
conditions to be determined quickly and more accurately by
interpolating fouling rate data, rather than by extrapolating
only the positive rate data back to zero rate conditions.
Supported by CFD studies, this approach allows fouling
threshold conditions of surface temperature and shear stress
to be identified relatively quickly in the laboratory.
INTRODUCTION
In previous research (Young et al., 2011) a batch stirred
cell was constructed to a design that closely followed that of
Eaton and Lux (1983, 1984). This cell can be operated
under conditions close to those found in crude oil preheat
trains, namely a maximum pressure of 30 bar and a
maximum surface temperature of around 400oC. The
principal advantage of the cell design is that it offers
extraordinary flexibility. Crude oils and the operational
conditions can be changed easily and relatively quickly,
whilst the heat transfer surface can be easily inspected and
changed. With this test system it is possible to obtain a large
number of fouling experimental results within a relatively
short experimental period (Young et al., 2011).
Negative fouling resistances have been reported in the
literature, this phenomenon commonly being explained by
the enhancement of heat transfer due to the roughening of
the heat transfer surface in the early stages of fouling
(Crittenden and Alderman, 1988, 1992; Fahiminia et al.,
2005). Nonetheless, in this work, negative fouling rates have
been observed not in the early stages of a fouling process
but rather in later stages when the heat transfer surface has
been covered with deposit and when the surface temperature
has been reduced and/or when the cell’s stirrer speed has
been increased. In this instance, negative fouling happens
when the shear removal rate exceeds the fouling deposit
formation rate and so the fouling resistance decreases with
time. Fouling rate data collected in both positive and
negative values can then be used to identify the threshold
conditions, namely the surface temperature and wall shear
stress (Panchal et al., 1997; Knudsen et al., 1997).
When coupled with results from CFD simulation, the
experimental results obtained using the batch stirred cell
system can be used to help predict the fouling behaviour
inside round tubes, even those fitted with inserts, when the
concept of equivalent Reynolds number is used (Yang et al.,
2009).
EXPERIMENTS
Stirred Cell System
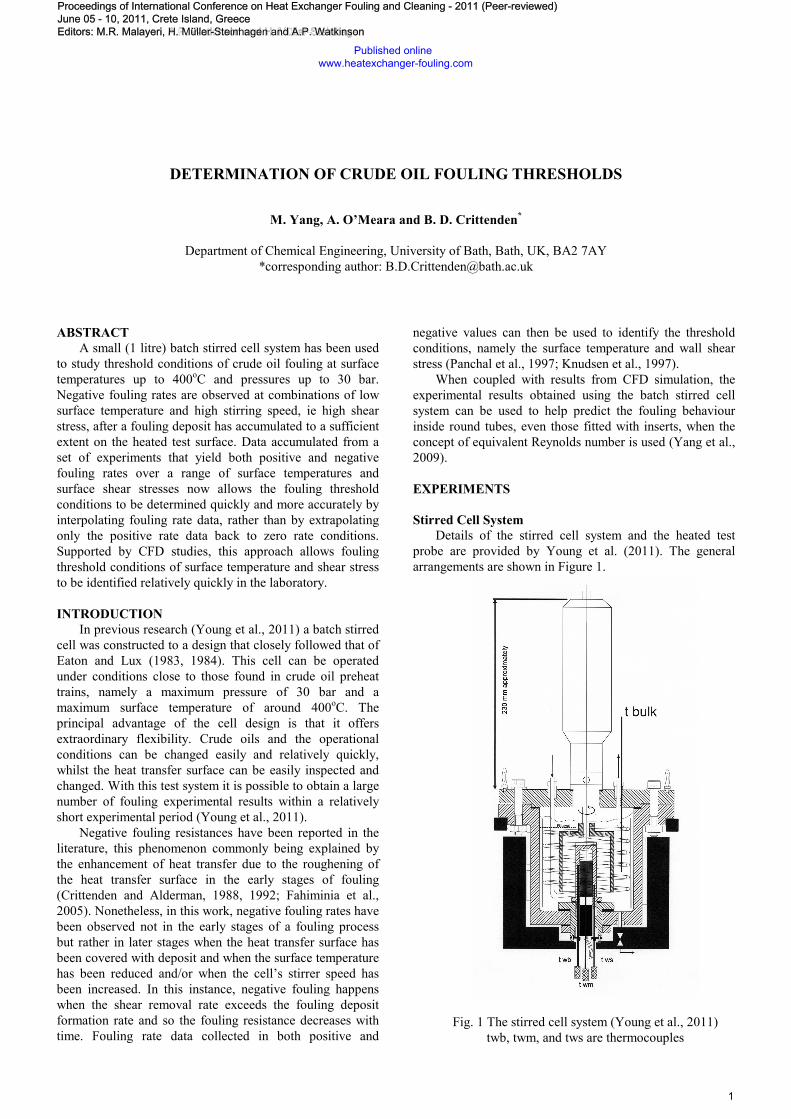
Details of the stirred cell system and the heated test
probe are provided by Young et al. (2011). The general arrangements are shown in Figure 1.
Fig. 1 The stirred cell system (Young et al., 2011)
twb, twm, and tws are thermocouples
Proceedings of International Conference on Heat Exchanger Fouling and Cleaning - 2011 (Peer-reviewed) June 05 - 10, 2011, Crete Island, Greece Editors: M.R. Malayeri, A.P. Watkinson and H. Müller-Steinhagen
Published online www.heatexchanger-fouling.com
1
Proceedings of International Conference on Heat Exchanger Fouling and Cleaning - 2011 (Peer-reviewed) June 05 - 10, 2011, Crete Island, Greece Editors: M.R. Malayeri, A.P. Watkinson and H. Müller-Steinhagen
Proceedings of International Conference on Heat Exchanger Fouling and Cleaning - 2011 (Peer-reviewed) June 05 - 10, 2011, Crete Island, Greece Editors: M.R. Malayeri, H. Müller-Steinhagen and A.P. Watkinson
The stirred cell comprises a pressure vessel made in-
house from a block of 304 stainless steel together with a top
flange. The base of the vessel houses an upwards pointing
test probe heated internally by a cartridge heater, the heat
flux from which is controlled electrically.
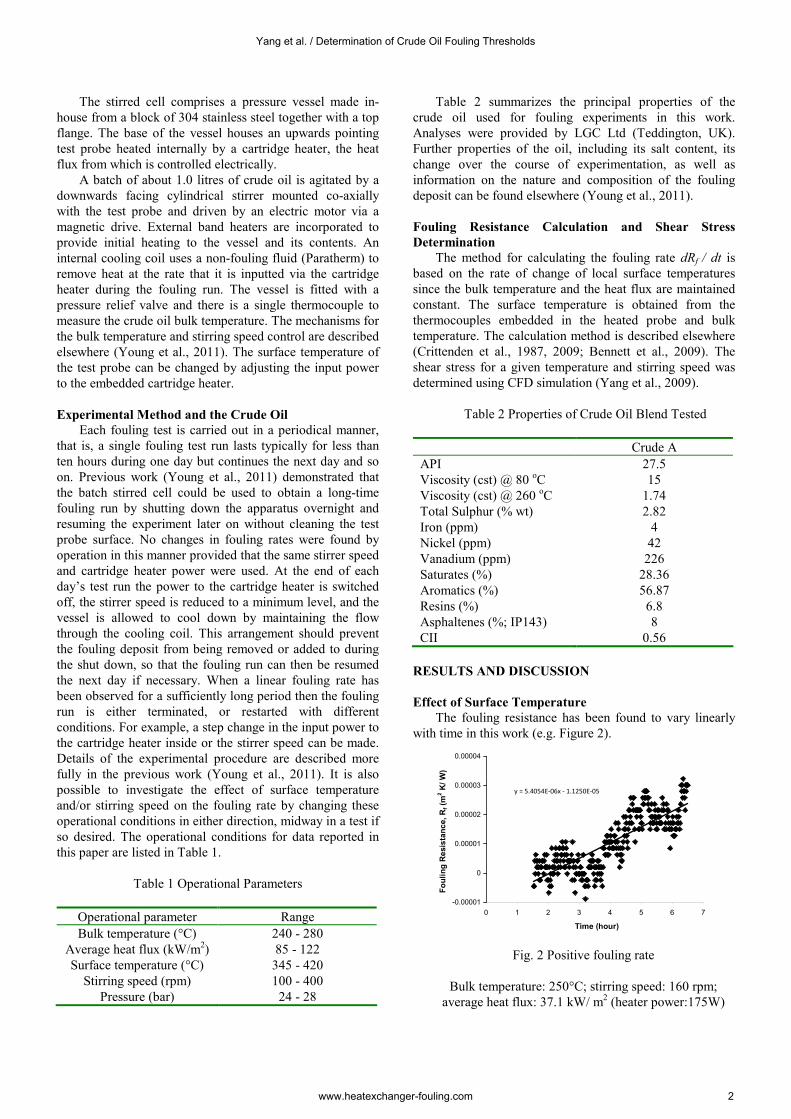
A batch of about 1.0 litres of crude oil is agitated by a