Determination of Lead in TSP by Inductively Coupled Plasma Atomic Emission Spectrometry (ICP-AES) with Heated Ultrasonic Nitric and Hydrochloric Acid Filter Extraction Standard Operating Procedure (SOP) Prepared by Frank X. Weber, Eric Poitras, Cynthia Salmons, and James Flanagan Environmental and Industrial Sciences Division RTI International Research Triangle Park, NC 27709 EPA Contract No. EP-D-08-047 Office of Air Quality Planning and Standards U.S. Environmental Protection Agency Research Triangle Park, NC 27711
Transcript
Determination of Lead in TSP by Inductively Coupled Plasma Atomic Emission Spectrometry (ICP-AES) with Heated Ultrasonic Nitric and Hydrochloric Acid Filter
Extraction
Standard Operating Procedure (SOP)
Prepared by
Frank X. Weber, Eric Poitras, Cynthia Salmons, and James Flanagan
Environmental and Industrial Sciences Division
RTI International Research Triangle Park, NC 27709
EPA Contract No. EP-D-08-047
Office of Air Quality Planning and Standards U.S. Environmental Protection Agency
Research Triangle Park, NC 27711
2
DISCLAIMER
The information in this document has been funded wholly or in part by the United States Environmental Protection Agency (USEPA) under EPA Contract No. EP-D-08-047. Mention of trade names or commercial products does not constitute endorsement or recommendation for use.
18.0 FIGURES AND TABLES ................................................................................................... 23
4
List of Figures
Figure 1. Top view of filter strip rolled and placed in 28mm diameter plastic extraction
tube. .......................................................................................................................... 23 Figure 2. Filter in plastic extraction tube in tube rack placed in ultrasonic bath. .................... 23
List of Tables
Table 1. Method Detection Limits Determined by Analysis of Reagent/Glass Fiber Filter Blanks and Reagent/Glass Fiber Filter Blanks Spiked with Low-level Pb Solution………… ....................................................................................... ……24
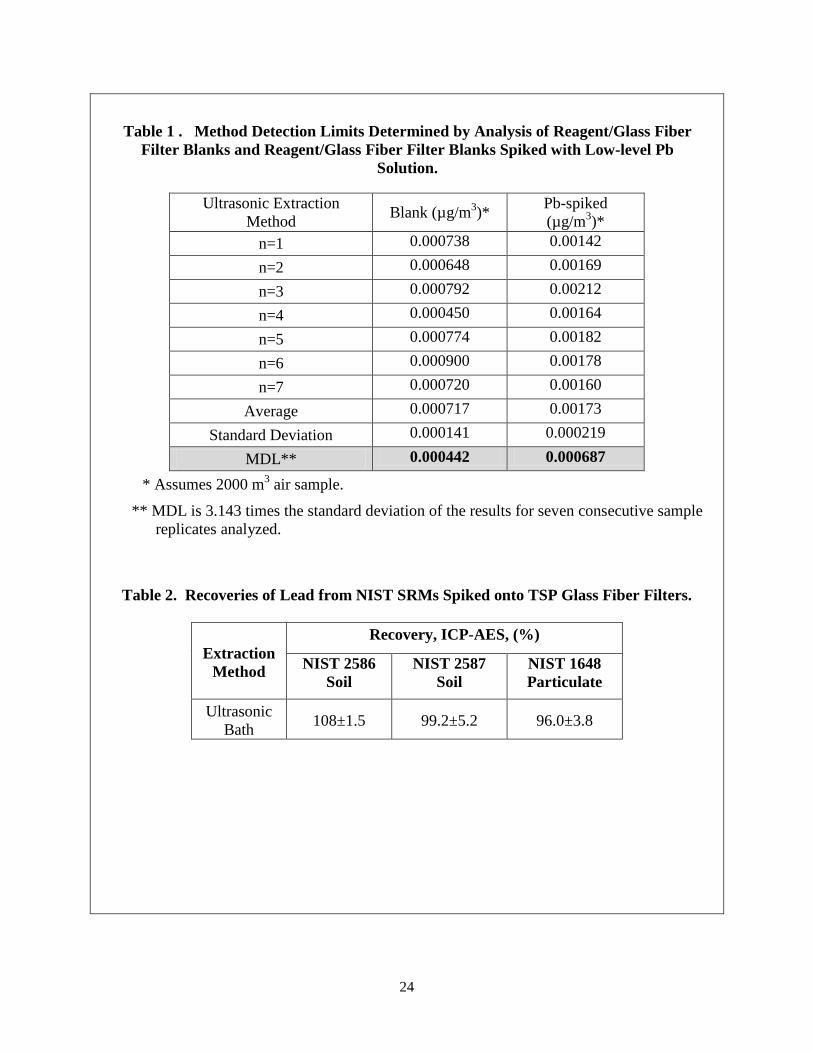
Table 2. Recoveries of Lead from NIST SRMs Spiked onto TSP Glass Fiber Filters ............ 24
5
1.0 SCOPE AND APPLICABILITY Lead poisoning can cause irreversible brain damage and can impair mental functioning in children. It can retard mental and physical development and reduce attention span. In adults, it can cause irritability, poor muscle coordination, and nerve damage to the sense organs and nerves controlling the body.
Since 1980, lead emissions have decreased nearly 97 percent, according to EPA, and levels of lead in the air are currently much lower than they were in 1978. The drop in emissions is being attributed primarily to the phase-out of lead in gasoline. However, EPA estimates that over 1,300 tons of lead are emitted into the air annually from sources including smelters, iron and steel foundries, and general aviation gasoline.1 Based on its review of the air quality criteria and national ambient air quality standards (NAAQS) for lead (Pb), EPA has made revisions to the primary and secondary NAAQS for Pb to protect public health and welfare. EPA has revised the level to 0.15 μg/m3
while it is retaining the current indicator of lead in total suspended particles (Pb-TSP).2
This Standard Operating Procedure (SOP) is for the Determination of Lead in TSP by Inductively Coupled Plasma Atomic Emission Spectrometry (ICP-AES) with Heated Ultrasonic Nitric and Hydrochloric Acid Filter Extraction.
NOTE: This SOP is based on USEPA’s Office of Solid Waste (SW-846) Method 6010C – Inductively Coupled Plasma Atomic Emission Spectrometry.3 Wording in certain sections of this SOP are paraphrased or taken directly from Method 6010C.
1.1 Inductively coupled plasma atomic emission spectrometry (ICP-AES) is
applicable for the low µg/L determination of lead in a wide variety of matrices. This procedure describes a method for the acid extraction of lead in particulate matter collected on high-volume, glass fiber, TSP filters and measurement of the extracted lead using ICP-AES.
1.2 Lead has multiple emission wavelengths. Due to the many types of ICP-AES
instruments available it is the responsibility of the analyst to determine which wavelength offers the best signal to noise ration with minimal interferences.
1.3 Use of this method is restricted to use by, or under supervision of, properly
trained and experienced personnel. Requirements include training and experience in inorganic sample preparation including acid extraction and also knowledge in the recognition and in the correction of spectral, chemical and physical interference in ICP-AES. Each analyst must demonstrate the ability to generate acceptable results with this method.
6
2.0 SUMMARY OF METHOD 2.1 This method describes the acid extraction of lead in particulate matter collected
on 8 x 10 inch, glass fiber, ambient air filters using a high-volume TSP sampling device as described in 40 CFR Part 50, Appendix B5 with subsequent measurement of the dissolved lead by ICP-AES. The Method Detection Limit (MDL) (sensitivity) was demonstrated to 0.000687 µg/m3 using Pb-spiked filter strips analyzed in accordance with the guidance provided in 40 CFR Part 136, Appendix B6. The method range was demonstrated from 0.00240 µg/m3 to 0.480 µg/m3 (0.10 to 2 mg/L in solution), based on the low and high calibration curve standards and a nominal filter volume of 2000m3.
2.2 This SOP includes one extraction method. In this method, a solution of nitric and hydrochloric acids is added to the filter samples in plastic tubes and the tubes are placed in a heated ultrasonic bath for one hour to facilitate the extraction of lead. Following ultrasonication, the samples are brought to a final volume of 40mL, vortex mixed or shaken vigorously, and centrifuged prior to aliquots being taken for ICP-AES analysis.
2.3 Calibration standards and check standards are prepared to matrix match the acid composition of the samples. ICP-AES analysis is then performed. With this method, the samples are first aspirated and the aerosol thus created is transported by a flow of argon gas into the plasma torch. The wavelength emitted as the lead goes from the excited state to ground state is measured by a charge injection device (CID), charge-coupled device (CCD), or photomultiplier tube (PMT) detector. Interferences must be assessed and corrected for, if present.
LLCV – Lower Level Calibration Verification, serves as LLICV and LLCCV
RB - Reagent blank
RBS -Reagent blank spike
MSDS – Material Safety Data Sheet
NIST – National Institute of Standards and Technology
D.I. water - Deionized water
RTI – RTI International
SOP – Standard Operating Procedure
SRM – NIST Standard Reference Material
CRM – Certified Reference Material
USEPA – U.S. Environmental Protection Agency
v/v – volume to volume ratio
Batch – The number of samples that can be processed in the ultrasonic bath at one time.
4.0 INTERFERENCES 4.1 Reagents, glassware, plasticware, and other sample processing hardware may
introduce artifacts and/or interferences to sample analysis. If reagent blanks, filter blanks, or quality control blanks yield results above the detection limit the source of contamination must be identified. All containers and reagents used in the processing of the samples must be checked for contamination prior to sample extraction and analysis. Reagents shall be diluted to match the final concentration of the extracts and analyzed for lead. Labware shall be rinsed with 0.38M HNO3/0.84M HCl extraction solution and the solution analyzed. Once a reagent or labware article, such as extraction tubes, from a manufacturer have been successfully screened, additional screening is not required unless contamination is suspected.
4.2 Spectral interferences in ICP-AES are caused by other elements producing the same emission wavelength as the element of interest, background from continuous or recombination phenomena, stray light from emission lines of high concentration elements, and unresolved overlap of molecular band spectra. Each of these possibilities must be examined on each individual instrument being used for analysis.
8
4.2.1 Background emission and stray light can usually be compensated for by subtracting the background emission determined by measurements adjacent to the analyte wavelength peak. Spectral scans of samples or single element solutions in the analyte region may indicate when alternative wavelengths are needed due to spectral interference. Spectral scans will show whether the most appropriate estimate of background emission is provided by an interpolation from measurements on both sides of the analyte peak or by just one side (background correction points). The location(s) used must be free of off-line interelement spectral interference or corrected to reflect the same change in background intensity as the wavelength peak.
4.2.2 The background correction points must be determined by scanning the area adjacent to both sides of the peak to ensure that the areas are free of off-line interelement spectral interference or instrument software that is programmed for automatic corrections must be used. Common elements and those with wavelengths adjacent to the lead peak must be tested at concentrations of at least 100 µg/mL using single element solutions.
4.2.3 Spectral overlaps may be avoided by using alternate wavelengths or can be corrected for by using interelement correction factors (IEC). The IEC can be expressed as analyte concentration equivalents (false positive and false negative concentrations) that occur when analyzing a 100 µg/mL single element solution of the interfering element. IEC corrections, if used, must be calculated for each instrument. The amount of interference and the interfering elements will vary instrument to instrument. Consult Method 6010C, Sections 4.2 for additional guidance.
4.2.4 When IEC factors are used, their accuracy should be verified daily by analyzing spectral interference check solutions. The acceptance criteria range is calculated by multiplying the concentration of the interfering element by the IEC and dividing by ten. If after the subtraction of the calibration blank the apparent analyte concentration is within this range the IEC is acceptable. If the concentration falls outside the range in either a positive or negative direction, a change in the IEC of more than 10% should be suspected and the IEC should be updated. The correction factors tested on a daily basis must meet the 10% criteria for five consecutive days. All IEC factors must be verified and updated every six months or when an instrument change (such as one in the torch, nebulizer, injector, or plasma conditions) occurs.
4.2.5 When IEC factors are not used the absence of interferences must be verified by the use of instrument software to show that no interference
9
occurred at the measured analyte wavelength or by the analysis of an interference check solution on a continuing basis. A commercially available solution, High Purity Standards (www.hps.net) P/N INFCS-7, containing 1000 µg/mL Al, Ca, Fe, Mg, K, and Na prepared at a 5-fold dilution in the same acid matrix as the standards is used to test for interferences at the Pb wavelength on the Thermo iCAP 6500. Follow the specific instrument manufacturer’s recommended practice for other instruments. If the interference check solution confirms an operative interference ≥20% of the analyte concentration, the analyte must be determined using background correction, an alternative wavelength, or by another documented test procedure.
4.3 Physical interferences are associated with the sample nebulization and transport processes. Dissolved solids can deposit on the nebulizer tip of a pneumatic nebulizer and on the injector tip of the torch. Nebulization and transport processes can be affected if a matrix component causes a change in surface tension or viscosity. Changes in matrix composition can cause significant signal suppression or enhancement. These interferences can be compensated for through use of an internal standard. Scandium was used in this method. Sample dilution will reduce the effects of high levels of dissolved salts, but calibration standards must be prepared in the extraction medium and diluted accordingly.
4.4 Chemical interferences include molecular compound formation, ionization effects, and vaporization effects. In most cases these effects are not significant. Steps such as matrix matching standards are already included in this method.
4.5 Memory interferences result when analytes from a previous sample contribute to the measured signal of a new sample. Memory effects can result from deposits in the pump tubing or build up in the spray chamber, nebulizer, and injector. Memory effects can be minimized by flushing the system with an acidified rinse blank between samples. The rinse time can be estimated by aspirating a solution containing ten times the expected concentration for the same amount of time as a sample analysis and then monitoring the time it takes the Pb signal to return to “equal to” or “less than” the lower limit of quantitation. If a memory interference is suspected, the sample must be reanalyzed after a rinse period of sufficient length.
5.0 HEALTH AND SAFETY CAUTIONS 5.1 This method does not address all the possible safety issues associated with its use.
The laboratory is responsible for maintaining a safe work environment and compliance with all OSHA regulations. Material Safety Data Sheets (MSDS) for
all chemicals used should be readily available to all personnel involved with the procedure.
5.2 Concentrated nitric and hydrochloric acids are moderately toxic and extremely irritating to the skin. Use these reagents in a hood, and if eye and skin contact occurs, flush with large volumes of water. Always wear safety glasses or a shield for eye protection when working with these reagents. The component of this procedure requiring the greatest care is nitric acid. Nitric acid is a strong, corrosive, oxidizing agent that requires protection of the eyes, skin, and clothing. Items to be worn during use of this reagent include:
• Safety goggles (or safety glasses with side shields)
• Acid resistant rubber gloves
• A protective garment such as a laboratory apron. Nitric acid spilled on clothing will destroy the fabric and result in a hole; contact with the skin underneath will result in a burn.
It is also essential that an eye wash fountain or eye wash bottle be available during performance of this method. An eye wash bottle has a spout that covers the eye. If acid or any other corrosive gets into the eye, the water in this bottle is squirted onto the eye to wash out the harmful material. Eye washing should be performed with large amounts of water immediately after exposure. Medical help should be sought immediately after washing. If either acid, but especially nitric acid, is spilled onto the skin, wash immediately with large amounts of water. Medical attention is not required unless the burn appears to be significant. Even after washing and drying, the nitric acid may leave the skin slightly brown in color, this will heal and fade with time.
5.3 Lead (Pb) salts and lead solutions are toxic. Great care must be taken to ensure that samples and standards are handled properly; wash hands thoroughly after handling.
5.4 Care must be taken when using the ultrasonic bath as it is capable of causing mild burns. Chemists should refer to the safety guidance provided by the manufacturer of their specific equipment.
6.0 EQUIPMENT AND SUPPLIES 6.1 Apparatus
6.1.1 Thermo Scientific iCAP6500 Inductively Coupled Plasma Atomic Emission Spectrometer (ICP-AES) or equivalent. The system must be
11
capable of analyzing wavelengths from 166 to 840 nanometers. Lead was measure at 220.353nm for analysis in this method.
6.1.2 Heated ultrasonic bath capable of maintaining a temperature of 80°C ± 5°C; VWR Model 750HT, 240W, or equivalent. Ultrasonic bath must meet the following performance criteria:
1. Cut a strip of aluminum foil almost the width of the tank and double the depth.
2. Lower the foil into the operating ultrasonic bath vertically until almost touching the bottom of the tank and hold for 10 seconds.
3. Remove the foil from the tank and observe the distribution of perforations and small pin prick holes. The indentations should be fine and evenly distributed. The even distribution of indentations indicates the ultrasonic bath is acceptable for use.
6.1.3 Laboratory centrifuge, Beckman GS-6, or equivalent.
6.1.4 Vortex mixer, VWR Signature Digital Vortex Mixer, VWR Catalog No. 14005-824, or equivalent.
6.2 Materials and Supplies
• Argon gas supply, 99.99% purity or better. National Welders Microbulk, or equivalent.
• Plastic digestion tubes with threaded caps for extraction and storage, SCP Science DigiTUBE® Item # 010-500-063, or equivalent.
• Pipette, Rainin EDP2, 100 μL, ± 1% accuracy, ≤1 %RSD (precision), with disposable tips, or equivalent.
• Pipette, Rainin EDP2, 1000 μL, ± 1% accuracy, ≤1 %RSD (precision), with disposable tips, or equivalent.
• Pipette, Rainin EDP2, 1-10 mL, ± 1% accuracy, ≤1 %RSD (precision), with disposable tips, or equivalent.
• Pipette, Thermo Lab Systems, 5 mL, ± 1% accuracy, ≤1 %RSD (precision), with disposable tips, or equivalent.
• Plastic tweezers; VWR Catalog No. 89026-420, or equivalent.
• Laboratory marker.
12
• Ceramic knife, Kyocera LK-25, or equivalent.
• Blank labels or labeling tape, VWR Catalog No. 36425-045, or equivalent.
• Graduated cylinder, 1 L, VWR 89000-260, or equivalent.
• Volumetric flask, Class A, 1 L, VWR Catalog No. 89025-778, or equivalent.
• Millipore Element deionized water system, or equivalent, capable of generating Type I water (>17.9 MΩ-cm).
• High purity glass fiber filters for use as blank filters for determination of MDL and laboratory blanks, Whatman EPM2000, or equivalent.
7.0 REAGENTS AND STANDARDS 7.1 Reagent- or trace metals-grade chemicals must be used in all tests. Unless
otherwise indicated, it is intended that all reagents conform to the specifications of the Committee on Analytical Reagents of the American Chemical Society, where such specifications are available.
7.4 Deionized water – All references to deionized water in the method refer to Type I deionized water with a resistivity >17.9 MΩ-cm.
7.5 Extraction solution (1.03M HNO3 + 2.23M HCl). Prepare by adding 500mL of D.I. water to a 1000mL flask, adding 64.4mL of concentrated HNO3 and 182mL of concentrated HCl, shaking to mix, allowing solution to cool, diluting to volume with reagent water, and inverting several times to mix. Extraction solution must be prepared at least weekly.
7.6 Standard stock solutions may be commercially purchased for each element or as a multi-element mix. Internal standards may be purchased as a mixed multi-element solution. Solid reference materials may be purchased from NIST, NRCC, or other commercial vendors. The manufacturer’s expiration date and storage conditions must be adhered to.
7.6.1 Lead standard, 1000 μg/mL, NIST traceable, commercially available with certificate of analysis. High Purity Standards Catalog No. 100028-1, or equivalent.
13
7.6.2 Scandium standard, 1000 μg/mL, NIST traceable, commercially available with certificate of analysis. High Purity Standards Catalog No. 100048-1, or equivalent.
7.6.3 Second source lead standard, 1000 μg/mL, NIST traceable, commercially available with certificate of analysis. Must be from a different vendor or lot than 7.6.1. Inorganic Ventures Catalog No. CGPB-1, or equivalent.
Note: The scandium solution used for preparing the internal standard may also be purchased as 10 µg/mL standard. Calibration standards are prepared by diluting stock standards to the appropriate levels in the same acid concentrations as in the final sample volume (0.38M HNO3 + 0.84M HCl). The typical range for calibration standards is 0.010 to 2.00 µg/mL. At a minimum the curve must contain a blank and five (5) lead containing calibration standards. The calibration standards shall be stored at ambient laboratory temperature. Calibration standards must be prepared weekly and verified against a freshly prepared ICV using a NIST-traceable source different from the calibration standards. Calibration standards may be stored in polypropylene, high density polyethylene, or glass containers.
7.7 Internal standard may be added to the test solution or by on-line addition. The nominal concentration for the internal standard is 0.100 µg/mL (100 ppb). Scandium is a common internal standard for ICP-AES analysis of lead but other internal standards may be used in the event the sample contains scandium and high recoveries are observed.
7.8 Three laboratory blank solutions are required for analysis: (1) the calibration blank is used in the construction of the calibration curve and as a periodic check of system cleanliness (ICB and CCB); (2) the reagent blank (RB) is carried through the extraction process to assess possible contamination; and (3) the rinse blank is run between samples to clean the sample introduction system. If reagent blanks or laboratory blanks yield results above the detection limit, the source of contamination must be identified. Screening of labware and reagents is addressed in Section 4.1.
7.8.1 The calibration blank is prepared in the same acid matrix as the calibration standards (0.38M HNO3 + 0.84M HCl) and samples and contains all internal standards used in the analysis.
7.8.2 The Reagent Blank (RB) contains all reagents used in the extraction and is carried through the extraction procedure at the same time as the samples.
14
7.8.3 The rinse blank is a solution of 1-2% HNO3 (v/v) in reagent grade water. A sufficient volume should be prepared to flush the system between all standards and samples analyzed.
EPA procures filters and distributes them to the state monitoring agencies collecting Pb in support of the National Ambient Air Quality Standard (NAAQS). If filter lot blanks are provided to the laboratory for analysis, consult 40CFR, Appendix G to Part 50, Section 6.1.1 for guidance on testing.
7.9 The Initial Calibration Verification (ICV), Lower Level Calibration Verification (LLCV), and Continuing Calibration Verification (CCV) solutions are prepared from a different lead source than the calibration curve standards and at a concentration that is either at or below the midpoint on the calibration curve, but within the calibration range. Both are prepared in the same acid matrix as the calibration standards. Note that the same solution may be used for both the ICV and CCV. The ICV/CCV and LLCV solutions must be prepared fresh daily.
7.10 Optimization Solution. Prepare an optimization solution according to the instrument manufacturer’s recommendations. This solution will be used to align the optics and optimize operating conditions to achieve the maximum emission counts.
8.0 REFERENCE MATERIALS
A Standard Reference Material (SRM) or certified reference material (CRM) must be extracted with each batch of samples to demonstrate acceptable method performance in the extraction of Pb from solid material. Commonly used SRMs available from NIST (http://www.nist.gov/srm/) include SRM 25837, 25868, 25879 or 164810. CRM is available from commercial vendors such as ERA (http://www.eraqc.com) Catalog #540, Metals in Soil. Follow the vendor instructions supplied with each SRM/CRM regarding minimum aliquot weight, handling, and storage conditions. A blank filter strip is spiked with a solid SRM or CRM combined with a blank filter strip in the extraction tube and carried through the entire extraction process.
9.0 QUALITY CONTROL
9.1 Standard quality control practices shall be employed to assess the validity of the data generated. Included are: Method Detection Limit (MDL), Reporting Limit (RL), Reagent Blank (RB), duplicate samples, spiked samples, serial dilutions, ICV, CCV, LLCV, ICB, CCB, and SRMs/CRMs.
9.2 MDLs must be calculated by analyzing seven replicates of a known low-level spike added to a filter strip and carried through the entire extraction procedure.
The test solutions shall be spiked at 2-5 times the estimated MDL. The MDL is defined as 3.143 times the standard deviation of the seven replicates in accordance with 40 CFR Part 136, appendix B6. The reporting limit, RL, is defined as the lowest calibration standard included in the curve or the LLCV concentration. Results reported below this limit must be clearly marked as estimated. See Method 6010C, Section 10.3.3 for additional guidance.
9.3 For each batch (as defined in Section 3) of samples, one method or reagent blank (RB) and one method or reagent blank spike (RBS) spiked at the same level as the sample spike (see 9.6) must be prepared and carried throughout the entire process. The results of the RB must be below the RL. The recovery for the RBS must be within ± 20% of the expected value. If the reagent blank yields a result above the RL, the source of contamination must be identified and the extraction and analysis repeated. Reagents and labware must be suspected as sources of contamination. Screening of reagents and labware is addressed in Section 4.1.
9.4 Any samples that exceed the highest calibration standard must be diluted and rerun so that the concentration falls within the curve. The minimum dilution will be 1 to 5 with a 0.38M HNO3 and 0.84M HCl solution.
9.5 The internal standard response, if used, must be monitored during the analysis. If the internal standard response falls below 70% or rises above 120% of expected due to possible matrix effects, the sample must be diluted and reanalyzed. The minimum dilution will be 1 to 5 with a 0.38M HNO3 and 0.84M HCl solution. If the first dilution does not correct the problem, additional dilutions must be run until the internal standard falls within the specified range.
9.6 For every batch (as defined in Section 3) of samples prepared, there must be one duplicate and one solution spiked sample prepared. The spike added is to be at a level that falls within the calibration curve, normally the midpoint of the curve. The initial plus duplicate sample must yield an RPD of < 20. The spike must be within ± 20% of the expected value.
9.7 For each batch (as defined in Section 3) of samples, one extract must be diluted five fold and analyzed. The corrected dilution result must be within ±10% of the undiluted result if the sample chosen for the serial dilution has a concentration at or above 10X the lowest standard in the curve. If the serial dilution fails, chemical or physical interference should be suspected.
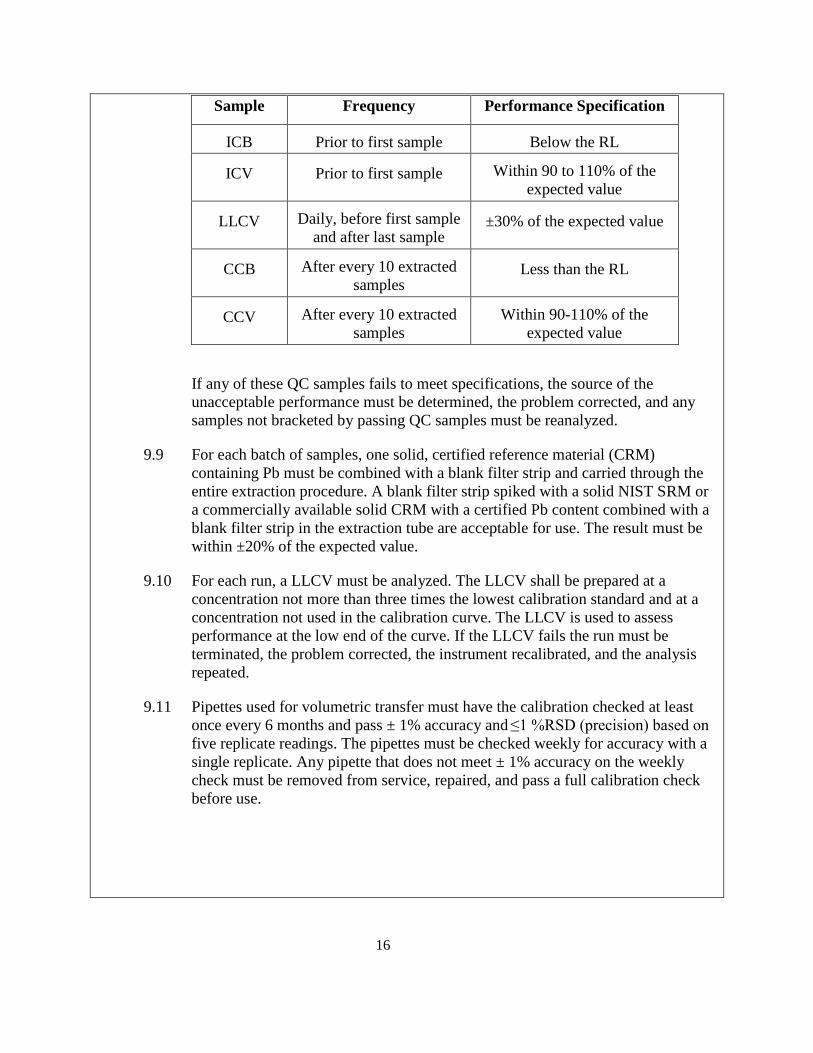
9.8 ICB, ICV, LLCV, CCB and CCV samples are to be run as shown in the following table.
16
Sample Frequency Performance Specification
ICB Prior to first sample Below the RL
ICV Prior to first sample Within 90 to 110% of the expected value
LLCV Daily, before first sample and after last sample
±30% of the expected value
CCB After every 10 extracted samples
Less than the RL
CCV After every 10 extracted samples
Within 90-110% of the expected value
If any of these QC samples fails to meet specifications, the source of the unacceptable performance must be determined, the problem corrected, and any samples not bracketed by passing QC samples must be reanalyzed.
9.9 For each batch of samples, one solid, certified reference material (CRM) containing Pb must be combined with a blank filter strip and carried through the entire extraction procedure. A blank filter strip spiked with a solid NIST SRM or a commercially available solid CRM with a certified Pb content combined with a blank filter strip in the extraction tube are acceptable for use. The result must be within ±20% of the expected value.
9.10 For each run, a LLCV must be analyzed. The LLCV shall be prepared at a concentration not more than three times the lowest calibration standard and at a concentration not used in the calibration curve. The LLCV is used to assess performance at the low end of the curve. If the LLCV fails the run must be terminated, the problem corrected, the instrument recalibrated, and the analysis repeated.
9.11 Pipettes used for volumetric transfer must have the calibration checked at least once every 6 months and pass ± 1% accuracy and ≤1 %RSD (precision) based on five replicate readings. The pipettes must be checked weekly for accuracy with a single replicate. Any pipette that does not meet ± 1% accuracy on the weekly check must be removed from service, repaired, and pass a full calibration check before use.
17
10.0 CALIBRATION
Follow the instrument manufacturer’s instructions for the routine maintenance, cleaning, and ignition procedures for the specific instrument being used.
10.1 Ignite the plasma and wait for at least one half hour for the instrument to warm up before beginning any pre-analysis steps.
10.2 For the Thermo iCAP 6500, aspirate a 2 µg/mL solution of Zn in 0.05% (v/v) MeOH solution per the manufacturer’s specification. Run the instrument optimization procedure to optimize the instrument conditions and align the optics. For other instruments, follow the manufacturer’s recommended practice. Optimize to meet the instrument manufacturer’s specifications. After optimization is complete, place the sample aspiration probe into a 2% HNO3 rinse solution for at least 5 minutes to flush the system.
10.3 Load the calibration standards, 0.010 to 2 mg/L, in the autosampler and analyze using the same method parameters that will be used to analyze samples. The curve must include one blank and at least 5 lead-containing calibration standards. The correlation coefficient must be at least 0.998 for the curve to be accepted. The lowest standard must recover ± 15% of the expected value and the remaining standards must recover ± 10% of the expected value to be accepted.
10.4 Immediately after the calibration curve is completed, analyze an ICV and an ICB. The ICV must be prepared from a different source of lead than the calibration standards. The ICV must recover 90-110 % of the expected value for the run to continue. The ICB must be less than the RL. If either the ICV or the ICB fails, the run must be terminated, the problem identified and corrected, and the analysis re-started.
10.5 A LLCV, CCV and a CCB must be run after the ICV and ICB. A CCV and CCB must be run at a frequency of not less than every 10 extracted samples. The CCV solution is prepared from a different source than the calibration standards and may be the same as the ICV solution. The LLCV must be within ± 30% of expected value. The CCV value must be within ± 10% of expected for the run to continue. The CCB must be less than the RL. If either the CCV, LLCV, or CCB fails, the run must be terminated, the problem identified and corrected, and the analysis re-started from the last passing CCV/LLCV/CCB set.
10.6 A LLCV, CCV, and CCB set must be run at the end of the analysis. The LLCV must be within ± 30% of expected value. If either the CCV, LLCV, or CCB fails, the run must be terminated, the problem identified and corrected, and the analysis re-started from the last passing CCV/LLCV/CCB set.
18
11.0 FILTER STRIP EXTRACTION
All plasticware (e.g., Nalgene) and glassware used in the extraction procedures is soaked in 1% HNO3 for at least 24 hours and rinsed with reagent water prior to use. All mechanical pipettes used must be calibrated to ±1% accuracy and ≤ 1% RSD at a minimum of once every 6 months.
11.1 Sample Preparation – Heated Ultrasonic Bath
11.1.1 Using a ceramic knife and non-metal ruler, cut a 3/4 in. X 8 in. strip from the exposed area of the filter by cutting a strip from the edge of the filter where it has been folded along the 10” side at least 1 in. from the right or left side to avoid the un-sampled area covered by the filter holder. The filters must be carefully handled to avoid dislodging deposits.
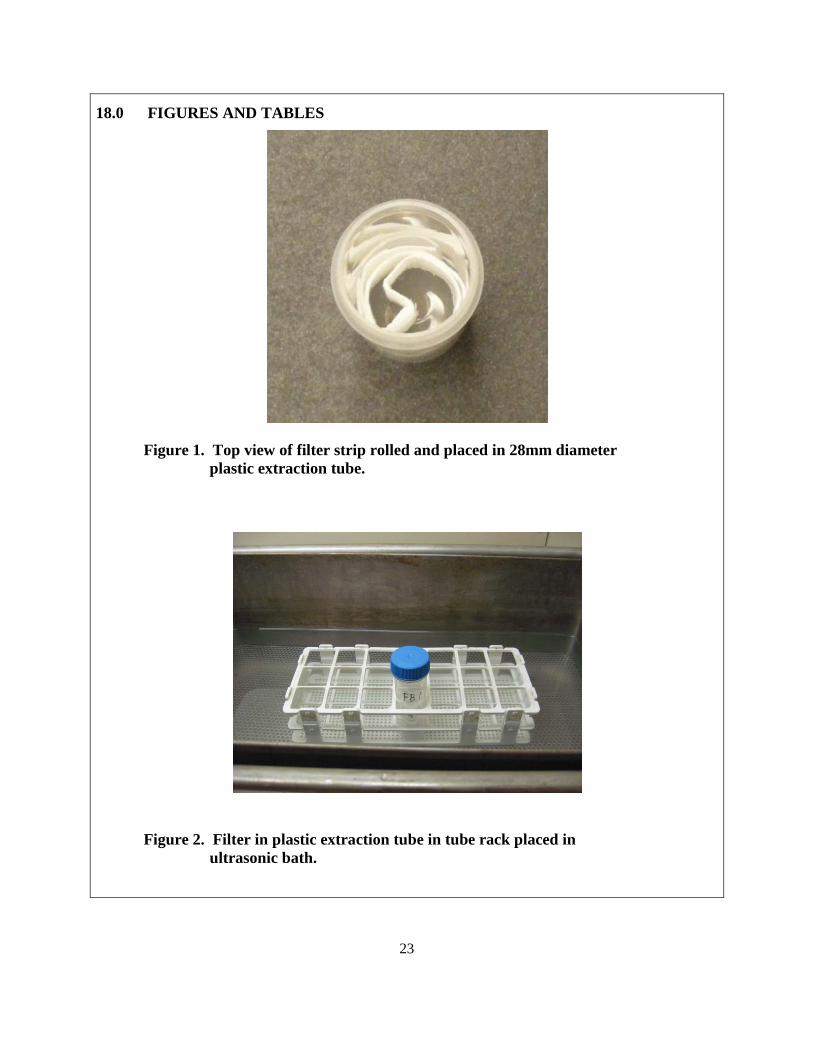
11.1.2 Using plastic tweezers, roll the filter strip up in a coil like a cinnamon bun and place the rolled strip in the bottom of a labeled 50mL extraction tube (See Figure 1). In a fume hood, add 15.0 ± 0.15 mL of the extraction solution (Section 7.5) using a calibrated mechanical pipette. Ensure that the extraction solution completely covers the filter strip.
11.1.3 Loosely cap the 50mL extraction tube and place it upright in a plastic rack (See Figure 2). When all field samples have been prepared, place the racks containing the field samples, RB and RBS (Section 9.3), field duplicates and spikes (Section 9.6), and SRM/CRM (Section 9.9) in an uncovered heated ultrasonic water bath that has been preheated to 80 ± 5°C and ensure that the water level in the ultrasonic is above the level of the extraction solution in the tubes but well below the level of the extraction tube caps to avoid contamination. Start the ultrasonic bath and allow the unit to run for 1 hour ± 5 minutes at 80 ± 5°C.
11.1.4 Remove the rack(s) from the ultrasonic bath and allow the racks of samples to cool.
11.1.5 Add 25.0 ± 0.25 mL of D.I. water with a calibrated mechanical pipette to bring the sample to a final volume of 40.0 ± 0.4 mL. Tightly cap the tubes and vortex mix or shake vigorously. Place the extraction tubes in an appropriate holder and centrifuge for 20 minutes at 2500RPM.
CAUTION- Make sure that the centrifuge holder has a flat bottom to support the flat bottomed extraction tubes.
19
11.1.6 Pour an aliquot of the solution (e.g. 5mL) into an autosampler vial for ICP-AES analysis to avoid the potential for contamination. Do not pipette an aliquot of solution into the autosampler vial.
11.1.7 Decant the extract to a clean extraction tube, cap tightly, and store the sample extract at ambient laboratory temperature. Extracts may be stored for up to six months from the date of extraction.
12.0 MEASUREMENT PROCEDURE
12.1 Follow the instrument manufacturer’s startup procedures for the ICP-AES.
12.2 Set instrument parameters to the appropriate operating conditions as presented in the instrument manufacturer’s operating manual and allow the instrument to warm up for at least 30 minutes.
12.3 Calibrate the instrument per Section 10 of this SOP.
12.4 Optimize the instrument according to Section 10.2 and verify the calibration according to Section 10.3.
12.5 As directed in Section 9 of this SOP, analyze an ICV and ICB immediately after the calibration curve followed by a LLCV, interference check standard, then CCV and CCB. The acceptance requirements for these parameters are presented in Section 9.8.
12.6 Analyze the extracted field samples and QC samples from Section 11.1.3 with a CCV and a CCB after every 10 samples.
12.7 Analyze a LLCV, interference check standard, then CCV and CCB at the end of the analysis.
12.8 Typical run samples will include field samples, field sample duplicates, spiked field sample extracts, serially diluted samples, the set of analytical QC samples listed in 9.8 above, and one or more CRMs/SRMs.
12.9 Any samples that exceed the highest standard in the calibration curve must be diluted and reanalyzed so that the diluted concentration falls within the calibration curve.
13.0 RESULTS
13.1 The filter results must be reported in μg/mL as analyzed. Any additional dilutions done must be accounted for in the instrument software. The internal standard
20
recoveries, if used, must be included in the result calculation; this is done by the ICP-AES software for most commercial instruments. Final results should be reported in µg Pb/m3 to three significant figures using the formula shown in 13.2.
13.2 C = (μg Pb/mL X 40.0mL/strip X A)
Vs
Where:
C = Concentration, μg Pb / m3
µg Pb/mL = Lead concentration in solution
40.0 mL/strip = Total extraction solution volume
A = Area correction = 63.0in2 sampled / 5.25in2 analyzed = 12.0
Vs = Actual volume of air sampled
The calculation assumes the use of a standard 8” X 10” TSP filter which has a sampled area of 9” X 7” (63.0in2) due to the ½” filter holder border around the outer edge. The ¾” X 8” strip has a sampled area of ¾” X 7” (5.25in2). If filter lot blanks are provided for analysis, refer to 40CFR, Appendix G to Part 50, Section 6.1.1 for guidance on testing.
14.0 METHOD PERFORMANCE
Information in this section is an example of typical performance results achieved by following this SOP. Actual performance must be demonstrated by each individual laboratory and instrument.
14.1 Performance data has been collected to determine the method detection limit (MDL) for this method. MDLs were determined for the ultrasonic/ nitric and hydrochloric acid extraction method in accordance with 40 CFR Part 136, Appendix B6. Table 1 shows the MDLs determined from seven reagent/filter blank solutions and seven reagent/filter blank solutions spiked with low level lead at three times the estimated MDL. The MDLs are well below the USEPA requirement of 5% of the current Pb NAAQS or 0.0075 µg/m3.
14.2 Recovery tests with filter strips spiked with NIST SRMs were performed using the ultrasonic/ nitric and hydrochloric acid filter extraction method and measurement of the dissolved lead with ICP-AES. Table 2 shows recoveries with these standard reference materials. The recoveries for the SRMs are > 90% at the 95% confidence level.
21
15.0 POLLUTION PREVENTION
15.1 Pollution prevention encompasses any technique that reduces or eliminates the quantity and/or toxicity of waste at the point of generation. Numerous opportunities for pollution prevention exist in laboratory operation. Whenever feasible, laboratory personnel should use pollution prevention techniques to address their waste generation. The sources of pollution generated with this procedure are waste acid extracts and lead-containing solutions.
15.2 For information about pollution prevention that may be applicable to laboratories and research institutions consult Less is Better: Laboratory Chemical Management for Waste Reduction, available from the American Chemical Society’s Department of Government Relations and Science Policy, 1155 16th St. N.W., Washington, D.C., 20036, www.acs.org.
16.0 WASTE MANAGEMENT
16.1 Laboratory waste management practices must be conducted consistent with all applicable rules and regulations. Laboratories are urged to protect air, water, and land by minimizing all releases from hood and bench operations, complying with the letter and spirit of any sewer and discharge permits and regulations, and by complying with all solid and hazardous waste regulation. For further information on waste management, consult The Waste Management Manual for Laboratory Personnel available from the American Chemical Society listed in Section 15.2.
16.2 Waste nitric acid, hydrochloric acid, and solutions containing these reagents and/or Pb must be placed in labeled bottles and delivered to a commercial firm that specializes in removal of hazardous waste.
17.0 REFERENCES
1 (http://www.thompson.com/public/index.jsp) Last accessed 09/08/09. 2 40 CFR Parts 50, 51, 53, and 58, National Ambient Air Quality Standards for Lead; Final Rule. 3 Method 6010C – Inductively Coupled Plasma – Atomic Emission Spectrometry. U.S.
Environmental Protection Agency. Revision 3, February 2007 4 40 CFR, Part 50, Appendix G - Reference Method for the Determination of Lead in Suspended
Particulate Matter Collected From Ambient Air. 5 40 CFR, Part 50, Appendix B — Reference Method for the Determination of Suspended
Particulate Matter in the Atmosphere (High-Volume Method)
6 40 CFR, Part 136, Appendix B — Definition and Procedure for the Determination of the Method Detection Limit – Revision 1.1
7 NIST, Certificate of Analysis: Standard Reference Materials 2583,Trace Elements in Indoor Dust, Nominal 90 mg/kg Lead, National Institute of Standards and Technology, Gaithersburg, MD, 1998.
8 NIST, Certificate of Analysis: Standard Reference Materials 2586, Trace Elements in Soil. Nominal 500 mg/Kg Lead, National Institute of Standards and Technology, Gaithersburg, MD, 2008.
9 NIST, Certificate of Analysis: Standard Reference Materials 2587, Trace Elements in Soil Containing Lead from Paint, Nominal 3000 mg/Kg Lead, National Institute of Standards and Technology, Gaithersburg, MD, 2008.
10 NIST, Certificate of Analysis: Standard Reference Materials 1648, Urban Particulate Matter, 0.655±0.033% Lead, National Institute of Standards and Technology, Gaithersburg, MD, 2008.
23
18.0 FIGURES AND TABLES
Figure 1. Top view of filter strip rolled and placed in 28mm diameter plastic extraction tube.
Figure 2. Filter in plastic extraction tube in tube rack placed in ultrasonic bath.
24
Table 1 . Method Detection Limits Determined by Analysis of Reagent/Glass Fiber
Filter Blanks and Reagent/Glass Fiber Filter Blanks Spiked with Low-level Pb Solution.