Determination of low levels of polycyclic aromatic hydrocarbons in soil by high performance liquid chromatography with tandem fluorescence and diode-array detectors Yujuan Huang a , Jing Wei a,b , Jing Song a,b,⇑ , Mengfang Chen a,b , Yongming Luo a,b,c a Key Laboratory of Soil Environment and Pollution Remediation, Institute of Soil Science, Chinese Academy of Sciences, Nanjing, Jiangsu 210008, China b Graduate University of Chinese Academy of Sciences, Beijing 100049, China c Yantai Institute of Costal Zone Research, Chinese Academy of Sciences, Yantai, Shandong 264003, China highlights We set up a method for determination of low levels of 16 PAHs in soil. Analyses were performed by HPLC with fluorescence and diode-array detectors. The analytical performance of the proposed method were demonstrated. article info Article history: Received 31 August 2012 Received in revised form 18 March 2013 Accepted 19 March 2013 Available online 6 May 2013 Keywords: HPLC FLD–DAD PAHs Soil abstract Risk assessment of polycyclic aromatic hydrocarbons (PAHs) contaminated soil and source apportion- ment require accurate analysis of the concentration of each PAH congener in the soil. However, determi- nation of low level PAH congeners in soil is difficult because of similarity in the chemical properties of 16 PAHs and severe matrix interferences due to complex composition of soils. It is therefore imperative to develop a sensitive and accurate method for determination of low level PAHs in soil. In this work, high performance liquid chromatography equipped with fluorescence and diode-array detectors (HPLC– FLD–DAD) was used to determine the concentration of 16 PAHs in soil. The separation of the 16 PAHs was achieved by optimization of the mobile phase gradient elution program and FLD wavelength switch- ing program. Qualitative analysis of the 16 PAHs was based on the retention time (RT) and each PAH spe- cific spectrum obtained from DAD. In contrast, the quantitative analysis of individual PAH congeners was based on the peak areas at the specific wavelength with DAD and FLD. Under optimal conditions the detection limit was in the range 1.0–9.5 lgL 1 for 16 PAHs with DAD and 0.01–0.1 lgL 1 for 15 PAHs with FLD, and the RSD of PAHs was less than 5% with DAD and 3% with FLD. The spiked recoveries were in the range 61–96%, with the exception of NaP (<40%). The results show that HPLC–FLD–DAD can pro- vide more accurate and reliable analysis of low level PAH congeners in soil samples. Ó 2013 Elsevier Ltd. All rights reserved. 1. Introduction Polycyclic aromatic hydrocarbons (PAHs) are a class of diverse organic compounds that typically contain two or more fused aro- matic rings. They are ubiquitous environmental pollutants gener- ated primarily during the incomplete combustion of organic materials, in particular fossil fuels such as coal, oil and natural gas, and other hydrocarbons (Lu et al., 2008; Zhang et al., 2011). Due to their carcinogenicity, teratogenicity and mutagenicity (White, 1986), 16 PAHs have been listed by the US Environmen- tal Protection Agency (EPA) as priority pollutants. These are naphthalene, acenaphthene, acenaphthylene, fluorene, phenan- threne, anthracene, fluoranthene, pyrene, benzo[a]anthracne, chrysene, benzo[b]fluoranthene, benzo[k]fluoranthene, benzo[a]- pyrene, dibenz[a,h]anthracene, benzo[g,h,i]perylene and inde- no[1,2,3-cd]pyrene. PAHs may enter the soil via wastewater discharge, dry and wet deposition and oil leaks. It has been shown that soil is one of the main sinks for PAHs in the environment (Wilcke, 2000). PAHs that have accumulated in soils may directly or indirectly pose a risk to human and ecosystem health (Jones, 1991). Risk assessment and 0045-6535/$ - see front matter Ó 2013 Elsevier Ltd. All rights reserved. http://dx.doi.org/10.1016/j.chemosphere.2013.03.035 ⇑ Corresponding author at: Key Laboratory of Soil Environment and Pollution Remediation, Institute of Soil Science, Chinese Academy of Sciences, Nanjing, Jiangsu 210008, China. Tel.: +86 25 86881130; fax: +86 25 86881126. E-mail address: [email protected](J. Song). Chemosphere 92 (2013) 1010–1016 Contents lists available at SciVerse ScienceDirect Chemosphere journal homepage: www.elsevier.com/locate/chemosphere
Transcript
Chemosphere 92 (2013) 1010–1016
Contents lists available at SciVerse ScienceDirect
Determination of low levels of polycyclic aromatic hydrocarbons in soilby high performance liquid chromatography with tandem fluorescenceand diode-array detectors
0045-6535/$ - see front matter � 2013 Elsevier Ltd. All rights reserved.http://dx.doi.org/10.1016/j.chemosphere.2013.03.035
⇑ Corresponding author at: Key Laboratory of Soil Environment and PollutionRemediation, Institute of Soil Science, Chinese Academy of Sciences, Nanjing,Jiangsu 210008, China. Tel.: +86 25 86881130; fax: +86 25 86881126.
Yujuan Huang a, Jing Wei a,b, Jing Song a,b,⇑, Mengfang Chen a,b, Yongming Luo a,b,c
a Key Laboratory of Soil Environment and Pollution Remediation, Institute of Soil Science, Chinese Academy of Sciences, Nanjing, Jiangsu 210008, Chinab Graduate University of Chinese Academy of Sciences, Beijing 100049, Chinac Yantai Institute of Costal Zone Research, Chinese Academy of Sciences, Yantai, Shandong 264003, China
h i g h l i g h t s
�We set up a method for determination of low levels of 16 PAHs in soil.� Analyses were performed by HPLC with fluorescence and diode-array detectors.� The analytical performance of the proposed method were demonstrated.
a r t i c l e i n f o
Article history:Received 31 August 2012Received in revised form 18 March 2013Accepted 19 March 2013Available online 6 May 2013
Keywords:HPLCFLD–DADPAHsSoil
a b s t r a c t
Risk assessment of polycyclic aromatic hydrocarbons (PAHs) contaminated soil and source apportion-ment require accurate analysis of the concentration of each PAH congener in the soil. However, determi-nation of low level PAH congeners in soil is difficult because of similarity in the chemical properties of 16PAHs and severe matrix interferences due to complex composition of soils. It is therefore imperative todevelop a sensitive and accurate method for determination of low level PAHs in soil. In this work, highperformance liquid chromatography equipped with fluorescence and diode-array detectors (HPLC–FLD–DAD) was used to determine the concentration of 16 PAHs in soil. The separation of the 16 PAHswas achieved by optimization of the mobile phase gradient elution program and FLD wavelength switch-ing program. Qualitative analysis of the 16 PAHs was based on the retention time (RT) and each PAH spe-cific spectrum obtained from DAD. In contrast, the quantitative analysis of individual PAH congeners wasbased on the peak areas at the specific wavelength with DAD and FLD. Under optimal conditions thedetection limit was in the range 1.0–9.5 lg L�1 for 16 PAHs with DAD and 0.01–0.1 lg L�1 for 15 PAHswith FLD, and the RSD of PAHs was less than 5% with DAD and 3% with FLD. The spiked recoveries werein the range 61–96%, with the exception of NaP (<40%). The results show that HPLC–FLD–DAD can pro-vide more accurate and reliable analysis of low level PAH congeners in soil samples.
� 2013 Elsevier Ltd. All rights reserved.
1. Introduction
Polycyclic aromatic hydrocarbons (PAHs) are a class of diverseorganic compounds that typically contain two or more fused aro-matic rings. They are ubiquitous environmental pollutants gener-ated primarily during the incomplete combustion of organicmaterials, in particular fossil fuels such as coal, oil and naturalgas, and other hydrocarbons (Lu et al., 2008; Zhang et al., 2011).
Due to their carcinogenicity, teratogenicity and mutagenicity(White, 1986), 16 PAHs have been listed by the US Environmen-tal Protection Agency (EPA) as priority pollutants. These arenaphthalene, acenaphthene, acenaphthylene, fluorene, phenan-threne, anthracene, fluoranthene, pyrene, benzo[a]anthracne,chrysene, benzo[b]fluoranthene, benzo[k]fluoranthene, benzo[a]-pyrene, dibenz[a,h]anthracene, benzo[g,h,i]perylene and inde-no[1,2,3-cd]pyrene.
PAHs may enter the soil via wastewater discharge, dry and wetdeposition and oil leaks. It has been shown that soil is one of themain sinks for PAHs in the environment (Wilcke, 2000). PAHs thathave accumulated in soils may directly or indirectly pose a risk tohuman and ecosystem health (Jones, 1991). Risk assessment and
Y. Huang et al. / Chemosphere 92 (2013) 1010–1016 1011
source apportionment of PAH-contaminated soils require accurateanalysis of the concentration of each PAH component in the soil.Because of similarity in the chemical properties of 16 PAHs andsevere matrix interferences due to complexity of soils, it is imper-ative to develop a sensitive and accurate method for determinationof low level PAHs in soils.
At present the analytical equipment used for the measurementof PAHs in soils mainly comprises gas chromatography (GC)(Kuosmanen et al., 2003; Sikalos and Paleologos, 2005; Zuazagoitiaet al., 2009), gas chromatography–mass spectrometry (GC–MS)(Ma et al., 2005; Ozcan et al., 2009; Ene et al., 2012) and high per-formance liquid chromatography (HPLC) (Chen et al., 2002; Limet al., 2007; Yang et al., 2011). When GC is used for analysis ofPAH components with high boiling points it needs higher temper-atures to vaporize, and this may result in a discrimination effect.Moreover, some PAH isomers such as Phenanthrene and Anthra-cene cannot be easily quantified by GC (Wang et al., 2009).GC–MS equipped with selected ion monitoring (SIM) outperformsGC in PAH isomer separation. However, SIM mode is not useful infurther identification of the compound structure, especially whennon-target PAH components such as benzo[e]pyrene are presentin the sample. In addition, as with GC, GC–MS also needs highertemperatures to vaporize the PAH components with high boilingpoints (Buco et al., 2004). HPLC is suitable for analysis of com-pounds with higher molecular weights and boiling points, andhas therefore been widely used for PAH analysis. HPLC may beequipped with one of three detectors, namely an ultraviolet (UV),fluorescence (FLD) or diode array detector (DAD). FLD has the char-acteristics of high sensitivity, high resolution and low detectionlimits, therefore HPLC–FLD has higher sensitivity for the determi-nation of PAHs exhibiting fluorescent effects. For example, Criadoet al. reported that the sensitivity is 4–20 times higher using FLDcompared with UV (Criado et al., 2004). However, one main draw-back of HPLC–FLD is that the analytes are identified only by theirRT. Identification has to be confirmed when samples are complexand many peaks are detected. This can be achieved by using aDAD, which provides the match with specific UV spectra for PAHcomponents (Bouzige et al., 1999). Kicinski et al. used HPLC con-nected with UV/VIS DAD and FLD to analyze PAHs in drinkingwater and soil. They concluded that DAD is useful for qualitativeand quantitative analysis of PAHs in soil samples and FLD is recom-mended for the analysis of PAHs in water samples (Kicinski et al.,1989). HPLC–DAD/FLD has been successfully applied in the analy-sis of PAHs in sewage sludges (Miègea et al., 2003) and food sup-plements (Danyi et al., 2009). However, the PAHs were detectedat a fixed wavelength of 254 nm with DAD. To our knowledge,there is no report on the use of DAD scanograms to obtain the spe-cific UV spectra of the 16 PAHs for peak identification and peakpurity checks, as well as for quantitative analysis of PAHs at eachspecific UV wavelength.
This present work was aimed at developing a sensitive and reli-able method for detection of low level PAHs in soils. Separation of16 PAHs was achieved by optimizing the mobile phase gradientelution program and the FLD wavelength switching program. Thespecific UV spectra of the 16 PAHs obtained from DAD were usedto confirm the identification of PAH components and to quantita-tively analyze PAHs at each specific UV wavelength.
Analyses were performed using an HPLC system (Shimadzu,Kyoto, Japan) consisting of a LC-20AT binary pump, a DGU-20Aon-line degasser, a SIL-20A autosampler, a CTO-20A column oven,
a RF-20A fluorescence detector, a SPD-M20A diode array detectorand a CBM-20A lite system controller. The data were collectedand analyzed using an LC Solution Chromatogram Workstation(Shimadzu, Kyoto, Japan).
2.2. Reagents
HPLC grade acetonitrile was obtained from Tedia Company Inc.(Fairfield, OH); analytical grade Dichloromethane, n-Hexane,Methanol and Acetone were purchased from Sinopharm ChemicalReagent Co. Ltd. (Shanghai, China); ultra-pure water was prepareddaily with a Milli-Q water purification system (Millipore, Billerica,MA). All other reagents used were of analytical grade quality.
2.3. Standard solution
A standard mixture of the 16 PAHs (100.0 mg L�1) was pur-chased from Dr. Ehrenstorfer GmbH (Augsburg, Germany), com-prising Naphthalene (NaP), Acenaphthylene (AcPy), Acenaphthene(Ace), Fluorene (Flu), Phenanthrene (Phe), Anthracene (AnT), Fluo-ranthene (F1uA), Pyrene (Pyr), Benzo(a)anthracene (BaA), Chrysene(Chry), Benzo(b)fluoranthene (BbF), Benzo(k)fluoranthene (BkF),Benzo(a)pyrene (BaP), Dibenzo(a,h)acenaphthene (DBA), Benzo(a)[ghi]perylene (BghiP), and Indeo[1,2,3-cd] pyrene acenaphthene(In-[1,2,3-cd]P) congener.
A 1.0 mg L�1 mixture of the 16-PAH stock solution was obtainedby diluting the standard solution with acetonitrile, charging intoampoules and then sealing. All stock and standard solutions werestored at 4 �C. All working solutions were prepared immediatelybefore the experiment by diluting the stock solution.
2.4. Soil sample preparation
2.4.1. Sample extraction2.00-g aliquots of dried and homogenized soils sieved through
0.15 mm mesh were extracted in a Soxhlet extraction system with65 mL of mixed n-hexane/acetone solvent (1:1, v/v) for 24 h. Theresulting crude extracts were evaporated to dryness using a Model850 rotary evaporator (Büchi, Flawil, Switzerland) with the waterbath at 40 �C, a pressure of 500 mbar and a rotation rate of
1012 Y. Huang et al. / Chemosphere 92 (2013) 1010–1016
35 rev min�1. The extract was then re-dissolved in 2.0 mLcyclohexane.
2.4.2. Sample purificationThe re-dissolved extracts (0.5 mL) were purified by silica gel
column chromatography. Each extract was loaded onto the columnwhich was eluted with acetone/n-hexane (1:1, v/v). The first1.0 mL of eluate was discarded and then 2.0 mL of eluate werecollected containing PAH components. Each eluate was dried toremove the solvent with a stream of nitrogen at a flow rate of3–4 mL min�1 in a water bath at 40 �C. Then acetonitrile was added
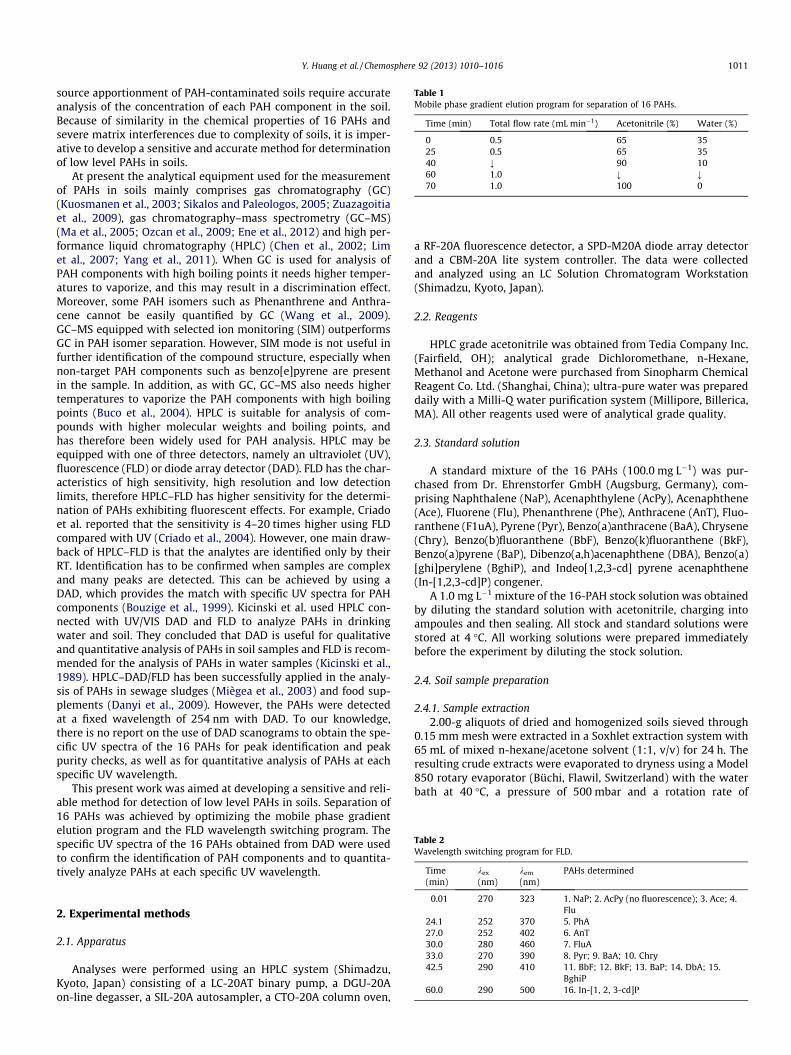
Fig. 1. Specific UV spectra o
to re-dissolve the extracts to give a constant volume of 2.0 mL. Theresulting extracts were analyzed using the HPLC–FLD–DAD system.
2.5. Analytical conditions
Separation of the 16 PAHs was performed with a 4.6 � 250 mmanalytical column (Pursuit 5 PAH, Varian, Middelburg, the Nether-lands) combined with a 3 � 10 mm pre-column (Pursuit PAH) at aconstant temperature of 31 �C. The mobile phases are made of ace-tonitrile and water in different ratios, and the gradient elution pro-gram is featured by changing ratios of acetonitrile and water aswell as total flow rate at specified time (Table 1). Notably, the total
f the 16 PAHs by DAD.
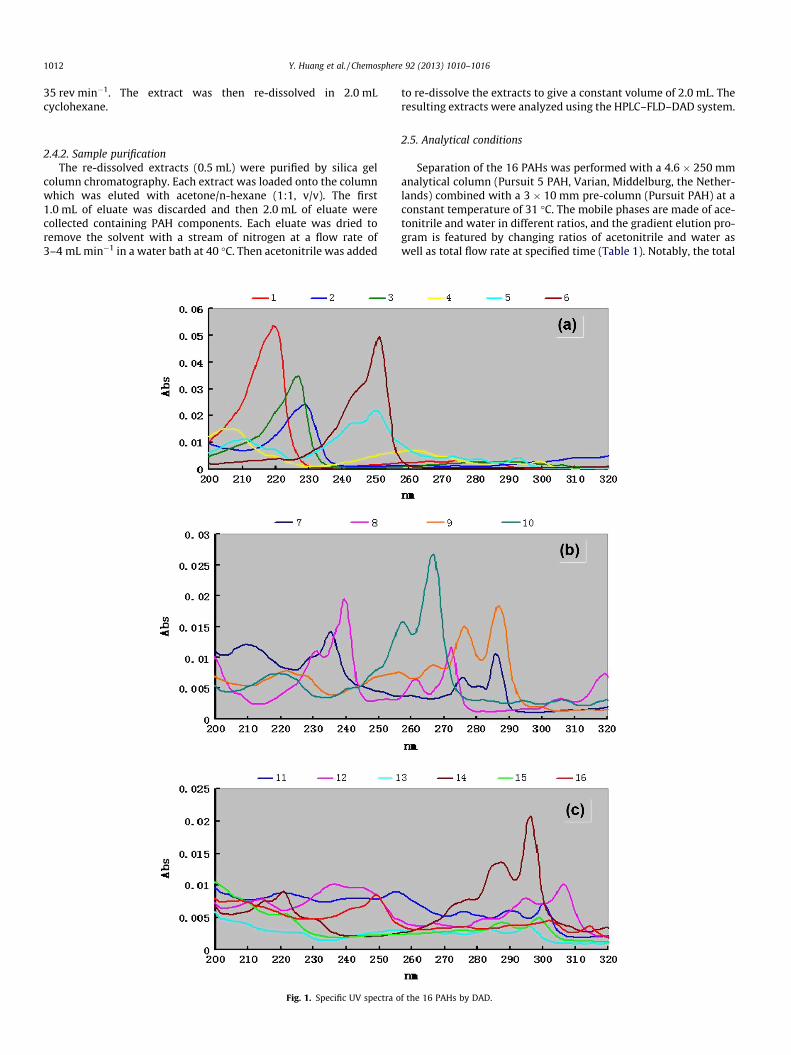
Fig. 2. Chromatograms for determination of the mixture of the 16 PAH standards (200.0 lg L�1): (above) FD; (below) DAD, 1: Nap; 2: AcPy; 3: Ace; 4: Flu; 5: Phe; 6: AnT;7:FluA; 8: Pyr; 9: BaA; 10: Chry; 11: BbF; 12: BkF; 13: Bap; 14: DahA; 15: BghiP; and 16: In[1,2,3-cd]P.
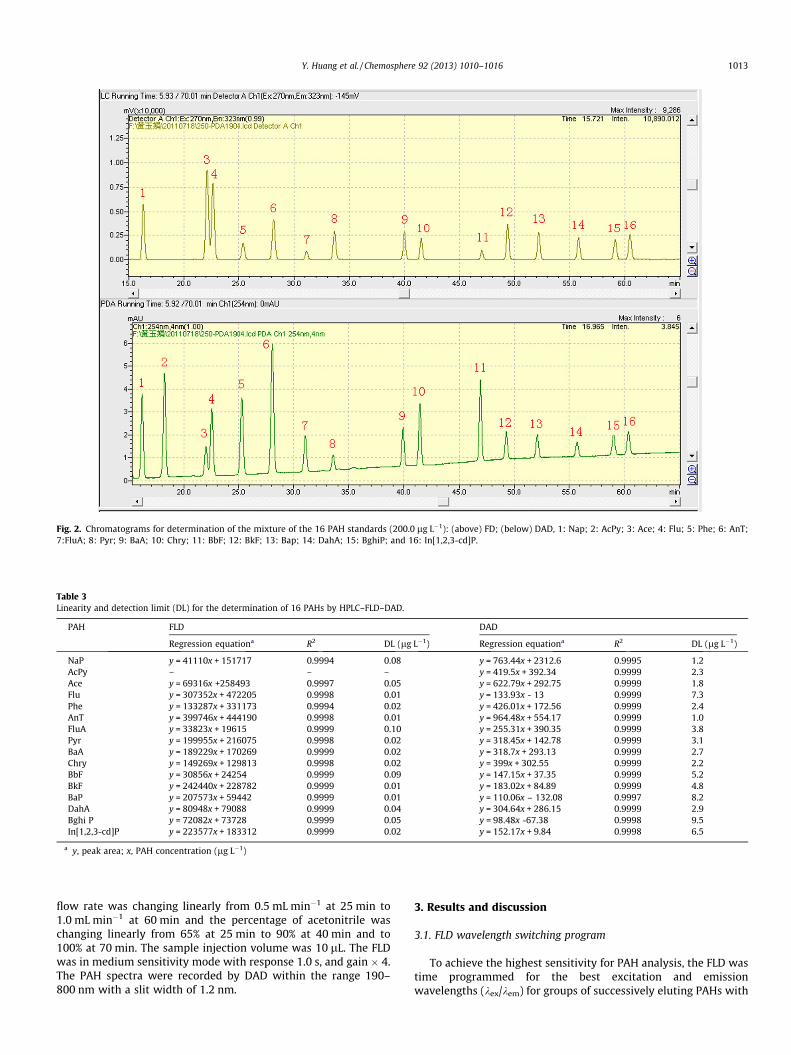
Table 3Linearity and detection limit (DL) for the determination of 16 PAHs by HPLC–FLD–DAD.
NaP y = 41110x + 151717 0.9994 0.08 y = 763.44x + 2312.6 0.9995 1.2AcPy – – – y = 419.5x + 392.34 0.9999 2.3Ace y = 69316x +258493 0.9997 0.05 y = 622.79x + 292.75 0.9999 1.8Flu y = 307352x + 472205 0.9998 0.01 y = 133.93x - 13 0.9999 7.3Phe y = 133287x + 331173 0.9994 0.02 y = 426.01x + 172.56 0.9999 2.4AnT y = 399746x + 444190 0.9998 0.01 y = 964.48x + 554.17 0.9999 1.0FluA y = 33823x + 19615 0.9999 0.10 y = 255.31x + 390.35 0.9999 3.8Pyr y = 199955x + 216075 0.9998 0.02 y = 318.45x + 142.78 0.9999 3.1BaA y = 189229x + 170269 0.9999 0.02 y = 318.7x + 293.13 0.9999 2.7Chry y = 149269x + 129813 0.9998 0.02 y = 399x + 302.55 0.9999 2.2BbF y = 30856x + 24254 0.9999 0.09 y = 147.15x + 37.35 0.9999 5.2BkF y = 242440x + 228782 0.9999 0.01 y = 183.02x + 84.89 0.9999 4.8BaP y = 207573x + 59442 0.9999 0.01 y = 110.06x – 132.08 0.9997 8.2DahA y = 80948x + 79088 0.9999 0.04 y = 304.64x + 286.15 0.9999 2.9Bghi P y = 72082x + 73728 0.9999 0.05 y = 98.48x -67.38 0.9998 9.5In[1,2,3-cd]P y = 223577x + 183312 0.9999 0.02 y = 152.17x + 9.84 0.9998 6.5
a y, peak area; x, PAH concentration (lg L�1)
Y. Huang et al. / Chemosphere 92 (2013) 1010–1016 1013
flow rate was changing linearly from 0.5 mL min�1 at 25 min to1.0 mL min�1 at 60 min and the percentage of acetonitrile waschanging linearly from 65% at 25 min to 90% at 40 min and to100% at 70 min. The sample injection volume was 10 lL. The FLDwas in medium sensitivity mode with response 1.0 s, and gain � 4.The PAH spectra were recorded by DAD within the range 190–800 nm with a slit width of 1.2 nm.
3. Results and discussion
3.1. FLD wavelength switching program
To achieve the highest sensitivity for PAH analysis, the FLD wastime programmed for the best excitation and emissionwavelengths (kex/kem) for groups of successively eluting PAHs with
1014 Y. Huang et al. / Chemosphere 92 (2013) 1010–1016
similar spectroscopic characteristics (Kicinski et al., 1989). At254 nm of the DAD spectrogram, all 16 PAHs had absorption peaksand were completely separated from each other. The time pro-grammed wavelength switching for FLD was established basedon the RT and the kex/kem of the individual PAHs (Table 2). In thistime program the 16 PAH peaks had base line separation and therewas adequate time between the peaks for all the operations whichaccompanied the wavelength switching.
3.2. Selection of quantitative wavelength for DAD
Many PAHs possess very specific UV spectra (Bouzige et al.,1999). Although most PAHs have absorption at 254 nm, this isnot the specific UV wavelength for all PAH components. Only bymeasurement at specific UV wavelength can the highest sensitivityand lowest possible detection limit be achieved. In the presentstudy DAD provided the match with UV spectra for the 16 PAHs
by scanning from 190 to 800 nm (Fig. 1). This shows that theabsorptivity of PAHs varies at different UV wavelengths. For in-stance, at 295 nm (C-14) DahA has a sharp absorbtion peak butPhe shows little or no absorption at this wavelength and has asharp absorption peak at 251 nm (A-5). Selection of the specificUV wavelength as the quantitative wavelength (Table S1, SD) canachieve the highest sensitivity for determination of PAHs. Forexample, the detection limit of AcPy was 2.3 lg L-1 at 229 nm inthis study, which was lower than 30.0 lg L-1 at 254 nm reportedby Rao et al. (Rao et al., 2007) and its lowest detection limit(2.3 lg L�1) at 229 nm in this study.
3.3. Analytical performance
To understand the analytical performance of the proposedmethod, a series of the 16-PAH working solutions with concentra-tions of 0.125, 0.50, 1.25, 5.0, 10.0, 25.0, 50.0, 100.0, 200.0, 400.0 or800.0 lg L�1 were prepared. Under the optimal conditions two
NaPAcP
yAce Flu Phe
AnTFluA Pyr
BaAChyr
BbFBkF BaP
DahABghi P
In[1,2,3
-cd]P
µg/k
g
0
200
400
600
800
1000Reference ValueMeasured with DADMeasured with FLD
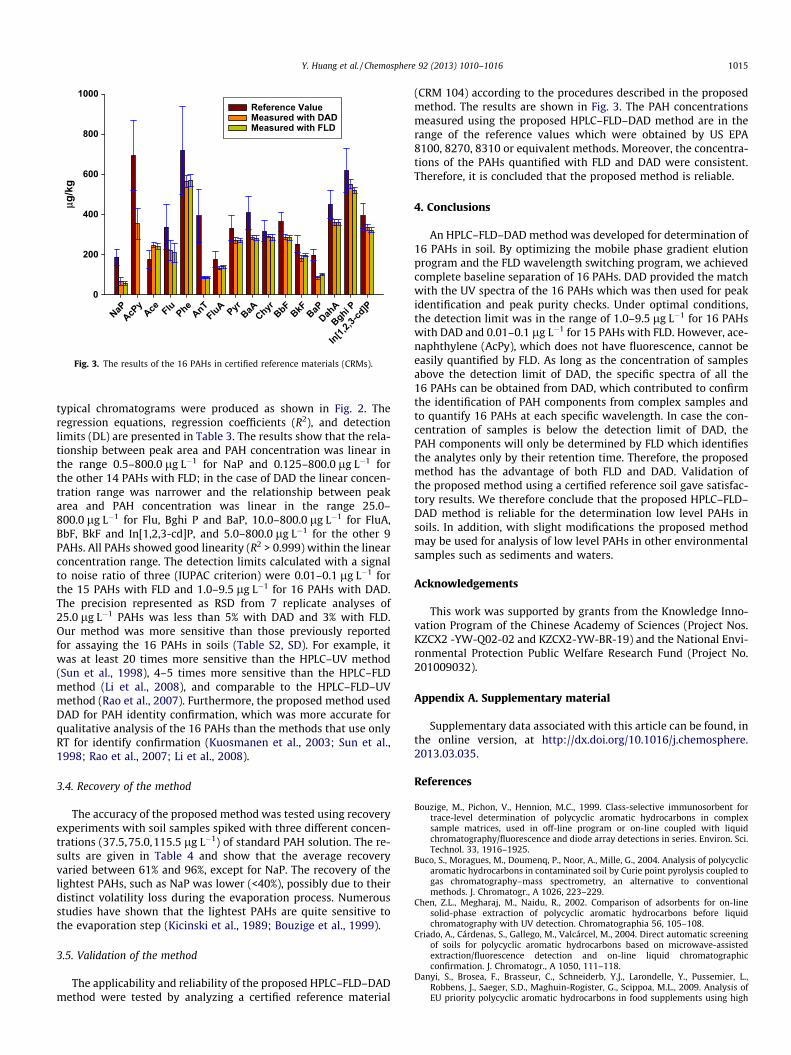
Fig. 3. The results of the 16 PAHs in certified reference materials (CRMs).
Y. Huang et al. / Chemosphere 92 (2013) 1010–1016 1015
typical chromatograms were produced as shown in Fig. 2. Theregression equations, regression coefficients (R2), and detectionlimits (DL) are presented in Table 3. The results show that the rela-tionship between peak area and PAH concentration was linear inthe range 0.5–800.0 lg L�1 for NaP and 0.125–800.0 lg L�1 forthe other 14 PAHs with FLD; in the case of DAD the linear concen-tration range was narrower and the relationship between peakarea and PAH concentration was linear in the range 25.0–800.0 lg L�1 for Flu, Bghi P and BaP, 10.0–800.0 lg L�1 for FluA,BbF, BkF and In[1,2,3-cd]P, and 5.0–800.0 lg L�1 for the other 9PAHs. All PAHs showed good linearity (R2 > 0.999) within the linearconcentration range. The detection limits calculated with a signalto noise ratio of three (IUPAC criterion) were 0.01–0.1 lg L�1 forthe 15 PAHs with FLD and 1.0–9.5 lg L�1 for 16 PAHs with DAD.The precision represented as RSD from 7 replicate analyses of25.0 lg L�1 PAHs was less than 5% with DAD and 3% with FLD.Our method was more sensitive than those previously reportedfor assaying the 16 PAHs in soils (Table S2, SD). For example, itwas at least 20 times more sensitive than the HPLC–UV method(Sun et al., 1998), 4–5 times more sensitive than the HPLC–FLDmethod (Li et al., 2008), and comparable to the HPLC–FLD–UVmethod (Rao et al., 2007). Furthermore, the proposed method usedDAD for PAH identity confirmation, which was more accurate forqualitative analysis of the 16 PAHs than the methods that use onlyRT for identify confirmation (Kuosmanen et al., 2003; Sun et al.,1998; Rao et al., 2007; Li et al., 2008).
3.4. Recovery of the method
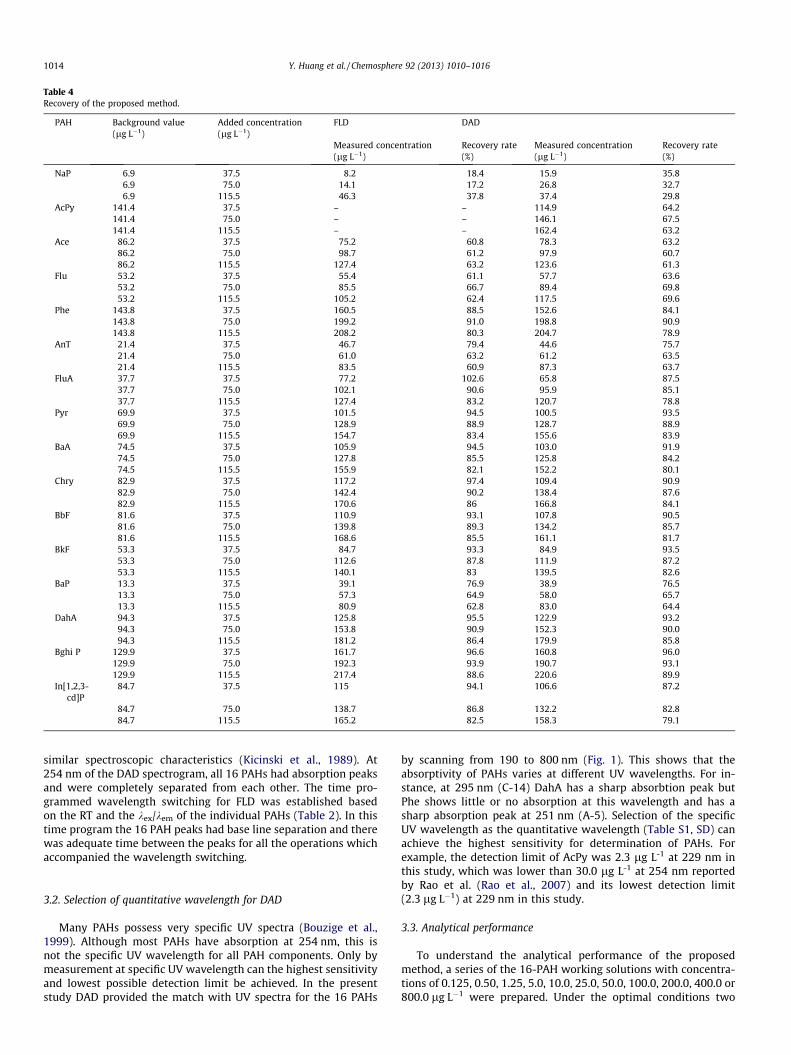
The accuracy of the proposed method was tested using recoveryexperiments with soil samples spiked with three different concen-trations (37.5,75.0,115.5 lg L�1) of standard PAH solution. The re-sults are given in Table 4 and show that the average recoveryvaried between 61% and 96%, except for NaP. The recovery of thelightest PAHs, such as NaP was lower (<40%), possibly due to theirdistinct volatility loss during the evaporation process. Numerousstudies have shown that the lightest PAHs are quite sensitive tothe evaporation step (Kicinski et al., 1989; Bouzige et al., 1999).
3.5. Validation of the method
The applicability and reliability of the proposed HPLC–FLD–DADmethod were tested by analyzing a certified reference material
(CRM 104) according to the procedures described in the proposedmethod. The results are shown in Fig. 3. The PAH concentrationsmeasured using the proposed HPLC–FLD–DAD method are in therange of the reference values which were obtained by US EPA8100, 8270, 8310 or equivalent methods. Moreover, the concentra-tions of the PAHs quantified with FLD and DAD were consistent.Therefore, it is concluded that the proposed method is reliable.
4. Conclusions
An HPLC–FLD–DAD method was developed for determination of16 PAHs in soil. By optimizing the mobile phase gradient elutionprogram and the FLD wavelength switching program, we achievedcomplete baseline separation of 16 PAHs. DAD provided the matchwith the UV spectra of the 16 PAHs which was then used for peakidentification and peak purity checks. Under optimal conditions,the detection limit was in the range of 1.0–9.5 lg L�1 for 16 PAHswith DAD and 0.01–0.1 lg L�1 for 15 PAHs with FLD. However, ace-naphthylene (AcPy), which does not have fluorescence, cannot beeasily quantified by FLD. As long as the concentration of samplesabove the detection limit of DAD, the specific spectra of all the16 PAHs can be obtained from DAD, which contributed to confirmthe identification of PAH components from complex samples andto quantify 16 PAHs at each specific wavelength. In case the con-centration of samples is below the detection limit of DAD, thePAH components will only be determined by FLD which identifiesthe analytes only by their retention time. Therefore, the proposedmethod has the advantage of both FLD and DAD. Validation ofthe proposed method using a certified reference soil gave satisfac-tory results. We therefore conclude that the proposed HPLC–FLD–DAD method is reliable for the determination low level PAHs insoils. In addition, with slight modifications the proposed methodmay be used for analysis of low level PAHs in other environmentalsamples such as sediments and waters.
Acknowledgements
This work was supported by grants from the Knowledge Inno-vation Program of the Chinese Academy of Sciences (Project Nos.KZCX2 -YW-Q02-02 and KZCX2-YW-BR-19) and the National Envi-ronmental Protection Public Welfare Research Fund (Project No.201009032).
Appendix A. Supplementary material
Supplementary data associated with this article can be found, inthe online version, at http://dx.doi.org/10.1016/j.chemosphere.2013.03.035.
References
Bouzige, M., Pichon, V., Hennion, M.C., 1999. Class-selective immunosorbent fortrace-level determination of polycyclic aromatic hydrocarbons in complexsample matrices, used in off-line program or on-line coupled with liquidchromatography/fluorescence and diode array detections in series. Environ. Sci.Technol. 33, 1916–1925.
Buco, S., Moragues, M., Doumenq, P., Noor, A., Mille, G., 2004. Analysis of polycyclicaromatic hydrocarbons in contaminated soil by Curie point pyrolysis coupled togas chromatography–mass spectrometry, an alternative to conventionalmethods. J. Chromatogr., A 1026, 223–229.
Chen, Z.L., Megharaj, M., Naidu, R., 2002. Comparison of adsorbents for on-linesolid-phase extraction of polycyclic aromatic hydrocarbons before liquidchromatography with UV detection. Chromatographia 56, 105–108.
Criado, A., Cárdenas, S., Gallego, M., Valcárcel, M., 2004. Direct automatic screeningof soils for polycyclic aromatic hydrocarbons based on microwave-assistedextraction/fluorescence detection and on-line liquid chromatographicconfirmation. J. Chromatogr., A 1050, 111–118.
1016 Y. Huang et al. / Chemosphere 92 (2013) 1010–1016
performance liquid chromatography coupled to an ultraviolet, diode array orfluorescence detector. Anal. Chim. Acta 633, 293–299.
Ene, A., Bogdevich, O., Sion, A., Spanos, T., 2012. Determination of polycyclicaromatic hydrocarbons by gas chromatography–mass spectrometry in soilsfrom southeastern Romania. Microchem. J. 100, 36–41.
Jones, K.C., 1991. Contaminant trends in soils and crops. Environ. Pollut. 69, 311.Kicinski, H.G., Adamek, S., Kettrup, A., 1989. Trace enrichment and HPLC analysis of
polycyclic aromatic hydrocarbons in environmental samples, using solid phaseextraction in connection with UV/Vis diode-array and fluorescence detection.Chromatographia 28, 203–208.
Kuosmanen, K., Hyötyläinen, T., Hartonen, K., Riekkola, M.L., 2003. Analysis ofpolycyclic aromatic hydrocarbons in soil and sediment with on-line coupledpressurised hot water extraction, hollow fibre microporous membrane liquid–liquid extraction and gas chromatography. Analyst 128, 434–439.
Li, C.F., Wong, J.W.C., Huie, C.W., Choi, M.M.F., 2008. On-line flow injection-cloudpoint preconcentration of polycyclic aromatic hydrocarbons coupled with high-performance liquid chromatography. J. Chromatogr., A 1214, 11–16.
Lim, L.W., Okouchi, Y., Takeuchi, T., 2007. On-Line preconcentration of tracecarcinogenic polycyclic aromatic hydrocarbons (PAHs) in microcolumn liquidchromatography via large volume injection. Talanta 72, 1600–1608.
Lu, H., Zhu, L.Z., Chen, S.G., 2008. Pollution level, phase distribution and health riskof polycyclic aromatic hydrocarbons in indoor air at public places of hangzhou,China. Environ. Pollut. 152, 569–575.
Ma, L.L., Chu, S.G., Wang, X.T., Cheng, H.X., Liu, X.F., Xu, X.B., 2005. Polycyclicaromatic hydrocarbons in the surface soils from outskirts of Beijing, China.Chemosphere 58, 1355–1363.
Miègea, C., Dugay, J., Hennion, M.C., 2003. Optimization, validation and comparisonof various extraction techniques for the trace determination of polycyclicaromatic hydrocarbons in sewage sludge by liquid chromatography coupled todiode-array and fluorescence detection. J. Chromatogr., A 995, 87–97.
Ozcan, S., Tor, A., Aydin, M.E., 2009. Determination of polycyclic aromatichydrocarbons in soil by miniaturized ultrasonic extraction and gaschromatography-mass selective detection. Clean 37, 811–817.
Rao, Z., Li, S., He, M., Su, J., 2007. Determination of 16 polycyclic aromatichydrocarbons in soil by high performance liquid chromatography withfluorescence and ultraviolet detection. Chin. J. Anal. Chem. 35, 954–958.
Sikalos, T.I., Paleologos, E.K., 2005. Cloud point extraction coupled with microwaveor ultrasonic assisted back extraction as a preconcentration step prior to gaschromatography. Anal. Chem. 77, 2544–2549.
Sun, F.S., Littlejohnb, D., Gibson, M.D., 1998. Ultrasonication extraction and solid phaseextraction clean-up for determination of US EPA 16 priority pollutant polycyclicaromatic hydrocarbons in soils by reversed-phase liquid chromatography withultraviolet absorption detection. Anal. Chim. Acta 364, 1–11.
Wang, Y.H., Zhang, J., Ding, Y.C., Zhou, J., Ni, L.X., Sun, C., 2009. Quantitativedetermination of 16 polycyclic aromatic hydrocarbons in soil samples usingsolid-phase microextraction. J. Sep. Sci. 32, 3951–3957.
White, K.L., 1986. An overview of immunotoxicology and carcinogenic polycyclicaromatic-hydrocarbons. J. Environ. Sci. Health 4, 163–202.
Wilcke, W., 2000. Polycyclic aromatichydrocarbons (PAHs) in soil – a review. J. PlantNut. Soil Sci. 163, 229–248.
Yang, F., Long, Y.M., Shen, R., Chen, C.Y., Pan, D., Zhang, Q.L., Cai, Q.Y., Yao, S.Z., 2011.Ultrasonication extraction coupled with magnetic solid-phase clean-up for thedetermination of polycyclic aromatic hydrocarbons in soils by high-performance liquid chromatography. J. Sep. Sci. 34, 716–723.
Zhang, W.H., Wei, C.H., Feng, C.H., Yu, Z., Ren, M., Yan, B., Peng, P.G., Fu, J.M., 2011.Distribution and health-risk of polycyclic aromatic hydrocarbons in soils at acoking plant. J. Environ. Monit. 13, 3429–3436.
Zuazagoitia, D., Millán, E., Garcia-Arrona, R., 2009. Comparison of two extractionmethods for the determination of polycyclic aromatic hydrocarbons in surfacesoils using headspace SPME with GC–FID. J. Chromatogr. Sci. 47, 97–102.