MOHAMMAD YAQOOB et al., J.Chem.Soc.Pak.,Vol. 35, No.2, 2013 533 Determination of Nitrite and Nitrate in Natural Waters Using Flow Injection with Spectrophotometric Detection 1 MOHAMMAD YAQOOB, 1 ABDUL NABI AND 2 PAUL JOHN WORSFOLD 1 Department of Chemistry, University of Balochistan, Quetta, Pakistan. 2 Biogeochemistry Research Centre, Plymouth University, Drake Circus Plymouth PL4 8AA, United Kingdom [email protected]* (Received on 10 th August 2012, accepted in revised form 23 rd October 2012) Summary: A simple and sensitive flow injection spectrophotometric method is reported for the room temperature determination of nitrite and nitrate based on the Griess reaction and a copperised cadmium column for reduction of nitrate. Calibration graphs were linear over the range 2 – 1000 μg N L −1 (R 2 = 0.9997 and 0.9999, n = 9) with a limit of detection (3 s.d.) of 1.0 μg N L −1 and relative standard deviations (n = 10) of 0.9 and 1.2% for 50 μg N L −1 nitrite and nitrate respectively. The sample throughput was 50 h −1 . The effect of reagent concentrations, physical parameters (flow rate, sample volume, reaction coil and copperised cadmium column length) and the potential interferences are reported. The effect of salinity on the blank and on the determination of nitrite and nitrate are also presented. The method was applied to natural waters (rainwater, freshwater and estuarine water) and the results for nitrite + nitrate (140 – 7310 μg N L −1 ) were not significantly different (95% confidence interval) from results obtained using a segmented flow analyser reference method with spectrophotometric detection. Keywords: Nitrite, Nitrate, Natural waters, Spectrophotometry, Flow injection analysis. Introduction Nitrogen species are influential in determining the ecological status and health of natural waters (rivers, lakes, estuaries, coastal seas and the open ocean) due to their impact on eutrophication. As a result there is extensive legislation relating to nitrogen inputs to catchments, e.g. the Urban Wastewater Treatment Directive (91/271) and the Protection of Waters from Nitrates from Agricultural Sources (91/676) Directive in the European Union [1]. This has led to the need for intensive sampling to monitor nitrogen species (particularly nitrate, nitrite and ammonium) in these waters. There are many analytical approaches for the determination of nitrite and nitrate in natural waters [2] but flow based methods are particularly attractive for high throughput analysis [3] and can be readily adapted for field deployment [4-6]. A comprehensive account of the principles of flow analysis, specifically flow injection (FI) and related techniques, and their application to the determination of nutrients in natural waters is given by Gray et al. [7]. Several FI methods with spectrophotometric detection have been reported for the determination nitrite and nitrate in natural waters [8, 9] and the key performance criteria of selected methods [10-15] are summarised in Table-1. Several reducing agents have also been used to facilitate nitrate reduction to nitrite prior to derivatisation, e.g., hydrazine sulfate [16], zinc [17], vanadium(III) [18], cadmium [19], cadmium amalgam [20], copper-coated cadmium [21-23] and titanium(III) chloride [24]. Patton et al. [25] reported an air segmented flow analysis method that used corn leaf nitrate reductase in place of cadmium for the reduction step. This was applied to natural waters and the detection limit for nitrate was 6 μg N L −1 . Nydahl [26] investigated the key variables influencing the efficient reduction of nitrate to nitrite by cadmium and Gal et al. [27] re-examined the cadmium reduction step and the optimisation of conditions for nitrate determination using FI-spectrophotometry. This approach is now an ISO method for the determination of nitrite and nitrate in natural waters [28]. Yaqoob et al. [29] previously reported an FI spectrophotometric method for nitrite and nitrate determination in potable water based on the use of copperised cadmium column. The aim of this study was to develop a simple and sensitive FI method for the determination of nitrite, and nitrate after reduction with copperised cadmium column (40 mm length x 2 mm i.d.), by reaction with sulfanilamide in an acidic medium, coupling with N-(1-naphthyl)- ethylenediaminedihydrochloride (N1NED) and detection at 540 nm. The primary objective was to achieve a low limit of detection (1.0 μg N L −1 ) using an iterative univariate optimisation strategy. The secondary objectives were low reagent consumption / waste generation and a high sample throughput (50 h −1 ). * To whom all correspondence should be addressed.
Transcript
MOHAMMAD YAQOOB et al., J.Chem.Soc.Pak.,Vol. 35, No.2, 2013 533
Determination of Nitrite and Nitrate in Natural Waters Using Flow Injection with Spectrophotometric Detection
1MOHAMMAD YAQOOB, 1ABDUL NABI AND 2PAUL JOHN WORSFOLD
1Department of Chemistry, University of Balochistan, Quetta, Pakistan. 2 Biogeochemistry Research Centre, Plymouth University, Drake Circus
(Received on 10th August 2012, accepted in revised form 23rd October 2012)
Summary: A simple and sensitive flow injection spectrophotometric method is reported for the room temperature determination of nitrite and nitrate based on the Griess reaction and a copperised cadmium column for reduction of nitrate. Calibration graphs were linear over the range 2 – 1000 µg N L−1 (R2 = 0.9997 and 0.9999, n = 9) with a limit of detection (3 s.d.) of 1.0 µg N L−1 and relative standard deviations (n = 10) of 0.9 and 1.2% for 50 µg N L−1 nitrite and nitrate respectively. The sample throughput was 50 h−1. The effect of reagent concentrations, physical parameters (flow rate, sample volume, reaction coil and copperised cadmium column length) and the potential interferences are reported. The effect of salinity on the blank and on the determination of nitrite and nitrate are also presented. The method was applied to natural waters (rainwater, freshwater and estuarine water) and the results for nitrite + nitrate (140 – 7310 µg N L−1) were not significantly different (95% confidence interval) from results obtained using a segmented flow analyser reference method with spectrophotometric detection.
Nitrogen species are influential in determining the ecological status and health of natural waters (rivers, lakes, estuaries, coastal seas and the open ocean) due to their impact on eutrophication. As a result there is extensive legislation relating to nitrogen inputs to catchments, e.g. the Urban Wastewater Treatment Directive (91/271) and the Protection of Waters from Nitrates from Agricultural Sources (91/676) Directive in the European Union [1]. This has led to the need for intensive sampling to monitor nitrogen species (particularly nitrate, nitrite and ammonium) in these waters.
There are many analytical approaches for
the determination of nitrite and nitrate in natural waters [2] but flow based methods are particularly attractive for high throughput analysis [3] and can be readily adapted for field deployment [4-6]. A comprehensive account of the principles of flow analysis, specifically flow injection (FI) and related techniques, and their application to the determination of nutrients in natural waters is given by Gray et al. [7]. Several FI methods with spectrophotometric detection have been reported for the determination nitrite and nitrate in natural waters [8, 9] and the key performance criteria of selected methods [10-15] are summarised in Table-1.
Several reducing agents have also been used
to facilitate nitrate reduction to nitrite prior to derivatisation, e.g., hydrazine sulfate [16], zinc [17],
vanadium(III) [18], cadmium [19], cadmium amalgam [20], copper-coated cadmium [21-23] and titanium(III) chloride [24]. Patton et al. [25] reported an air segmented flow analysis method that used corn leaf nitrate reductase in place of cadmium for the reduction step. This was applied to natural waters and the detection limit for nitrate was 6 µg N L−1. Nydahl [26] investigated the key variables influencing the efficient reduction of nitrate to nitrite by cadmium and Gal et al. [27] re-examined the cadmium reduction step and the optimisation of conditions for nitrate determination using FI-spectrophotometry. This approach is now an ISO method for the determination of nitrite and nitrate in natural waters [28]. Yaqoob et al. [29] previously reported an FI spectrophotometric method for nitrite and nitrate determination in potable water based on the use of copperised cadmium column.
The aim of this study was to develop a
simple and sensitive FI method for the determination of nitrite, and nitrate after reduction with copperised cadmium column (40 mm length x 2 mm i.d.), by reaction with sulfanilamide in an acidic medium, coupling with N-(1-naphthyl)-ethylenediaminedihydrochloride (N1NED) and detection at 540 nm. The primary objective was to achieve a low limit of detection (1.0 µg N L−1) using an iterative univariate optimisation strategy. The secondary objectives were low reagent consumption / waste generation and a high sample throughput (50 h−1).
*To whom all correspondence should be addressed.
MOHAMMAD YAQOOB et al., J.Chem.Soc.Pak.,Vol. 35, No.2, 2013 534
Table-1: Comparison of analytical figures of merit for flow analysis methods with spectrophotometric detection for the determination of nitrate in natural waters.
Technique Matrix Calibration range (µg N L−1 )
LOD (µg N L−1) R2 Samples
(h−1) Reference
FIA Natural water 112 – 5645 22.6 0.999 17 [10] FIA Natural water 22.6 – 1242 2.7 - 35 [11] FIA River waters 0 – 7903 113 0.9999 22 [12] FIA Seawater 0 – 1400 6.3 0.997 45 [13] FIA Marine and estuarine waters 3 − 700 1.3 0.9998 40 [14] SIA Water samples 0 – 11290 165 0.9991 12 [15] FIA Natural waters 2.0 – 1000 1.0(≈0.071 µM) 0.9999 50 This method
Results and Discussion Optimisation of the Flow Injection Manifold
To establish optimum experimental
conditions for the determination of nitrite, the effect of key chemical and physical parameters was investigated using a structured univariate approach. This is easier to implement than a multivariate approach and gives good results if the starting conditions and ranges are based on prior knowledge and the parameters are optimised in sequence and then re-optimised in the same order. The key parameters were sulfanilamide, hydrochloric acid and N1NED concentrations and flow rates, sample injection volume and reaction coil lengths. All of these studies were performed with a nitrite standard solution (500 µg N L−1, 50 µL) and all measurements were made in triplicate. The primary objective was to achieve the maximum response (absorbance) and the secondary objective was to minimise reagent consumption, thereby reducing both the cost and waste generation.
The effect of sulfanilamide concentration
was examined over the range 1x10⁻³ – 6x10⁻² M and the absorbance reached a plateau at 2x10⁻² M. The pH is a key factor for efficient formation of the azo dye and the optimum HCl concentration for the sulfanilamide reagent was 0.25 M, with higher acid concentrations also giving maximum absorbance. The effect of N1NED concentration was examined over the range 1x10⁻⁴ – 8x10⁻³ M and the absorbance reached a plateau at 2x10⁻³ M. Flow rates for all three channels were simultaneously examined over the range 1.0 – 2.5 mL min−1 and this range had minimal impact on maximum absorbance so a flow rate of 1 mL min−1 was used for all channels. Sample volume was then varied over the range 50 – 450 µL and the absorbance maximum increased gradually with
sample volume but a 250 µL volume gave the best shaped peaks. Reaction coil lengths of 25 and 50 cm, for the sulfanilamide and N1NED reactions respectively, gave close to the maximum absorbance (achieved for 100 cm coils) and were used to minimise reagent consumption and provide a good sample throughput.
For the determination of nitrate, the
optimised experimental conditions for nitrite were used, a copperised cadmium reduction column (40 mm length x 2.0 mm i.d.) was incorporated in the manifold and an ammonium chloride carrier solution was used in place of UHP water. A nitrate standard solution (50 µg N L−1, 250 µL) was used and all measurements were made in triplicate. The effect of NH4Cl (0.025 – 0.5 M) and Na2EDTA concentrations (1 – 4x10⁻³ M) was investigated with 0.1 M NH4Cl and 1x10⁻³ M Na2EDTA giving the best response. Imidazole and NH4Cl buffers (0.1 M, pH 7.8) were compared for use as the sample carrier stream and gave the same maximum absorbance and column efficiency; NH4Cl was therefore preferred due to its better long term stability. The role of EDTA is to form a complex with copper on the surface of the cadmium granules in the reduction column to stabilise the copper coating [30]. Without EDTA, copper is lost from the column and cadmium oxide is formed, resulting in a decrease in column efficiency. The effect of column length (20 – 70 mm) on the reduction efficiency was also examined, with 40 mm giving quantitative reduction (92±1%), good reproducibility and low back pressure. Shorter columns gave poorer recoveries and longer columns had excessively high back pressure. The performance characteristics of the optimised manifold for the determination of nitrate compare favourably with previously reported FI methods in terms of reagent concentrations used (Table-2), hence minimising the environmental impact of the generated waste.
MOHAMMAD YAQOOB et al., J.Chem.Soc.Pak.,Vol. 35, No.2, 2013
535
Table-2: Comparison of flow methods for the determination of nitrate in terms of copperised cadmium reduction column dimensions and reduction efficiency, reagent concentrations and N1NED flow rate.
environmentally relevant concentrations was investigated in the separate presence of nitrite and nitrate at 50 µg N L−1. The tolerable concentration of interfering was defined as that giving a relative bias of ≤ ±5%. There was no effect from Fe(II) (2 – 100 fold excess), Ca(II), Mg(II) or CO3
2− (10 – 2000 fold excess), NH4
+ (10 – 1000 fold excess), NO3− (500
fold excess) or SO42− (500 – 6000 fold excess) on the
determination of nitrite or nitrate. Iron(III) and phosphate had no effect on the determination of nitrite but Fe(III) (2 – 100 fold excess) had an enhancing effect on the determination of nitrate while phosphate (at 20 fold excess) had a suppressive effect, as shown in Table-3. These interferences were therefore related to the incorporation of the reduction column. Phosphate is known to strip copper from the surface of the cadmium column, leading to the formation of insoluble cadmium oxide and/or cadmium hydroxide, which results in a decrease in reduction efficiency [31]. The suppressive effect of phosphate was removed by adding Na2EDTA (1x10⁻³ M) to the NH4Cl (0.1 M) carrier stream but the reduction column efficiency remained the same. Iron(III) can be effectively removed by an in-line mini-column containing iminodiacetate chelating resin [32].
The influence of salinity on the peak
absorbance for nitrite (at 50 and 6 µg N L−1) and nitrate (at 50 µg N L−1) was examined in the range 0 – 35 g L−1 by diluting commercially available low nutrient seawater (LNS) with UHP water. When injecting diluted LNS solutions as the blank, a small but characteristic Schlieren peak was observed at salinity 17.5 and above. The effect of salinity on the determination of nitrite was then investigated using 50 and 6 µg N L−1 in a range of LNS/UHP water
matrices. At salinity 35, there was only a 14% increase in peak absorbance for the 50 µg N L−1 standard but near the detection limit, i.e. for the 6 µg N L−1 standard, there was a 100% increase in peak absorbance at 17.5. For highly saline oligotrophic waters, low nutrient seawater (LNS, salinity 35) was therefore used as the sample carrier stream and for the preparation of standards, giving a practical limit of detection of 1.0 µg N L−1. For the determination of nitrate (50 µg N L−1) a copperised cadmium column was inserted in the manifold, and there was a Schlieren effect at salinity >21. Hence sample dilution and/or matrix matching is required for the determination of low nitrate concentrations (<50 µg N L−1) in high salinity waters.
Table-3: Effect of iron(III) and phosphate-P on the determination of nitrite and nitrate 50 µg N L−1(n= 3).
Analytical Figures of Merit
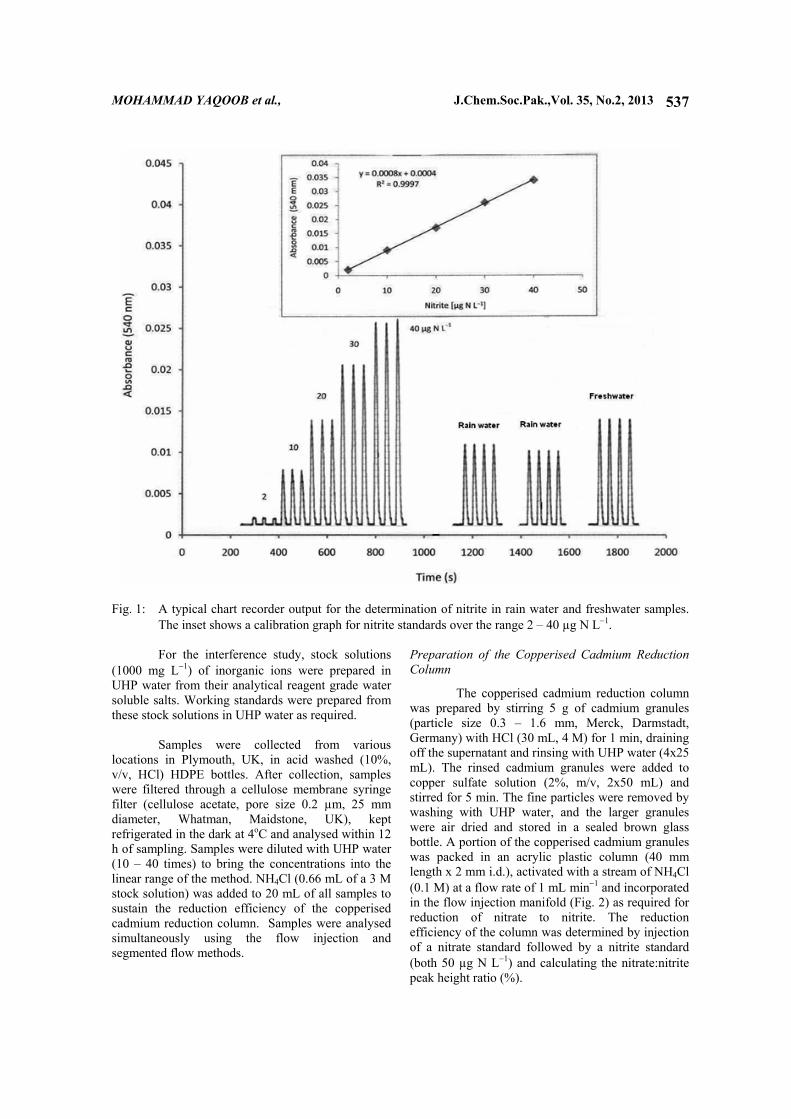
Using the optimised experimental conditions described above, with a UHP water carrier stream, calibration graphs for nitrite and nitrate in UHP water were linear over the range 2 – 1000 µg N L−1 with regression equations of y = 0.8782 [nitrite] + 0.0012 and y = 0.6508 [nitrate] – 0.0017 (where y = absorbance and [ ] = concentration in µg N L−1), coefficients of determination (R2) of 0.9997 and 0.9999 (n = 9) and relative standard deviations for 50 µg N L−1 of 0.9 and 1.2 % (n = 10), respectively. The limit of detection for nitrite and nitrate (3 x blank s.d.) was 1.0 µg N L−1 with a sample throughput of
Peak absorbance ratio of (analyte + interferent) to analyte Inorganic ion Concentration
(µg L−1) Nitrite Nitrate
Iron(III)
100 500 1000 5000
1.02 1.02 1.04 1.06
1.70 5.10 9.60 14.5
Phosphate-P 1000 5000
10000
1.00 1.00 1.00
0.97 0.72 0.64
MOHAMMAD YAQOOB et al., J.Chem.Soc.Pak.,Vol. 35, No.2, 2013
536
50 h−1. Fig. 1 shows a typical chart recorder output for the determination of nitrite in rain and freshwater samples. Application to Natural Waters
Recovery experiments were carried out with
spiked rain water samples using 20, 60 and 100 µg N L−1 spikes for nitrite and 50, 100 and 300 µg N L−1
spikes for nitrate. Recoveries were in the range 97.2±1.0 – 98.7±1.0 for nitrite and 98.2±1.0 – 101±1 for nitrate (n = 3). To determine the accuracy of the method, nine filtered and uv-irradiated freshwater samples from the Tamar catchment, SW England were analysed by the optimised FI nitrate method and a reference segmented flow analyser method operated in an ISO accredited laboratory. The FI method gave results for the nine samples in the range 60 – 322 µg N L−1 and there was no statistical difference between the two methods at the 95% confidence level (tcalc = 0.92; ttab = 2.31). The FI and segmented flow analyser results for a range of natural water samples collected on separate occasions, together with matrix data for key physico-chemical parameters, are given in Table-4 and there was no statistical difference between the two methods at the 99% confidence level (tcalc = 3.00; ttab = 3.50). Experimental Reagents and Solutions
All plastic ware was cleaned in nutrient free
detergent (2%, v/v) (Neutracon, Decon Laboratories, UK), rinsed with ultra high purity (UHP) water (18.2 MΩcm−1, Elgastat, Maxima, UK), soaked overnight in hydrochloric acid (10%, v/v), thoroughly rinsed with UHP water and stored in zip-lock plastic bags to avoid contamination. All of the reagents were of analytical grade, supplied by BDH, Fisher Scientific, UK, unless stated otherwise, and all solutions were prepared in UHP water. Low nutrient seawater (LNS,
salinity 35) was obtained from Ocean Scientific International, Wormley, UK.
Nitrite stock solution (100 mg N L−1) was
prepared by dissolving 0.0493 g of pre-dried sodium nitrite (NaNO2, relative molecular mass (RMM) 68.99) in 100 mL of UHP water and stored in a HDPE bottle at 4oC. Working standards were prepared by suitable dilution with UHP water when required. Nitrate stock solution (100 mg N L−1) was prepared by dissolving 0.0722 g of potassium nitrate (KNO3, RMM 101.1) in 100 mL of UHP water and stored in a HDPE bottle at 4oC. Working standards were prepared in ammonium chloride solution (0.1 M) as required. Sulfanilamide stock solution (0.1 M) was prepared by dissolving 1.722 g of sulfanilamide (RMM 172.21, Sigma) in 100 mL of HCl solution (0.25 M) and sonicating for 10 min and was stored at room temperature. A working sulfanilamide solution (0.02 M) was prepared by diluting 20 mL of the stock solution to 100 mL with HCl (0.25 M). N-(1-naphthyl)-ethylenediaminedihydrochloride (N1NED, Sigma-Aldrich) stock solution (0.01 M) was prepared by dissolving 0.26 g of the compound (RMM 259.18) in 100 mL of UHP water and sonicating for 10 min and was stored at room temperature. A working solution (2x10⁻³ M) was prepared by diluting 20 mL of the stock solution to 100 mL with UHP water. Ammonium chloride stock solution (3.0 M) was prepared by dissolving 16.0 g of ammonium chloride (NH4Cl, RMM 53.49) in 100 mL of UHP water. This stock solution was used for preparing the sample carrier and nitrate working standard solutions by suitable dilution as required. Disodium ethylenediaminetetraacetic acid (Na2EDTA) stock solution (0.1 M) was prepared by dissolving 3.72 g of Na2EDTA.2H2O (RMM 372.18) in 100 mL of UHP water and sonicating for 10 min and stored in the dark at room temperature. A working solution (1x10–
3 M) was prepared by diluting 1.0 mL of the stock to 100 mL with NH4Cl solution (0.1 M)
Table-4: Flow injection-spectrophotometric determination of nitrate + nitrite in rainwater, freshwater and estuarine water samples and comparison with a segmented flow analyser reference method.
Nitrate + Nitrite (µg N L−1) Nitrate + Nitrite (µg N L−1) Rainwater
7.0 7.1
0.086 0.085
0 0
150 140
160 150
Freshwater
7.7 7.8 7.6
0.42 0.42 0.42
0.2 0.2 0.2
7200 7250 7310
7670 7560 7840
Estuarine water 7.8 7.7 7.7
2.0 38.0 45.0
1.0 24.3 29.2
7070 2100 1030
7400 2200 1070
MOHAMMAD YAQOOB et al., J.Chem.Soc.Pak.,Vol. 35, No.2, 2013
537
Fig. 1: A typical chart recorder output for the determination of nitrite in rain water and freshwater samples.
The inset shows a calibration graph for nitrite standards over the range 2 – 40 µg N L−1.
For the interference study, stock solutions (1000 mg L−1) of inorganic ions were prepared in UHP water from their analytical reagent grade water soluble salts. Working standards were prepared from these stock solutions in UHP water as required.
Samples were collected from various
locations in Plymouth, UK, in acid washed (10%, v/v, HCl) HDPE bottles. After collection, samples were filtered through a cellulose membrane syringe filter (cellulose acetate, pore size 0.2 µm, 25 mm diameter, Whatman, Maidstone, UK), kept refrigerated in the dark at 4oC and analysed within 12 h of sampling. Samples were diluted with UHP water (10 – 40 times) to bring the concentrations into the linear range of the method. NH4Cl (0.66 mL of a 3 M stock solution) was added to 20 mL of all samples to sustain the reduction efficiency of the copperised cadmium reduction column. Samples were analysed simultaneously using the flow injection and segmented flow methods.
Preparation of the Copperised Cadmium Reduction Column
The copperised cadmium reduction column was prepared by stirring 5 g of cadmium granules (particle size 0.3 – 1.6 mm, Merck, Darmstadt, Germany) with HCl (30 mL, 4 M) for 1 min, draining off the supernatant and rinsing with UHP water (4x25 mL). The rinsed cadmium granules were added to copper sulfate solution (2%, m/v, 2x50 mL) and stirred for 5 min. The fine particles were removed by washing with UHP water, and the larger granules were air dried and stored in a sealed brown glass bottle. A portion of the copperised cadmium granules was packed in an acrylic plastic column (40 mm length x 2 mm i.d.), activated with a stream of NH4Cl (0.1 M) at a flow rate of 1 mL min−1 and incorporated in the flow injection manifold (Fig. 2) as required for reduction of nitrate to nitrite. The reduction efficiency of the column was determined by injection of a nitrate standard followed by a nitrite standard (both 50 µg N L−1) and calculating the nitrate:nitrite peak height ratio (%).
MOHAMMAD YAQOOB et al., J.Chem.Soc.Pak.,Vol. 35, No.2, 2013
538
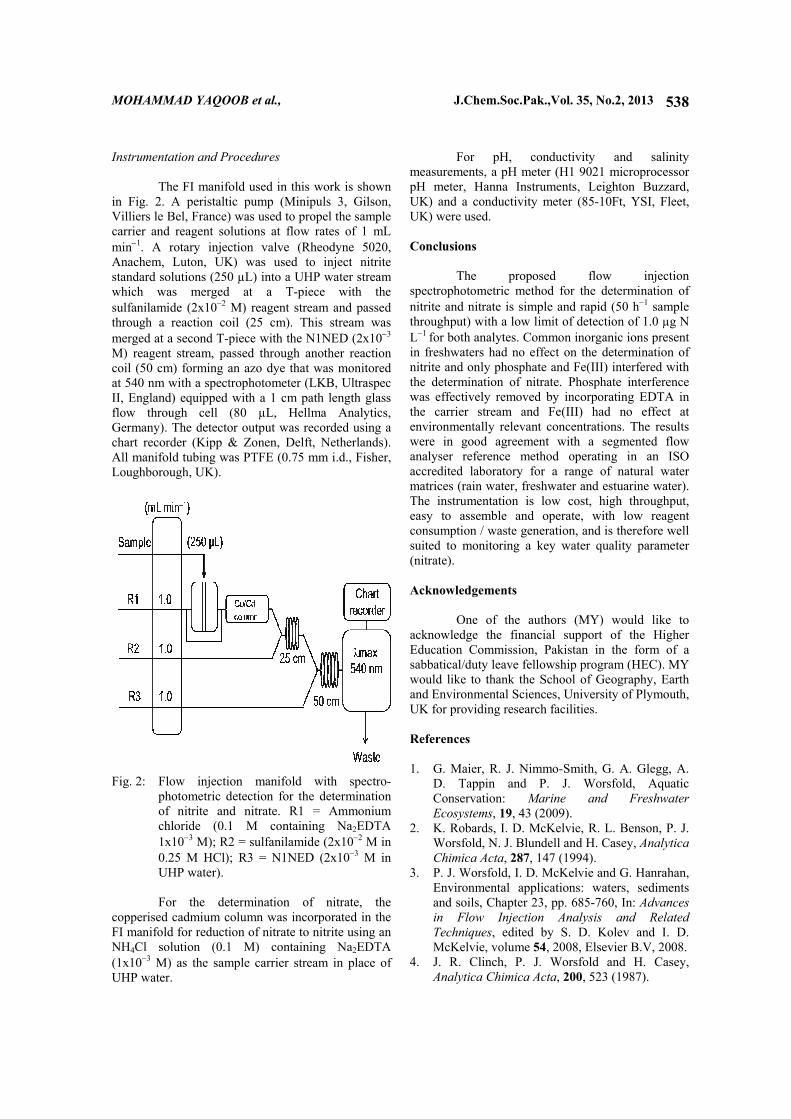
Instrumentation and Procedures The FI manifold used in this work is shown
in Fig. 2. A peristaltic pump (Minipuls 3, Gilson, Villiers le Bel, France) was used to propel the sample carrier and reagent solutions at flow rates of 1 mL min−1. A rotary injection valve (Rheodyne 5020, Anachem, Luton, UK) was used to inject nitrite standard solutions (250 µL) into a UHP water stream which was merged at a T-piece with the sulfanilamide (2x10⁻² M) reagent stream and passed through a reaction coil (25 cm). This stream was merged at a second T-piece with the N1NED (2x10⁻³ M) reagent stream, passed through another reaction coil (50 cm) forming an azo dye that was monitored at 540 nm with a spectrophotometer (LKB, Ultraspec II, England) equipped with a 1 cm path length glass flow through cell (80 µL, Hellma Analytics, Germany). The detector output was recorded using a chart recorder (Kipp & Zonen, Delft, Netherlands). All manifold tubing was PTFE (0.75 mm i.d., Fisher, Loughborough, UK).
Fig. 2: Flow injection manifold with spectro-
photometric detection for the determination of nitrite and nitrate. R1 = Ammonium chloride (0.1 M containing Na2EDTA 1x10⁻³ M); R2 = sulfanilamide (2x10⁻² M in 0.25 M HCl); R3 = N1NED (2x10⁻³ M in UHP water). For the determination of nitrate, the
copperised cadmium column was incorporated in the FI manifold for reduction of nitrate to nitrite using an NH4Cl solution (0.1 M) containing Na2EDTA (1x10⁻³ M) as the sample carrier stream in place of UHP water.
For pH, conductivity and salinity measurements, a pH meter (H1 9021 microprocessor pH meter, Hanna Instruments, Leighton Buzzard, UK) and a conductivity meter (85-10Ft, YSI, Fleet, UK) were used. Conclusions
The proposed flow injection
spectrophotometric method for the determination of nitrite and nitrate is simple and rapid (50 h−1 sample throughput) with a low limit of detection of 1.0 µg N L−1 for both analytes. Common inorganic ions present in freshwaters had no effect on the determination of nitrite and only phosphate and Fe(III) interfered with the determination of nitrate. Phosphate interference was effectively removed by incorporating EDTA in the carrier stream and Fe(III) had no effect at environmentally relevant concentrations. The results were in good agreement with a segmented flow analyser reference method operating in an ISO accredited laboratory for a range of natural water matrices (rain water, freshwater and estuarine water). The instrumentation is low cost, high throughput, easy to assemble and operate, with low reagent consumption / waste generation, and is therefore well suited to monitoring a key water quality parameter (nitrate). Acknowledgements
One of the authors (MY) would like to
acknowledge the financial support of the Higher Education Commission, Pakistan in the form of a sabbatical/duty leave fellowship program (HEC). MY would like to thank the School of Geography, Earth and Environmental Sciences, University of Plymouth, UK for providing research facilities. References 1. G. Maier, R. J. Nimmo-Smith, G. A. Glegg, A.
D. Tappin and P. J. Worsfold, Aquatic Conservation: Marine and Freshwater Ecosystems, 19, 43 (2009).
2. K. Robards, I. D. McKelvie, R. L. Benson, P. J. Worsfold, N. J. Blundell and H. Casey, Analytica Chimica Acta, 287, 147 (1994).
3. P. J. Worsfold, I. D. McKelvie and G. Hanrahan, Environmental applications: waters, sediments and soils, Chapter 23, pp. 685-760, In: Advances in Flow Injection Analysis and Related Techniques, edited by S. D. Kolev and I. D. McKelvie, volume 54, 2008, Elsevier B.V, 2008.
4. J. R. Clinch, P. J. Worsfold and H. Casey, Analytica Chimica Acta, 200, 523 (1987).
MOHAMMAD YAQOOB et al., J.Chem.Soc.Pak.,Vol. 35, No.2, 2013
539
5. H. Casey, R. T. Clarke, S. M. Smith, J. R. Clinch and P. J. Worsfold, Analytica Chimica Acta, 227, 379 (1989).
6. P. C. F. C. Gardolinski, A. R. J. David and P. J. Worsfold, Talanta, 58, 1015 (2002).
7. S. Gray, G. Hanrahan, I. McKelvie, A. Tappin, F. Tse and P. J. Worsfold, Environmental Chemistry, 3, 3 (2006).
8. D. Tsikas, Journal of Chromatography. B 851, 51 (2007).
9. J. Sun, X. Zhang, M. Broderick and H. Fein, Sensors, 3, 276 (2003).
10. W. R. Melchert and F. R. P. Rocha, Talanta, 65, 461 (2005).
11. H. Chen, Y. Fang, T. An, K. Zhu and J. Lu, International Journal of Environmental Analytical Chemistry, 76, 89 (2000).
12. A. Kojło and E. Gorodkiewicz, Analytica Chimica Acta, 302, 283 (1995).
13. A. Daniel, D. Birot, M. Lehaitre and J. Poncin, Analytica Chimica Acta, 308, 413 (1995).
14. P. S. Ellis, A. M. H. Shabani, B. S. Gentle and I. D. McKelvie, Talanta, 84, 98 (2011).
15. P. C. A. G. Pinto, J. L. F. C. Lima and M. L. M. F. S. Saraiva, International Journal of Environmental Analytical Chemistry, 85, 29 (2005).
16. M. T. Oms, A. Cerda and V. Cerda, Analytica Chimica Acta, 315, 321 (1995).
17. T. J. Chow and M. S. Johnstone, Analytica Chimica Acta, 27, 441 (1962).
18. T. A. Doane and W. R. Horwath, Analytical Letters, 36, 2713. (2003)
19. J. H. Margeson, J. C. Suggs and M. R. Midgett, Analytical Chemistry, 52, 1955 (1980).
20. A. W. Morris and J. F. Riley, Analytica Chimica Acta, 29, 272 (1963).
21. C. X. Galhardo and J. C. Masini, Analytica Chimica Acta, 438, 39 (2001).
22. A. Kazemzageh and A. A. Ensafi, Analytica Chimica Acta, 442, 319 (2001).
23. J.-Z. Zhang, C. J. Fischer and P. B. Ortner, International Journal of Environmental Analytical Chemistry, 76, 99 (2000).
24. A. Al-Wahaid and A. Townshend, Analytica Chimica Acta, 186, 289 (1986).
25. C. J. Patton, A. E. Fischer, W. H. Campbell and E. R. Campbell, Environmental Science and Technology, 36, 729 (2002).
26. F. Nydahl, Talanta, 23, 349 (1976). 27. C. Gal, W. Frenzel and J. Moller, Microchimica
Acta, 146, 155 (2004). 28. Water quality - Determination of Nitrite
Nitrogen and Nitrate Nitrogen and the Sum of both by Flow Analysis (CFA and FIA) and Spectrometric Detection. ISO 13395:1996.
29. M. Yaqoob, M. A. Siddiqui and M. Masoom, Journal of the Chemical Society of Pakistan, 13, 249 (1991).
30. T. Taniai, A. Sakuragawa and T. Okutani, Analytical Sciences, 16, 275 (2000).
31. R. A. S. Lapa, J. L. F. C. Lima and I. V. O. S. Pinto, Analytical Sciences, 16, 1157 (2000).
32. M. Yaqoob, A. Nabi and P. J. Worsfold, Analytica Chimica Acta, 510, 213 (2004).
33. C. E. L. Pasquali, P. F. Hernando and J. S. D. Alegria, Analytica Chimica Acta, 600, 177 (2007).
34. M. J. Ahmed, C. D. Stalikes, S. M. T.-Karayanni and M. I. Karayannis, Talanta, 43, 1009 (1996).
35. S. M. Oliveira, T. I. M. S. Lopes and A. O. S. S. Rangel, Communications in Soil Science and Plant Analysis, 38, 533 (2007).