Page 1
Rowan University Rowan University
Rowan Digital Works Rowan Digital Works
Theses and Dissertations
6-22-2016
Determination of non-nuclear alternative to the nuclear density Determination of non-nuclear alternative to the nuclear density
gauge through laboratory and field testing gauge through laboratory and field testing
Janine Abyad Rowan University
Follow this and additional works at: https://rdw.rowan.edu/etd
Part of the Geotechnical Engineering Commons
Recommended Citation Recommended Citation Abyad, Janine, "Determination of non-nuclear alternative to the nuclear density gauge through laboratory and field testing" (2016). Theses and Dissertations. 1703. https://rdw.rowan.edu/etd/1703
This Thesis is brought to you for free and open access by Rowan Digital Works. It has been accepted for inclusion in Theses and Dissertations by an authorized administrator of Rowan Digital Works. For more information, please contact [email protected] .
Page 2
DETERMINATION OF NON-NUCLEAR ALTERNATIVE TO THE NUCLEAR
DENSITY GAUGE THROUGH LABORATORY AND FIELD TESTING
by
Janine Abyad
A Thesis
Submitted to the
Department of Civil Engineering
College of Engineering
In partial fulfillment of the requirement
For the degree of
Master of Science in Civil Engineering
at
Rowan University
September 25, 2015
Thesis Chair: Yusuf Mehta, Ph.D.
Page 3
© 2016 Janine Abyad
Page 4
Dedication
I would like to dedicate this thesis to my dad, family, professors and friends.
Page 5
iv
Acknowledgments
I would like to thank Dr. Yusuf Mehta and Dr. Ayman Ali from Rowan
University, as well as Dr. Manuel Celaya from Advanced Infrastructure Design for their
assistance in my work. I would also like to thank Eileen Sheehy from the New Jersey
Department of Transportation and my thesis committee, including Dr. Huiming Yin from
Columbia University. I would also like to acknowledge the New Jersey Department of
Transportation and the Federal Highway Administration for funding this project. The
contents of the thesis reflect the views of the author, who is responsible for the facts and
accuracy of the data presented within. The contents do not reflect the official views or
policies of the New Jersey Department of Transportation. This thesis does not constitute a
standard, specification, or regulation.
Page 6
v
Abstract
Janine Abyad
DETERMINATION OF NON-NUCLEAR ALTERNATIVE TO THE NUCLEAR
DENSITY GAUGE THROUGH LABORATORY AND FIELD TESTING
2015-2016
Yusuf Mehta, Ph.D.
Master of Science in Civil Engineering
Pavement performance is dependent on the compaction quality of unbound subgrade and
base/subbase layers beneath flexible pavements. Pavement distresses can be linked to
compaction defects within these layers. In current practice, the New Jersey Department of
Transportation (NJDOT) utilizes the nuclear density gauge (NDG) for evaluating
compaction quality based on minimum density requirements, typically 95% of the
Proctor maximum dry density (MDD). However, there are concerns with using the NDG.
The goal of this study was to replace the NDG with non-nuclear alternative method(s) as
acceptance tools during field compaction. To achieve this, a laboratory procedure for
compacting large samples was developed to facilitate testing using the Briaud
compaction device (BCD), light weight falling deflectometer (LWD), and dynamic cone
penetrometer (DCP) on two subgrade soils, dense graded aggregate (DGA), and recycled
concrete aggregate (RCA). Each device was evaluated for their sensitivity to moisture,
compaction effort, aggregate type, and time. A multiple linear regression model to predict
DCP field measurements was developed and calibrated using field data to determine the
minimum recommended DCP values that would ensure adequate field compaction. Using
the proposed acceptance criteria, a draft specification was developed. It was concluded
that the DCP is an adequate tool to replace the NDG and highly dependent on aggregate
moisture content and gradation characteristics (%passing sieves No. 4 and No. 200).
Page 7
vi
Table of Contents
Abstract ................................................................................................................................ v
Chapter 1: Introduction ...................................................................................................... 13
1.1 Problem Statement ................................................................................................. 13
1.2 Study Objectives .................................................................................................... 15
1.3 Thesis Organization ............................................................................................... 15
Chapter 2: Review of Literature ........................................................................................ 17
2.1 Introduction ............................................................................................................ 17
2.2 Modulus-Based Method for Compaction Quality Control .................................... 17
2.2.1 Compaction of Large Aggregate Samples for Modulus-Based
Laboratory Testing ........................................................................................ 19
2.2.2 Effect of Different Measured Parameters on Modulus-Based
Devices/Methods .......................................................................................... 22
2.2.3 Correlation between Representative Laboratory and Field Moduli .............. 28
2.3 Development of Modulus-Based Construction Specifications .............................. 30
2.4 Summary ................................................................................................................ 33
Chapter 3: Basis for Selecting Devices for Evaluation ...................................................... 35
3.1 Introduction ............................................................................................................ 35
3.2 Ranking of Selected Devices ................................................................................. 35
3.2.1 Past Experiences with Alternative Devices .................................................. 36
3.2.2 Alternative Devices Repeatability and Time Needed for Measurements ..... 41
3.2.3 Data Processing and Interpretation Requirements for Alternative
Devices ......................................................................................................... 45
Page 8
vii
Table of Contents (Continued)
3.2.4 Sensitivity of Alternative Devices to Environmental Factors, Accuracy
and Ease of Use ............................................................................................ 48
3.2.5 Cost of Utilizing Alternative Devices ........................................................... 52
3.2.6 Alternative Devices Ability to Account for Lower Layer Properties ........... 53
3.2.7 Alternative Devices Ability to Correlate Representative Laboratory and
Field Moduli ................................................................................................. 56
3.2.8 Alternative Devices Ability to Account for Field Moisture and Density
Variability ..................................................................................................... 59
3.2.9 Sensitivity of Alternative Devices to Various Levels of Compaction .......... 62
3.2.10 Overall Ranking of Alternative Devices ..................................................... 64
3.3 Survey of State DOTs, Contractors and Manufacturers ........................................ 66
3.4 Description of Selected Devices ............................................................................ 72
3.4.1 Briaud Compaction Device (BCD) ............................................................... 72
3.4.2 Light Weight Falling Deflectometer (LWD) ................................................ 74
3.4.3 Dynamic Cone Penetrometer (DCP) ............................................................. 76
Chapter 4: Materials Description ....................................................................................... 78
4.1 Introduction ............................................................................................................ 78
4.2 Material Properties ................................................................................................. 78
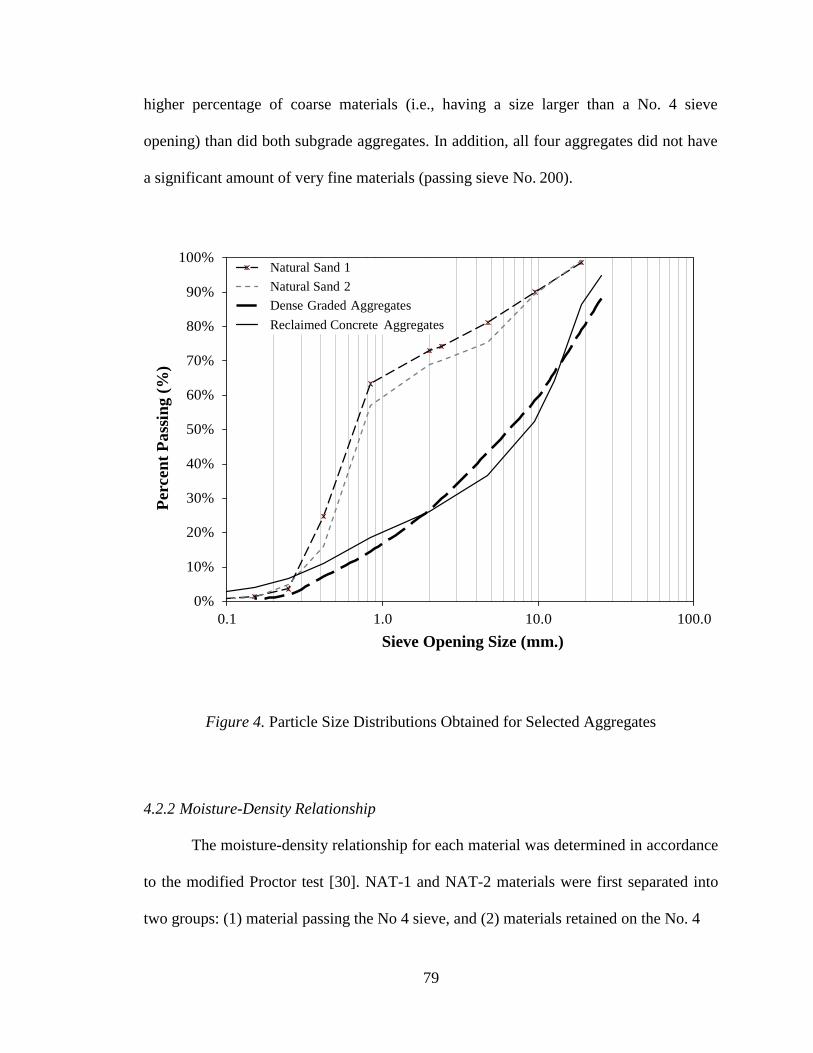
4.2.1 Gradation....................................................................................................... 78
4.2.2 Moisture-Density Relationship ..................................................................... 79
Chapter 5: Laboratory Sample Preparation & Testing Methodology ................................ 82
5.1 Introduction ............................................................................................................ 82
5.2 Laboratory Sample Preparation Procedure ............................................................ 82
5.2.1 Drying of Selected Aggregates ..................................................................... 83
Page 9
viii
Table of Contents (Continued)
5.2.2 Determined Moisture Content of Aggregates ............................................... 83
5.2.3 Mixing and Placement of Aggregates ........................................................... 84
5.2.4 Compaction of Aggregates............................................................................ 85
5.2.5 Verified Compaction Quality ........................................................................ 86
5.3 Laboratory Testing Plan ......................................................................................... 89
5.3.1 Effect of Moisture Content ........................................................................... 89
5.3.2 Effect of Compaction Effort ......................................................................... 89
5.4 Field Testing Plan .................................................................................................. 91
5.4.1 Selected Field Sections ................................................................................. 91
Chapter 6: Analysis of Laboratory Testing Results ........................................................... 92
6.1 Introduction ............................................................................................................ 92
6.2 Effect of Moisture Content .................................................................................... 92
6.3 Effect of Compaction Effort .................................................................................. 98
6.4 Effect of Testing Time on Accuracy and Repeatability of Selected Devices ...... 103
6.5 Precision of Measurements .................................................................................. 109
6.4 Summary of Findings ........................................................................................... 111
Chapter 7: Development of DCP Multiple Linear Regression Model ............................. 113
7.1 Introduction .......................................................................................................... 113
7.2 Separation of Collected Laboratory Data ............................................................. 113
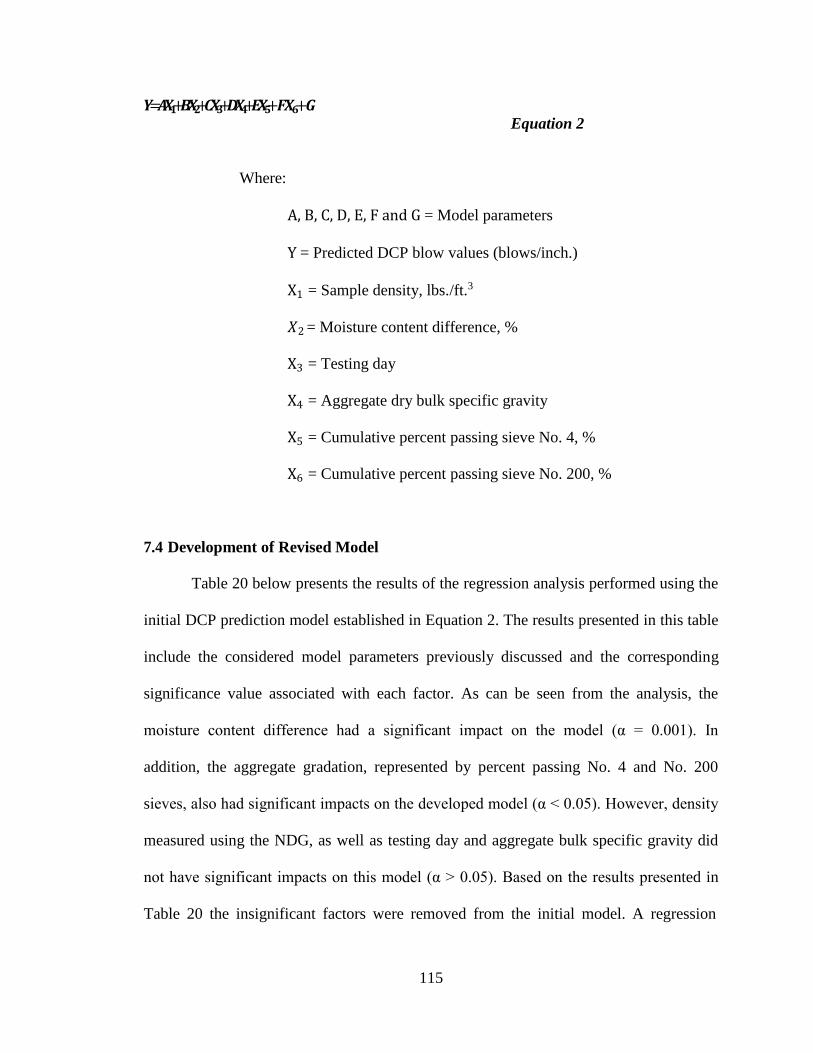
7.3 Model Formulation .............................................................................................. 114
7.4 Development of Revised Model .......................................................................... 115
7.5 Attempts to Improve Final Prediction Model ...................................................... 119
Page 10
ix
Table of Contents (Continued)
7.6 Final Model Validation ........................................................................................ 127
7.7 Calibration of Final Prediction Model Using Field Data ..................................... 131
7.8 Recommended Minimum DCP Acceptance Criteria ........................................... 134
Chapter 8: Development of DCP Draft Specification ...................................................... 138
8.1 Introduction .......................................................................................................... 138
8.2 Previously Developed DCP Specifications .......................................................... 138
8.2.1 Minnesota Department of Transportation (MnDOT) .................................. 138
8.2.2 Missouri Department of Transportation (MoDOT) .................................... 141
8.2.3 Indiana Department of Transportation (INDOT) ........................................ 142
8.2.4 NCHRP Project 10-84................................................................................. 144
8.3 Development of DCP Draft Specification ........................................................... 146
8.3.1 Device and Materials .................................................................................. 147
8.3.2 DCP Test Procedure .................................................................................... 148
8.3.3 Acceptance Criteria ..................................................................................... 149
8.3.4 Document Results ....................................................................................... 152
Chapter 9: Conclusions and Recommendations............................................................... 153
9.1 Conclusions .......................................................................................................... 153
9.2 Recommendations ................................................................................................ 157
Appendix A: Survey of Alternative Devices ................................................................... 164
Appendix B: Compaction Quality Control of Unbound Subgrade and Base/Subbase
Layers Through Use of the Dynamic Cone Penetrometer .......................... 183
Page 11
x
List of Figures
Figure Page
Figure 1. Initial BCD with Corresponding Plan View of Plate .......................................... 74
Figure 2. Final Prototype of BCD ...................................................................................... 74
Figure 3. Schematic of the DCP ........................................................................................ 77
Figure 4. Particle Size Distributions Obtained for Selected Aggregates ........................... 79
Figure 5. Moisture-Density Relationships for Selected Aggregates .................................. 81
Figure 6. Equipment Used for Sample Preparation; .......................................................... 88
Figure 7. Effect of Moisture Content on Testing Results; (a) NDG Results, (b) BCD
Results, (c) LWD Results; and (d) DCP Results ................................................ 97
Figure 8. Effect of Compaction Effort on Testing Results; (a) NDG Results, (b) BCD
Results, (c) LWD Results; and (d) DCP Results .............................................. 102
Figure 9. Effect of Delayed Testing on Testing Results; (a) NDG Results, (b) BCD
Results, (c) LWD Results; and (d) DCP Results .............................................. 108
Figure 10. Verification of DCP Prediction Model; (a) Predicted vs. Measured DCP
Values; and (b) Distribution of Relative Error Values ................................... 130
Figure 11. Computational Procedure Utilized for Computing NAT-1 Aggregates
Field Correction Factor ................................................................................... 133
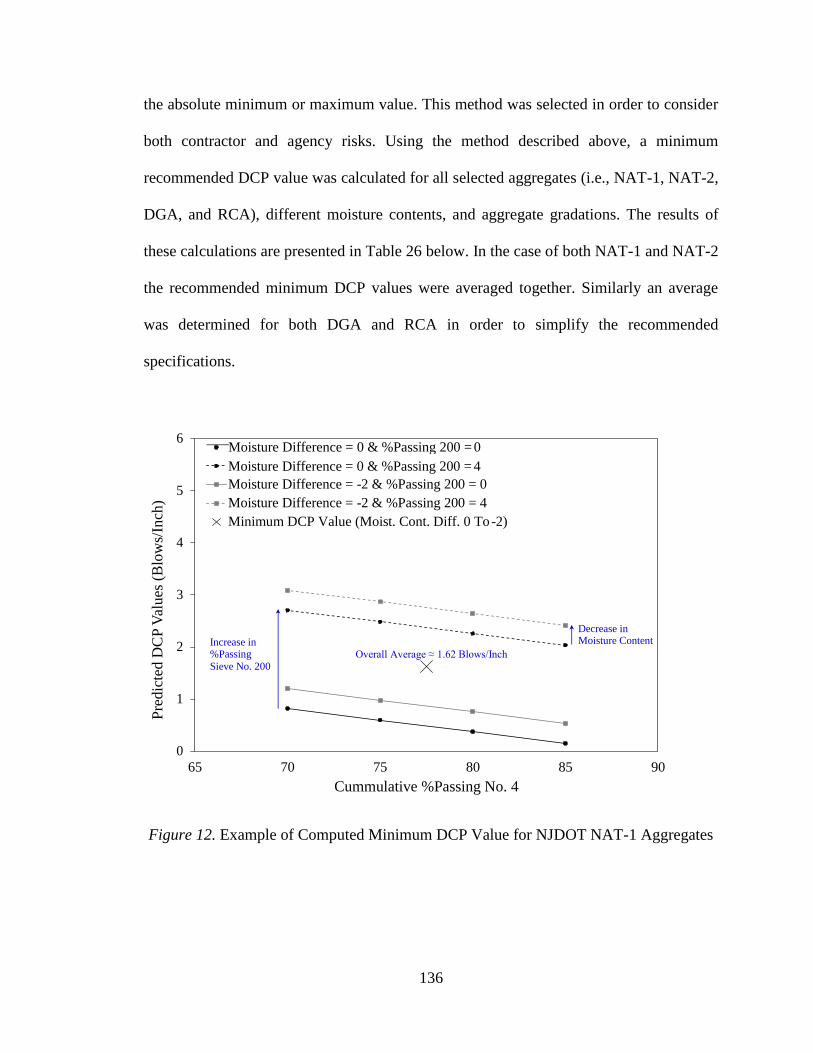
Figure 12. Example of Computed Minimum DCP Value for NJDOT NAT-1
Aggregates ...................................................................................................... 136
Figure 13. InDOT DCP Acceptance Criteria Based on MDD and OMC of Soil ............ 144
Page 12
xi
List of Tables
Table Page
Table 1. Past Experiences with Alternative Devices ......................................................... 41
Table 2. Alternative Devices Repeatability and Time Needed for Measurements ............ 45
Table 3. Data Processing and Interpretation Requirements for Alternative Devices ........ 48
Table 4. Sensitivity of Alternative Devices to Environmental Factors, ............................. 52
Table 5. Cost of Utilizing Alternative Devices .................................................................. 53
Table 6. Alternative Devices Ability to Account for Lower Layer Properties .................. 56
Table 7. Alternative Devices Ability to Correlate Representative Laboratory and
Field Moduli......................................................................................................... 59
Table 8. Alternative Devices Ability to Account for Field Moisture and Density
Variability ............................................................................................................ 62
Table 9. Sensitivity of Alternative Devices to Various Levels of Compaction ................. 64
Table 10. Evaluation of Alternative Devices Based on all Criteria ................................... 65
Table 11. Evaluation of Alternative Devices Based on Non-Cost Criteria ....................... 66
Table 12. Surveyor Ranking of Alternative Device Attributes .......................................... 69
Table 13. Surveyor Opinions on the GeoGauge ................................................................ 70
Table 14. Surveyor Opinions on the DCP ......................................................................... 70
Table 15. Overall Surveyor Ranking of Alternative Devices ............................................ 71
Table 16. Surveyor Opinions on Transitioning .................................................................. 72
Table 17. Target Moisture and Density Values Utilized ................................................... 90
Table 18. Effect of Testing Time on NDG Moisture Content ......................................... 107
Table 19. Standard Error of the Mean of the Results Measured from all Devices
(Expressed as a Percent of the Mean Value) ................................................... 110
Page 13
xii
Table 20. Initial and Revised DCP Prediction Models .................................................... 118
Table 21. Actual Measured Moisture Content of Prepared Samples ............................... 120
Table 21. Prediction Model Using 80% of Data .............................................................. 122
Table 22. Prediction Model Using 70% of Data .............................................................. 124
Table 23. Prediction Model Using NAT-1 & NAT-2 Data ............................................. 126
Table 24. Prediction Model Using DGA & RCA Data ................................................... 127
Table 25. Recommended Minimum DCP Values for Ensuring Satisfactory Field
Compaction ...................................................................................................... 137
Table 26. MnDOT Maximum Seat and DPI Values [32] ................................................ 141
Table 27. InDOT Minimum Required DCP Values [33] ................................................. 143
Table 28. NCHRP Material Gradation Requirements [16] .............................................. 145
Table 29. NCHRP Moisture Content Requirements [16] ................................................ 145
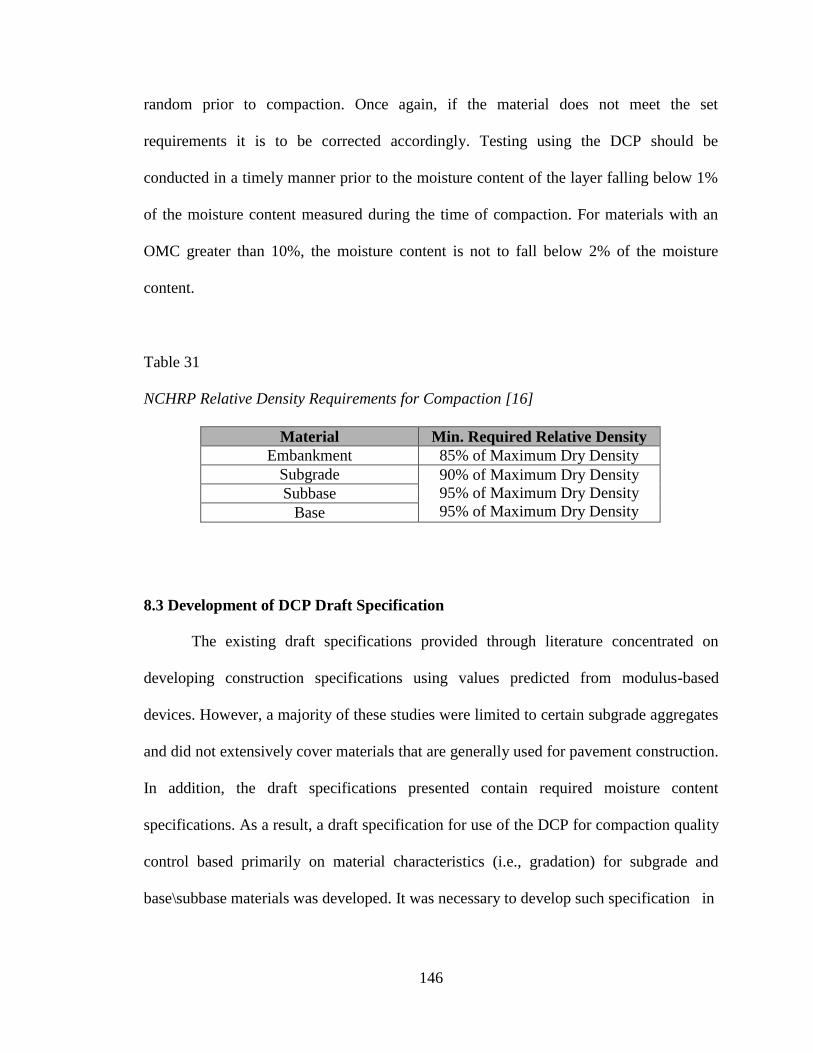
Table 30. NCHRP Relative Density Requirements for Compaction [16] ....................... 146
Table 31. NJDOT Materials Specification ....................................................................... 150
Table 32. Minimum Acceptable DCP Values Based on Gradation ................................. 151
Table 33. Minimum Acceptable DCP Values Based on Gradation & Moisture
Content ............................................................................................................. 152
Page 14
13
Chapter 1
Introduction
1.1 Problem Statement
Naturally existing soil and quarry-produced aggregates play a crucial role in the
performance of highway infrastructure. These materials are typically used to construct the
subgrade and unbound base/subbase layers beneath rigid and flexible pavements.
Therefore, during the construction of these pavements, it is essential to properly compact
subgrade and unbound base/subbase layers to suitable density levels to ensure
satisfactory pavement performance. In other words, any compaction defects in these
pavement layers usually result in distresses in the upper hot mix asphalt (HMA) or
Portland cement concrete (PCC) layers. Distresses in these layers generally correlate to
poor field performance of these pavements when exposed to loadings caused by passing
vehicles.
In the current state of practice, most departments of transportation (DOTs)
employ performance specifications as a means for compaction quality control of unbound
base/subbase layers in pavement construction. These performance specifications require
contractors to compact soil layers to a targeted density level. The field density of the
compacted layers are measured and compared to the target density, which is typically
95% of the Proctor maximum dry density (MDD). Currently, the primary tool used for
measuring field density of compacted subgrade and unbound base/subbase layers is the
nuclear density gauge (NDG). Highway agencies, such as the New Jersey Department of
Page 15
14
Transportation (NJDOT) currently use the NDG for determining the field density and
moisture of embankments, subbase, and base courses [1].
The NDG is a relatively straightforward device that provides accurate density
measurements in a timely manner. The device’s portability and practicality aid the
widespread use of the NDG. Despite the popularity and advantages of the NDG, there are
several concerns and safety risks associated with using this device. For example, there are
many strict regulations for using the NDG such as specific transportation, maintenance,
and storage methods/procedures only appropriate for nuclear devices. These regulations
also require having trained licensed personnel present to operate the NDG during the
compaction quality control stage of pavement construction. These strict regulations and
requirements make implementing the NDG challenging and expensive. In addition to the
strict regulations associated with the device, there are many safety concerns when using
the NDG. As an example, while performing testing with the device the operator may be
subjected to harmful radiation produced by the NDG. Therefore, the NDG can pose a
safety risk to operators.
In addition, one of the main concerns with using the NDG is that the device is
limited to measuring a density value as opposed to a modulus or design-specific value
that can be used during the design stage of pavement construction. To further elaborate,
from a design perspective, when designing pavement structures the engineer uses an
assumed modulus value. However, while in the field, the quality of the pavement layers
is controlled using a density value. As a result, a gap exists between the mechanistic
empirical pavement design stage and the quality control stage during the construction of
pavement structures. It is highly desirable to evaluate other methods/devices that can
Page 16
15
eliminate the need for the NDG and provide design engineers with design-specific
measurements that can help in avoiding over/under designed pavements.
1.2 Study Objectives
The objectives of this study are listed below as follows:
- Develop a procedure for compacting large samples in the laboratory;
- Evaluate the effect of moisture content, and compaction effort on results obtained
from non-nuclear devices and the NDG using four aggregate types, two fine
graded and two dense graded;
- Evaluate the effect of aggregate type and testing time (immediately, 1-day, and 2-
days after compaction) on parameters measured from all devices;
- Develop a multiple linear regression model for predicting field measurements;
- Calibrate developed prediction model using measured field data;
- Develop guidelines for implementing alternative device as a quality acceptance
tool; and
- Establish suitable framework for a draft specification.
1.3 Thesis Organization
This thesis is organized into nine chapters. In chapter one, problem statement,
study objectives, and outline of the thesis are presented. Chapter two presents a
comprehensive literature review. The literature review conducted was imperative for
determining the current state of practice for compaction quality control of unbound
flexible pavements. Chapter three contains the basis for selecting the devices for
Page 17
16
additional laboratory and field evaluation. Chapter four discusses the materials utilized
for this study. This chapter also provides the material characteristics determined for each
aggregate type. A detailed discussion of the research approach and methodology is
presented in chapter five. Chapter six discusses the results obtained from laboratory
testing. This includes an analysis of the sensitivity of each device to varying moisture
contents and compaction efforts applied to the samples as well as different aggregate
types and delayed testing. In chapter seven, the development and calibration of the DCP
multiple linear regression model is discussed. In addition, a recommended minimum
DCP acceptance criteria is presented in this chapter. Chapter eight discusses the proposed
draft specification for use of the DCP for compaction quality control. Finally, chapter
nine presents the conclusions and recommendations made for this study.
Page 18
17
Chapter 2
Review of Literature
2.1 Introduction
This chapter includes a comprehensive discussion of previous studies conducted
on modulus-based devices/methods as tools for evaluating unbound subgrade and
base/subbase pavement layers. The previous studies mentioned focus on the compaction
of large aggregates samples as well as the effects of different measured parameters on
these modulus-based devices/methods. In addition, correlations that have been developed
between representative laboratory and field moduli and previously developed modulus-
based specifications for using these devices during the compaction quality control stage
of unbound pavement layers are also presented in this chapter.
2.2 Modulus-Based Method for Compaction Quality Control
Researchers have conducted studies on different modulus-based devices/methods
as tools for evaluating unbound subgrade and base/subbase pavement layers. In a study
done by Lenke et al. [2] the GeoGauge was evaluated as a potential alternative to the
NDG for compaction quality control during pavement construction. In this study,
laboratory tests were conducted using the GeoGauge on different dry sand and cohesive
soil materials. These tests were performed to determine if the GeoGauge measurements
were consistent with theoretical and empirical soil mechanics concepts. Based on the
results of this study, it was reported that the GeoGauge could successfully measure the
modulus of the compacted field layers. However, the device was reported problematic
when used to obtain targeted stiffness values in the laboratory. Ultimately, these
Page 19
18
problems were attributed to the dynamic nature of the measurements obtained, and the
associated constraints of the device. Lenke et al. [2] also reported that any future
specifications developed for the GeoGauge might require specific field moisture control.
In addition, these specifications may require field compaction equipment with stiffness
monitoring using the GeoGauge.
Previous testing was also performed by Alshibli et al. [3] to examine the
GeoGauge as well as the light weight falling deflectometer (LWD) as quality control-
quality assurance (Qc-Qa) devices for testing subgrades, base course, and compacted soil
layers. Both devices along with the dynamic cone penetrometer (DCP), and static plate
load test (PLT) were used to conduct testing on compacted laboratory samples. These
laboratory samples consisted of silty clay, clayey silt, cement-treated clay, sand, gravel,
recycled asphalt pavement, and limestone aggregates. Based on the testing results, it was
reported that both the GeoGauge and LWD could be used to determine the laboratory
elastic modulus of these compacted layers. It is to be noted that Lenke et al. [2] also drew
similar conclusions, further proving the success of the GeoGauge in measuring the
modulus of compacted soil layers.
Studies conducted by Weidinger et al. [4] evaluated the use of the Briaud
compaction device (BCD) as a field compaction quality control device for compacted
soil. In this study, a series of laboratory tests were conducted using the BCD on
compacted silt materials. In addition to the BCD tests, ultrasonic pulse velocity tests were
performed on the same compacted silt samples to obtain the elastic moduli (Young’s and
shear moduli) of the material. It should be noted that repeated BCD testing was
performed to determine the device’s ability to replicate results on the samples. The
Page 20
19
modulus values obtained from the BCD were then compared to the results of the
ultrasonic pulse velocity tests. Based on the results of this study, Weidinger et al. [4]
concluded that the BCD modulus correlated well to ultrasonic pulse velocity results with
a coefficient of determination (R-squared) of 0.8 or better. In addition, the BCD showed a
variation of 4% of the mean; proving the device could accurately measure the modulus of
compacted soil samples.
In a study done by Chen et al. [5] the DCP was assessed for its ability to evaluate
base and subgrade layers. In this study, over 60 DCP tests were conducted on two test
pavements. Results of these tests were used to validate the pre-established empirical
equations for computing moduli from data obtained using the DCP. Chen et al. [5] also
evaluated the effect of the test procedure on the DCP results. These results were
correlated to results obtained using the multidepth deflectometer (MDD), falling weight
deflectometer (FWD), and laboratory results. From this study, it was concluded that DCP
values were dependent on the test procedure, inevitably affecting the results by
approximately 10%. The subgrade moduli determined in the laboratory were only slightly
higher than results from the DCP and FWD-MDD tests. In addition, the modulus results
from the DCP and empirical equations were comparable to FWD and MDD modulus
results. Overall, the results of this study confirmed that the DCP could be utilized to
evaluate the compaction quality of subgrade and base/subbase layers.
2.2.1 Compaction of Large Aggregate Samples for Modulus-Based Laboratory Testing
As a means for evaluating different modulus-based devices/methods, researchers
have utilized laboratory compacted aggregate samples in their studies. The laboratory
Page 21
20
prepared samples allowed researchers to simulate different field unbound subgrade and
base/subbase layers in which these modulus-based devices/methods would be used to
test. In addition, the compacted samples allowed researchers to study the effects of
different measured parameters on these modulus-based devices/methods, to be discussed
in the following section.
As mentioned in the previous section, Alshibli et al. [3] conducted studies to
evaluate the GeoGauge and LWD as Qc-Qa devices for testing subgrades, base courses,
and compacted soil layers. In this study, testing was conducted at the Louisiana
Transportation Research Center (LTRC) laboratory. The compacted aggregate samples
utilized were prepared in two identical boxes measuring 60-inches (152.4-cm) in length,
36-inches (91.4-cm) wide, and 36-inches (91.4-cm) deep. At the bottom of each prepared
sample was an 8-inch (20.3-cm) thick clay layer, compacted at optimum moisture content
(OMC), that served as the subgrade layer for the samples. Two additional 8-inch (20.3-
cm) thick lifts were then compacted above the clay layer using the desired soil/base
material. Each aggregate sample and corresponding base layer was compacted inside the
box using a Wacker Packer plate compactor. Both the GeoGauge and LWD were then
used to conduct testing on the compacted samples. In addition, testing was also
conducted on the samples using the DCP and PLT. Using the laboratory prepared
samples, Alshibli et al. [3] concluded that both the GeoGauge and LWD could be used to
determine the elastic modulus of the compacted aggregates.
In a study done by Abu-Farsakh et al. [6] a series of laboratory and field tests
were conducted to evaluate the use of DCP in the Qc-Qa process during the construction
of pavement layers. In this study, laboratory testing was conducted on twenty-three
Page 22
21
aggregate samples prepared at different moisture contents and compaction levels. Silty
clay and clayey silt materials, typically used in the construction of highway
embankments, were used to prepare the compacted samples. Additional materials, such as
sand, crushed limestone, and reclaimed asphalt pavement (RAP), were also utilized for
laboratory testing. Similar to Alshibli et al. [3], the samples were prepared at the LTRC in
two boxes measuring 60-inches (152.4-cm) in length, 36-inches (91.4-cm) wide, and 36-
inches (91.4-cm) deep. The samples were compacted in two 8-inch (20.3-cm) thick lifts
using a small Bosch compactor and a Wacker Packer plate compactor. After each layer
was compacted, DCP tests as well as one PLT test was conducted on the sample to
determine the elastic modulus of the aggregate layer. Based on the results of this study,
Abu-Farsakh et al. [6] concluded that DCP could be used to determine the stiffness and
strength of pavement layers if used for Qc-Qa during pavement construction.
Murad et al. [7] also conducted laboratory and field testing to evaluate the DCP,
LFWD, and GeoGauge for use in determining the strength/stiffness of pavement layers
and embankments. Similar to both Alshibli et al. [3] and Abu-Farsakh et al. [6], the
aggregate samples were prepared at the Geosynthetic Engineering Research Lab (GERL)
at the LTRC using two identical boxes measuring 60-inches (152.4-cm) in length, 36-
inches (91.4-cm) wide, and 36-inches (91.4-cm) deep. However, unlike Alshibli et al. [3],
who compacted samples above a 7.9-inch (20-cm) thick clay layer, the samples in this
study were compacted above a 12-inch (30.5-cm) thick clay layer. In addition, all
aggregates samples were compacted in two 8-inch (20.3-cm) thick lifts for a total depth
of 16-inches (40.6-cm). A small Bosch compactor as well as a Wacker Packer plate
compactor was utilized for compaction. Upon completion of compaction a series of DCP,
Page 23
22
LFWD, and GeoGauge tests were conducted on the samples. Standard testing using the
PLT and California bearing ratio (CBR) were also conducted on the prepared samples.
Based on the results of this study, Murad et al. [7] concluded that the measurements
obtained from the DCP, LFWD, and GeoGauge correlated well to those obtained from
the standard PLT and CBR tests.
Herath et al. [8] also evaluated the use of the DCP for determining the resilient
modulus of subgrades soils. In this study, twelve large aggregate samples were prepared
using two aggregate types, subjected to different moisture and compaction levels. The
samples were compacted in large boxes measuring 59.1-inches (150-cm) in length, 35.4-
inches (89.9-cm) wide, and 23.4-inches (59.9-cm) deep. An electric jackhammer was
then used to compact the samples in 7.9-inch (20.1-cm) thick lifts and a series of DCP
and resilient modulus tests were then conducted on the samples. The results from testing
were used to develop two prediction models to determine the resilient moduli of subgrade
soils. The laboratory testing results showed that the resilient modulus values measured
through both prediction models corresponded well with the resilient modulus values
obtained through the resilient modulus tests. Based on the results of this study, Herath et
al. [8] concluded that the DCP could successfully determine the resilient moduli of
subgrade soils.
2.2.2 Effect of Different Measured Parameters on Modulus-Based Devices/Methods
Researchers have also conducted studies to determine the effect of different
measured parameters on modulus-based devices/methods. As mentioned in the previous
section, laboratory samples were prepared at varying moisture contents, compaction
Page 24
23
levels, and aggregate types in which the modulus-based devices were then tested on. The
laboratory compacted samples prepared in these studies allowed researchers to assess the
performance of each device/method when exposed to different types of subbase/base
layer conditions.
In the study done by Lenke et al. [2], the GeoGauge was evaluated for compaction
quality control during the construction of pavements. Testing using the GeoGauge was
conducted on different dry sand and cohesive soil materials to determine the stiffness of
each material. The materials utilized in this study composed of dry granular cohesionless
silica sands as well as cohesive silty-sand materials. Based on the laboratory testing
results, Lenke et al. [2] confirmed that the GeoGauge measured the stiffness of the
different aggregate types. In addition, the results obtained from the cohesive soil samples
indicated that as moisture content in the sample increased, the stiffness of the soil
decreased, thus proving that the GeoGauge is sensitive to changes in moisture content. In
addition, Lenke et al. [2] suggested that any specifications developed for the GeoGauge
may require specific field moisture control.
In the study conducted by Alshibli et al. [3], laboratory testing was
conducted to evaluate the GeoGauge and LWD for use in the Qc-Qa stage during highway
construction. As mentioned in the previous sections, testing was performed on laboratory
compacted samples prepared in two identical boxes, above an 8-inch (20.3-cm) thick clay
layer. The aggregate types utilized in this study included silty clay, clayey silt, cement-
treated clay, sand, gravel, RAP, and limestone aggregates. Each aggregate sample and its
corresponding base layer was compacted within the boxes and subjected to a series of
GeoGauge, LWD, DCP, and PLT tests. Throughout laboratory testing the cement-treated
Page 25
24
clay samples were studied to determine the strength improvement of the compacted
layers with time and the effect of moisture on the GeoGauge and LWD. The results
indicated that the GeoGauge and LWD were able to determine an increase in modulus
over the course of 11 days for both the 2% and 4% cement-treated clays. However, for
the 6% and 8% cemented-treated clays, the GeoGauge indicated a decrease in modulus
over time. In addition, the DCP penetration rate for the cement-treated clays decreased
with time. Based on the results of this study, Alshibli et al. [3] concluded that the
GeoGauge and LWD were sensitive to changes in moisture and testing time, specifically
in cement-treated clay materials. The lack of moisture within the materials caused
shrinkage cracks at the surface of the samples inevitably affecting the GeoGauge and
LWD measurements. In addition, the testing results varied between the different
materials, thus proving the devices’ sensitivity to changes in aggregate type.
Hossain et al. [9] conducted laboratory and field testing to evaluate the LWD for
determining the moduli of existing pavement layers. In this study, LWD as well as
GeoGauge and DCP testing was conducted on seven pavement sections in Virginia.
These sections included three compacted subgrades layers, one compacted base layer,
and three existing gravel roads. In addition, small scale laboratory testing was conducted
on two soil types to determine the effect of moisture content and density on the measured
soil moduli. Ultimately the testing results obtained from the LWD were compared to
those obtained from the GeoGauge and DCP. The testing results in this study indicated
that the stiffness modulus increased as the density of the materials increased for both the
LWD and GeoGauge measurements. In addition, the highest correlation between density
and soil modulus was observed between the LWD and GeoGauge (R2 = 0.44). However,
Page 26
25
no clear relationship could be determined between moisture content and soil stiffness for
the subgrade, base aggregates, and gravel road materials. Furthermore, no trend could be
determined between moisture content and soil stiffness for the LWD or GeoGauge.
However, there was a strong influence of moisture (R2 = 0.97) on the DCP measurements
for all materials tested, such that as the moisture content in the material increased the
stiffness measurements decreased.
Murad et al. [7] also evaluated the GeoGauge, LFWD, and DCP for use in
determining the strength/stiffness during pavement construction. In this study, aggregate
samples were prepared and compacted using a Bosch and Wacker Packer plate compactor
into boxes above a 12-inch (30.5-cm) thick clay layer. The compacted laboratory samples
were then exposed to GeoGauge, LFWD, and DCP tests as well as PLT and CBR tests. A
statistical analysis was performed on the collected data to correlate the measurements
obtained from the GeoGauge, LFWD, and DCP to those obtained from PLT and CBR
testing. The results of this study showed good correlations between the testing results
obtained from the GeoGauge, LFWD, and DCP to those obtained from the PLT and CBR
testing. In addition, better correlations were obtained from the field testing measurements
than those obtained through laboratory testing as a result of inconsistent compaction of
the laboratory samples. The laboratory testing results indicated that GeoGauge was
sensitive to the presence of moisture within the samples as well as testing time,
specifically for cement-treated and lime-treated soils. Nonetheless, the GeoGauge testing
results were successfully correlated to the PLT and CBR measurements. Murad et al. [7]
also concluded that LFWD and DCP showed better correlations than the GeoGauge for
both field and laboratory testing. Based on the results of this study, it was concluded that
Page 27
26
the GeoGauge, LFWD, and DCP could accurately predict the moduli obtained from the
FWD and CBR tests. However, all devices were influenced by the presence of moisture
during compaction and time of testing.
In a study done by Nazzal et al. [10] several different highway sections in
Louisiana were used to evaluate the LWD for measuring the modulus of pavement layers
and subgrades. In this study, nine test sections were constructed and tested on using the
LWD in conjunction with the FWD, PLT, and DCP tests. The testing results were then
collected and a linear regression analysis was performed to develop models that related
FWD moduli to moduli obtained from the FWD, PLT, and DCP penetration rate. The
LWD testing results were also used to develop models to predict FWD and PLT
measurements. Similar to studies conducted by Alshibli et al. [3] and Murad et al. [7], the
testing results in this study indicated the modulus value measured by the LWD increase
with time, for cement-treated materials. In addition, Nazzal et al. [10] concluded that the
LWD was influenced by the presence of moisture in the materials. The testing results also
showed that the LWD modulus increased with the increase in compaction effort. It is
worth noting that, Nazzal et al. [10] also suggested that the correlation between LWD
elastic moduli and dry unit weight of the material depended on the aggregate material
tested.
Petersen et al. [11] evaluate the use of the LWD for measuring the stiffness of
subgrade soils. In order to evaluate the LWD in this study, stiffness measurements were
recorded at different locations along nine embankment projects. In addition to measuring
the stiffness of the soils, density, and moisture measurements were taken at select
locations throughout the projects. The data collected during testing was used to develop
Page 28
27
correlations between resilient moduli and field moisture content and density. Laboratory
soil samples were also collected to determine the resilient moduli of the material at
varying density and moisture contents. Based on the testing results, Petersen et al. [11]
concluded that the effect of compaction effort on the resilient moduli was dependent on
the aggregate type and moisture level. Overall results suggested that the modulus of the
material increased with an increase in compaction effort. Petersen et al. [11] also
concluded that the modulus of soils decreased as the moisture content in the material
increased. It is worth noting that similar trends were observed between the different soil
types tested.
In the study done by Herath et al. [8] laboratory and field testing was conducted
using the DCP to predict the resilient modulus of subgrade soils. In order to assess the
DCP, twelve large cohesive soil samples and six field sections from two existing
pavements were utilized for testing. A total of twenty-four laboratory DCP tests and six
field DCP tests were conducted and used to develop a model to predict the resilient
modulus of cohesive soil. In addition, for each DCP test a resilient modulus test and soil
property test was conducted on the compacted soil samples. Based on the results of this
study, Herath et al. [8] concluded that the proposed prediction model accurately predicted
the resilient modulus of the soil. Laboratory testing also showed that as the moisture in
the samples increased the DCP penetration index (DPI) increased. In addition, as the
moisture in the material increased the modulus of the material decreased, thus concluding
the influence of moisture content and aggregate type of the samples on the DCP.
Page 29
28
2.2.3 Correlation between Representative Laboratory and Field Moduli
In addition to the studies conducted to evaluate the effect of different measured
parameters on the devices’ testing results, studies have also been performed to develop
correlations between representative laboratory and field moduli. As an example, Briaud
et al. [12] developed correlations between representative laboratory and field moduli
using the BCD. In this study, both laboratory and field tests were conducted using the
BCD on the same soil samples. Results from field tests were then compared to PLTs and
laboratory testing results. In order to determine if the device could accurately capture
field modulus values the results were compared to one another. Based on the results of
this study, Briaud et al. [12] concluded that the BCD laboratory results could successfully
be correlated to field moduli results.
Nazzal et al. [10] conducted field testing on several highway sections to evaluate
the use of the LWD in measuring in-situ modulus of pavement layers and subgrades. In
this study, nine field sections were constructed and tested using the Prima 100 model-
LWD. FWD, PLT, and DCP tests were also utilized in this study to provide reference
measurements for comparing the LWD results. The results from field testing helped
facilitate the development of a linear regression model to relate LWD stiffness moduli
with the moduli obtained from the FWD, PLT, and DCP penetration rate. In addition to
this, multiple linear regression analyses were conducted to develop prediction models for
the FWD and PLT, based on the LWD elastic moduli and soil properties (i.e., moisture
content and void ratio). Nazzal et al. [10] concluded that the LWD could predict FWD,
PLT, and DCP values within a certain level of confidence. The developed prediction
Page 30
29
models were improved when the soil properties were introduced as variables in the
equation.
Mohammad et al. [13] also conducted laboratory and field testing to develop
models that predict resilient moduli of soils from test results obtained from the DCP,
continuous intrusion miniature cone penetrometer (CIMCPT), dynamic deflection
determination (Dynaflect), and FWD. The laboratory testing consisted of repeated triaxial
resilient modulus tests along with compaction and physical property tests. Field testing
was conducted using the DCP while statistical analysis was performed on the collected
laboratory and field data. From the laboratory and field results, Mohammad et al. [13]
found a correlation between predicted and measured resilient moduli. Similar to Nazzal et
al. [10], the prediction model developed was improved when the soil properties (i.e.,
moisture content and dry unit weight) were introduced into the equation.
In the study done by Herath et al. [8], correlations were developed to predict field
moduli values of subgrade soils from test parameters of the DCP. The DCP test
parameters utilized included: (1) aggregate type, (2) moisture content, and (3) dry unit
weight. In this study, laboratory testing was conducted on twelve large soil samples using
two cohesive soil types. Field testing was also performed using the DCP at six different
locations within two existing pavements. Using the results from both laboratory and field
testing, Herath et al. [8] developed a model to estimate the resilient moduli of subgrade
soils. Based on the developed prediction model, Herath et al. [8] concluded that the
model could accurately predict data sets. It was also concluded that the DCP was
successful in determining the resilient moduli of pavements and subgrade soils.
Page 31
30
Salgado et al. [14] developed correlations between DCP test results to different
soil properties (i.e., dry density and moisture). Unlike the previously mentioned studies,
Salgado et al. [14] did not correlate DCP results to moduli results obtained using an
alternative device. Rather, in this study a series of field and laboratory tests were
performed using the DCP and nuclear gauge tests. Seven construction sites were selected
for field testing. These seven sections included: four clayey sands, two poor graded
sands, and well-graded sand composed of clay. Testing was conducted on the same
location for both devices to allow Salgado et al. [14] to compare the DCP results to the
nuclear tests results. Ultimately, Salgado et al. [14] concluded that the penetration rate of
the soil decreased with an increase in dry density. In addition, the penetration rate
increased as the moisture content increased. In the case of clayey sands, it was concluded
that the aggregate dry density could be used to predict field DCP results. Due to the
uncertainty of the DCP tests, Salgado et al. [14] suggested that the DCP be performed for
compaction quality control in conjunction with test methods such as the nuclear gauge.
2.3 Development of Modulus-Based Construction Specifications
In addition to correlating representative laboratory and field moduli obtained from
alternative non-nuclear devices, studies have also been performed to develop modulus-
based construction specifications for use of these devices. For example, Petersen et al.
[11] evaluated the feasibility of using the LWD for measuring the stiffness of subgrade
soils. In this study, testing using the LWD was conducted on nine embankment projects.
Stiffness, density, and moisture values were measured from each location to determine
the resilient moduli of the soils at different moisture and density levels within the
Page 32
31
laboratory. Based on the laboratory and field results, a model to predict resilient modulus
was developed. Predicted values were then compared to actual LWD results. Petersen et
al. [11] concluded that the predicted moduli, as determined from the established model
(based on laboratory resilient modulus tests), did not correlate well with the in-situ
stiffness measured using the LWD. As a result, a stiffness-based specification for in-situ
embankment compaction quality control could not be developed.
In a study conducted by Davich et al. [15] moisture specifications for granular
materials were validated for the DCP and LWD. The moisture specifications evaluated
were provided by the Minnesota Department of Transportation (MnDOT). In this study,
both the DCP and LWD were tested on multiple laboratory samples. The results of
laboratory testing concluded that both the DCP and LWD were effective in assessing the
compaction quality of the prepared samples. However, suggestions were provided to
improve both device specifications. The recommendations provided by Davich et al. [15]
included penetrating the sample past the subgrade layer when using the DCP. In addition,
it was suggested that a DCP seating requirement was not necessary, and the acceptable
amount of moisture during testing on granular subbase should be at a maximum of 10%.
For the developed LWD specifications, Davich et al. [15] recommended using a falling
mass of 2.2-lbs. (10-kg), a drop height of 19.7-in. (50-cm), and plate diameter of 7.9-in.
(20-cm).
Nazarian et al. [16] also developed a modulus-based construction specification for
compaction of earthwork and unbound aggregates using the DCP and alternatives
devices. In this study, laboratory and field testing was conducted on three fine-grained
soils, two sandy materials, and two unbound granular base materials at different target
Page 33
32
moisture contents and densities. This method was chosen in order to determine the
construction parameters of each geomaterial as well as establish relationships between
laboratory and field moduli. Both laboratory and field test results were used to calibrate
the modulus prediction models developed for the study. Based on the testing results and
prediction models developed, a draft specification was proposed. The proposed
specification, provided by Nazarian et al. [16], was tested and improved through
additional testing on different construction projects.
Wu et al. [17] also developed and implemented a stiffness-based procedure for
using the DCP as an acceptance tool for unbound materials. In this study Wu et al. [17]
proposed a set of DCP unbound material acceptance criteria and standards for the Ohio
Department of Transportation (ODOT). The procedure and acceptance criteria standards
were based off of the findings of the Ohio Research Institute for Transportation and the
Environment (ORITE) study in which data was collected and analyzed from 10 different
road projects. From both studies, it was concluded that the DCP could be a viable
alternative to evaluating different subgrade materials. In addition, the ORITE study
suggested that adopting the DCP for unbound material acceptance specifications could
greatly improve pavement performance. Based on the DCP results, a threshold for
unsuitable materials and stiffness parameters for pavement design rehabilitation was also
developed.
In addition to developing specifications for using the DCP, a geotechnical guide
performance specifications for embankment and pavement construction was provided by
White et al. [18]. These performance specifications were developed using various in-situ
testing methods including intelligent compaction (IC) technologies. In this study, testing
Page 34
33
was performed on different test areas composed of silty clay embankment fill, and
crushed limestone aggregate, typically used for stabilizing backfill or pavement subbase.
Testing was conducted on these areas using nuclear density moisture content tests, PLT,
and DCP tests. Following testing, the DCP and PLT results were analyzed and compared
to the traditional quality control methods based on nuclear density/moisture testing. The
results of testing concluded that the IC technologies results could be successfully
correlated to modulus results obtained using the PLT, and DCP. However, it was
observed that these devices did not produce accurate results in areas with high moisture
content. Based on the findings of this study, White et al. [18] provided several advantages
and specifications for using IC technologies in earthwork construction quality control.
2.4 Summary
In summary, the majority of studies found throughout literature indicated that
alternative non-nuclear devices could effectively evaluate the quality of compacted
subgrade and base/subbase layers beneath rigid or flexible pavements. In addition,
prediction models and specifications for using these devices have been established in
these reports. However, most of the reports mentioned focused exclusively on validating
the use of these devices for measuring the modulus of these compacted pavement layers.
Validation of these devices included correlating the devices’ laboratory and field moduli
results to moduli results obtained through standard tests. However, in order to determine
a non-nuclear alternative to the NDG, it is necessary to correlate laboratory and field
moduli results of these devices to laboratory and field density values that are currently
obtained using the NDG. Furthermore, a majority of literature did not comprehensively
Page 35
34
evaluate the effect of aggregate type, moisture content, compaction effort, and delayed
testing on the results obtained from these devices.
Existing specifications established in these reports concentrated on developing
modulus-based specifications with values predicted using the modulus devices. In
addition, the studies mentioned were limited to subgrade aggregates and did not consider
materials that are typically used for constructing pavement layers.
Page 36
35
Chapter 3
Basis for Selecting Devices for Evaluation
3.1 Introduction
The basis for selecting the devices for additional laboratory and field evaluation is
presented in this chapter. This includes a detailed discussion of the procedure
implemented to rank the devices based on a specific set of criteria. In addition, this
chapter discusses the survey prepared and distributed to state DOTs, contractors, and
manufacturers. The survey was utilized to obtain the latest feedback on the selected
devices and opinions on transiting from density-based testing and towards
modulus/stiffness-based methods. Finally, based on the comprehensive literature review
and the survey conducted, a description of the devices selected for further laboratory and
field investigation is discussed in this chapter.
3.2 Ranking of Selected Devices
In order to select the devices most appropriate for this study a ranking system was
developed. The ranking system was created to better understand the performance and
feasibility of using the GeoGauge, PaveTracker, BCD, various LWDs, and the DCP as
quality acceptance tools for subgrade and unbound base/subbase layers. The likelihood of
utilizing these devices for further laboratory and field investigation in this study was
solely based on the potential each device showcased through the literature review. The
ranking system implemented was based on the following nine criteria:
1. Past experiences with alternative devices;
2. Alternative devices repeatability and time needed for measurements;
Page 37
36
3. Data processing and interpretation requirement for alternative devices;
4. Sensitivity of alternative devices to environmental factors, accuracy, and ease
of use;
5. Cost of utilizing alternative devices;
6. Alternative devices ability to account for lower layer properties;
7. Alternative devices ability to correlate representative laboratory and field
moduli;
8. Alternative devices ability to account for field moisture and density
variability; and
9. Sensitivity of alternative devices to various levels of compaction.
Based on these 9 criteria, a ranking was established for each device and the results
for each criterion are discussed in detail in the respective subsections below. Based on the
results of this ranking system, the top three alternative devices that successfully met the
criteria were selected for additional testing in this study. It is to be noted that the
PaveTracker and PQI devices, typically used for HMA, were also included in the
literature evaluation to determine their potential use for unbound materials. In addition,
the ranking system may be biased towards certain devices due to the availability or
unavailability of device information in regards to a specific criterion mentioned above.
3.2.1 Past Experiences with Alternative Devices
A literature review was performed on the GeoGauge, PaveTracker, BCD, LWD,
and DCP to study past experiences, both good and bad, with using the alternative devices.
Page 38
37
This literature review was necessary to identify how each device performed in previous
studies. Understanding how well the devices performed (in the laboratory or field)
provided insight on how the devices would have performed if selected for additional
testing in this study.
Past experience with the GeoGauge indicated that the device requires similar
training and operator capabilities as the NDG [19]. Therefore, if the GeoGauge were
selected for this study strict regulations would still exist for using the device. Previous
experiences also showed that the GeoGauge calls for prior calibrations, consisting of
multiple load resilient modulus tests for specific materials, which are not performed by
most agencies. These reports further suggest that the GeoGauge may be difficult to use
for this study. In addition, it was reported that the results using the GeoGauge may be
inaccurate if used to test thin (less than 4-inches (10.2-cm)) or thick (more than 12-inches
(30.5-cm)) layers or on materials with stiffness greater than 23 MN/m. A study also
recommended that the device not be used for measuring dry density, even after finding
calibration factors [20]. Also, when previously tested on non-cohesive, well-graded
sands, there was high variability in the GeoGauge results [20]. These observations
suggested that the GeoGauge might pose problematic for this study as different types of
fine and coarse materials were used for testing.
Observations have also been made in regards to challenges with using the
GeoGauge. Specifically, reports have mentioned that there was difficulty in achieving
adequate contact between the GeoGauge ring and the tested soils [21] [22] [23]. In order
to ensure a minimum of 80% contact between the foot and the soil the device
manufacturers have suggested slightly twisting the device during testing. If 80% contact
Page 39
38
could not be achieved then the manufacturer recommended placing down a thin layer of
sand. However, this thin layer of sand can inevitably impact the testing results of the
device. The GeoGauge has also been problematic when calibrated in a laboratory setting
as a result of specific boundary conditions, and certain soils influencing the device [2].
Based on the literature, it is evident that the GeoGauge requires similar training and use
requirements as the NDG. The device also requires time in order to properly calibrate the
device. Therefore, past experiences with the GeoGauge suggested that the device might
be difficult to use for testing.
The pavement quality indicator (PQI) was introduced as the first non-nuclear
density gauge in 1998. In past studies the device experienced several problems when
exposed to moisture and could not accurately determine the density of the tested
pavement. However, the device became more adept to efficiently measuring the density
when exposed to moisture as a result of the development of an improved model.
Although the recent pavement quality model has been deemed promising, moisture
concerns still exist for the device [24]. Unfortunately, additional information regarding
the past experiences could not be found for the PaveTracker. However, since both the
PQI and PaveTracker perform with similar methods it can be inferred that the
PaveTracker would also experience problems when exposed to different moisture
contents. The concerns presented suggest that both devices might perform poorly in this
study as the devices evaluated were exposed to varying levels of moisture content.
The BCD is considered one of the newer non-nuclear devices studied, for this
reason there is limited information regarding the history of evaluations conducted for the
device. However, from the existing tests performed using the BCD it has been identified
Page 40
39
that there is only 0.08-inches (2-mm) of clearance when using the device. In other words,
the placement and execution of the BCD must be near perfect, with small room for error,
to ensure accurate results [4]. In addition, when utilized on very soft soils, the weight of
the BCD may cause the strain plate to sink prior to using the device, inevitably affecting
the results of testing [19]. These past studies using the BCD suggest that the device is
challenging to use during testing. Therefore, if used in this study, it may be difficult to
obtain accurate results if the BCD is not placed precisely. However, the 4.35-lb. (1.76-kg)
weight of the device makes the BCD easy to carry and used by one operator. Overall, past
studies suggest that the BCD may not provide accurate results due to the general nature
of the device.
Past experiences with the LWD suggest that the device is non-destructive when
used during testing, however operation of the device requires dropping a 22-lb. (10-kg)
mass onto a loading plate. Although the device is defined as non-destructive, the impact
caused by the falling mass can result in additional compaction or disturbances within the
soil layer. For the purpose of this study, it was important that the device selected for
testing did not affect the prepared samples. Therefore, this observation suggests that the
LWD might inflict excess force on the samples prepared for laboratory testing.
In regards to operating the LWD, there were no reports of safety concerns
associated with using the device [19]. Unlike the NDG, this allows both field inspectors
and operators to remain on site during testing without any safety concerns. However,
previous studies have observed high spatial variability and moisture effects on the LWD
measurements. Therefore, it was recommended that the LWD not be used as a quality
assurance device for compacted soils until further research is conducted to determine the
Page 41
40
causes of these effects [9]. The high spatial variability in the LWD results indicated that
the device might not generate accurate results if used for testing in this study.
Previous literature on the DCP indicated that the DCP test is a simple, rapid, and
economical in-situ test for many geotechnical applications [8]. Studies using the device
have concluded that the device is easy to use and provides results in a timely manner.
Based on the previous success of the device, it was concluded that the DCP might be a
suitable device to further investigate in this study. Little has been done in regards to
measuring the resilient modulus pavement subgrade soils using the device. However,
models have been successful developed for predicting the resilient modulus of subgrade
soils using DCP test parameters [8]. The overall past experiences with the DCP and
results of these prediction models indicate that the DCP could successfully be used for
modulus based testing in this study.
Based on the comprehensive literature review conducted on the past experience of
the selected devices, an overall ranking of the devices was developed and summarized in
Table 1 below. The ranking in Table 1 is based on the past experiences of each device on
a scale from 1 to 5; 1 being the most promising of the devices and 5 being the worst
based on the criteria.
Page 42
41
Table 1
Past Experiences with Alternative Devices
Device Overall Past Experience Rank
GeoGauge
- Difficult compared to NDG
- Tedious calibration
- Non-destructive
3
PaveTracker
- Not very difficult or complicated to use
- Sensitive to moisture, lack of available information
- Non-destructive
5 (worst)
BCD
- Extremely user-friendly: No calibration needed
- Placement and execution must be exact
- Non-destructive
2
LWD
- Simple and quick procedure (comparable to DCP)
- Currently not recommended for quality control/quality
assurance due to high variability - Non-destructive, but may introduce additional soil compaction
and disturbance
4
DCP
- Successful; Simpler than NDG
- Evaluation of resilient modulus not well known
- Destructive
1 (best)
3.2.2 Alternative Devices Repeatability and Time Needed for Measurements
For the purpose of this study, it was essential that the devices selected for
laboratory and field evaluation produced timely results that could also be easily
replicated. In order to determine the devices that adequately met these criteria, a literature
review was conducted on the devices repeatability and time needed for measurements.
Following the literature review, the devices were ranked accordingly.
As previously mentioned, when tested on non-cohesive, well-graded sands high
variability was observed for the GeoGauge results [20]. Specifically, reports have
Page 43
42
determined a coefficient of variation (COV) ranging from 6.1 to 9.5% for the device [6].
It should be noted that this study was completed after 54 measurements were taken at 3
different locations. However, other reports have observed excellent repeatability with the
GeoGauge when measurements were taken consecutively on different soil types [25].
These observations suggest that even after repeated measurements using the GeoGauge,
high variability might still be experienced within the results if not measured immediately
after the initial measurement. In addition, it has been reported that the GeoGauge results
were “extremely inconsistent and highly dependent on the seating procedures and the
operator” [22] [26]. Despite this observation, the GeoGauge had similar or better
repeatability than other in-situ test devices, with lower spatial variability than the LWD
and DCP [19].
Based on previous studies using the GeoGauge reports have noted that each
measurement required 75 seconds to complete, as opposed to the NDG, in which only 60
seconds is required. In addition, the time for using the GeoGauge doubles when the
preparation and clean up time is considered. The observations made in these studies
suggested that high variability might be experienced if the GeoGauge were to be used for
additional testing. Moreover, a longer period of time will be required to obtain the results
from laboratory and field testing.
The manufacturers of the PQI recommended that five readings be obtained for
each area tested. Specific instructions insisted that the initial reading be measured
normally and the following four readings be obtained by rotating the device to
approximately 2, 5, 8, and 11 o’clock positions respectively. The five readings can then
be averaged together to obtain the appropriate density value. The manufacturer of the
Page 44
43
PaveTracker suggested a similar protocol, however, only four readings were
recommended at 12, 3, 6, and 9 o’clock positions [24]. Based on these recommendations
it can be inferred that individual readings for the both devices may be slightly skewed
therefore more than one measurement is necessary to ensure accurate results. Two
concerns arise from these recommendations, which include the amount of variability in
the test results, and the additional time needed to operate both devices. In addition, the
recommendations provided by the manufactures suggested that the high variability in the
PQI and PaveTracker test results must be accounted for if used for this study.
According to the device manufacturers, the BCD test involves taking four
measurements, 90o apart, in order to obtain an average modulus value [12]. The
procedure mentioned requires 5 seconds to complete testing in both the laboratory and
field. In a previous report, the BCD was tested to determine the level of accuracy of the
device. In this study, the device was tested on the same rubber block eight times. Results
of this test concluded that the COV of the strain output for the BCD was 0.5% [19]. In
addition, further tests on the actual variability of the individual test results concluded that
modulus results varied within 4% or 0.85 MPa of each other [4]. The results of these
studies suggested that although the BCD provides timely results, there might be high
variability with using the device, which may pose as a concern if used repeatedly in both
laboratory and field tests.
Several reports regarding the use of the LWD have revealed that the device
produces a wide distribution of results as a result of its poor repeatability. In a previous
study, the LWD was utilized for cement-treated clay to monitor the strength gain with
time of materials [3]. The results of this study concluded that the LWD yielded unreliable
Page 45
44
measurements. Similar observations were made in a study preformed using two different
LWD models on the same aggregate type [9]. These studies suggested that the LWD
might not be capable of reproducing results. In order to determine accurate modulus
values of the compacted samples in this study, it is crucial that the device selected could
successfully replicate laboratory and field results.
As previously established, the DCP has been used for various geotechnical
applications. Operation of the device requires applying an initial seating load onto the
area being tested. Many studies have been done in regards to the performance of the
DCP. These studies have suggested that the load applied onto the material enhances the
consistency of the DCP device [8]. Testing was also performed using the DCP on ten
different soil types and locations. Based on the findings of this study, it was reported that
the device was capable of replicating accurate testing results. Although specific
information on the time required to operate the DCP was not determined, based on the
existing literature it can be inferred that the DCP also provides timely results. The
previous success of the device in reproducing results in a short amount of time suggested
that DCP would be a suitable candidate for this study.
Table 2 below quantifies the repeatability and time for measurement of each
device. Included in Table 2 is a ranking of each device based on a scale from 1 to 5; 1
being the most promising of the devices based and 5 being the worst of the devices based
on the criteria.
Page 46
45
Table 2
Alternative Devices Repeatability and Time Needed for Measurements
Device Repeatability Time Needed for Measurements Rank
GeoGauge - Variable with non-cohesive,
well-graded sands
- Twice as long as NDG
3
PaveTracker
- Testing easily repeatable,
but readings are variable
- Sensitive with moisture
- Multiple readings needed
- Exact time not known
5
(worst)
BCD
- Minimal device variability
- Repeatability associated
with user placement
- 5 seconds to obtain readings
- Rapid testing, but multiple
readings recommended
1
(best)
LWD
- Wide scatter and poor
repeatability
- Especially sensitive with
cement-treated clays
- More rapid than NDG
- Comparable to DCP
4
DCP
- Applied load remains
constant - Variable rest period which is
operator dependent
- More rapid than NDG
- Comparable to LWD
2
3.2.3 Data Processing and Interpretation Requirements for Alternative Devices
In order to facilitate selecting the appropriate device for additional laboratory and
field testing it was necessary to understand how easy/difficult it is to obtain the necessary
data following testing using each device. In order to do this, a literature review was
conducted on the GeoGauge, PaveTracker, BCD, LWD, and DCP to determine the data
processing and interpretation requirements for each device.
According to the device manufacturers, the stiffness and modulus values
measured using the GeoGauge can be automatically displayed or stored in the device and
downloaded to a computer at a later time [27]. The modulus values obtained are a
Page 47
46
function of the materials moisture content and density, while the stiffness measurements
are a function of the materials structure. The GeoGauge measures the stiffness of the soil
at each frequency and automatically displays an average value. These results can be used
to develop relationships between modulus growth and compaction effort in unbound
layers [20]. The only drawback to the device is that the load applied to the soil does not
represent the actual stress levels encountered in the field, therefore the GeoGauge
modulus must be corrected to account for design loads [19]. Despite this minor
drawback, the data obtained using the GeoGauge can be easily processed and interpreted.
The PQI and the PaveTracker operate with similar methodologies in that both
devices are capable of detecting changes in density throughout a pavement layer. These
changes in the density within the layer are attributed to the changes in the electric field
caused by the introduction of dielectrics within the layer. Both devices output a direct
density reading of the area being tested [24]. Based on previous literature, it can be
concluded that both the PQI and the PaveTracker provide direct density measurements
without difficultly. In addition, no prior calibrations are needed in order to obtain the
results from testing.
The data processing and interpretation of the BCD is simple in that the four
electrical strain gauges, attached to the top of the plate, are used to measure the strain
values of the soil. The remaining four electrical strain gauges are used for hoop
measurements. The load cell above the plate detects the load applied by the operator and
a modulus reading is automatically outputted. The soil modulus is then calculated using
the bending strains detected by the gauges. A computer processes the bending strains and
the modulus of the soil is displayed. It should be noted that the computer automatically
Page 48
47
applies pre-calculated field and laboratory calibrations for the device [12] [19]. The
literature review conducted on the BCD indicates that both laboratory and field modulus
values can be easily outputted from the device.
In order to obtain modulus and stiffness values from the LWD a falling weight is
dropped onto the device’s loading plate. The impact from the falling weight onto the
loading plate causes an impulse load on the compacted material. The resulting deflection
values from the loading plate are calculated and are immediately displayed on the device.
Assuming an elastic half space medium, the applied surface load and deflection
measurements are used to estimate elastic modulus of the tested layer. It is to be noted
that studies suggest that no three consecutive modulus values, measured at the same
location, should vary by 10%, nor should the number of drops conducted exceed 10 for a
single location [9].
Testing using the DCP consists of applying a force onto a pushing rod that drives
a cone tip into the soil layer. The device automatically records the number of hammer
blows and depth of penetration of the cone. The values obtained from the device can be
used to calculate the penetration rate of the cone. It is to be noted that in order to
determine the strength of the tested soil using the device necessary correlations must be
made between the penetration rate and modulus/strength of the soil [6]. Due to the
limitations of the device, if used to determine the compaction quality of pavement layers,
several correlations will be required in order to obtain the appropriate values.
Table 3 below ranks the alternative devices data processing and interpretation
requirements based on effort, time, and difficulty. It should be noted that a ranking of 1
Page 49
48
corresponds to the best device while 5 corresponds to the device associated with the most
tedious and difficult data processing and interpretation.
Table 3
Data Processing and Interpretation Requirements for Alternative Devices
Device Overall Ranking
GeoGauge 2
Non-Nuclear (PaveTracker) 3
BCD 1 (best)
LWD 5 (worst)
DCP 4
3.2.4 Sensitivity of Alternative Devices to Environmental Factors, Accuracy and Ease of
Use
Two major attributes were sought out in the devices selected for this study; those
included the devices ease of use and accuracy of results. In addition, it was essential that
the selected devices could be successfully operated in different environmental conditions.
Therefore it was necessary to conduct a literature review on previous studies pertaining to
the devices’ performance history to determine if the devices met these criteria.
Previous literature has reported many necessary specifications for using the
GeoGauge. As mentioned in a previous section, a thin layer of sand must be laid down on
the testing location prior to testing. In addition, calibrations must be made to the device
for specific materials. In the circumstance that the surface being testing is rough, the sand
Page 50
49
applied must be moist to ensure at least 75% contact with the surface. These studies
suggested that the positioning and use of the GeoGauge might be difficult depending on
the material being tested. Furthermore, the GeoGauge manual stated limitations for the
readings obtained using the device. These limitations included: (1) stiffness values in the
range of 3 to 70 MN/m, and (2) modulus values in the range of 26.2 to 610 MPa [27].
There are also concerns in regards to the device malfunctioning due to vibrations caused
by passing vehicles, such as compaction equipment or trains [23]. These restrictions
mentioned may limit the GeoGauge to only certain aggregates and locations, which can
make the device very challenging to use in this study.
Previous testing performed using the PQI concluded that the device was
problematic when the moisture content within the test area was high. Studies have
suggested that moisture levels must remain constant to obtain any type of meaningful
data [24]. It can be assumed that since both the PQI and the PaveTracker operate on
similar principles, the PaveTracker would most likely experience similar difficulties at
high moisture contents. These studies also concluded that the moisture content within the
test locations might negatively affect the PQI and PaveTracker results. In addition, as
previously mentioned, the procedure for using both devices require multiple readings and
prior device calibration, making the devices tedious to operate. The challenges presented
indicate that the PQI and PaveTracker might not be suitable devices for additional testing
in this study.
The process for operating the BCD is fairly simple in that an appropriate test spot
is located, a 50.1-lb. (223-N) load is applied onto the device, and an average modulus
value is outputted. The device automatically provides a modulus reading at 50.1-lbs.
Page 51
50
(223-N), so if one were to exceed this amount there would be no repercussions. Although
the device is easy to operate the device’s range for modulus is from 5 to 150 MPa [19].
Previous laboratory studies showed that the BCD could not be used on soils with
modulus values below 3 MPa due to bearing capacity failure [12]. In other words, the
device sinks into very soft soils under its own weight [19]. In addition, it has been
reported that in very stiff soils the bending of the device plate does not adequately
measure strains of the soil [19]. Overall, the BCD has been reported easy to use however,
the observations mentioned above suggested that the BCD may be limited to specific
soils, which may pose as a concern for this study in that four different types of materials
are utilized for testing.
Previous studies have suggested that many factors can influence the modulus
readings obtained using the LWD. These factors include: (1) falling mass, (2) drop
height, (3) plate size and contact stress, (4) type and location of the deflection transducer,
(5) usage of load transducer, (6) loading rate, and (7) bugger stiffness. These factors
suggest that the LWD might not provide accurate results due to the different types of
influences on the device. In addition, previous studies have also reported that the LWD
was sensitive to seasonal variations in pavement stiffness on both asphalt and gravel
surfaces. In order to ensure a uniform surface, it was recommended that sand be used for
the seating of the LWD and that up to 4-inches (10.2-cm) of compacted material be
removed prior to testing. It was also recommended that the testing be limited to
pavements with a gradient less than 5% [9]. The observations made in past studies
suggested that the environmental influences on the LWD might contribute the device’s
Page 52
51
poor performance. Therefore the LWD may not be suitable for additional testing in this
study as the device will be subjected to different types of testing conditions.
The DCP has been reported to be simple and economic, requiring minimum
maintenance, providing easy-to-access sites, and continuous measurements of the
penetration rate of the sample [6]. Based on the literature provided for the device, it has
been suggested that device is relatively easy to use, however, some studies conducted
using the DCP have indicated that the values obtained from the DCP are dependent on
the conditions in which testing is performed. In a previous study, testing was conducted
using the DCP on an asphalt surface, through a hole drilled into the asphalt surface, and
on a base layer stripped of its asphalt surface. Based on this study, it was concluded that
the results of the device varied between each method. Therefore in order to account for
the environmental effects on the device, it was recommended that the DCP test be
conducted through a drilled hole [5]. Although minor recommendations for testing have
been provided for the DCP, previous studies confirm the devices ease of use if used for
this study.
The ranking of the devices are tabulated in Table 4 below. This table illustrates
the individual rankings according to the environmental factors, accuracy, and ease of use
for each device. The overall rankings were determined by adding up the individual
rankings. The devices were ranked from the lowest total (the best device) to the highest
total (the worst device). Although the DCP and the GeoGauge were equivalent in overall
ranking, the DCP proved to have more established research and ranked the highest in two
categories opposed to the GeoGauge which ranked highest in only one category.
Page 53
52
Table 4
Sensitivity of Alternative Devices to Environmental Factors, Accuracy, and Ease of Use
Device Environmental
Factors Accuracy Ease of Use Overall
Ranking
GeoGauge 3 2 1 2 Non-Nuclear (PaveTracker) 4 4 2 4
BCD 2 3 3 3
LWD 5 5 5 5 (worst)
DCP 1 1 4 1 (best)
3.2.5 Cost of Utilizing Alternative Devices
For the purpose of determining the appropriate devices for additional laboratory
and field testing it was necessary to rank the devices according to price. This ranking
procedure was developed to facilitate selecting the devices for this study, if the decision
was based on the cost of utilizing the devices. The price of each device is tabulated in
Table 5 below. It should be noted that the devices for which pricing could not be found
are indicated with “N/A” in the table. For the commonly used NDG the price of the
device ranges from $8,000 to $9,000. The GeoGauge was a fairly expensive device at
$5000-$5500 according to Mooney et al. [26], or $6720 according to the device
manufacturer Humboldt [27]. Although the GeoGauge is expensive, it is less expensive
than the NDG. The cost of the BCD is listed as $14,065, making the BCD nearly twice as
expensive as the NDG. The LWD falls approximately in the same price range as the
NDG between $7,850 and $8,850. The cheapest device was one of the lower-end DCP
models sold by Humboldt at $545. The most expensive DCP models were listed at $1620.
It is worth noting that during testing it is required to replace the drive cone on the DCP,
as the cone may become lost within the sample. According to the device manufacturer
Page 54
53
Humboldt [27], each drive cone costs $32. However, even if the cost of the cones were
considered in the price for the most expensive models the DCP still ranks in as the
cheapest device. The low cost of the DCP can be attributed to the lack of electronics
required to operate the device. Based on the cost of the DCP in conjunction with the
previously discussed criteria on the DCP, it can be concluded that the DCP might a
suitable device for additional laboratory and field evaluation.
Table 5
Cost of Utilizing Alternative Devices
Device Cost
GeoGauge $6,720
Non-Nuclear (PaveTracker) N/A
BCD $14,065
LWD $7,850 - $8,850
DCP $545 - $1,620
3.2.6 Alternative Devices Ability to Account for Lower Layer Properties
An important factor to consider for the devices selected for this study is the
impact of lower layer properties on the devices measurements. In other words, it is
necessary to monitor the performance of each device on the test areas to determine if the
layers beneath the test location effected the measurements obtained from each device.
Based on the evaluation conducted for this criterion, the devices were ranked
appropriately.
Page 55
54
According to a previous study done, the GeoGauge was reported to measure
average modulus values up to 12-inches (30.5-cm) below the surface. In addition, the
GeoGauge was particularly sensitive to the top 2-inches (5.1-cm), and the seating
procedure required for the device [19] [20]. These results indicated that the GeoGauge
was able to account for impacts caused by lower layer properties at the layers closest to
the surface. It is to be noted that sufficient information regarding the impacts of lower
layer properties on the measurements for the PQI and the PaveTracker could not be
determined. According to a study conducted on the BCD, results suggested that device
had an influence depth ranging from 4.8 to 12.2-inches (12.2 to 30.9-cm) as the modulus
of the material increased from 3 to 300 MPa under large loads [4]. However, the actual
influence depth was much smaller under the normal testing load. The results of this study
suggest that the BCD is significantly influenced by the surface in which it is testing on;
therefore if used for this study the results obtained from the device may contain high
variability.
In a previous test conducted, the FWD was tested on an asphalt concrete layer to
determine the impact the layer had on the measured results. Based on the results of this
study, it was reported that the resilient moduli measured at a layer thickness less than
2.95-inches (7.5-cm) or at shallow bedrock were not accurate. Testing was also
performed using the LWD and the results of testing indicated that the device might not be
suitable for testing on thicker, stiffer foundations [6]. The conclusions made for the FWD
and LWD suggests that if tested on different samples, the thickness of the sample may
have an influence on the device’s measurements. This would pose a concern for this
Page 56
55
study, as the samples prepared for laboratory testing had a thickness of 12-inches (30.5-
cm).
Studies have also been conducted to evaluate the ability of the DCP to detect the
changes in the layers in which testing was performed on. In a previous study, the DCP
was tested on low volume road pavements in order to identify the strength and thickness
of different pavement layers of newly constructed roads [28]. The measurements obtained
from the DCP were compared with actual on site measurements. It is to be noted that an
evaluation of the tests were made for a period of two years and the changes in the
penetration resistance for different layers were also measured. Based on the results of this
study, it was concluded that the DCP was able to depict the number of pavement layers
and thicknesses of each layer. The results measured for the DCP varied within 10% of the
actual measurements. The observations made in this study suggest that, if used in this
study, the DCP would be able to detect the changes of the samples when compacted at
different density levels.
Table 6 below ranks each of the devices based on their ability to account for the
impacts of the lower layer properties on their measurements. The effect of the lower
layers influenced each device differently. Based on the literature, the DCP was the only
device that was capable of accounting for these lower layer properties. Furthermore, the
DCP was able to identify these layers as well, thus it was concluded that the DCP was the
best device to account for lower layer properties without loss of accuracy. As previously
mentioned, the lowest number correlates to the device best able to account for these
properties and the highest number corresponds to device least able to account for these
properties.
Page 57
56
Table 6
Alternative Devices Ability to Account for Lower Layer Properties
Device Overall Ranking
GeoGauge 2
Non-Nuclear (PaveTracker) 5 (worst)
BCD 3
LWD 4
DCP 1 (best)
3.2.7 Alternative Devices Ability to Correlate Representative Laboratory and Field
Moduli
For the purpose of this study, it was necessary that the selected devices could
adequately correlate representative laboratory moduli results to field moduli results. In
order to determine those that met this requirement a comprehensive literature review was
performed on the selected devices. Based on the findings of the literature review, the
devices were then ranked according to the success each had with correlating both results.
Based on a previous study field evaluations were conducted to determine the
practicality of utilizing the GeoGauge for compaction quality control in pavement
construction. Testing was performed on different flexible pavement layers including
HMA, base, and subgrade materials during construction. Additional testing was
performed upon completion of construction. The results of this study concluded that the
GeoGauge was capable of correlating laboratory and field moduli values. In addition,
both laboratory and field values were comparable to values obtained through a resilient
Page 58
57
modulus regression equation [20]. The observations made in this study suggested that the
GeoGauge could successfully correlate laboratory and field moduli results.
Studies have also been performed on the PQI and PaveTracker to determine if
these devices could be used to determine the density of HMA pavements. In this study,
both devices were utilized for laboratory and field testing. Comparisons were made
between the laboratory and field results for both devices to acceptable density values for
HMA. Results of this study indicated that the PaveTracker did not correlate well with the
measured core densities. The density readings obtained by the PaveTracker were
statistically different from the core densities in 68% of the projects cited [24]. It was also
reported that the PQI did not correlate well with measured core densities in that the
density values obtained using the device were statistically different in 54% of those
projects. Based on the observations made in this study it can be suggested that both the
PaveTracker along with the PQI could not effectively correlate between representative
laboratory and field moduli.
In order to validate the use of the BCD for compaction quality control in
pavement construction several studies have been performed using the device. As
previously discussed, a series of field tests were conducted using the BCD on six
different soil types and pavement bases [12]. Testing was also done on the same locations
using the PLT. In order to determine if the BCD accurately captured the modulus values
of these pavement layers, laboratory testing was conducted on prepared soil aggregate
samples. The field results obtained using the BCD were then compared to the PLT and
laboratory results. The results of this study indicated that both laboratory and field moduli
could successful be correlated to one another using the BCD.
Page 59
58
Throughout literature, multiple tests have been performed using the DCP to
validate the use of the device for measuring the modulus of pavement layers. The results
of these tests have been correlated to field moduli values measured using different non-
nuclear devices. Specifically, in a past study, DCP field and laboratory tests were
conducted in conjunction with the PLT. Results of these tests were then compared to field
results obtained using the FWD and to laboratory CBR test results [6]. The results of the
regression analysis discovered that the models developed for the DCP could successfully
predict the measured FWD results with a R-squared equal to 0.91 for both devices. In
addition, it was also observed that the results from the DCP tests correlated well with the
CBR values. The conclusions made through this study suggested that the DCP could
adequately evaluate the stiffness and strength of pavement layers if used for further
evaluation.
Table 7 below displays the ranking of how well each device performed with
correlating representative laboratory and field moduli results. The highest ranking
corresponded to the device that best correlated between laboratory and field moduli. The
devices with the lowest ranking represented those that poorly correlated these values.
Page 60
59
Table 7
Alternative Devices Ability to Correlate Representative Laboratory and Field Moduli
Device Overall Ranking
GeoGauge 3
Non-Nuclear (PaveTracker) 5 (worst)
BCD 1 (best)
LWD 4
DCP 2
3.2.8 Alternative Devices Ability to Account for Field Moisture and Density Variability
One of the main objectives developed for this study was to evaluate the NDG and
selected devices on their ability to account for different moisture contents and density
levels. In order to determine the sensitivity of the devices to these two factors a literature
review was conducted on the devices past performances. Based on the results of the
literature review the devices were then ranked according to their ability to account for
field moisture and density variability.
As previously mentioned, a study was conducted using the GeoGauge on different
dry sand and cohesion soil materials. Testing was performed on these materials to
determine if the GeoGauge measurements were consistent with soil mechanics concepts.
Based on the results of this study it was concluded that the stiffness measured from the
device decreased as the moisture content increased [2]. In addition, it was suggested that
the GeoGauge be calibrated prior to testing in order to account for moisture content. The
results of this study suggest that the GeoGauge is moisture sensitive and can detect the
Page 61
60
changes in the moisture within the tested area. Therefore, if used for additional laboratory
evaluation, the device could effectively account for the moisture variability between the
samples.
A study was conducted to evaluate if the PQI could be used to determine the
density of HMA pavements. In this study comparisons were made between laboratory
and acceptable density values of HMA and density values obtained from the PQI. The
laboratory tests conducted indicated that the PQI could detect changes in density of the
HMA for a single asphalt mixture. However, the device could not accurately detect
density when tested in the field. In addition, the PQI proved to be problematic when
operated at high moisture contents. In order to obtain meaningful data, the moisture level
of the tested area must remain constant [24]. Based on these observations, it was
suggested that if used for field testing the device would require certain correction factors
to correct for moisture and density variability.
It is to be noted that information regarding the impact of field moisture and
density variability could not be obtained for the PaveTracker. Based on the similar
operating principles, it can be assumed that a correlation can be made between the PQI
and the PaveTracker. Based on this assumption, it can be concluded that both the PQI and
PaveTracker both perform poorly when exposed to high levels of moisture within a
sample, therefore both may not be suitable for testing in this study.
Previous laboratory testing was conducted to evaluate the impact of moisture and
dry density on the results obtained using the BCD. In this study a series of compaction
tests were performed on laboratory prepared samples. The samples were prepared at
varying moisture contents in order to compare the variability of BCD modulus with
Page 62
61
moisture content and dry density. The results of this study indicated that the measured
modulus was 75% of the maximum. In addition, the BCD was more sensitive to moisture
content than to dry density [12]. Overall, this study suggests that the BCD is sensitive to
changes in moisture content and dry density; therefore it would be suitable for additional
testing in this study.
As previously established, the LWD is sensitive to cement-treated clay materials
[3]. This sensitivity was directly linked to the lack of moisture within the material. In
other words, the lack of moisture affected the strength gain with time for cement-treated
clays and caused shrinkage cracks near the surface of the material. These surface cracks
significantly affect the results of the LWD measurements. In addition, the LWD was also
sensitive to field moisture and density variability (i.e. void ratio changes) in which
calibration curves were necessary for accurate readings. Similar to the BCD results
previously discussed, it is concluded that the LWD was also sensitive to changes in
aggregate moisture content and density.
Based on previous literature, the DCP test results were influenced by the moisture
content, dry unit weight, and soil type. The DPI increases with the increase in moisture
content and it decreases with the increase in dry unit weight. The resilient modulus was
also influenced by the moisture content, dry unit weight, and soil type in that the resilient
modulus decreases with the increase in moisture content and it increases with the increase
in dry unit weight [8]. Based on the previous studies conducted using this device, it is
evident that the DCP is capable of detecting changes in the moisture and density within
the tested area. These capabilities of the DCP are crucial for the devices selected for
evaluation in this study.
Page 63
62
Table 8 below ranks each of the devices based on ability to account for the
impacts of field moisture and density variability on measured moduli. As previously
mentioned, the lowest number correlates to the device best able to account for these
properties and the highest number corresponds to the least able device. It should be noted
that all devices are sensitive to moisture content, thus the ultimate ranking was dependent
on the devices’ means to account for varying moisture contents. Likewise, devices also
sensitive to variable density received a lower ranking.
Table 8
Alternative Devices Ability to Account for Field Moisture and Density Variability
Device Overall Ranking
GeoGauge 1 (best)
Non-Nuclear (PaveTracker) 5 (worst)
BCD 2
LWD 4
DCP 3
3.2.9 Sensitivity of Alternative Devices to Various Levels of Compaction
As part of this study, one of the objectives developed was to evaluate the effect of
different compaction efforts on the testing results obtained from the NDG and selected
non-nuclear devices. Therefore, a literature review was conducted on the sensitivity of
the devices to various levels of compaction. Based on previous studies the devices were
than ranked accordingly.
Page 64
63
To account for the variability of compaction over short distances, it is suggested
that multiple measurements be taken using the GeoGauge. The data collected can then be
averaged together to obtain one measurement. In addition, it is suggested that
measurements using the GeoGauge be obtained in increments of 2-feet (0.6-m) or less, at
locations in a straight line of one another. In addition, oversampling was suggested as a
result of the variability in the compaction of the sample over short distances [27]. Based
on the previous studies done using the GeoGauge, it can be seen that there are many
recommendations for using the device in order to account for the variability in
compaction. Therefore it can be concluded that the device is sensitive to different levels
of compaction and if used in this study, the device will be capable of detecting changes in
the density of the compacted samples. It is to be noted that sufficient information
regarding the sensitivity of the PaveTracker, BCD, and LWD to various levels of
compaction could not be determined.
Through a comprehensive literature review it is evident that the DCP is also
sensitive to various levels of compaction. Previous studies reported the wear and tear of
the DCP cones used to penetrate the test area when repeatedly exposed to stiff materials.
This suggests that the DCP is capable of detected different levels of compaction. In
addition, previous literature discusses properly compacted granular base materials having
uniform penetration rate values. Furthermore, for lightly compacted materials the DCP
penetrate rates were higher. These results suggest that DCP was able to detect the
increase in strength and stiffness of the material as a result of compaction [27]. Based on
these studies, it is evident that the DCP has the ability to verify both the level and
Page 65
64
uniformity of compaction, making it a suitable device for additional laboratory and field
evaluation.
Table 9 below ranks each of the devices based on sensitivity of the device to
various levels of compaction. Devices that did contain sufficient information received a
ranking of 5 because, as previously stated, the lowest number correlates to the device
most sensitive to account for these properties and the highest number corresponds to the
least sensitive device.
Table 9
Sensitivity of Alternative Devices to Various Levels of Compaction
Device Overall Ranking
GeoGauge 2
Non-Nuclear (PaveTracker) 5 (worst)
BCD 4
LWD 3
DCP 1 (best)
3.2.10 Overall Ranking of Alternative Devices
The overall ranking of each device per criteria is presented in Tables 10
and 11 below. Table 10 presents the evaluation of each alternative device based on all
criteria, including the cost to utilize each device. Table 11 presents the same results,
however this evaluation eliminates the cost criteria. This was done in order to rank the
devices based on performance alone, if money was not a concern.
Page 66
65
Table 10
Evaluation of Alternative Devices Based on all Criteria
Device
Criteria Overall
Ranking One Two Three Four Five Six Seven Eight Nine
GeoGauge 3 3 2 2 2 2 3 1 2 2
Non-Nuclear
(PaveTracker)
5
5
3
4
5
5
5
5
5
5
(worst)
BCD 2 1 1 3 4 3 1 2 5 3
LWD 4 4 5 5 3 4 4 4 3 4
DCP 1 2 4 1 1 1 2 3 1 1 (best)
Page 67
66
Table 11
Evaluation of Alternative Devices Based on Non-Cost Criteria
Device
Criteria Overall
Ranking One Two Three Four Five Six Seven Eight Nine
GeoGauge 3 3 2 2 -- 2 3 1 2 2 (tie)
Non-Nuclear
(PaveTracker)
5
5
3
4
--
5
5
5
5
5
(worst)
BCD 2 1 1 3 -- 3 1 2 5 2 (tie)
LWD 4 4 5 5 -- 4 4 4 3 4
DCP 1 2 4 1 -- 1 2 3 1 1 (best)
3.3 Survey of State DOTs, Contractors and Manufacturers
In order to obtain the most recent feedback on the alternative devices and
opinions on transiting from density-based testing and towards modulus/stiffness-based
methods a survey was developed for this study. Prior to this thesis, the National
Cooperative Highway Research Program (NCHRP) released a substantial report on
alternatives to the NDG. Based on the results, it was reported that most state DOT
agencies still employ the NDG as their primary tool for the acceptance of unbound
subgrade and base/subbase layers. However, the study also reported that 44% of agencies
said they would move to a non-nuclear device and modulus-based quality control method
Page 68
67
because a nuclear certification was too inconvenient. Of the same group, 41% said
certification was also too expensive. 37% of this group mentioned safety concerns as
reasons for transitioning to modulus-based quality control. Based on the responses of the
NCHRP report, a set of survey questions was developed. The survey prepared for this
study can be found in Appendix A.
The survey presented in this chapter was developed using SurveyMonkey and was
sent out to state DOTS in Indiana, Iowa, Illinois, Louisiana, Minnesota, Missouri, and
Texas. In addition, the survey was sent to local (i.e., New Jersey) and national
contractors/manufacturers. The objectives of this survey included:
- Determine the problems and concerns of using nuclear and non-nuclear devices in
highway construction;
- Identify if other non-nuclear devices or modulus-based specifications are
currently used/considered for the near future;
- Identify technical and institutional issues that may lead to abandoning quality
acceptance based on nuclear methods; and
- Determining existing difficulties of using non-nuclear devices or challenges
transitioning to another acceptance methodology.
Unfortunately, only three responses were obtained from the developed survey.
The responses from the three respondents are presented in this section. Initially, state
DOT engineers were asked for their opinions on the factors that attributed to the
popularity of the NDG as a tool for compaction quality control. There was a general
agreement among the three respondents that NDG results were timely and easy to analyze
Page 69
68
and interpret. The second set of questions was to gauge the respondents’ views on the
drawbacks of the NDG. The two major drawbacks all respondents agreed on were (1) the
requirements for specialized/isolated storage, and (2) density measurements as opposed
to strength/modulus parameters. The drawbacks provided by the three respondents were
consistent with the major concerns, previously established in literature, with using the
NDG.
Survey respondents were then asked to rank the desired attributes sought out in
alternative devices. This ranking was based on a scale from 1-not important at all to 6-
extremely important. The responses are displayed in Table 12 below. The most essential
attributes that gained the highest ranking were repeatability and time needed for
measurements. In addition to the specific attributes surveyed, the respondents were given
a chance to provide an additional set of attributes they would like to have in an alternative
device. The attributes that the respondents mentioned were (1) devices that require simple
training to conduct testing, (2) devices that are simple and easily understood, and (3)
devices with no licensing requirements.
Page 70
69
Table 12
Surveyor Ranking of Alternative Device Attributes
Attribute Respondent
Number 1
Respondent
Number 2
Respondent
Number 3
Total
Ranking
Repeatability of measurements 62 6 6 12 Time for measurements 5 5 3 10
Ease of data processing 2 4 4 6
Sensitivity to environmental factors 3 2 1 5
Ease of use an accuracy 4 3 5 7
Cost 11 1 2 2 1 not important 2 extremely important
The three surveyors were then asked to provide opinions on the attributes of the
major alternative devices identified through the literature review. These devices included
the GeoGauge, PaveTracker, BCD, LWD, and DCP. The respondents were given the
option to skip questions regarding a specific device if they did not have prior knowledge
of the device. Unfortunately, all three respondents only had knowledge of the GeoGauge
and DCP. The results are listed in Tables 13 and 14 below.
The respondents were allowed to provide additional comments on both devices.
However, no comments were made for the GeoGauge. As for the DCP, respondents
mentioned that the device was easy to use, and did not required supervision during
testing. In addition, testing could be conducted at a later time and that the device was a
good diagnostic tool.
The disadvantage of using the DCP, as the respondents listed, was that the device
is sensitive to moisture. The results obtained through the provided survey were consistent
Page 71
70
with the literature review in that both the GeoGauge and DCP were practical devices and
might be suitable alternatives to the NDG.
Table 13
Surveyor Opinions on the GeoGauge
Attribute Respondent
Number 1
Respondent
Number 2
Respondent
Number 3
Accuracy & repeatability of measurements Disagree Neutral Disagree Ease of analysis and interpretation of results Disagree Neutral Agree
Output obtained in a timely manner Disagree Agree Agree
Portability of the device Neutral Agree Agree
Influence of environmental factors Neutral Neutral Disagree
Influence of lower layer properties Neutral Disagree Neutral
Readings are representative of field Neutral Neutral Neutral
Cost of device Neutral Neutral Disagree
Table 14
Surveyor Opinions on the DCP
Attribute Respondent
Number 1
Respondent
Number 2
Respondent
Number 3
Accuracy & repeatability of measurements Strongly Agree Agree Disagree Ease of analysis and interpretation of results Strongly Agree Strongly Agree Disagree
Output obtained in a timely manner Strongly Agree Strongly Agree Agree
Portability of the device Strongly Agree Strongly Agree Agree
Influence of environmental factors Strongly Agree Disagree Neutral
Influence of lower layer properties Neutral Agree Neutral
Readings are representative of field Strongly Agree Strongly Agree Agree
Cost of device Strongly Agree Strongly Agree Disagree
Page 72
71
Once the respondents provided their opinions on the GeoGauge, PaveTracker,
BCD, LWD, and DCP they were then asked to rank these devices on a scale of 1-being
an excellent alternative to the NDG to 5-being a very poor alternative to the NDG. It is to
be noted that “N/A” was listed for the respondents who had no prior
experience/knowledge with a particular device. The overall ranking of the alternative
devices is displayed in Table 15 below. Consistent with the previously literature review
the DCP achieved the highest ranking out of all the devices.
Table 15
Overall Surveyor Ranking of Alternative Devices
Alternative Device/Method Respondent
Number 1
Respondent
Number 2
Respondent
Number 3
GeoGauge 4 3 2
Non-Nuclear (PaveTracker) 4 5 N/A
BCD 4 4 4
LWD 4 2 4
DCP 1 1 2
Others N/A N/A N/A
The final segment of the survey asked the respondents to provide their opinion on
transitioning to non-nuclear alternative device and the factors that may hinder the
implementation of a new device. The results obtained from the three respondents are
displayed in Table 16 below.
Page 73
72
Table 16
Surveyor Opinions on Transitioning
Question Respondent
Number 1
Respondent
Number 2
Respondent
Number 3
Agencies interest in strength/stiffness device Moderate Substantial Extremely Agencies interest in implementing Moderate Substantial Extremely
Possibility of transitioning Maybe No Yes
From the results obtained through the survey, the respondents displayed an
interest in transitioning to an alternative device. However, all respondents commented on
factors that may hinder the possibility of transitioning towards an alternative non-nuclear
device. Respondents mentioned that a lack of familiarity as well as trained personnel with
the new device would keep agencies from transitioning. Furthermore, the devices
sensitivity to moisture poses as a major concern in transitioning.
Based on the literature review conducted in this study and the survey sent to state
DOT materials engineers, device manufacturers, and contractors, three devices were
selected for further investigation as an alternative to the NDG. The devices selected for
further laboratory and field assessment were the BCD, LWD, and DCP.
3.4 Description of Selected Devices
3.4.1 Briaud Compaction Device (BCD)
The BCD is a recently developed device and is a paid tester of soil modulus bear
the ground surface. The device is named after its inventor, Jean-Louis Briaud, F.ASCE of
Texas A&M University. Jen-Louis Briaud successfully developed the first prototype in
Page 74
73
2003, with the assistance of manufacturer Roctest. The device went through three
additional revisions before ultimately becoming a portable device sold by Roctest in 2007
[29].
The BCD consists of a 6-inch (15.2-cm) diameter flexible plate retrofitted with
eight radial and axial strain gauges, located at the bottom end of a rod. To operate the
device it is first placed on top of the layer being tested. The operator then gradually
applies a load of 50-lb. (222.4-N) magnitude onto the device handles. The flexible plate,
at the bottom of the rod, then measures the plate’s deformation as the load is applied onto
the device. Higher deformation values, measured by the device, usually indicate lower
modulus values for the compacted soil. According to the device manufacturer, it is
recommended that four measurements be taken 90o apart at one testing location for a
better reading [12]. The collected measurements are then automatically stored for
retrieval at a later time. A schematic of the BCD is shown in Figure 1 and a final
prototype of the BCD is illustrated in Figure 2 below.
The concept behind the device is simple in that the stiffer the soil is the less the
plate will bend and vice versa for softer soils. Therefore, the strain measurements of the
plate are directly related to the modulus of the soil beneath the device. All necessary
corresponding calibrations are done internally within the device [12].
Page 75
74
Figure 1. Initial BCD with Corresponding Plan View of Plate [12]
Figure 2. Final Prototype of BCD [12]
3.4.2 Light Weight Falling Deflectometer (LWD)
The LWD is a portable device utilized to determine the dynamic modulus of
compacted aggregate layers. The LWD was first developed in Germany and has been
Page 76
75
utilized during the construction of pavement foundations [10]. Due to its portability and
potential for estimating fundamental material properties, the LWD has gained much
attention for quality control during pavement construction. One of the most popular
LWDs is the Prima 100, developed by Carl Bro Pavement Consultants in Kolding,
Denmark. The LWD is operated under the ASTM E2583-07 specification [19]. The
procedure for using the LWD requires applying three seating loads onto a 7.8-inch (19.8-
cm) bearing plate using a standard weight of 22-lbs. (9.9-kg). Following the required
seating blows, a final dynamic load is applied freely onto the plate. The bearing plate,
containing geophone sensors, then measure the aggregate layer’s dynamic deflection
modulus caused by the impact of the falling weight. The device automatically outputs and
stores the measured deflection values. The measured deflection at the center of the plate
is then used to calculate the dynamic deformation modulus ELFWD using Boussinesq
equation as follows:
𝑬𝑳𝑭𝑾𝑫 = 𝒌(𝟏−𝒗𝟐)𝝈𝑹
𝜹𝒄
Equation 1
Where:
ELFWD = Dynamic deformation modulus
k = π/2 for rigid and 2 for flexible plates
υ = Poisson’s ratio, (default value of 0.35)
σ = Applied stress
R = Radius of the plate
δc = Center deflection
Page 77
76
3.4.3 Dynamic Cone Penetrometer (DCP)
Initially developed in South Africa for in-situ evaluation of pavements, the DCP
has been recently implemented in South Africa, United Kingdom, Australia, New
Zealand, and several states in the United States, specifically the U.S. Army Corps of
Engineers, for characterization of pavement layers and subgrades [6]. The device consists
of a 22.6-inch (57.5-cm) upper fixed rod with a 17.6-lb. (8-kg) falling mass. At the
bottom of the device is a lower 0.63-inch (16-mm) diameter rod containing an anvil and
0.79-inch (20-mm) diameter steel cone with an apex angle of 60 degrees [6]. A schematic
of the device can be seen in Figure 3 below. The DCP test is conducted according to
ASTM D6951 or ASTM D7380 standards. The DCP requires two operators, one for
lifting and dropping the hammer and one for measuring and recording the penetration
depth for each blow [8].
Operation of the device requires dropping the standard hammer weight of 17.6-
lbs. (17.9-kg) from a height of 22.6-inches (57.4-cm) onto the anvil attached to the top of
a pushing rod. The force from the weight onto the pushing rod then drives the cone tip
into the soil layer. The device then records the number of hammer blows and the depth of
penetration into the soil. The number of blows recorded can be plotted against depth to
obtain the penetration rate (mm/blow), which can then calculated and correlated to the
modulus and strength of the tested pavement sections [6]. The DCP results are usually
normalized with penetration depth. Therefore, it can be hypothesized that the higher
number of blows required to penetrate 12-inches (30.5-cm) of soil, the better the
compaction applied is. The DCP utilized in this study was retrofitted with an automatic
Page 78
77
ruler that recorded and stored the penetrated depth and number of blows applied to the
samples.
Figure 3. Schematic of the DCP [6]
Page 79
78
Chapter 4
Materials Description
4.1 Introduction
This chapter discusses the four aggregate types that were utilized to facilitate
laboratory and field testing. In addition, this chapter presents the material properties
determined for each aggregate. The aggregates selected for this study included two
subgrade soils, natural sand 1 (NAT-1) and natural sand 2 (NAT-2), as well as two
base/subbase materials, dense graded aggregate (DGA) with RAP and recycled concrete
aggregate (RCA). The different aggregate types selected for this study were necessary for
evaluating the impact of aggregate type on the testing results obtained from the non-
nuclear devices and the NDG.
4.2 Material Properties
4.2.1 Gradation
Upon collecting the material, testing was conducted to determine the particle size
distribution (PSD) of the selected aggregates. Figure 4 below presents the PSD for NAT-
1, NAT-2, DGA, and RCA materials respectively. As can be seen from this figure, both
subgrade soils (NAT-1 and NAT-2) can be classified as gap-graded while both
base/subbase materials (DGA and RCA) had a well-graded gradation. It can also be
observed from Figure 4 that both DGA and RCA materials had lower percent passing
values at large sieve openings when compared to percent passing values for both NAT-1
and NAT-2 at the equivalent sizes. This suggests that the base/subbase aggregates had a
Page 80
79
higher percentage of coarse materials (i.e., having a size larger than a No. 4 sieve
opening) than did both subgrade aggregates. In addition, all four aggregates did not have
a significant amount of very fine materials (passing sieve No. 200).
100%
90%
80%
70%
60%
50%
40%
30%
20%
10%
0%
0.1 1.0 10.0 100.0
Sieve Opening Size (mm.)
Figure 4. Particle Size Distributions Obtained for Selected Aggregates
4.2.2 Moisture-Density Relationship
The moisture-density relationship for each material was determined in accordance
to the modified Proctor test [30]. NAT-1 and NAT-2 materials were first separated into
two groups: (1) material passing the No 4 sieve, and (2) materials retained on the No. 4
Natural Sand 1
Natural Sand 2
Dense Graded Aggregates
Reclaimed Concrete Aggregates
Per
cen
t P
ass
ing
(%
)
Page 81
80
sieve. Using the material passing the No. 4 sieve, five samples were prepared at different
moisture contents. The moisture contents selected ranged from 5 to 15% by weight of dry
mass. For each of the samples, the material was placed in a 4-inch (10.2-cm) diameter
compaction mold using a five-layer scheme. Each layer was then subjected to 25 blows
using a compaction hammer. Similar procedures were utilized for both base/subbase
materials (DGA and RCA), however the materials were initially separated into two
groups: (1) larger than ¾-inch and (2) smaller than ¾-inch. Samples were prepared using
the materials smaller than ¾-inch in a similar five-layer scheme. However, each layer
was subject to 54 blows using the compaction hammer. Figure 5 below presents the
moisture-density relationships obtained for all selected aggregates. Testing using the
Proctor test yielded an average OMC of 9.7% and MDD of 110 lbs./ft.3 for NAT-1. An
OMC of 9.65% and MDD of 120 lbs./ft.3 were obtained for NAT-2. DGA material had an
average of 8.7% OMC achieving a MDD of 125 lbs./ft.3. The RCA had an OMC of
10.7% and MDD of 138 lbs./ft.3.
Page 82
81
Figure 5. Moisture-Density Relationships for Selected Aggregates
Page 83
82
Chapter 5
Laboratory Sample Preparation & Testing Methodology
5.1 Introduction
This chapter includes a description of the sample preparation procedure developed
for laboratory testing. In addition, the laboratory testing plan prepared to evaluate the
effect of different measured parameters on the testing results obtained from the NDG and
selected non-nuclear devices are discussed in detail. These measured parameters include:
(1) moisture content, (2) compaction effort applied, (3) aggregate type, and (4) delayed
testing. The laboratory facility utilized to conduct testing on the selected devices was
located at Advanced Infrastructure Design (AID) in Trenton, New Jersey. In addition, the
sections selected for field testing are also presented in this chapter.
5.2 Laboratory Sample Preparation Procedure
In order to evaluate the effect of aggregate type, moisture content, compaction
effort, and delayed testing on the results obtained from the NDG and the other three
selected devices it was necessary to develop a laboratory compaction procedure for
preparing large aggregate samples. The compaction procedure established allowed the
different test results to be compared when the moisture content, compaction efforts, and
aggregate types were varied between samples. It is to be noted that the Proctor moisture-
density relationships (discussed in the previous chapter) were utilized when determining
the appropriate moisture and density levels required for preparing each sample. A
detailed description of the step-by-step laboratory sample compaction procedure
performed is presented in the following subsections.
Page 84
83
5.2.1 Drying of Selected Aggregates
Prior to compacting the aggregate samples, it was necessary to air-dry the
material being used. Depending on the amount of samples being prepared at the time, the
aggregates were spread onto an open floor within the laboratory. It is to be mentioned
that two samples required roughly 1,000-lbs. (453.6-kg) of material to completely fill
both molds. The aggregates were then air-dried under ambient temperature for about a
week. The aggregates were periodically raked throughout the week to ensure the material
was uniformly dried. This raking method was also performed to confirm that the moisture
content within the aggregates was lower than the moisture content being targeted for that
sample.
5.2.2 Determined Moisture Content of Aggregates
Upon completion of drying the material, the required moisture content for the
aggregates was calculated. This was completed by first collecting moisture samples from
the air-dried aggregates. Depending on the amount of material being dried, typically five
to six samples were collected to determine the existing moisture content of the
aggregates. It is worth mentioning that these samples were taken at random throughout
the material to ensure that an average moisture content was being computed. The weights
of the moist aggregates were measured and the samples were dried in an oven that was
preheated to 300oF.
After an hour of drying, the samples were then removed from the oven and the
weights of the dried aggregates were measured. Based on the dry weights determined for
each sample, an average moisture content was computed for the material. This average
Page 85
84
moisture content was used in determining the amount of water needed to reach the
targeted moisture content for the aggregates. As an example, if the targeted moisture
content of NAT-1 was 9.7% and the existing moisture of the material was 2% then
roughly 7.7-lbs. (3.5-kg) of water was required for every 100-lbs. (45.4-kg) of material
used. It was crucial to calculate the amount of water needed to reach the target moisture
content to ensure that the molds were prepared at the appropriate moisture content and
not at moisture contents significantly below/above the target. In addition, the determined
amount of water required for every 100-lbs. (45.4-kg) of material was utilized during the
mixing and placement of the aggregates to be discussed in the following subsection. An
average moisture content was determined for all the aggregates prepared in this study.
5.2.3 Mixing and Placement of Aggregates
Once the amount of water required to reach the targeted moisture content was
determined, the water was mixed with the air-dried aggregates. The aggregates were
mixed for five minutes using a concrete mixer to ensure that the water was uniformly
distributed within the aggregates.
Using a mallet, blows were repeatedly applied to the sides of the mixer to ensure that the
material did not adhere to the inside walls during mixing. The concrete mixer utilized for
this study is illustrated in Figure 6a below.
Once the aggregates were mixed with the required amount of water, the
aggregates were then weighed and placed into the mold. Depending on the material and
quantity of water used for each material, each lift required approximately 100 to 130-lbs.
Page 86
85
(45.4 to 58.9-kg) of dry aggregates. Additional information regarding the weight of each
lift is discussed in the following subsection.
The mixing procedure described in this section was performed three times for
each sample. This was done in order to place the aggregate in three consecutive 4-inch
(10.2-cm) thick lifts. Moisture samples were taken between each mixing process to
confirm that the targeted moisture content was reached for each lift.
5.2.4 Compaction of Aggregates
Each sample prepared for this study was prepared in a large aluminum mold that
was 24-inches (60.9-cm) in length, 17-inches (43.2-cm) wide, and 12-inches (30.5-cm)
deep. An illustration of the aluminum molds used for the samples is presented in Figure
6c below. As previously mentioned, the aggregates were placed in three 4-inch (10.2-cm)
thick lifts. Depending on the parameter being evaluated (i.e., moisture content or
compaction effort) the amount of aggregates needed for each lift was determined based
on three factors: (1) the aggregate moisture-density relationship, (2) mold and lift
dimensions, and (3) targeted moisture content/density level. For example, if the targeted
moisture content for the material was the OMC then the proctor MDD and volume of the
mold (2.82 ft2) was utilized for calculating the required weight per lift using the known
density-mass-volume relationship.
Similarly, this procedure was implemented for samples at varying compaction
efforts; however density values significantly higher/lower than the MDD were selected
and used for computing the required lift weights. As an example, if the targeted density
for NAT-1 was below MDD (112 lbs./ft.3) then 105 lbs./ft.3 was used to calculate the
Page 87
86
necessary lift weight. The density values selected for these samples are discussed in the
following chapter.
Once the required lift weights were determine, the aggregates were weighed and
placed into the aluminum molds. A manual steel tamper was used to compact the samples
prepared at OMC and above/below OMC. It is to be noted that for samples prepared at
higher/lower compaction effort either a manual steel tamper or jackhammer was used.
Figure 6b below illustrates the steel tamper used to compact the samples. Once each lift
reached a thickness of 4-inches (10.2-cm) the compaction process was deemed complete.
This process was repeated two additional times to completely fill the 12-inch (30.5-cm)
thick mold with aggregates.
5.2.5 Verified Compaction Quality
The moisture content and density values measured before and after the
compaction process was used to verify the quality of the compaction procedure
implemented for the aggregate samples. As mentioned previously, throughout the mixing
process, moisture samples were collected for each lift. These samples were used to
confirm whether the targeted moisture content was reached for each mold. Based on the
moisture samples collected for each lift, an average moisture content was calculated and
the results were compared to the targeted moisture content. Based on these results, it was
observed that the actual moisture contents measured were within ±0.5% of the targeted
moisture content.
In addition, following compaction, testing was conducted on each sample using
the NDG. The density values measured using the NDG were used to verify whether the
Page 88
87
targeted density was achieved. This was achieved by comparing the density values
obtained from the NDG to the density values calculated using the three lift weights and
mold volume. The comparison between these values confirmed that the density of
samples were within ±5 lbs./ft.3 of the targeted value for all aggregate types. Based on the
analysis conducted, it was confirmed that the aggregate samples prepared for laboratory
testing were adequately compacted.
Page 89
88
(a) (b)
(c)
Figure 6. Equipment Used for Sample Preparation;
(a) Concrete Mixer, (b) Compaction Steel Tamper; and (c) Sample Mold
Page 90
89
5.3 Laboratory Testing Plan
5.3.1 Effect of Moisture Content
In order to evaluate the effect of moisture content on the testing results obtain
from the NDG and non-nuclear devices three moisture levels were selected. These
moisture contents included the OMC, 2% higher than OMC, and 2% lower than OMC.
The corresponding densities for each aggregate, as previously determined using the
Proctor moisture-density relationships, were then used to determine the weight required
for each lift during the mold compaction procedure to be discussed in the following
section. For each aggregate type two large samples were compacted for all moisture
contents. It should be noted that, in order to account for any possible variability in the
testing results, two samples were prepared for each aggregate type and averaged together
to obtain one measurement. The compacted samples were then tested using the NDG,
BCD, LWD, and DCP devices immediately (i.e., within 1 hour) after compaction, 24
hours after compaction, and 48 hours after completion of compaction. This testing
scheme was implemented to evaluate the effect of delayed testing on the results collected
from these devices. Table 17 below presents the moisture contents selected for evaluated
for the NAT-1, NAT-2, DGA, and RCA materials respectively.
5.3.2 Effect of Compaction Effort
In order to evaluate the impact of different compaction efforts on testing results
obtained from the NDG and non-nuclear devices three density levels were selected for
the compacted samples. It is to be noted that all samples compacted to evaluate the effect
of compaction effort were kept at constant moisture content (i.e., the OMC). Initially, the
Page 91
90
Proctor test moisture-density relationships were developed using higher/lower
compaction efforts (i.e., 50% higher/lower blows than standard number of blows) to
obtain the density value needed to prepare samples at higher/lower compaction efforts.
However, these relationships yielded densities that were within ±5 lbs./ft.3 of the values
determined using the Proctor standard number of blows. To ensure truly applying
distinctive compaction efforts, density levels were selected based on the density results
obtained through testing at the Proctor MDD rather than using higher/lower compaction
efforts. The densities selected for testing included the Proctor MDD, 5 to 20 lbs./ft.3
higher than MDD, and 5 to 15 lbs./ft.3 lower than MDD. The specific density values used
to evaluate the effect of compaction effort on the testing results for each material are also
presented in Table 17 below.
Table 17
Target Moisture and Density Values Utilized for Compacting the Selected Aggregate
Types
Experiment Level Tested NAT-1 NAT-2 DGA RCA
Effect of
Moisture
Content (%)
2% Below OMC
Opt. Moist. Cont.
2% Above OMC
7.7
9.7
11.7
7.7
9.7
11.7
6.7
8.7
10.7
8.7
10.7
12.7
Effect of Compaction
Effort*
(lbs./ft.3)
Below MDD
Max. Dry Density
Above MDD
105
112
120
105
120
135
115
125
145
115
125
130 * Moisture contents were kept constant at OMC.
Page 92
91
5.4 Field Testing Plan
5.4.1 Selected Field Sections
In addition to laboratory prepared samples, the testing plan prepared for this study
involved evaluating field-compacted unbound subgrade and base/subbase layers using the
NDG and non-nuclear devices. For the purpose of this study, three 100-ft (30.5-m) long
field sections were selected for testing.
The first two 100-ft (30.5-m) long sections were located at the Route 35
Restoration Project located in the boroughs of Mantaloking, Lavalette and Ocean Beach,
New Jersey. Testing was conducted on the stretch from milepost 4.0 – 9.5. The two 100-
ft (30.5-m) long sections consisted of a compacted NAT-1 soil layer overlaid with a
compacted DGA layer. It should be noted that the first 100-ft (30.5-m) section located
along 6th Ave was tested immediately following fine grading, 24 hours, and 48 hours
after preparation. The second 100-ft (30.5-m) long section was tested prior to
compaction, immediately after preparation, 24 hours, and 48 hours after. Reference
densities of 143.7 lbs./ft3 and 123.7 lbs./ft3 for both sections were provided on site.
The third field section was located at Interstate 295 at the divide between I-295
and I-76 in Haddon Heights, New Jersey. The third section consisted of a NAT-2
subgrade layer overlaid with an RCA base layer. Around 30 points within each field
section were evaluated using the NDG and non-nuclear devices. It is worth mentioning
that due to the limitations of construction all field sections were tested at constant
moisture content. In addition, moisture content samples were only collected for the first
two field sections.
Page 93
92
Chapter 6
Analysis of Laboratory Testing Results
6.1 Introduction
This chapter presents the results collected for the samples compacted at different
moisture contents and density levels. The effect of moisture content, compaction effort,
delayed testing, and aggregate type on the test results measured using the NDG and non-
nuclear devices are also discussed in this chapter. This chapter also presents the results of
a multi-factor analysis of variance (MANOVA) conducted to evaluate the significance of
these factors on the NDG and selected devices. It is worth mentioning that this analysis
was performed using the Statistical Package for Social Sciences (SPSS). In addition, all
error bars shown in the figures below represent a 95% confidence interval of the mean.
6.2 Effect of Moisture Content
Figure 7 below presents the testing results obtained from the NDG and non-
nuclear devices on compacted samples prepared at varying moisture contents (i.e., 2%
below OMC, at OMC, and 2% above OMC). The results in Figure 7a represent the
density values obtained using the NDG for all aggregate samples. In the case of NAT-2
and RCA the density values for samples compacted at 2% below and 2% above OMC
were lower than those samples compacted at OMC. This trend was expected for it
follows the same trend that is observed in the laboratory conducted Proctor tests.
Meaning, the density of the samples is expected to be the highest when compacted at
OMC. This trend was also observed for NAT-1 and DGA samples compacted at 2%
below OMC, however this trend was not observed for those samples compacted at 2%
Page 94
93
above OMC. These density values for NAT-1 and DGA samples were slightly higher
(within 2 lbs./ft3) than those samples compacted at 2% below and OMC. Although the
results for NAT-1 and DGA do not follow the expected moisture-density relationship
trends, it is believed that the NDG might not be sensitive enough to detect changes in the
density of the samples when increasing/decreasing the moisture by only 2%. This
assumption is also observed for the results obtained for NAT-1 samples compacted at
OMC in that the densities measured for these samples ranged between 105 to 112 lbs./ft3,
which are overlapping with the results obtained for samples compacted at 2% above
OMC. A similar observation can be seen for DGA samples compacted at OMC and 2%
above OMC. In addition, the Proctor moisture-density relationships for NAT-1 material,
presented in Figure 7a, showed variability within 3 lbs./ft3 when the moisture content was
increased/decreased by 2% from the OMC.
The modulus results obtained using the BCD on the aggregate samples are
presented in Figure 7b below. As seen in this figure, the modulus values for the DGA and
RCA aggregates increased when the moisture content of the samples increased. However,
in the case of the NAT-1 and NAT-2 aggregates, the modulus of samples decreased when
the samples moisture content increased. The results obtained for the BCD might suggest
that the device is sensitive to changes in the moisture content within the samples. The
observations made for all aggregates types can be attributed to the general nature of the
device during testing. The conclusions made from the study conducted by Weidinger et
al. [4] suggest that the placement of the BCD must be near perfect to ensure accurate
results. This observation might explain the different results obtained for DGA and RCA
as these aggregates contain larger aggregate particles than the natural sand materials,
Page 95
94
therefore the placement of the device may have been skewed. In addition, Nazzal et al.
[10] concluded that the BCD results might be affected when tested on very soft materials.
The conclusions made from Nazzal et al. [10] might also explain why different trends
were observed for the natural sand samples.
It is also worth noting that the high variability observed for all aggregates can be
credited to the variability of each individual measurement collected from the BCD. To
further explain, as mentioned in the previous chapters, four modulus values are measured
using the BCD at one location within the sample. As can be seen in Figure 7b, the four
modulus values measured varied significantly (between 5 and 35 MPa) for all aggregate
samples. Therefore, the high variability observed might also be the reason why the DGA
and RCA data do not show a similar trend to those seen for the NAT-1 and NAT-2
samples. In addition, the modulus values obtained for NAT-1 and NAT-2 were
significantly greater (between 15 and 30 MPa) than those obtained for DGA and RCA
(between 7 and 11 MPa) indicating that the BCD was able to detect the changes between
aggregate types.
Figure 7c below presents the modulus values obtained using the LWD on all
aggregate samples. As can be seen in this figure, the modulus values obtained for NAT-1
and RCA were similar at all moisture levels (i.e., 2% below OMC, at OMC, and 2%
above OMC). The observations made for both of these aggregates suggests that the LWD
was not influenced by changes in the sample moisture content when prepared at 2%
below or 2% above the OMC. However, for the NAT-2 and DGA aggregates, the
modulus values measured decreased as the moisture content of the samples increased. For
these specific aggregate types, the LWD was able to capture the changes in modulus as
Page 96
95
the moisture content of the samples increased. The mixed trends observed for the LWD
can be attributed to several different factors such as the change in the samples moisture
content as well as the different aggregate types.
Based on previous reports, the results of the LWD might have also been
influenced by the size of the mold utilized for the compacted samples. In this study,
samples were prepared in a mold that was 12-inches (30.5-cm) thick and 17-inches (43.2-
cm) wide. Based on the study conducted by Nazzal et al. [10], the LWD was reported to
have an influence depth ranging between 10.6 to 11-inches (26.9 to 27.9-cm). Although
the mold utilized in this study was larger than the reported influence depth, it was not
significantly larger (about 1-inch (2.5-cm) larger); therefore the LWD results might have
also been influenced by the mold size. The observations made by Nazzal et al. [10] might
further explain the mixed trends observed for the LWD results presented. Similar to the
observations made for the BCD, Figure 7c shows that the LWD was capable of capturing
the differences between the aggregate types.
The number of blows required to penetrate the 1-foot (30.5-cm) thickness of the
compacted samples using the DCP are presented in Figure 7d below. As can be seen from
the figure, the number of blows for NAT-2 decreased (from 4 to 2 blows) as the moisture
content of the samples increased. The DCP blow count also decreased, as moisture
increased, from 15 to 5 blows for DGA and from 26 to 23 blows for RCA respectively.
This trend observed was expected as a result of the lubricating effect that water has on the
device’s performance. In other words, as the water in the samples increase, the frictional
resistance of the penetrating cone decreases; therefore fewer blows are needed to
penetrate the soil. In the case of NAT-1, the number of blows increased (from 5 to 6) as
Page 97
96
the moisture in the sample increases. Although the results for NAT-1 do not follow the
similar trend observed for NAT-2, DGA, and RCA it can be inferred that the DCP might
not have been able to detect changes in moisture content for that particle mold sample.
The overall observations made for the DCP suggests that the device is influenced by the
change in the moisture content in the samples up to 2% below/above OMC.
The results presented in Figure 7d also show that the DCP values for both natural
sands (NAT-1 and NAT-2) were lower than those measured for the dense graded
aggregates (DGA and RCA). The measured DCP blows for both natural sands ranged
between 1 and 6 blows. However, in the case of DGA and RCA, the measured DCP
blows ranged from 12 to 26 blows. This observation was expected as both DGA and
RCA aggregates contain larger sized particles and have a well-graded dense gradation;
therefore more blows are needed to penetrate these materials. The high variability
observed for DGA and RCA can be attributed to the device’s performance on larger sized
particles. In the study conducted by Nazzal et al. [19], it was suggested that the DCP not
be tested on large particles as the device may tilt inevitably affecting the testing results.
This conclusion might explain why higher variability is observed for the DGA and RCA
aggregates than for both natural sand materials. Nonetheless, the results obtained for the
device indicate that the DCP is capable of capturing the differences between the selected
aggregates types.
Page 98
2% Below OMC
At OMC
2% Above OMC
2% Below OMC
At OMC
2% Above OMC
Blo
ws
Mea
sure
d U
sin
g D
CP
(B
low
s)
Mo
du
lus
Mea
sure
d U
sin
g B
CD
(M
Pa
)
135 45
130 40
35
125 30
120 25
115 20
15 110
10
105 5
100
NAT-1 NAT-2 DGA RCA
Aggregate Type
0
NAT-1 NAT-2 DGA RCA
Aggregate Type
45 40
40 35
35 30
30 25
25 20
20
15 15
10 10
5 5
0
NAT-1 NAT-2 DGA RCA
Aggregate Type
0
NAT-1 NAT-2 DGA RCA
Aggregate Type
(c) (d)
Figure 7. Effect of Moisture Content on Testing Results; (a) NDG Results, (b) BCD Results, (c) LWD Results; and (d) DCP Results
(b) (a)
2% Below OMC
At OMC
2% Above OMC
2% Below OMC
At OMC
2% Above OMC
97
Mo
du
lus
Mea
sure
d U
sin
g L
WD
(M
Pa
) D
ensi
ty M
easu
red
Usi
ng N
DG
(lb
s./f
t.3)
Page 99
98
6.3 Effect of Compaction Effort
The results presented in Figure 8 below, represent the testing conducted on
samples prepared at different density levels (i.e. below MDD, at MDD, and above MDD)
using the NDG, BCD, LWD, and DCP. As can be seen in Figure 8a the density values
measured using the NDG were the lowest for samples prepared at density levels below
MDD. In addition, the densities were highest for the aggregate samples prepare at density
levels above MDD. This observation was expected because as the density of the samples
increase, the density as measured using the NDG should also increase. It is to be noted
that these observations were made for all aggregate types.
The results presented in Figure 8a show that the differences between the NDG
density values for the aggregates samples compacted at MDD and above MDD were
within 3 lbs./ft3. In addition, the density values measured for the NAT-2, DGA, and RCA
aggregates we significantly lower (i.e., 13 lbs./ft3) than the targeted values established in
Table 17. Only in the case of NAT-1 was the measured density slightly lower (i.e., 4
lbs./ft3) than the targeted density of 120 lbs./ft3. However, to ensure that significantly
higher targeted densities were obtained, a jackhammer was utilized to compact samples at
density levels above MDD. Therefore, based on the observations made for the selected
aggregates in conjunction with expected outcome of implementing a jackhammer for
compaction, the results presented might suggest that the NDG was not capable of
detecting the changes in density levels between MDD and above MDD.
Figure 8b presents the modulus values obtained using the BCD on the aggregate
sample prepared at different compaction efforts. As can be seen in the figure below, the
modulus values for all aggregate types were statistically similar (i.e., within 5 MPa) at all
Page 100
99
density levels. Based on the results obtained from the BCD it can be concluded that
device was not capable of capturing the differences in the density levels selected for the
compacted samples in this study. In addition, significant differences can be observed for
BCD modulus values obtained for the natural sand aggregates (gap-graded) with those
obtained for the DGA and RCA aggregates (dense-graded). Specifically, the BCD
modulus values obtained for both NAT-1 and NAT-2 were similar in that they both
measured around 20 MPa. For the case of DGA and RCA, the BCD modulus values were
around 10 to 15 MPa. This observation suggests that the BCD is capable of detecting the
differences in the aggregate sizes and gradations.
The high variability of the results that is observed for each aggregate type can be
attributed to the general variability experienced during testing using the BCD on different
soil types. Based on the previous report conducted, Nazzal et al. [19] concluded that the
bending of the BCD plate on very stiff soils did not accurately measure the modulus of
the samples (i.e., higher compaction). In addition, Briaud et al. [12] suggested that the
BCD not be used on very soft soils (i.e., lower compaction) for the device may sink under
its own weight, affecting the measured results. The high variability of the results can also
be attributed to the high variability of the sample moisture content (i.e., between 1 and
4%) from the targeted moisture content that was observed for the dense graded
aggregates. The observations made through both studies suggest that the BCD might be
slightly influenced by different compaction efforts, however for this study, the BCD was
not capable of detecting the changes in compaction efforts.
Figure 8c below presents the LWD modulus values measured for samples
compacted at varying density levels. As can be seen in the figure, the modulus values for
Page 101
100
NAT-1 and NAT-2 (gap-graded) were higher for samples compacted at MDD than those
samples compacted at density levels below MDD. This observation was expected because
as the compaction effort of the samples increase, the measured modulus should also
increase. However, it should be noted that this trend was not observed for the DGA and
RCA aggregates (dense-graded). In the case of DGA and RCA samples compacted at
MDD and below MDD, the modulus values obtained using the LWD were similar (i.e.,
within 5 MPa). These observations made for the LWD suggests that the device might be
influenced by the changes in aggregate type between samples.
As previously mentioned, the LWD modulus values measured for the NAT-2 and
DGA aggregates decreased as the moisture content in the samples increased. This similar
trend was observed for both materials in that as the density of the samples increased the
modulus values decreased. This trend is expected because the higher density may suggest
a higher degree of saturation within the sample, which would result in a lower modulus
value. Based on these findings, it is concluded that the LWD is able to detect changes in
the compaction effort applied to the samples. However, in the case of NAT-1 and RCA,
the modulus of the samples increased as the compaction increased. Although these results
do not follow the similar trends observed for NAT-2 and DGA, these results further
suggest that the LWD is capable of detecting changes in density in the samples. As
previously mentioned, the mixed trends obtained at samples compacted at density levels
above MDD can be attributed to the effect the mold size has on the performance of the
LWD.
Figure 8d below presents the DCP number of blows required to penetrate the 1-
foot (30.5-cm) thick samples compacted at different density levels. As can be seen from
Page 102
101
this figure, the number of DCP blows increased as the density level increased for all
selected aggregates. The observations made for the DCP results indicate that the device
was able to capture the differences between compaction efforts applied between samples.
The trend observed for all aggregates types was expected in that the denser the aggregate
structure is the harder it is to penetrate; therefore a higher number of blows are required
for the soil.
The results presented in the Figure 8d also show that the DCP blows measured for
both natural sands (NAT-1 and NAT-2) were lower than those values obtained for both
dense graded aggregates (DGA and RCA). It is worth mentioning that these differences
for the selected aggregates types are more substantial at higher compaction levels than
lower compaction levels.
The observations made for the results of the DCP were consistent with the study by
Humboldt et al. [27], in that penetration rates measuring using the DCP were higher for
lightly compacted materials. Based on these findings, it can be concluded that the DCP is
capable of detecting both changes in density levels as well as aggregate type between the
different samples.
Page 103
Below Max. Dry Density
At Max. Dry Density
Above Max. Dry Density
Below Max. Dry Density
At Max. Dry Density
Above Max. Dry Density
Blo
ws
Mea
sure
d U
sin
g D
CP
(B
low
s)
Mo
du
lus
Mea
sure
d U
sin
g B
CD
(M
Pa
)
135 45
130 40
35
125 30
120 25
115 20
15 110
10
105 5
100
NAT-1 NAT-2 DGA RCA
Aggregate Type
0
NAT-1 NAT-2 DGA RCA
Aggregate Type
45 40
40 35
35 30
30 25
25 20
20
15 15
10 10
5 5
0
NAT-1 NAT-2 DGA RCA
Aggregate Type
0
NAT-1 NAT-2 DGA RCA
Aggregate Type
Figure 8. Effect of Compaction on Testing Results; (a) NDG Results, (b) BCD Results, (LWD) Results, and (d)
DCP Results
(d) (c)
(b) (a)
Below Max. Dry Density
At Max. Dry Density
Above Max. Dry Density
Below Max. Dry Density
At Max. Dry Density
Above Max. Dry Density
102
Mo
du
lus
Mea
sure
d U
sin
g L
WD
(M
Pa
) D
ensi
ty M
easu
red
Usi
ng N
DG
(lb
s./f
t.3)
Page 104
103
6.4 Effect of Testing Time on Accuracy and Repeatability of Selected Devices
Figure 9 below presents the testing results obtained from the NDG, BCD, LWD,
and DCP on the compacted samples prepared at OMC and MDD. The results presented
were obtained immediately after the samples were compacted (i.e., 1 hour), 24 hours, and
48 hours following compaction. As can be seen in the figure, the density values measured
using the NDG were relatively similar (i.e., within 5 lbs./ft3) for all testing times.
However, there was a slight increase in density as testing was delayed. These
observations were made for all aggregates types.
The slight increase in density can be mainly attributed to the migration of water to
the bottom of the compacted sample. To further explain, prior to compaction, the
aggregates are uniformly mixed with water using a concrete mixer. Once the aggregates
are mixed with the appropriate amount of water, the aggregates are placed and compacted
into an aluminum mold (as described in Chapter 5). After the initial day of testing the
samples are covered for 24 hours and tested again using the NDG and selected devices.
This process is repeated for another 24 hours following the second set of testing. During
these 48 hours, the water within the samples might seep to the bottom of the mold due to
gravity; explaining the slight increase in density over time. In addition, the NDG density
values obtained from the samples were measured at 4-inches, 6-inches, and 8-inches
throughout the mold and averaged together for one density value. Therefore, if water
were to seep to the bottom of the mold the density values measured at 4-inches would be
different than those values measured at 8-inches, causing an observed change in the
density of the sample.
Page 105
104
It is worth mentioning that the moisture content values, as measured using the
NDG, also decreased with the delay in testing time. To further explain, as shown in Table
18 below, the NDG moisture content for NAT-1 immediately after compaction was
4.85%. After 48 hours the final measured NDG moisture content was 2.9%. Similar
observations were made for the NAT-2, DGA, and RCA aggregate samples in that the
NDG moisture content decreased (i.e., approximately 1.0%) with the delay in testing
time. This observation might also explain the increase in the density of the sample with
time. Based on the observations made for the NDG, it can be concluded that the device
was capable of reproducing results between testing days. The day in which testing was
conducted, did not influence the results obtained for the NDG. It is worth mentioning that
for DGA aggregates, testing was only conducted immediately and 48 hours following
compaction, as the device and certified technician were not available 24 hours after
compaction.
The modulus results obtained for the BCD at different test days are presented in
Figure 9b below. As can be seen from this figure, the modulus values obtained
immediately after compaction were either higher or lower than the modulus values
obtained 24 hours and 48 hours following compaction. This trend was observed for all
selected aggregate types. The observations made for the BCD results can be attributed to
the mixed trends previously experienced with the BCD. In addition, the high variability
of the BCD (i.e., obtaining modulus values ranging from 5 to 35 MPa at the same
location) might explain the mixed results presented in Figure 9b.
In the study conducted by Weidinger et al. [4], the BCD was tested on a rubber
block eight different times in order to evaluate the devices repeatability. The results of
Page 106
105
this study concluded that BCD modulus results varied within 4% of each other. In
addition, the COV of the strain outputs was 0.5%. The results of this study indicated that
there was high variability in the BCD results. Based on the observations made in this
study as well as the conclusions made by Weidinger et al. [4], it is evident that the BCD
is unable to replicate testing results over time. Therefore, it might be necessary to conduct
field testing immediately after compaction in order to obtain accurate modulus results for
the sample.
Figure 9c presents the LWD modulus values obtained for samples tested
immediately, 24, and 48 hours after compaction. As illustrated in this figure, the modulus
values obtained using the LWD were dependent on the aggregate type. The results
measured for both natural sand materials (NAT-1 and NAT-2) were relatively similar
between test days. However, in the case of DGA and RCA aggregates the LWD modulus
values slightly increased with a delay in testing time. The slight increase in modulus
values can be attributed to the migration of water to the bottom of the samples,
specifically for the dense-graded aggregate (DGA and RCA), which contain larger sized
particles. Meaning, water might move faster through these materials explaining the
increase in modulus for these aggregates.
In general, the results presented indicate that the LWD could reproduce similar
modulus results time after time, however, the device might still be influenced by the time
of testing. Similar trends were observed for the modulus results obtained from the LWD
in the study conducted by Alshibli et al. [3]. Based on the results of this study, it was
concluded that the LWD provided unreliable modulus measurements. In addition, in the
report provided by Hossain et al. [9] the LWD was also not capable of replicating
Page 107
106
modulus results over time. Similar to the BCD, it is recommended to conduct LWD
testing immediately following compaction to avoid overestimating the modulus of the
sample.
The numbers of blows required to penetrate the 1-foot (30.5-cm) thick samples
using the DCP over time is presented in Figure 9d below. The results presented in the
figure show that the DCP values obtained for NAT-1 and NAT-2 aggregates
immediately, 24 hours, and 48 hours after compaction were relatively similar (i.e., within
1 blow). The results obtained for both natural sand samples indicate that the DCP is
capable of reproducing results up to 48 hours following compaction. Herath et al. [8]
made similar conclusions in that the DCP was able to replicate the testing results on
different soils types and locations.
However, for the case of DGA and RCA aggregates, the DCP values measured
increased as the testing day increased. As previously established, these observations can
be attributed to the migration of water to the bottom of the mold. In addition, the high
permeability for DGA and RCA might also explain the increase in blows needed to
penetrate the samples. In other words the high permeability of these aggregates might
cause the water within the samples to seep faster to the bottom of the mold; further
explaining the increase in DCP values measured over time. Similar difficultly was
experienced when the DCP was tested on large aggregate samples in the report prepared
by Nazzal et al. [19]. The observations made from this study in conjunction with the
conclusions made through literature suggest conducting DCP testing immediately after
compaction for high permeability aggregate and up to 48 hours after compaction for low
Page 108
107
permeability aggregates. In order to avoid overestimating the measured values however,
it is recommended to conduct DCP field testing immediately after compaction.
Table 18
Effect of Testing Time on NDG Moisture Content
Level Tested Hour Tested NAT-1 NAT-2 DGA RCA
Opt. Moist. Cont. (%) &
MDD (lbs./ft.3)
Immediately
24 Hours
48 Hours
4.85
3.45
2.9
6.35
6.2
5.75
5.8
N/A
4.6
8.6
8.8
7.8
Page 109
Immediately After Compaction
24 Hours After Compaction
48 Hours After Compaction
Immediately After Compaction
24 Hours After Compaction
48 Hours After Compaction
Blo
ws
Mea
sure
d U
sin
g D
CP
(B
low
s)
Mo
du
lus
Mea
sure
d U
sin
g B
CD
(M
Pa
)
135 45
130 40
35
125 30
120 25
115 20
15 110
10
105 5
100
NAT-1 NAT-2 DGA RCA
Aggregate Type
0
NAT-1 NAT-2 DGA RCA
Aggregate Type
45 40
40 35
35 30
30 25
25 20
20
15 15
10 10
5 5
0
NAT-1 NAT-2 DGA RCA
Aggregate Type
0
NAT-1 NAT-2 DGA RCA
Aggregate Type
Figure 9. Effect of Delayed Testing on Testing Results; (a) NDG Results, (b) BCD Results, (c) LWD Results; and (d)
DCP Results
(b) (a)
Immediately After Compaction
24 Hours After Compaction
48 Hours After Compaction
Immediately After Compaction
24 Hours After Compaction
48 Hours After Compaction
108
Mo
du
lus
Mea
sure
d U
sin
g L
WD
(M
Pa
) D
ensi
ty M
easu
red
Usi
ng N
DG
(lb
s./f
t.3)
Page 110
109
6.5 Precision of Measurements
The standard error of the mean (SEM) was calculated for the all testing results
measured immediately following compaction for NAT-1, NAT-2, DGA, and RCA
respectively. These calculations were conducted in order to determine the variability of
the sample mean of the results. It is to be noted that these values were expressed as a
percentage of the mean value measured from the NDG and selected devices. The SEM
results calculated for all laboratory testing are listed in Table 19 below.
The SEM was calculated by dividing the standard deviation (STD) of the results
at 2% below, 2% above, and at OMC by the square root of the total amount of replicates
measured for each device. As an example, in the case of NAT-1 the average STD
calculated for the testing results at OMC was 4.481%. For this study, there were six
replicates measured from each device. Therefore, the SEM was determined to be
approximately 2% for NAT-1. As mentioned, this calculation was performed for all
aggregate types, at all moisture levels. It is worth mentioning that a total average error of
all aggregates types for each device is also presented in the table below.
As can be seen in the table, the variability of the selected devices ranged from 5-
8%. Specifically, the BCD obtained a SEM of 8%, the LWD had a SEM of 5%, and a
SEM of 7% was obtained for the DCP. Although the results for each device were similar,
the variability of each device was greater than a SEM of 1% that was calculated for the
NDG. In addition, the results show that the variability of each device at different moisture
contents was similar for the NDG, BCD, and LWD. However, this was not observed for
the DCP. The variability of the DCP values at 2% above OMC was slightly higher (by a
difference of 6%) than at 2% below OMC and OMC. The results presented in Table 19
Page 111
110
indicate that moisture content within 2% above or below OMC had insignificant effects
on the devices measurements except in the case of the DCP. The high variability
experienced with the DCP values can be attributed to the excess moisture within the
samples causing the DCP blows to become more variable.
Table 19
Standard Error of the Mean of the Results Measured from all Devices (Expressed as a
Percent of the Mean Value)
Standard Error of the Mean of NDG, % Average Error of All
Materials, % 2% Below OMC 2% Above
1%
NAT-1 2% 2% 1%
NAT-2 1% 1% 2%
DGA 1% 1% 0%
RCA 1% 2% 1%
Average 1% 1% 1%
Standard Error of the Mean of BCD, %
2% Below OMC 2% Above
8%
NAT-1 6% 8% 3%
NAT-2 12% 7% 13%
DGA 9% 8% 5%
RCA 8% 10% 10%
Average 9% 8% 8%
Standard Error of the Mean of LWD, %
2% Below OMC 2% Above
5%
NAT-1 9% 8% 5%
NAT-2 5% 4% 6%
DGA 2% 6% 9%
RCA 6% 4% 1%
Average 6% 5% 5%
Standard Error of the Mean of DCP, %
2% Below OMC 2% Above
7%
NAT-1 5% 2% 2%
NAT-2 5% 10% 14%
DGA 6% 3% 23%
RCA 4% 5% 3%
Average 5% 5% 11%
Page 112
111
6.4 Summary of Findings
The results presented in this chapter illustrate the impact of moisture content,
compaction effort applied, delayed testing, and aggregate type on the testing results
obtained from the NDG and the selected non-nuclear devices. Based on the results of
laboratory testing, it was concluded that the selected non-nuclear devices were sensitive
to the changes in moisture content of the samples within 2% (above and below) the
OMC. Significant effects were observed for the DCP when samples were prepared at 2%
below OMC and 2% above OMC.
The results of laboratory testing indicated that the LWD and DCP were able to
detect changes in compaction effort applied to the samples. However, it was concluded
that the BCD was not able to capture the differences between compaction efforts. In the
case of the NDG, the device was not able to capture differences between samples
compacted at MDD and those compacted above MDD. In addition, the laboratory results
strongly suggest that the devices were capable of replicating results up to 48 hours after
compaction; however, the BCD was the only device that was unable to replicate results
due to the influence of testing time.
It was also observed that all the parameters measured from the NDG and non-
nuclear devices were able to differentiate between the different aggregate types. Based on
the analysis conducted on the SEM results, the variability of each device at different
moisture contents was similar for the NDG, BCD, and LWD. In the case of the DCP, the
device showed higher variability when tested on samples prepared at moisture contents
2% above the OMC.
Page 113
112
Overall, the analysis conducted on the laboratory testing results indicates that the
DCP was the most suitable device for capturing the changes in moisture content and
compaction effort applied to the prepared samples. The testing results also reveal that the
DCP could reproduce results up to 48 hours after compaction. In addition, the DCP was
the only device that significantly captured the differences between the compacted
samples (i.e., detecting the changes in moisture within the aggregates). Ultimately, the
DCP was determined to be the most promising tool that can be used to the replace the
NDG for determining the quality of compacted subgrade and base/subbase pavement
layers.
Page 114
113
Chapter 7
Development of DCP Multiple Linear Regression Model
7.1 Introduction
The development of a multiple linear regression model to predict field DCP blow
counts is presented in this chapter. In addition, this chapter proposes a minimum DCP
acceptance criteria based on the established prediction model. The prediction model
developed for this study was a function of multiple factors that included: (1) material
characteristics (i.e., gradation), (2) measured density, and (3) moisture content present
within the sample. It was essential to determine minimum DCP blow values that would
ensure satisfactory field compaction quality control during the construction of flexible
pavements. A comprehensive discussion of the step-by-step process implemented to
develop the prediction model is presented in the following subsections.
7.2 Separation of Collected Laboratory Data
The first step in developing the prediction model required separating the
laboratory testing results collected from the NDG and selected devices. The collected
data in this study consisted of 134 total points that were separated into two groups that
facilitated the development and validation stage of the model. The data was separated by
first randomly assigning each point with an appropriate identification number. A random
table generator in Excel was then utilized to randomly select the first group of data
points. The first set of data selected contained about 60% (i.e., 80 points) of the original
data. This set of data served as the foundation for developing the model. The second
Page 115
114
group of data composed of the remaining 40% (i.e., 54 points) that were used to validate
the developed prediction model.
7.3 Model Formulation
The next step was to develop an initial DCP prediction model using 60% of the
collected data. The initial prediction model formulated was based on several factors that
included: (1) density, measured using the NDG, (2) the difference between the actual
moisture content and the OMC of the sample, (3) the day of testing, (4) aggregate bulk
specific gravity, and (5) aggregate gradation, represented by percent passing the No. 4
sieve and percent passing the No. 200 sieve. The difference in moisture content between
the actual moisture content measured and the OMC was used to illustrate the physical
behavior of the DCP in that the required number of blows increase/decrease with an
increase/decrease in the aggregate moisture content.
It is noted that prior to developing the model, the DCP values were normalized by
the depth of the compacted samples. This method was performed in order to account for
the thickness of the sample. In addition, this procedure proved necessary when laboratory
predicted DCP values were correlated to those collected through field testing in the
following sections. Notice that the scale in which laboratory testing was conducted for
this study was much smaller to that in which field testing was performed. Therefore,
normalizing the DCP values by depth allowed both laboratory and field values to be
adequately correlated to one another. Based on the factors considered, an initial DCP
prediction model was established and is presented in Equation 2 below.
Page 116
115
𝒀 = 𝑨𝑿𝟏 + 𝑩𝑿𝟐 + 𝑪𝑿𝟑 + 𝑫𝑿𝟒 + 𝑬𝑿𝟓 + 𝑭𝑿𝟔 + 𝑮 Equation 2
Where:
A, B, C, D, E, F and G = Model parameters
Y = Predicted DCP blow values (blows/inch.)
X1 = Sample density, lbs./ft.3
𝑋2 = Moisture content difference, %
X3 = Testing day
X4 = Aggregate dry bulk specific gravity
X5 = Cumulative percent passing sieve No. 4, %
X6 = Cumulative percent passing sieve No. 200, %
7.4 Development of Revised Model
Table 20 below presents the results of the regression analysis performed using the
initial DCP prediction model established in Equation 2. The results presented in this table
include the considered model parameters previously discussed and the corresponding
significance value associated with each factor. As can be seen from the analysis, the
moisture content difference had a significant impact on the model (α = 0.001). In
addition, the aggregate gradation, represented by percent passing No. 4 and No. 200
sieves, also had significant impacts on the developed model (α < 0.05). However, density
measured using the NDG, as well as testing day and aggregate bulk specific gravity did
not have significant impacts on this model (α > 0.05). Based on the results presented in
Table 20 the insignificant factors were removed from the initial model. A regression
Page 117
116
analysis was conducted on the revised prediction model and the results of the analysis are
also presented in Table 20. As can be seen in the table, the moisture content difference
and aggregate gradations remained significant on the revised model (α < 0.05).
In order to determine if the revised model was able to capture the real physical
behavior of the DCP it was necessary to study the values associated with the model
parameters utilized for its development. As can be seen in the table, the moisture content
difference (coefficient B) had a value of -0.107. This value suggests that as the moisture
content difference increases for the sample, the required number of DCP blows will
decrease. In other words, if the actual measured moisture content is higher than OMC
then the number of blows required to penetrate the soil will decrease. Similarly, as the
moisture content difference decreases (i.e., actual moisture content is below OMC) the
number of blows needed to penetrate the sample will increase. This trend was expected as
a result of the lubricating effect water has on the DCP. To further elaborate, as the water
in the sample increases, the frictional resistance of the penetrating cone will decrease;
therefore the number of blows needed to penetrate the soil is expected to decrease. It is
worth mentioning that this trend was consistent with the observations made when the
DCP was tested on laboratory samples prepared at varying moisture contents.
As can be seen in the table, the coefficient associated with percent passing sieve
No. 4 (coefficient E) is -0.022. In the case of the percent passing No. 200 sieve
(coefficient F), the parameter value was 0.429. These values indicate that the amount of
materials passing the No. 4 sieve increases with a decrease in DCP values. Furthermore,
the material passing the No. 200 sieve decreases with an increase in DCP values. These
trends are expected because the materials passing the No. 4 sieve contain more fine
Page 118
117
particles than material passing the No. 200 sieve, therefore the finer the material the
lower frictional resistance applied to the penetrating cone. A lower frictional resistance
will result in a lower number of blows needed to penetrate the material. These
observations were also made when the laboratory testing results were compared for the
well-graded aggregates (NAT-1 and NAT-2) and the dense-graded aggregate (DGA and
RCA). The results of the laboratory tests showed that both natural sand materials (NAT-1
and NAT-2) required less blows than the DGA and RCA materials.
A comparison of both developed models was performed based on their COV
values. As can be seen in Table 20 the initially developed model had a R-squared value
of approximately 60%. The revised model, however, had a R-squared of 56%. The slight
decrease in the R-squared values between the models can be attributed to the removal of
the insignificant factors from the initial model. As mentioned above, the density
measured using the NDG, testing day, and aggregate bulk specific gravity did not have
significant impacts on the initial prediction model, therefore the slight reduction in the R-
square value can be considered insignificant as well. Based on the observations made for
both the initial and revised model it can be concluded that the model developed
adequately captures the physical behavior of the DCP.
Page 119
118
Table 20
Initial and Revised DCP Prediction Models
Initially Developed Model
Model Parameters Parameter Value t-value α -value
A: NDG Density 0.004 0.894 0.374
B: Moisture Content Diff.* -0.115 -3.324 0.001
C: Testing Day 0.132 1.975 0.052
D: Agg. Specific Gravity -2.410 -0.853 0.397
E: % Passing Sieve No. 4 -0.022 -4.350 0.000
F: % Passing Sieve No. 200 0.429 2.391 0.019
G: Constant 7.471 1.057 0.294
Model R2 58.9%
Revised Model
Model Parameters Parameter Value t-value α -value
B: Moisture Content Diff, % - 0.107 -3.302 0.001
E: % Passing Sieve No. 4 - 0.025 -7.034 0.000
F: % Passing Sieve No. 200 0.264 2.630 0.010
G: Constant 2.210 8.218 0.000
Model R2 56.0%
The final model developed for predicting DCP blow values is as follows:
𝒀 = −𝟎. 𝟏𝟎𝟕𝑿𝟐 − 𝟎. 𝟎𝟐𝟓𝑿𝟓 + 𝟎. 𝟐𝟔𝟒𝑿𝟔 + 𝟐. 𝟐𝟏𝟎 Equation 3
Where:
Y = Predicted DCP blow values (blows/inch.)
X2 = Moisture content difference, %
X5 = Cumulative percent passing sieve No. 4, %
𝑋6 = Cumulative percent passing sieve No. 200, %
Page 120
119
7.5 Attempts to Improve Final Prediction Model
Once the final DCP prediction model was developed, attempts were made to
improve the model. As mentioned in the previous sections, the prediction model required
separating the collected laboratory data from the NDG and selected non-nuclear devices
into two groups that aided the development and validation stage of the prediction model.
The first set of data selected contained about 60% (i.e., 80 points) of the original data and
the second set composed of the remaining 40% (i.e., 54 points) of the laboratory data.
The final model formulated in Equation 3 was based on several factors that
included: (1) the difference between the actual moisture content and the OMC of the
sample, and (2) aggregate gradation, represented by percent passing the No. 4 sieve and
percent passing the No. 200 sieve. Table 20 above presents the results of the regression
analysis performed on the final model. As can be seen in the table, the analysis yielded an
R-squared value of 56%. It is to be noted that the COV of the moisture content of the
samples utilized in this study was also calculated to determine the variability of the
prepared samples. As previously mentioned (Chapter 5) moisture samples were taken
between each mixing process to confirm that the targeted moisture content of the sample
was reached. Table 21 below presents the measured moisture content of each sample
utilized during testing. It is worth mentioning that the COV was calculated for the
samples that were utilized for developing the DCP prediction model. To further explain,
as mentioned in the previous sections, 60% of the collected laboratory data was utilized
for developing the DCP prediction model. Therefore “N/A” in Table 21 below denotes
values not utilized for developing the prediction model. Based on the actual moisture
contents measured, the COV of the moisture content of the samples was 0.223. This
Page 121
120
value was calculated by dividing the standard deviation of the samples’ moisture content
by the average moisture content. Based on the results of the model regression and COV
analysis, attempts were made to improve the final DCP prediction model and
corresponding R-squared value.
Table 21
Actual Measured Moisture Content of Prepared Samples
Experiment Level Tested NAT-1 NAT-2 DGA RCA
Effect of
Moisture
Content (%)
2% Below OMC
Opt. Moist. Cont.
2% Above OMC
8.12
9.58
11.76
7.14
8.99
11.35
6.98
7.82
11.30
8.95
9.9
13.04
Effect of
Compaction
Effort
(lbs./ft.3)
Below MDD
Max. Dry Density
Above MDD
9.4
8.98
N/A
10.45
N/A
9.56
7.17
7.68
10.13
15.03
N/A
14.13
The first attempt at improving the final model involved splitting the collected
laboratory data into two groups. However, rather than using 60% (i.e., 80 points) of the
original data to formulate the model, 80% (i.e., 107 points) was used for its development.
Once again, the model was based on: (1) the difference between the actual moisture
content and the OMC of the sample, and (2) aggregate gradation, represented by percent
passing the No. 4 sieve and percent passing the No. 200 sieve. A regression analysis was
then performed on the model and the results are presented in Table 22 below. As can be
seen in the table, all factors were significant on the model (α < 0.05). In addition, the
coefficients associated with each model parameter followed the same trend as the
Page 122
121
previously established model (Equation 3). However, the R-squared value decreased from
56% to 47% when 80% of the original data was utilized to develop the model.
Three attempts were made to improve the final model by varying the aggregate
gradation parameters. For these attempts, 80% of the original data was utilized for
developing the model however, rather than using gradation parameters represented by
percent passing the No. 4 and No. 200 sieve, different gradation combinations were
introduced into the model. The aggregate gradation combinations included: (1) percent
passing the No. 4 and No. 60 sieve, (2) percent passing the No. 60 and No. 100 sieve, and
(3) percent passing the No. 60 and No. 200 sieve. The results of the regression analysis
performed on these models are presented in Table 22 below. As can be seen in the table
the coefficients associated with each model parameter were consistent with the final
prediction model. However, the moisture content difference was not significant on any of
the models (α > 0.05). In addition, the R-squared values for these models fell below 50%.
Page 123
122
Table 22
Prediction Model Using 80% of Data
Model Attempt 1 Using 80% Data
Model Parameters Parameter Value α -value
B: Moisture Content Diff, % -0.907 0.026
E: % Passing Sieve No. 4 -0.303 0.000
F: % Passing Sieve No. 200 2.773 0.023
G: Constant 26.994 0.000
Model R2 47%
Model Attempt 2 Using 80% Data
Model Parameters Parameter Value α -value
B: Moisture Content Diff, % -0.667 0.094
E: % Passing Sieve No. 4 -0.336 0.000
F: % Passing Sieve No. 60 0.62 0.192
G: Constant 28.191 0.000
Model R2 46%
Model Attempt 3 Using 80% Data
Model Parameters Parameter Value α -value
B: Moisture Content Diff, % -0.69 0.122
E: % Passing Sieve No. 60 -5.126 0.000
F: % Passing Sieve No. 100 9.507 0.000
G: Constant 16.315 0.000
Model R2 35%
Model Attempt 4 Using 80% Data
Model Parameters Parameter Value α -value
B: Moisture Content Diff, % -0.408 0.381
E: % Passing Sieve No. 60 -2.844 0.001
F: % Passing Sieve No. 200 11.192 0.000
G: Constant 15.004 0.000
Model R2 27%
The next attempt made to improve the final DCP prediction model involved
formulating a model using 70% (i.e., 94 points) of the collected laboratory data. Once
again, the initial model was based on: (1) the difference between the actual moisture
content and the OMC of the sample, and (2) aggregate gradation, represented by percent
passing the No. 4 and the No. 200 sieve. The results of the regression analysis performed
Page 124
123
on the model are presented in Table 23 below. As can be seen in the table, all factors
were significant on the model (α < 0.05). However, the coefficients associated with the
model parameters were not consistent with the final prediction model established in
Equation 3. To further explain, the moisture content different (coefficient B) had a value
of 1.483. This value indicates that as the moisture content difference increases for the
sample, the number of DCP blows will increase. This trend is not expected based on the
lubricating effect that water has on the DCP. If the moisture in the sample increases the
frictional resistance of the penetrating cone will decrease therefore, the number of DCP
blows should decrease. In addition, the R-squared value decreased from 57% to 50%
when 70% of the original data was utilized for developing the model. The observations
made for this model were also made when the different aggregate gradation combinations
were introduced into the prediction model. Table 23 presents the regression analysis
performed on the different models attempted using 70% of the collected laboratory data.
Page 125
124
Table 23
Prediction Model Using 70% of Data
Model Attempt 1 Using 70% Data
Model Parameters Parameter Value α -value
B: Moisture Content Diff, % 1.483 0.000
E: % Passing Sieve No. 4 -0.306 0.000
F: % Passing Sieve No. 200 1.965 0.000
G: Constant 27.618 0.000
Model R2 50%
Model Attempt 2 Using 70% Data
Model Parameters Parameter Value α -value
B: Moisture Content Diff, % 1.225 0.002
E: % Passing Sieve No. 4 -0.332 0.000
F: % Passing Sieve No. 60 0.204 0.665
G: Constant 29.686 0.000
Model R2 49%
Model Attempt 3 Using 70% Data
Model Parameters Parameter Value α -value
B: Moisture Content Diff, % 1.382 0.003
E: % Passing Sieve No. 60 -5.03 0.000
F: % Passing Sieve No. 100 9.139 0.000
G: Constant 16.27 0.000
Model R2 36%
Model Attempt 4 Using 70% Data
Model Parameters Parameter Value α -value
B: Moisture Content Diff, % 1.159 0.017
E: % Passing Sieve No. 60 -2.78 0.001
F: % Passing Sieve No. 200 10.763 0.000
G: Constant 14.716 0.000
Model R2 26%
Based on the results presented in Table 22 and Table 23, efforts were then made
to develop a prediction model that was aggregate specific. The first prediction model was
formulated using the complete set of collected subgrade (NAT-1 & NAT-2) laboratory
data (i.e., 62 points). A second model was developed using all collected base/subbase
(DGA & RCA) laboratory data (i.e., 72 points). The initial models were based on: (1) the
Page 126
125
difference between the actual moisture content and the OMC of the sample, and (2)
aggregate gradation, represented by percent passing the No. 4 and the No. 200 sieve. A
regression analysis was performed on the models and the results are presented in Table
24 and Table 25 below.
As can be seen in the table for the subgrade materials, the percent passing No. 200
sieve was excluded from the analysis. In addition, the percent passing No. 4 sieve was not
significant on the model (α > 0.05). It is worth mentioning that the coefficient associated
with the percent passing No. 4 sieve was also not consistent with the initial prediction
model (Equation 3) in that the material passing the No. 4 sieve increases as the number of
DCP blows increases. As for the base/subbase model, the percent passing No. 4 sieve was
excluded from the analysis however, all factors were significant on the model (α < 0.05).
Three additional attempts were made using different aggregate gradation
combinations. The different aggregate combinations once again included: (1) percent
passing the No. 4 and 60 sieve, (2) percent passing the No. 60 and 100 sieve, and (3)
percent passing the No. 60 and 200 sieve. The results of the regression analysis
performed on these models are also presented in Table 24 and Table 25. For each model
attempted, the analysis excluded one of the aggregate gradation parameters. In addition,
the R-squared value for the subgrade models was 10% and the R-squared value for the
base/subbase models was 20%. These observations may suggest that there is not enough
data to develop a model that is aggregate specific.
Based on the results presented in this section, it was concluded that the final
prediction model presented in Equation 3 most accurately predicted DCP blow counts. In
addition, the model was able to capture the real physical behavior of the DCP. Therefore,
Page 127
126
the model formulated in Equation 3 would serve as the final DCP prediction model for
developing a proposed minimum DCP acceptance criteria that would ensure satisfactory
field compaction quality of subgrade and base/subbase layers during pavement
construction.
Table 24
Prediction Model Using NAT-1 & NAT-2 Data
Model Attempt 1 Using NAT-1 & NAT-2 Data
Model Parameters Parameter Value α -value
B: Moisture Content Diff, % -0.389 0.048
E: % Passing Sieve No. 4 0.133 0.133
F: % Passing Sieve No. 200 N/A N/A
G: Constant -5.875 0.398
Model R2 10%
Model Attempt 2 Using NAT-1 & NAT-2 Data
Model Parameters Parameter Value α -value
B: Moisture Content Diff, % -0.389 0.048
E: % Passing Sieve No. 4 N/A N/A
F: % Passing Sieve No. 60 -0.543 0.136
G: Constant 6.881 0.000
Model R2 10%
Model Attempt 3 Using NAT-1 & NAT-2 Data
Model Parameters Parameter Value α -value
B: Moisture Content Diff, % -0.389 0.048
E: % Passing Sieve No. 60 N/A N/A
F: % Passing Sieve No. 100 7.601 0.136
G: Constant -5.715 0.404
Model R2 10%
Model Attempt 4 Using NAT-1 & NAT-2 Data
Model Parameters Parameter Value α -value
B: Moisture Content Diff, % -0.389 0.048
E: % Passing Sieve No. 60 N/A N/A
F: % Passing Sieve No. 200 1.9 0.136
G: Constant 3.597 0.000
Model R2 10%
Page 128
127
Table 25
Prediction Model Using DGA & RCA Data
Model Attempt 1 Using DGA & RCA Data
Model Parameters Parameter Value α -value
B: Moisture Content Diff, % -1.285 0.005
E: % Passing Sieve No. 4 N/A N/A
F: % Passing Sieve No. 200 4.78 0.000
G: Constant 13.337 0.000
Model R2 20%
Model Attempt 2 Using DGA & RCA Data
Model Parameters Parameter Value α -value
B: Moisture Content Diff, % -1.285 0.005
E: % Passing Sieve No. 4 N/A N/A
F: % Passing Sieve No. 60 2.001 0.000
G: Constant 9.491 0.000
Model R2 20%
Model Attempt 3 Using DGA & RCA Data
Model Parameters Parameter Value α -value
B: Moisture Content Diff, % -1.285 0.005
E: % Passing Sieve No. 60 N/A N/A
F: % Passing Sieve No. 100 2.689 0.000
G: Constant 12.142 0.000
Model R2 20%
Model Attempt 4 Using DGA & RCA Data
Model Parameters Parameter Value α -value
B: Moisture Content Diff, % -1.285 0.005
E: % Passing Sieve No. 60 N/A N/A
F: % Passing Sieve No. 200 4.78 0.000
G: Constant 13.337 0.000
Model R2 20%
7.6 Final Model Validation
Once the final prediction model was developed it was necessary to
validate the model. As discussed in this chapter, the laboratory testing results were
separated into two groups. The first set of data, consisting of 60% of the original data,
facilitated the development of the model discussed above. The second group consisted of
Page 129
128
the remaining 40% of data that were used to validate the final model. Validation of the
model was completed by first predicting the field DCP values based on the considered
factors. As mentioned, the considered factors included: (1) moisture difference, (2)
percent passing sieve No. 4, and (3) percent passing sieve No. 200. The predicted DCP
blows for each aggregate type were then plotted against the measured DCP blows in
Figure 10a below. It should be noted that the equality line between the measured and
predicted DCP values is also displayed in the figure.
Based on the results presented in Figure 10a it is observed that the prediction
model, on average, overestimated the DCP blows up to 1.25 blows/inch. This was
concluded as the majority of predicted values fell above the equality line. Since the
values presented in the figure cover both natural sand materials (NAT-1 and NAT-2) it
can be concluded that the developed model overestimated the DCP values for fine
materials. In addition, the results presented in Figure 10a indicate that the prediction
model underestimated DCP values for more coarse materials. This observation was made
since the predicted values fell below the equality line for DCP values greater than 1.5
blows/inch.
In addition to the observations made, it is also worth mentioning the scattering of
the plotted data around the equality line in the figure. As illustrated in Figure 10a, the
scattering of the plotted data around the equality line is smaller for the fine aggregates
(i.e., lower than 1.5 blows/inch.). In addition, the scattering of the plotted data is greater
for the more coarse aggregates (i.e., greater than 1.5 blows/inch.). The trend was
expected since that the variability of the results obtained for the coarse aggregates (i.e.,
DGA and RCA) was greater than those obtained for the finer aggregates (i.e., NAT-1 and
Page 130
129
NAT-2). As illustrated in Figure 10a, the distribution of the data around the equality line
is generally uniform. Based on the results presented, it is concluded that the final DCP
model developed effectively predicted the measured DCP values.
To further validate the developed prediction model the absolute relative error and
standard error of estimate for the data was calculated. The absolute relative error for the
data was calculated as the absolute difference between the predicted DCP values and
measured values. In addition, the standard error of estimate was calculated as the square
root of the sum of the average error of prediction. Based on the results, the frequency
distributions of the computed relative errors are presented in Figure 10b below. The
results presented in the figure shows the high variability within the data. However, the
high variability can be attributed to the natural non-uniformity of the different aggregate
types utilized for the study. In addition, the results indicate that the majority of the
predicted values (approximately 75% of the data) had an error of less than 0.5
blows/inch. Therefore, it can be further concluded that the developed DCP prediction
model effectively predicted the measured DCP values.
Page 131
130
4
3.5
3
2.5
2
1.5
1
0.5
0
0 0.5 1 1.5 2 2.5 3 3.5 4
Measured DCP Values (Blows/Inch)
(a)
(b)
Figure 10. Verification of DCP Prediction Model; (a) Predicted vs. Measured DCP
Values; and (b) Distribution of Relative Error Values
Pre
dic
ted D
CP
Val
ue
(Blo
ws/
Inch
)
Page 132
131
7.7 Calibration of Final Prediction Model Using Field Data
The final step for developing the DCP prediction model was to adequately
calibrate the model. As mentioned previously, the compaction quality of three 100-ft
(30.5-m) long field sections was measured using the NDG and non-nuclear devices. The
field data collected specifically for the NDG and DCP was used to calibrate the
prediction model. It was necessary to calibrate the DCP model using field measurements
in order to account for the significant differences that occur between both the laboratory
and field environment. As an example, when conducting testing the moisture contents
measured within the field were different to those measured during laboratory testing.
Therefore, it was necessary to calibrate the laboratory-based model using the data
measured through field testing.
In order to calibrate the prediction model, the collected field data was categorized
into four different groups according to aggregate type. The data was categorized in this
fashion, as the values measured using the DCP were dependent on the selected aggregate
types. To further elaborate, in the case of the natural sand materials (NAT-1 and NAT-2)
the measured DCP values were higher than the values measured for both coarse
aggregates (DGA and RCA). Therefore, to properly calibrate the model, a correction
factor, that was aggregate specific, was utilized to correct the DCP predicted values. For
each specific aggregate DCP blows were predicted based on the field moisture content,
and percent passing the No. 4 and No. 200 sieves.
Due to the restrictions of field testing, it is to be noted that moisture contents were
not obtained for all selected aggregates. To further explain, the limited amount of time
allotted for field testing made it difficult to obtain moisture samples for the field section
Page 133
132
containing the RCA material. In addition, prior to testing, a base layer was placed above
the subgrade layers consisting of NAT-1 and NAT-2 aggregates. Therefore it was
difficult to obtained moisture samples from these sections without disturbing the
compacted layer. As a result of these limitations, moisture content samples were only
obtained for the field sections containing the DGA aggregates. However, for the sections
in which moisture samples were not collected, the moisture content was assumed to be
zero or completely dry. This assumption was made, as the sections appeared completely
dry during field testing. In addition the moisture contents measured for the DGA
aggregates were between 1.5% and 2.0%, further confirming the assumption made.
Using the predicted and measured DCP values, a correction factor was computed
for each aggregate type. The correction factor was calculated as a ratio of the average
measured field DCP value to the average predicted DCP value. Figure 11 below presents
an example of the calculations performed to determine the correction factor for NAT-1.
As illustrated in the figure below NAT-1 had an average field DCP value of 2.512 and an
average predicted value of 1.401 respectively. Therefore, the correction factor computed
for NAT-1 was 1.785. Once the correction factor was computed, the value was multiplied
with all the terms in the laboratory-based model. Equation 4 below presents the final
DCP prediction model and the correction factors calculated for each aggregate type.
It is to be mentioned that the correction procedure selected for this study was
grounded on the assumption that the field measured DCP values were uniform and did
not considerably change between testing locations. As an example, in the case of the
DGA field sections, the average field value ranged between 3.118 and 3.537 blows/inch.
The field range was based on a 95% confidence level. The average calculated DCP was
Page 134
133
Average Field Measured DCP Values
Uncorrected Model Predictions
(Moist. Difference and % Passing Sieve No. 200 are constants)
Corrected Model Predictions
(Moist. Difference and % Passing Sieve No. 200 are constants)
Field Measured Average = 2.512
= 2.512 / 1.401 = 1.785
3.327 blows/inch with a standard deviation of 1.17 blows/inch and sample size of 121
points. Similar observations were also made for the field sections containing both natural
sand aggregates (NAT-1 and NAT-2) and RCA material. Therefore, based on these
results, it can be inferred that the data collected through field testing was uniform and did
not significantly deviate from the mean value. As a result, for each aggregate type an
average value was computed using all collected field measured DCP values.
6
5
4
3
2
1
0
70 75 80 85 90
Model Factors (e.g., %Passing Sieve No. 4)
Figure 11. Computational Procedure Utilized for Computing NAT-1 Aggregates Field
Correction Factor
Pre
dic
ted D
CP
Val
ue
(Blo
ws/
Inch
)
Page 135
134
𝒀 = 𝜷(−𝟎. 𝟏𝟎𝟕𝑿𝟐 − 𝟎. 𝟎𝟐𝟓𝑿𝟓 + 𝟎. 𝟐𝟔𝟒𝑿𝟔 + 𝟐. 𝟐𝟏𝟎) Equation 4
Where:
Y = Predicted DCP blow values (blows/inch.)
𝛽 = Aggregate material field correction factor
(For NAT-1 use 1.785, for NAT-2 use 1.522, for DGA use 1.776 and for RCA use 2.857)
X2 = Moisture content difference, %
X5 = Cumulative percent passing sieve No. 4, %
𝑋6 = Cumulative percent passing sieve No. 200, %
7.8 Recommended Minimum DCP Acceptance Criteria
As discussed in the previous chapters, the developed DCP prediction model can
be utilized for determining minimum DCP blow values that would ensure adequate field
compaction quality of subgrade and base/subbase layers during the construction of
pavements. Therefore, based on the DCP prediction model developed and calibrated in
this study, a proposed minimum DCP acceptance criteria was established. It is to be noted
that the field sections selected for testing met the NJDOT compaction quality
requirements. This conclusion was made based on the data collected using the NDG that
confirmed the measured density was higher than 95% of the Proctor MDD. As a result,
the recommended DCP values provided in this study will qualify as the minimum DCP
requirements for ensuring adequate field quality compaction.
Figure 12 below illustrates the method utilized for determining the minimum
recommended DCP values. It is to be noted that the example presented in the figure
Page 136
135
below is in reference to New Jersey soil aggregates (i.e., subgrade natural sands). The
aggregates provided in this example are in accordance to the gradation designations I-1
through I-15 of the NJDOT specifications [1]. It is worth mentioning that, when
determining the recommended DCP values, the variability in the moisture content,
percent passing No. 4 and No. 200 sieves were taken into consideration. The variability
of these factors was considered in order to recommend realistic DCP values.
As can be seen in Figure 12, the values selected for percent passing the No. 200
sieve ranged between 0 and 4%. These values were selected based on the allowable range
between 0 to 8% of soil aggregates passing sieve No. 200 that is specified by the NJDOT
[1]. For the purpose of this study, the allowable range for aggregates passing sieve No.
200 was utilized for NAT-1 and NAT-2 aggregates. The values selected represent the
minimum (i.e., 0%) and the average of the minimum and maximum values (i.e., 0 and
8%) of the control range.
The example presented below indicates that the minimum values selected for
percent passing No. 4 sieve ranged between 70 and 85%. Similar to the No. 200 sieve,
these values were selected based on the control range of 40 and 100% and average of
70% for natural sands. The method for determining the input values for the percent
passing No. 4 and No. 200 sieve for both natural sands was also implemented for DGA
and RCA aggregates in this study.
Based on the example presented in Figure 12, for natural sands having moisture
contents between 2% below OMC and OMC (i.e., 0 and -2% moisture difference) the
minimum recommended DCP values were about 1.62 blows per inch of penetration. This
value was computed as the overall average of all predicted DCP values instead of taking
Page 137
136
the absolute minimum or maximum value. This method was selected in order to consider
both contractor and agency risks. Using the method described above, a minimum
recommended DCP value was calculated for all selected aggregates (i.e., NAT-1, NAT-2,
DGA, and RCA), different moisture contents, and aggregate gradations. The results of
these calculations are presented in Table 26 below. In the case of both NAT-1 and NAT-2
the recommended minimum DCP values were averaged together. Similarly an average
was determined for both DGA and RCA in order to simplify the recommended
specifications.
6
5
4
3
2
1
0
65 70 75 80 85 90
Cummulative %Passing No. 4
Figure 12. Example of Computed Minimum DCP Value for NJDOT NAT-1 Aggregates
Moisture Difference = 0 & %Passing 200 = 0
Moisture Difference = 0 & %Passing 200 = 4
Moisture Difference = -2 & %Passing 200 = 0
Moisture Difference = -2 & %Passing 200 = 4
Minimum DCP Value (Moist. Cont. Diff. 0 To -2)
Increase in %Passing
Sieve No. 200
Decrease in Moisture Content
Overall Average ≈ 1.62 Blows/Inch
Pre
dic
ted
DC
P V
alu
es (
Blo
ws/
Inch
)
Page 138
Table 26
Recommended Minimum DCP Values for Ensuring Satisfactory Field Compaction
Aggregate
Type
Model Input Values Recommended
Minimum
DCP Value
(Blows/Inch)
Recommended Minimum
DCP Blows for (1-ft
layer) (rounded to the
nearest 5 DCP blows)
%Passing
Sieve No. 4
%Passing
Sieve No.
200
Moist. Cont.
Diff. (%)
Min Max Min Max Min Max
NJDOT soil
aggregates
(NAT-1 &
NAT-2)
70 85 0 4 0 2 1.3 16 (15)
70 85 0 4 -2 0 1.5 18 (20)
70 85 0 4 -4 -2 1.9 23 (25)
70 85 0 4 -6 -4 2.2 27 (25)
70 85 0 4 -8 -6 2.6 32 (30)
70 85 0 4 -10 -8 2.9 35 (35)
NJDOT dense
graded
aggregates
(DGA & RCA)
30 45 0 4 0 2 3.2 39 (40)
30 45 0 4 -2 0 3.4 41 (40)
30 45 0 4 -4 -2 3.8 46(45)
30 45 0 4 -6 -4 4.1 50 (50)
30 45 0 4 -8 -6 4.5 54 (55)
30 45 0 4 -10 -8 4.9 59 (60)
137
Page 139
138
Chapter 8
Development of DCP Draft Specification
8.1 Introduction
The development of a draft specification for use of the DCP for compaction
quality control of unbound subgrade and base/subbase pavement layers is discussed in
this chapter. The draft specification developed for this study was based on the
recommended minimum DCP values determined in Chapter 6. The minimum DCP
acceptance criteria developed would ensure satisfactory field compaction during the
construction of unbound flexible pavements. The following subsections discuss earlier
modulus-based specifications that have been developed and the process implemented to
develop the DCP draft specification presented in Appendix B.
8.2 Previously Developed DCP Specifications
As mentioned in the literature review (Chapter 2), modulus-based specifications
have been developed for using the DCP during the compaction quality control stage of
pavement construction. The MnDOT, Missouri Department of Transportation (MoDOT),
and the Indiana Department of Transportation (InDOT) have been the leading state DOTs
to develop such specifications. Nazarian et al. [16] has also developed modulus-based
construction specifications for compaction of earthwork and unbound aggregates.
8.2.1 Minnesota Department of Transportation (MnDOT)
In the MnDOT specifications the DCP penetration index is used for the
acceptance of three types of unbound granular materials [32]. These materials consisted
Page 140
139
of base and edge drain trench filter aggregates, and granular subgrade materials. Based on
the MnDOT specifications, testing using the DCP is to be conducted on the compacted
materials and the readings for the first five drops are to be recorded. Using the first two
values as seating drops, a SEAT value is computed with the following equation:
𝑺𝑬𝑨𝑻 = 𝑫𝒆𝒑𝒕𝒉 𝒐𝒇 𝒑𝒆𝒏𝒆𝒕𝒓𝒂𝒕𝒊𝒐𝒏 (𝟐 𝒃𝒍𝒐𝒘𝒔) − 𝑰𝒏𝒊𝒕𝒊𝒂𝒍 𝒅𝒆𝒑𝒕𝒉 𝒐𝒇 𝒑𝒆𝒏𝒆𝒕𝒓𝒂𝒕𝒊𝒐𝒏
Equation 5
It is worth mentioning that the SEAT value is determined in order to ensure that
the aggregate base layer has necessary surface strength that would support the weight of
the equipment during construction. In addition, the penetration depth measured following
the 5th drop is used to compute the DPI as follows:
𝑫𝑷𝑰 = (𝑫𝒆𝒑𝒕𝒉 𝒐𝒇 𝒑𝒆𝒏𝒆𝒕𝒓𝒂𝒕𝒊𝒐𝒏 𝒂𝒇𝒕𝒆𝒓 𝟓 𝒃𝒍𝒐𝒘𝒔−𝑫𝒆𝒑𝒕𝒉 𝒐𝒇 𝒑𝒆𝒏𝒆𝒕𝒓𝒂𝒕𝒊𝒐𝒏 𝒂𝒇𝒕𝒆𝒓 𝒕𝒘𝒐 𝒃𝒍𝒐𝒘𝒔)
𝟑
Equation 6
In addition to testing using the DCP, the MnDOT specifications require that the
gradation and in-situ moisture content be determined for the compacted material. The
gradation of the material is determined by performing a sieve analysis with the 25, 19,
9.5, 4.75, 2.00-mm, 425-micometer, and 75-micrometer sieves. Using the determined
moisture content and gradation values the maximum allowable DPI can be calculated
with the following equation:
Page 141
140
𝑴𝒂𝒙. 𝑨𝒍𝒍𝒐𝒘. 𝑫𝑷𝑰 (𝒎𝒎⁄𝒃𝒍𝒐𝒘) = 𝟒. 𝟕𝟔𝑮𝑵 + 𝟏. 𝟔𝟖𝑴𝑪 − 𝟏𝟒. 𝟒
Equation 7
Where:
𝑀𝐶 = Moisture content at the time of testing
𝐺𝑁 = Grading number obtained using the following equation:
𝐺𝑁 =
25 𝑚𝑚 + 19 𝑚𝑚 + 9.5 𝜇𝑚 + 4.75 𝑚𝑚 +2.00 𝑚𝑚 + 425 𝜇𝑚 + 75 𝜇𝑚
100
Based on the specifications provided by the MnDOT, the compacted material is
accepted if the measured SEAT and DPI values are found to be less than or equal to the
calculated maximum allowable values. The maximum allowable SEAT and DPI values
determined by the MnDOT are presented in Table 27 below.
Page 142
141
Table 27
MnDOT Maximum Seat and DPI Values [32]
Grading
Number
Moisture
Content
Maximum
Allowable SEAT
(mm)
Maximum
Allowable
DPI
(mm/blow)
Test Layer
in. (mm)
3.1 – 3.5
< 5.0 40 10 4 -6
[100 - 150] 5.0 – 8.0 40 12
> 8.0 40 16
3.6 – 4.0
< 5.0 40 10 4 -6
[100 - 150] 5.0 – 8.0 45 15
> 8.0 55 19
4.1 – 4.5
< 5.0 50 13 5 -6
[100 - 150] 5.0 – 8.0 60 17
> 8.0 70 21
4.6 – 5.0
< 5.0 65 15 6 - 12
[100 - 150] 5.0 – 8.0 75 19
> 8.0 85 23
5.1 – 5.5
< 5.0 85 17 7 - 12
[100 - 150] 5.0 – 8.0 95 21
> 8.0 105 25
5.6 – 6.0
< 5.0 100 19 8 - 12
[100 - 150] 5.0 – 8.0 115 24
> 8.0 125 28
8.2.2 Missouri Department of Transportation (MoDOT)
The DCP specification provided by the MoDOT has a similar framework to that
of the MnDOT specification. The MoDOT specification however is primarily for Type 7
aggregate base materials (limestone or dolomitic, and crushed stone or sand and gravel
bases) under roadways and shoulders [32]. The MoDOT specifications requires the
materials be compacted to achieve an average DPI value less than or equal to 0.4-
inch/blow (10-mm/blow). In addition, the measured average DPI should compare within
0.1-inch/blow (2.54-mm/blow) of the determined average DPI provided by the MoDOT.
Page 143
142
The DPI values for these materials are calculated using Equation 6 as proposed by the
MnDOT. Furthermore, under the MoDOT specifications, it is required that testing be
conducted within 24 hours after compaction using a standard DCP device with a 40-lb.
(18-kg) hammer.
8.2.3 Indiana Department of Transportation (INDOT)
The InDOT developed a DCP specification for the acceptance of clay, silty, or
sand soils, granular soils, and chemical modified soils [33]. Granular soils used in this
specification were of aggregate sizes smaller than ¾-inch (19-mm), structural backfill
size of 1-inch (25.4-mm), ½-inch (12.7-mm), and No. 4 and 30. The DCP acceptance
criteria developed is based on the type of soil being tested, and the materials MDD and
OMC values. According to the InDOT specifications the DCP is to be tested on clay soils
for every 6-inches (15.2-cm) of compaction. However for silty and sandy soils, the DCP
is tested for each 12-inches (30.5-cm) of compaction. In addition, for chemically
modified soils the DCP is tested for every 8-inches (20.3-cm) of compacted material, and
for granular materials testing is conducted for every 12-inches (30.5-cm) of compaction.
According to the InDOT specifications, a modified version of the one-point
Proctor test is to be used for determining the materials MDD and OMC values. The
values obtained through testing using the DCP are to be compared to the minimum
required DCP values presented in Table 28 or computed using Equation 7 below. In
addition, under the InDOT specifications the compacted material is to be maintained
within -3% to +1% of the OMC and the moisture content is to be measured every day of
Page 144
143
testing. Figure 13 below also illustrates the diagram used to determine the DCP
acceptance criteria based on the MDD and OMC of the material.
Table 28
InDOT Minimum Required DCP Values [33]
Optimum Moisture Content (%) (NDCP) req.|0 ~ 12 in.
10 18
11 16
12 14
13 13
14 11
(𝑵𝑫𝑪𝑷)𝒓𝒆𝒒| 𝟎~𝟏𝟐 𝒊𝒏. = 𝟓𝟗−𝟎.𝟏𝟐𝑶𝑴𝑪
Equation 7
Where:
𝑂𝑀𝐶 = Optimum moisture content
(𝑁𝐷𝐶𝑃)𝑟𝑒𝑞|0~12 𝑖𝑛. = Minimum required blow count for 0 to 12
in. penetration rounded to nearest integer.
Page 145
144
Figure 7. InDOT DCP Acceptance Criteria Based on MDD and OMC of Soil [33]
8.2.4 NCHRP Project 10-84
Nazarian et al. [16] also developed a standard specification for modulus-based
quality management of earthwork and unbound aggregates. The specifications pertained
to the construction of embankments and pavement layers composing of subgrade,
subbase, and base materials. The DCP specifications were based on the materials
gradation, moisture content, and density at compaction. According to provided
specifications the acceptable materials are to meet the gradation requirements presented
in Table 29. Any unacceptable material is to be corrected by the contractor. Any material
that is corrected or replaced is to be sampled and tested to ensure the material passes the
gradation requirements.
Page 146
145
Table 29
NCHRP Material Gradation Requirements [16]
Material
Percent Difference from Target Gradation
Sieve 1-inch.
(25.0 mm)
Sieve No. 4
(4.75 µm)
Sieve No. 40
(425 µm)
Sieve No. 200
(75 µm)
Embankment (if applicable) 10% 10% 10% 10%
Subgrade 10% 10% 10% 10%
Subbase 5% 8% 5% 3%
Base 5% 8% 5% 3%
In addition to the gradation requirements for the material, the NCHRP
specifications calls for a specific range of moisture content in which the material can fall
within during the compaction process. The moisture content specifications are presented
in Table 30 below. In addition, moisture content samples are to be taken at random prior
to compaction. If the materials do not meet the requirements the materials are to be
corrected until the appropriate moisture content is reached.
Table 30
NCHRP Moisture Content Requirements [16]
Optimum Moisture Content
(OMC)
Moisture Content
Min. Max.
<10% OMC - 2% OMC + 2%
≥10% 0.8 OMC 1.2 OMC
The final requirements, as determined by the NCHRP specifications, are that each
lift is to be compacted to no less than the percent of maximum dry density presented in
Table 31. According to the specifications, samples for density testing will be taken at
Page 147
146
random prior to compaction. Once again, if the material does not meet the set
requirements it is to be corrected accordingly. Testing using the DCP should be
conducted in a timely manner prior to the moisture content of the layer falling below 1%
of the moisture content measured during the time of compaction. For materials with an
OMC greater than 10%, the moisture content is not to fall below 2% of the moisture
content.
Table 31
NCHRP Relative Density Requirements for Compaction [16]
Material Min. Required Relative Density
Embankment 85% of Maximum Dry Density
Subgrade 90% of Maximum Dry Density
95% of Maximum Dry Density
95% of Maximum Dry Density Subbase
Base
8.3 Development of DCP Draft Specification
The existing draft specifications provided through literature concentrated on
developing construction specifications using values predicted from modulus-based
devices. However, a majority of these studies were limited to certain subgrade aggregates
and did not extensively cover materials that are generally used for pavement construction.
In addition, the draft specifications presented contain required moisture content
specifications. As a result, a draft specification for use of the DCP for compaction quality
control based primarily on material characteristics (i.e., gradation) for subgrade and
base\subbase materials was developed. It was necessary to develop such specification in
Page 148
147
order to shift from density-based acceptance that encompasses moisture content within its
specifications to modulus-based acceptance of materials.
Appendix B presents the proposed DCP draft specification titled “Compaction
Quality Control of Unbound Subgrade and Base/Subbase Layers Through Use of the
Dynamic Cone Penetrometer.” The proposed specification includes a set of guidelines for
implementing the DCP as an acceptance tool for the compaction quality control stage of
pavement construction. Specifically within the specification are two recommended
procedures for conducting the DCP test. In addition, a set of material gradation and
moisture content acceptance criteria are proposed. The following subsections discuss the
components that make up the developed DCP specification and the justification behind
each proposal.
8.3.1 Device and Materials
The first two components of the draft specification comprise of the device
description and general material use requirements. The DCP test is to be conducted in
accordance to ASTM D6951 or ASTM D7380 standards [34]. Within the specifications it
is recommended that the contractor use aggregate materials that conform to the NJDOT
901.11 requirements of the Standard Specifications for Road and Bridge Construction
[1]. This step is necessary to ensure that material is suitable for the intended use during
construction. In addition, it is worth noting that adequate compaction of a material will
not necessarily guarantee the success and long-term endurance of the material. Therefore,
it is important that the materials used for the development of the subgrade or
base/subbase layers met the specifications as provided by the NJDOT.
Page 149
148
8.3.2 DCP Test Procedure
Once the accepted material is placed and compacted into the respective layer it
was necessary to establish a method for conducting the DCP test. The proposed
specification provides two procedures for conducting the test which include: (1) a control
strip, and (2) random selection of test points. The two test procedures were provided to
allow different test method options for various types of construction sites.
The first proposed test method requires constructing a 400-square yard (334.5-
square meter) or greater control strip at the designated site. Once the control strip is
developed the DCP test can be conducted at 10 randomly selected locations within the
area. A minimum of 10 locations is preferred in order to ensure a certain level of
confidence in the measured values.
The second test method provided in the specification is a random selection of test
points. Based on this procedure, it is recommended to conduct the DCP test at 10
randomly selected locations within the site at a minimum of 3-feet (0.9-m) increments of
each other. This test method was provided for when a control strip was not necessary for
the designated site. However, since a definite testing boundary is not specified a
minimum of 3-feet (0.9-m) increments between DCP tests is recommended.
It is also worth mentioning that the methods described above were similar to the
procedure proposed in 203.03.02B of the NJDOT specifications for determining the
compaction requirements based on density acceptance [1]. For the purpose of this study,
it was appropriate to follow a similar protocol for the DCP test, as it may ultimately
replace the density-based method for compaction quality control. Using either test
Page 150
149
methods provided, an average DCP value can be calculated from the measured values.
The proposed specification also recommends that the DCP test be conducted until
a depth of 15-inches (38.1-cm) of the compacted layer is reached. For areas in which the
depth of the layer is less than 15-inches (38.1-cm) the test should be conducted for the
entire thickness of the layer. It is to be noted that during laboratory testing with the DCP,
mold samples were prepared at a depth of 12-inches (30.5-cm), therefore a value of 15-
inches (38.1-cm) was deemed appropriate for the purpose of developing the DCP test
procedure requirements. In addition, it is recommended that the test be performed within
24 hours of the placement and compaction of the aggregate layer. This requirement was
preferred based on the results of laboratory testing that showed higher variability for the
DCP when tested on compacted samples prepared 48 hours after compaction. In order to
avoid overestimating DCP measurements, it is preferred that testing be conducted no later
than 24 hours after compaction.
8.3.3 Acceptance Criteria
The final component of the developed DCP specification was the minimum
acceptance criteria for the compacted material layer. The acceptance criteria utilized for
developing the proposed specification (Table 26) was based on the material
characteristics that included: (1) gradation, and (2) moisture content within the material.
According to the specification, the materials used for constructing subgrade and
base/subbase layer should be in accordance to the gradation designations I-1 through I-15
of the NJDOT specifications [1]. It is recommended that these specifications apply to the
material throughout the entire placement and compaction process of the layer. Acceptable
Page 151
150
gradation specifications can be maintained through implementing one of the random
sampling procedures specified in AASHTO T 2 [35]. As mentioned in Section 8.3.1, it is
important to use material that met the requirements provided by the NJDOT
specifications to ensure satisfactory material performance. The proposed material
specifications are presented in Table 32 below.
Table 32
NJDOT Materials Specification
Material Specification
NJDOT Subgrade NJDOT 901.11
NJDOT Base/Subbase NJDOT 901.11
The second set of requirements proposed in the draft specification incorporated a
moisture content control option. Initially a specification that was based solely on material
gradation was established. The minimum acceptable DCP values (rounded to the nearest
5 blows) determined are presented in Table 33 below. According to the proposed
specification, acceptable NJDOT subgrade materials require 1.5 blows/inch and
approximately 20 blows for 1-foot (30.5-cm) of compacted material. In addition,
acceptable NJDOT base/subbase materials require 3.4 blows/inch and approximately 40
blows for 1-foot (30.5-cm) of compacted material. The minimum acceptable values
presented in the table below were selected in order to account for any additional moisture
in the compacted layer that was within ± 2% of the OMC. Meaning, if the compacted
layer was believed to contain additional moisture then the material would still meet the
proposed specification as long as it fell within the range determined in the table.
Page 152
151
Table 33
Minimum Acceptable DCP Values Based on Gradation
Material
Percent Passing (%)
Sieve No. 4
(4.75 mm)
Sieve No. 200
(75 µm)
Minimum DCP
Value
(blows/inch.)
Minimum DCP
Blows for (1-ft layer)
(rounded to the
nearest 5 DCP blows)
Min. Max. Min. Max.
NJDOT Subgrade
40 100 0 8 1.5 18 (20)
NJDOT Base/Subbase
25 50 3 10 3.4 41 (40)
A second specification that included moisture content was developed for when the
moisture within the compacted material deviated significantly from the OMC. The
gradation and moisture content requirements and the corresponding minimum DCP blow
values are presented in Table 34. It is to be noted that four minimum acceptable DCP
blows were determined for each material type to cover moisture content up to ± 6% of the
OMC. In order to measure the moisture within the material the specification recommends
collecting moisture content samples at random prior to compaction that is in accordance
to a random sampling procedure provided in ASHTO T 2 [35].
Page 153
152
Table 34
Minimum Acceptable DCP Values Based on Gradation & Moisture Content
Material
Percent Passing (%)
Sieve No. 4
(4.75 mm)
Sieve No.
200
(75 µm)
Moist. Cont.
Diff. (%)
Minimum
DCP Value
(blows/inch.)
Minimum
DCP Blows
for (1-ft
layer)
(rounded to
the nearest
5 DCP
blows) Min. Max. Min. Max. Min. Max.
NJDOT
Subgrade
40 100 0 8 0 2 1.3 16 (15)
40 100 0 8 -2 0 1.5 18 (20)
40 100 0 8 -4 -2 1.9 23 (25)
40 100 0 8 -6 -4 2.2 27 (25)
NJDOT
Base/Subbase
25 50 3 10 0 2 3.2 39 (40)
25 50 3 10 -2 0 3.4 41 (40)
25 50 3 10 -4 -2 3.8 46 (45)
25 50 3 10 -6 -4 4.1 50 (50)
8.3.4 Document Results
The final component of the developed draft specification requires documenting the
results from the DCP test conducted. The following information is to be recorded and
submitted to the RE:
1. The number of blows required to penetrate the layer between test readings;
2. Cumulative depth of penetration after each set of hammer blows;
3. Difference in cumulative penetration between each reading;
4. The penetration depth per blow;
5. The rate of penetration between each test reading; and
6. Assessment on acceptable/unacceptable compacted material.
Page 154
153
Chapter 9
Conclusions and Recommendations
9.1 Conclusions
The determination of a non-nuclear alternative method(s) to the NDG through
laboratory and field testing was presented in this thesis. The proposed objective was
based on the existing concerns and safety risks associated with using the NDG as an
acceptance tool during the compaction of unbound base/subbase layers. Laboratory
testing to evaluate the effect of aggregate type, moisture content, compaction effort, and
delayed testing on the measured parameters of the NDG, BCD, LWD, and DCP was
conducted to determine the most suitable non-nuclear alternative for replacing the NDG.
In addition, the results of the laboratory tests conducted in this study were utilized for the
development of a multiple linear regression model for predicting field measured DCP
values. The developed prediction model was then validated by plotting the predicted field
DCP values against the measured DCP values. To further validate the prediction model,
the absolute relative error and standard error of estimate for the data was calculated and
analyzed. The developed model was also calibrated using measured DCP field values
from three 100-ft (30.5-m) long field sections. Ultimately, a set of guidelines for
implementing the DCP and draft specifications for using the device as a quality
acceptance tool in the compaction quality control stage of pavement construction was
developed.
Page 155
154
Based on the results of the analyses conducted, the following conclusions were
made:
1) Based on the moisture content and density values measured before and after the
compaction process, the developed procedure for preparing and compacting large
aggregate samples for validating non-nuclear alternative devices appears to be
practical for laboratory testing.
2) The actual moisture content samples obtained from each lift during the implemented
procedure were within ±0.5% of the targeted moisture content. In addition, the
density values measured using the NDG following compaction of the samples were
within ±5 lbs./ft.3 of the targeted density value for all aggregate types. The analysis
conducted on both moisture content and density confirms the quality of the
compaction procedure.
3) Three devices were selected for further investigation as a non-nuclear alternative to
the NDG for evaluating unbound subgrade and base/subbase pavement layers. The
devices selected for additional laboratory and field assessment were the BCD, LWD,
and DCP. The device selection was based on the literature review conducted on the
different alternative devices as well as the survey sent to state DOT materials
engineers, device manufacturers, and contractors.
4) Analysis of the NDG results indicates that the device is not sensitive enough to detect
changes in density of the samples when increasing/decreasing the moisture content by
± 2% of the OMC. The density values for samples compacted at 2% below and 2%
above OMC were lower than those compacted at OMC for both the NAT-2 and RCA
materials. However, this trend was not observed for the NAT-1 and DGA samples
Page 156
155
compacted at 2% above OMC. In addition, the Proctor moisture-density relationships
for the NAT-1 material show variability within 3 lbs./ft3 when increasing/decreasing
the moisture content by 2%.
5) The NDG testing results also show that the density values measured were lowest at
density levels below MDD and highest at levels above MDD. This is expected as the
density in the samples increase the density measured by the NDG should increase as
well. However, the density values for samples at MDD and above MDD were within
3 lbs./ft3 suggesting that device is not capable of detecting changes between MDD
and above MDD.
6) The BCD testing results suggest that the BCD is sensitive to changes in the moisture
content. The modulus values for the DGA and RCA aggregates increased when the
moisture content of the samples increased. However, in the case of the natural sand
materials (NAT-1 and NAT-2) the modulus of the samples decreased as the moisture
increased. The trends observed can be attributed to the high variability of the BCD
and general nature of the device during testing.
7) Analysis of the BCD results indicates that the BCD was not capable of capturing the
differences in compaction efforts. The modulus values as measured using the BCD
were statistically similar (i.e., within 5 MPa) at all density levels. In addition,
significant differences were observed for the natural sand materials and dense-graded
materials indicating that the BCD is sensitive to aggregate type.
8) Analysis of the LWD testing results shows that the modulus values for NAT-1 and
RCA were similar at all moisture levels. This observation suggests the LWD is not
influenced by changes in the moisture content of the sample.
Page 157
156
9) The LWD testing results show that LWD is influenced by the change in compaction
effort. For the NAT-2 and DGA samples the modulus of the samples decreased as the
density of the samples increased. In the case of NAT-1 and RCA the modulus of the
samples increased as the compaction increased. The mixed trends observed can be
attributed to the effect of mold size on the performance of the LWD.
10) The DCP testing results suggest that the DCP in influenced by the change in moisture
content within the samples. The DCP blow count decreased as moisture increased for
the NAT-2, DGA, and RCA materials. This is due to the lubricating effect that water
has on the DCP performance.
11) Analysis of the DCP testing results show that the number of DCP blow increased as
the density level increased for all aggregate types, indicating that the DCP is sensitive
to differences in compaction effort applied between the samples. In addition, the DCP
values for both natural sand materials (NAT-1 and NAT-2) were lower than those
measured for the dense graded aggregates (DGA and RCA) indicating that the DCP is
also sensitive to aggregate type.
12) The variability, as determined through comparison of the SEM results, was similar for
the NDG, BCD, and DCP. The DCP however, shows an increase in variability when
the aggregate samples were prepared at moisture contents 2% above the OMC.
13) Based on the analysis conducted the DCP was selected as the most applicable tool for
replacing the NDG in determining the quality of compacted unbound pavement
layers.
14) A DCP model to predict laboratory and field DCP measured values was developed.
The model was based on multiple factors that included: (1) material characteristics
Page 158
157
(i.e., gradation) represented by cumulative percent passing sieve the No. 4 and No.
200 sieve, and (2) moisture content present within the sample. The model
development composed of formulating an initial prediction model. The model was
than revised and attempts were made to improve the final model. Upon completion of
the final model it was then validating and calibrating using field measured DCP
values.
15) The DCP prediction model was utilized for determining a proposed minimum DCP
blow value that would ensure satisfactory field compaction quality control during
pavement construction.
16) Using the proposed minimum DCP acceptance criteria, a draft specification for using
the DCP for compaction quality control of unbound subgrade and base/subbase
pavement layers was developed.
9.2 Recommendations
Based on the analysis and the conclusions presented above, the following
recommendations are suggested for future work on this study:
1) A jackhammer was utilized for compacting laboratory prepared samples at higher
targeted density levels. However, laboratory results show that the measured density
values for samples compacted above MDD were lower (i.e., 13 lbs./ft3) than their
targeted values. Therefore it is recommended implementing an alternative method for
compacting samples to significantly higher density levels.
2) Out of the three 100-ft long field sections that were analyzed, moisture content
samples were only collected for two field sections. Due to the time restriction during
Page 159
158
field testing, samples were only collected on the sections containing the DGA
material. Therefore, for further analysis, moisture samples should be collected at all
additional tested field sections.
3) The field testing conducted was limited due to the lack of available sections. It is
recommended to analyze additional field sections to improve the developed DCP
prediction model.
4) The proposed DCP prediction model is based on a linear relationship between the
different measured parameters (i.e., moisture content and aggregate gradation).
However, some studies have developed prediction models using a non-linear
relationship. Therefore it is recommended to look into non-linear relationships for
developing the proposed DCP prediction model.
Page 160
159
References
[1] New Jersey Department of Transportation. Standard Specifications for Road and
Bridge Construction. New Jersey. 2007.
www.state.nj.us/transportation/eng/specs/2007/Division.shtml. Accessed May 1,
2015.
[2] Lenke, L., McKeen, R., & Grush, M. Laboratory Evaluation of GeoGauge for
Compaction Control. In Transportation Research Record: Journal of Transportation
Research Board, No. 1849, Transportation Research Board of the National
Academies, Washington, D.C., 2003, pp. 20-30.
[3] Alshibli, K., Abu-Farsakh, M., & Seyman, E. Laboratory Evaluation of the
GeoGauge and Light Falling Weight Deflectometer as a Construction Control Tool.
ASCE Journal of Materials in Civil Engineering, Vol. 17, No. 5, 2005, pp. 560-569.
[4] Weidinger, D., Laboratory Evaluation of the Briaud Compaction Device. Journal of
Geotechnical and Geoenvironmental Engineering, Vol. 135, No. 10, 2009, pp. 1543-
1546.
[5] Chen, D.H., Wang, J.N., & Bilyeu, J. Application of Dynamic Cone Penetrometer in
Evaluation of Base and Subgrade Layers. In Transportation Research Record:
Journal of Transportation Research Board, No. 1764, Transportation Research Board
of the National Academies, Washington, D.C., 2001.
[6] Abu-Farsakh, M., Nazzal, M., Alshibli, K., & Seyman, E. Application of Dynamic
Cone Penetrometer in Pavement Construction Control. In Transportation Research
Record: Journal of the Transportation Research Board, No. 2016, Transportation
Research Board of the National Academies, Washing D.C., 2007, pp. 51-61.
[7] Murad, Y., Abu-Farsakh, M. Assessment of In-Situ Test Technology For
Construction Control of Base Courses and Embankments, Report No.
FHWA/LA.04/385, Louisiana Transportation Research Center, Baton Rouge, LA,
2004.
[8] Herath, A., Mohammad, L., Gaspard, K., Gudishala, R., & Abu-Farsakh, M. The Use
of Dynamic Cone Penetrometer to Predict Resilient Modulus of Subgrade Soils.
Report No. FHWA-LAW-417, FHWA, Washington, DC, 2007.
Page 161
160
[9] Hossain, M.S., & Apeagyei, A.K. Evaluation of the Light Weight Deflectometer for
In Situ Determination of Pavement Layer Moduli, Report No. FHWA/VTRC-10-R6,
Virginia Transportation Research Council, Richmond, 2010.
[10] Nazzal, M., Abu-Farsakh, M., Alshibli, K., & Mohammad, N. Evaluation the
LFWD Device for in Situ Measurement of Elastic Modulus of Pavement Layers. In
Transportation Research Record: Journal of the Transportation Research Board, No.
2016, Transportation Research Board of the National Academies, Washing D.C.,
2007, pp. 13-22.
[11] Peterson, J. S., Romanoschi, S. A., & Hossain, M., Development of Stiffness-
Based Specifications for In-Situ Embankment Compaction Quality Control. Report
No. K-TRAN: KSU-04-6, Kansas Department of Transportation, Manhattan, 2007.
[12] Briaud, J.-L., Rhee, K., & Saez, D. The BCD: A New Instrument for Compaction
Control. In Transportation Research Record: Journal of the Transportation Research
Board, Transportation Research Board of the National Academies, Washington D.C.,
2009.
[13] Mohammad, L., Gaspard, K., Herath, A., & Nazzal, M., Comparative Evaluation
of Subgrade Resilient Modulus from Non-Destructive, In-Situ and Laboratory
Methods. Report No. FHWA/LA.06/417, Louisiana Transportation Research Center,
Baton Rouge, 2007.
[14] Salgado, R., & Yoon, S. Dynamic Cone Penetration Test (DCPT) for Subgrade
Assessment, Join Transportation Research Project No. C-36-45S, Purdue University,
West Lafayette, Ind., 2003.
[15] Davich, P., Camargo, F., Larsen, B., Roberson, R., & Siekmeier, J. Validation of
DCP and LWD Moisture Specifications for Granular Materials. Report No. MN/RC-
2006-20, Minnesota Department of Transportation, St. Paul, 2006.
[16] Nazarian, S., Mazari, M., Abdallah, I., Puppala, A.J., Mohammad, L. N., Abu-
Farsakh, M.Y. Modulus-Based Construction Specification for Compaction of
Earthwork and Unbound Aggregates. NCHRP Report 10-84. In Transportation
Research Record: Journal of the Transportation Research Board, No. 10-84,
Transportation Research Board of the National Academies, Washington, D.C., 2014.
Page 162
161
[17] Wu, S., Sargand. Use of Dynamic Cone Penetrometer in Subgrade and Base
Acceptance. Report No. FHWA/ODOT-2007-01, FHWA, Washington, DC, 2007.
[18] White, D.J. Earthwork Performance Specification Integrating Proof Mapping and
Alternative In-Situ Testing. SHRP2 Report R07. In Transportation Research Record:
Journal of the Transportation Research Board, No. R07, Transportation Research
Board of the National Academies, Washington, D.C., 2014.
[19] Nazzal, M. Non-Nuclear Methods for Compaction Control of Unbound Materials.
NCHRP Report 456. In Transportation Research Record: Journal of the
Transportation Research Board, No. 456, Transportation Research Board of the
National Academies, Washington, D.C., 2014.
[20] Von Quintus, H. L, Minchin, R. E., Nazarian, S., Maser, K. R., & Prowell, B.
NDT Technology for Quality Assurance of HMA Pavement Construction. NCHRP
Report 626. In Transportation Research Record: Journal of the Transportation
Research Board, No. 626, Transportation Research Board of the National Academies,
Washington, D.C., 2009.
[21] Simmons, C., Letter of Finding: Memorandum to the Missouri Department of
Transportation Research, Development and Technology Division. 2000.
[22] Bloomquist, D., Ellis, R. D., & Birgisson, B. Development of Compaction Quality
Control Guidelines That Account for Variability in Pavement Embankments in
Florida. Report No. BC-287, University of Florida Department of Civil and Coastal
Engineering, Gainesville, 2003.
[23] Miller, H., & Mallick, R. Field Evaluation of a New Compaction Monitoring
Device. New England Transportation Consortium, 2003.
[24] Romero, P. Evaluation of Non-Nuclear Gauges to Measure Density of Hot-Mix
Asphalt Pavements. SHRP2 Report 1813. In Transportation Research Record:
Journal of the Transportation Research Board, No. 1813, Transportation Research
Board of the National Academies, Washington, D.C., 2002, pp. 47-54.
[25] Maher, A., Bennert, T., & Gucunski, N. Evaluation of the Humboldt Stiffness
Gauge. Report No. FHWA-NJ-2002_0002, Rutgers the State University of New
Jersey, Piscataway, 2002.
Page 163
162
[26] Mooney, M. A., Nocks, C. S., Selden, K. L., Bee, G. T., & Senseney, C. T.
Improving Quality Assurance of MSE Wall and Bridge Approach Earthwork
Compaction. Report No. CDOT-2008-11, Colorado Department of Transportation,
Denver, 2008.
[27] Humboldt Mfg. Co. GeoGauge User Guide. Version 4.1, Elgin, IL. 2007.
http://www.humbodtscientific.com/download/pdf/H-4140_MAN_0712.pdf. Accessed
May 15, 2015.
[28] Manjunath, K. C., & Amarnath, M. S., Structural Evaluation of Low Volume
Road Pavements Using Pavement Dynamic Cone Penetrometer. International
Journal of Research in Engineering and Technology, No. 1, 2013.
[29] Roctest Telemac Smartec. Instruction Manual: Soil Modulus Device for Bearing
Capacity and Compaction Control. No. E10304-110510. 2011.
http://www.roctest.com/content/download/1284/12285/file/e10304-110510_bcd.pdf.
Accessed May 15, 2015.
[30] American Society for Testing and Material (ASTM). Standard Test Method for
Laboratory Compaction Characteristics of Soil Using Modified Effort. Publication
number D1557-07, ASTM, Washington, DC, 2007.
[31] Roctest Telemac Smartec. Instruction Manual: Soil Modulus Device for Bearing
Capacity and Compaction Control. No. E10304-110510. 2011.
http://www.roctest.com/content/download/1284/12285/file/e10304-110510_bcd.pdf.
Accessed May 15, 2015.
[32] Minnesota Department of Transportation: Grading & Base Quality
Control/Quality Assurance (QC/QA): Pilot Specification. 2005-06.
http://www.dot.state.mn.us/materials/gbmodpi.html. Accessed September 1, 2015.
[33] Indiana Department of Transportation of Transportation Office of Materials
Management: Field Determination of Strength Using Dynamic Cone Penetrometer.
No. 509-15P. 2015. http://www.in.gov/indot/div/mt/itm/pubs/509_testing.pdf.
Accessed September 1, 2015.
Page 164
163
[34] American Society for Testing and Material (ASTM). Use of the Dynamic Cone
Penetrometer in Shallow Pavement Applications. Publication number D6951M - 09,
ASTM, Washington, DC, 2009.
[35] American Association of State Highway and Transportation Officials (AASHTO).
Standard Method of Test for Sampling of Aggregates. Publication number T 2,
AASHTO, Washington, DC, 2006.
Page 165
164
Appendix A
Survey of Alternative Devices
A.1 Survey Questions
1. Which of the following best describes your profession?
a. Manufacturer of the nuclear density gauge
b. Manufacturer of alternative device (specify)
c. Contractor
d. DOT personnel/engineer
e. Other:
2. Are you familiar with the nuclear density gauge? With (1) being no knowledge
whatsoever, and (5) being used/researched on a regular basis.
a. Not at all (1)
b. Slightly (2)
c. Moderately (3)
d. Substantially (4)
e. Expert (5)
3. What are the major advantages of using the nuclear density gauge?
a. Repeatability and accuracy (1) (2) (3) (4) (5)
b. Quick/Timely device measurement output (1) (2) (3) (4) (5)
c. Ease of data processing and interpretation (1) (2) (3) (4) (5)
4. What are the major disadvantages of using the nuclear density gauge?
a. Expensive and timely training and certification (1) (2) (3) (4) (5)
b. Specialized and isolated storage (1) (2) (3) (4) (5)
c. Expensive cost and operation cost (1) (2) (3) (4) (5)
d. Potential safety hazards (1) (2) (3) (4) (5)
e. Density measured rather than a design property (1) (2) (3) (4) (5)
5. Select all of the following devices you have previously used:
a. GeoGauge
b. Dynamic cone penetrometer
c. Light weight falling deflectometer
d. Briaud compaction device
e. PaveTracker
f. Other:
Page 166
165
g. None
6. For alternative devices to the nuclear density gauge, please rank the importance of the
following criteria, 1 being not important 5 being extremely important:
a. Repeatability of field measurements (1) (2) (3) (4) (5)
b. Time needed for field measurements (1) (2) (3) (4) (5)
c. Ease of data processing and int. (1) (2) (3) (4) (5)
d. Sensitivity to enviro. factors (moisture) (1) (2) (3) (4) (5)
e. Ease of use and accuracy (1) (2) (3) (4) (5)
f. Cost (1) (2) (3) (4) (5) g. Additional comments about the factors listed as well as other factors/parameters
not listed:
7. The GeoGauge: (Where 1 is Strongly Disagree, 5 is Strongly Agree)
a. Has high repeatability and accuracy (1) (2) (3) (4) (5)
b. Provides easy data processing (1) (2) (3) (4) (5)
c. Has optimal operation and testing time (1) (2) (3) (4) (5)
d. Contains high ease of use (1) (2) (3) (4) (5)
e. Is not affected by enviro. factors (moisture) (1) (2) (3) (4) (5) f. Not negatively affected by lower layer properties (1) (2) (3) (4) (5)
g. Has reasonable cost (1) (2) (3) (4) (5) h. Readings properly represent field conditions (various levels of
compaction/density)
8. Based on your experience with the GeoGauge, state the negative and positive
experiences unique to this device:
9. The dynamic cone penetrometer: (Where 1 is Strongly Disagree, 5 is Strongly Agree)
a. Has high repeatability and accuracy (1) (2) (3) (4) (5)
b. Provides easy data processing (1) (2) (3) (4) (5)
c. Has optimal operation and testing time (1) (2) (3) (4) (5)
d. Contains high ease of use (1) (2) (3) (4) (5)
e. Is not affected by enviro. factors (moisture) (1) (2) (3) (4) (5) f. Not negatively affected by lower layer properties (1) (2) (3) (4) (5)
g. Has reasonable cost (1) (2) (3) (4) (5)
h. Readings properly represent field conditions (various levels of
compaction/density)
10. Based on your experience with the dynamic cone penetrometer, state the negative
and positive experiences unique to this device.
Page 167
166
11. The light weight falling deflectometer:
a. Has high repeatability and accuracy (1) (2) (3) (4) (5)
b. Provides easy data processing (1) (2) (3) (4) (5)
c. Has optimal operation and testing time (1) (2) (3) (4) (5)
d. Contains high ease of use (1) (2) (3) (4) (5)
e. Is not affected by enviro. factors (moisture) (1) (2) (3) (4) (5) f. Not negatively affected by lower layer properties (1) (2) (3) (4) (5)
g. Has reasonable cost (1) (2) (3) (4) (5)
h. Readings properly represent field conditions (various levels of
compaction/density)
12. Based on your experience with the light weight falling deflectometer, state the
negative and positive experiences unique to this device.
13. The Briaud compaction device:
a. Has high repeatability and accuracy (1) (2) (3) (4) (5)
b. Provides easy data processing (1) (2) (3) (4) (5)
c. Has optimal operation and testing time (1) (2) (3) (4) (5)
d. Contains high ease of use (1) (2) (3) (4) (5)
e. Is not affected by enviro. factors (moisture) (1) (2) (3) (4) (5) f. Not negatively affected by lower layer properties (1) (2) (3) (4) (5)
g. Has reasonable cost (1) (2) (3) (4) (5) h. Readings properly represent field conditions (various levels of
compaction/density)
14. Based on your experience with the Briaud, state the negative and positive
experiences unique to this device.
15. The PaveTracker:
a. Has high repeatability and accuracy (1) (2) (3) (4) (5)
b. Provides easy data processing (1) (2) (3) (4) (5)
c. Has optimal operation and testing time (1) (2) (3) (4) (5)
d. Contains high ease of use (1) (2) (3) (4) (5)
e. Is not affected by enviro. factors (moisture) (1) (2) (3) (4) (5) f. Not negatively affected by lower layer properties (1) (2) (3) (4) (5)
g. Has reasonable cost (1) (2) (3) (4) (5)
h. Readings properly represent field conditions (various levels of
compaction/density)
16. Based on your experience with the PaveTracker, state the negative and positive
experiences unique to this device.
Page 168
167
17. Overall, rank the suitability of the following devices in the replacement of the nuclear
density gauge from 1-5 with 1 being a very poor alternative and 5 being an excellent
alternative.
a. GeoGauge (1) (2) (3) (4) (5) (NA)
b. Dynamic cone penetrometer (1) (2) (3) (4) (5) (NA)
c. Light weight falling deflectometer (1) (2) (3) (4) (5) (NA)
d. Briaud compaction device (1) (2) (3) (4) (5) (NA)
e. PaveTracker (1) (2) (3) (4) (5) (NA)
18. Based on your knowledge of the following alternative devices to the nuclear density
gauge, if you had to theoretically select one of the devices for implementation, which
device would you use?
a. GeoGauge
b. Dynamic cone penetrometer
c. Light weight falling deflectometer
d. Briaud compaction device
e. PaveTracker
f. Other:
g. I still prefer nuclear density gauge
19. Please explain your rationale to the previous question.
20. Specify your agency’s level of interest in stiffness/strength based devices for
compaction control of unbound materials:
a. Not interested
b. Slightly interested
c. Moderately interested
d. Substantially interested
e. Extremely interested
21. Specify your agency’s level of interest in implementing stiffness/strength based
devices for compaction control of unbound materials:
a. Not interested in implementing it
b. Interested, but have not implemented it
c. Interested and will implement it
d. Interested and have already implemented it
e. Other:
Page 169
168
22. Ultimately, do you feel a transition to an alternative device is possible?
a. Yes
b. No
c. I don’t know
23. Which factors/obstacles do you feel will be most challenging in the widespread
implementation of a new device with (1) being not challenging and (5) being extremely
challenging?
a. Need for new equipment (1) (2) (3) (4) (5)
b. Lack of funds (1) (2) (3) (4) (5)
c. Lack of trained personnel (1) (2) (3) (4) (5)
d. Familiarity of contractors with such devices (1) (2) (3) (4) (5)
24. Additional comments regarding factors that you feel will affect the widespread
implementation of a new device, alternative devices, nuclear density gauge, or other
aspects not covered in this survey:
Page 170
169
A.2 Survey Results
Page 184
183
Appendix B
Compaction Quality Control of Unbound Subgrade and Base/Subbase Layers
Through Use of the Dynamic Cone Penetrometer.
1. SCOPE.
1.1 This specification covers the compaction quality control of aggregate pavement
layers consisting of unbound subgrade and base/subbase materials through the
use of the Dynamic Cone Penetrometer (DCP).
2. REFERENCED DOCUMENTS.
2.1 ASTM Standards.
D 6951 Use of the Dynamic Cone Penetrometer in Shallow Pavement
Applications
D 7380 Soil Compaction Determination at Shallow Depths Using 5-lb (2.3
kg) Dynamic Cone Penetrometer
D 1557 Standard Test Methods for Laboratory Compaction Characteristics of
Soil Using Modified Effort
2.2 AASHTO Standards.
T 2 Standard Method of Test for Sampling of Aggregates
2.3 NJDOT Standards.
200 Standard Specifications for Road and Bridge Construction: Earthwork
300 Standard Specifications for Road and Bridge Construction: Subbase
and Base Courses
3. SIGNIFICANCE AND USE.
1. This procedure is utilized for the acceptance of compacted unbound subgrade
and base/subbase pavement layers.
4. DEVICE.
1. The Dynamic Cone Penetrometer includes a 22.6-inch (575-mm) upper fixed
steel rod containing a 17.6 lbs. (8-kg) steel hammer. Located at lower end of the
Page 185
184
device is a 0.629-inch (16-mm) diameter rod with an anvil that acts as a lower
stopping mechanism for the falling hammer. In addition, the anvil serves as a
connector between the two rods and allows the device to be dissembled for easy
transport. The length of the lower rod is 24-inch (609.6-mm). At the base of the
lower rod is a 0.79-inch (20-mm) diameter steel cone with an apex angle of 60
degrees (Note - 1). The device is tested in accordance to ASTM D6951 or
ASTM D7380 standards. The device is to be retrofitted with an automatic
ruler that is marked in 0.2-inch (5-mm) increments to indicate the
required penetration of the device onto the steel rod and resulting penetration
per blow values.
Note 1 – The cone tip may be replaced throughout testing as it becomes trapped
in the soil during the extraction of the DCP from the compacted layer. This
generally pertains to more coarse materials that contain larger aggregate
particles that restrict the cones upward movement.
5. MATERIALS.
1. The Contractor is to use aggregate material that conforms to the requirements of
the specifications listed in Table 6.1.
Table 6.1 Material Specifications.
Material Specification
NJDOT Subgrade NJDOT 901.11
NJDOT Base/Subbase NJDOT 901.11
2. Unless specified otherwise, the Contractor is to provide necessary stockpile at
the designated site that meets the specifications provided in Table 6.1.
3. The Contractor accepts full responsibility for the placement and compaction of
acceptable material at the designated site.
4. Should the material not meet the specifications listed in Table 6.1 the RE may
require the Contractor to replace or exclude such material prior to compaction
of the subgrade or base/subbase layer.
6. PROCEDURE.
1. Assemble the DCP equipment and attach the replaceable cone tip to the foot of
the lower rod as shown in Figure B.1 below. Before proceeding with testing,
ensure all parts are securely fastened.
2. Unless specified otherwise, it is recommended to conduct DCP testing by any
one of the following methods:
Page 186
185
6.2.1. Control Strip. A control strip of 400-square yards (334.5-square
meters) or greater is to be constructed to perform the DCP test at 10
randomly selected locations (Note - 2).
Note 2 – The procedure for conducting DCP testing shall be in
accordance to methods specified in 203.03.02.B of the NJDOT
specifications for determining compaction requirements based on
density acceptance.
6.2.2. Random Selection of Test Points. DCP testing should be conducted at
10 randomly selected locations within the designated site at a minimum
of 3-ft. (0.9-m) increments of each other (Note – 3).
Note 3 – It is recommended to conduct DCP testing in a similar fashion
as to the methods specified in 203.03.02.D or 302.03.01B of the NJDOT
specifications.
3. Using either method provided in Section 6.2, calculate an average DCP value
from the complete set of testing results measured at the designated site.
4. The DCP test shall be conducted until a depth of 15-inches (38.1-cm) of the
compacted material is reached.
5. For areas in which the depth of the layer is less than 15-inches (38.1-cm) it is
recommended to conduct the DCP test for the entire thickness of the layer.
6. Testing shall be conducted using the DCP at the designated site within 24 hours
of placement and final compaction.
7. Testing should not to be conducted later than 24 hours to avoid overestimating
DCP measurements.
7. ACCEPTANCE CRITERIA.
1. Gradation. Use aggregate material that is in accordance to the gradation
designations I-1 through I-15 of the NJDOT specifications.
2. The gradation specifications shall apply to the material following the placement
and compaction at the designated site (Note – 4).
Note 4 – If compaction is not anticipated the aggregates material should meet
the gradation specifications during its placement at the designated site.
3. Acceptable gradation specifications are to be maintained through implementing
one of the random sampling procedures as specified in AASHTO T 2.
Page 187
186
4. Moisture Content Control. The material will be deemed acceptable based on
one of the following two acceptance criteria:
7.4.1. Implicit
conform
Moisture Content Control. Acceptable materials are to
to the requirements of the specifications presented in Table
7.4.1
Table 7.4.1 Minimum Acceptable DCP Values.
Material
Percent Passing (%)
Sieve No. 4
(4.75 mm)
Sieve No. 200
(75 µm)
Minimum DCP
Value
(blows/inch.)
Minimum DCP
Blows for (1-ft layer)
(rounded to the
nearest 5 DCP blows)
Min. Max. Min. Max.
NJDOT Subgrade
40 100 0 8 1.5 18 (20)
NJDOT Base/Subbase
25 50 3 10 3.4 41 (40)
7.4.2. Explicit Moisture Content Control. Acceptable materials are in
compliance with the requirements of the specifications presented in
Table 7.4.2 (Note – 5).
Note 5 – Samples for moisture content will be taken at random prior to
compaction, in accordance with random sampling procedures provided
in AASHTO T 2.
Page 188
187
Table 7.4.2 Minimum Acceptable DCP Values.
Material
Percent Passing (%)
Sieve No. 4
(4.75 mm)
Sieve No. 200
(75 µm)
Moist. Cont.
Diff. (%)
Minimum
DCP Value
(blows/inch.)
Minimum DCP Blows for
(1-ft layer) (rounded to
the nearest 5 DCP blows)
Min. Max. Min. Max. Min. Max.
NJDOT
Subgrade
40 100 0 8 0 2 1.3 16 (15)
40 100 0 8 -2 0 1.5 18 (20)
40 100 0 8 -4 -2 1.9 23 (25)
40 100 0 8 -6 -4 2.2 27 (25)
NJDOT
Base/Subbase
25 50 3 10 0 2 3.2 39 (40)
25 50 3 10 -2 0 3.4 41 (40)
25 50 3 10 -4 -2 3.8 46 (45)
25 50 3 10 -6 -4 4.1 50 (50)
5. Acceptable material shall contain an average DCP value, as measured in Section
6.2, equal to or greater than the minimum acceptable DCP values specified.
6. For the materials that do not meet the specifications provided it is recommended
to correct the material as needed in order to achieve the minimum acceptable
DCP value.
8. DOCUMENT. While conducting the DCP test document the following information
and submit to the RE:
1. The number of hammer blows required to penetrate the layer between test
readings.
2. Cumulative depth of penetration after each set of hammer blows.
3. Difference in cumulative penetration between each reading.
4. The penetration depth per blow (Note – 6).
(Note 6 – This value is obtained by dividing the
penetration between each reading by the number of
blows measured.)
5. The rate of penetration between each test reading.
6. Assessment on acceptable/unacceptable compacted material.
Page 189
188
Figure B.1: Assembly Schematic of the DCP [33]