Determination of optimum drawpoint layout in block caving using sequential Gaussian simulation
E Ugarte University of Alberta, Canada
Y Pourrahimian University of Alberta, Canada
JB Boisvert University of Alberta, Canada
Abstract The economics of today’s mining industry are such that the major mining companies are increasing the use of massive mining methods. Caving methods have become the underground bulk mining method of choice and are expected to continue as such in the foreseeable future. Caving methods are favoured because of their low cost and high production rates. They offer a much smaller environmental footprint compared to equivalent open pit operations due to the much smaller volume of waste to be moved and handled.
Drawpoint spacing is an essential part of the block cave layout design which must be investigated carefully at the start of the project. In this paper, an overall methodology based on sequential Gaussian simulation (SGS) to obtain the drawpoint spacing is suggested. The optimised drawpoint spacing is used to maximise the profit since the extraction layout is highly essential for the economics of block caving. This study is opening a new horizon for using ‘all realisations all the time’ as a new approach to solve one of the trickiest elements of blocks caving.
1 Introduction Mining companies around the world are constantly searching for tools to maximise the profitability of their projects. Optimisation of design, planning, and operation are common, not only in open pit operations but also in underground mines. Among underground mining methods, block caving is typically a large‐scale method and one of the few economical techniques for the extraction of deep and large low‐grade material (Castro et al. 2012); however, caving is very challenging because its operational complexity is largely affected by the initial design which has limited flexibility once the drawpoints have been set. Drawpoint location is a critical element in the design of block caving layouts since spacing has a tremendous impact on production, dilution and extraction rate. The design of the production layout relies on available exploration data, geological interpretation and a geostatistical model of mine grades and geomechanical parameters.
The majority of block caving mines use kriging as the main technique to estimate resources. Therefore, the block model generated in kriging is used to generate the layout for production. There are a number of drawbacks, including:
Only a single response can be calculated (i.e. a single net present value (NPV)).
It is difficult to assess uncertainty in the response (i.e. NPV, tonnes per year, dilution, production rate, etc.).
The impact of the smoothing effect of kriging is difficult to quantify.
Optimisation of the production layout based on kriging will not consider grade uncertainty and is, therefore, suboptimal.
An improved technique is to optimise the initial layout based on multiple models of grade that span the uncertainty in the deposit. In this work, these models (aka realisations, aka simulations) are generated with
sequential Gaussian simulation (SGS). The difficulty with using multiple models is that the layout must be optimised over all n realisations; this is different than a common implementation where the layout is optimised for a kriged model (or averaged SGS realisations) and then n realisations are used to assess uncertainty in NPV, grade, etc. Rather, the optimal layout that gives the maximum NPV over all realisations is found in the proposed methodology. This allows the practitioner to select the layout that is optimal given geological uncertainty rather than select a suboptimal layout based on kriging and then assess uncertainty in a post‐processing framework. This results in a better risk assessment for economic indicators as well as safety concerns.
2 Methodology In modern geostatistics, Monte Carlo simulation (MCS) is a well‐known computational algorithm; it relies on sampling conditional distributions. This algorithm is represented by the formulation of a problem with input variables (such as drillhole data, a kriged model or SGS realisations), a transfer function (such as a mine plan and resulting production per year), and the computed response variables (such as NPV) which are assessed by a probability distribution (Deutsch 2015), as shown in Figure 1.
Figure 1 Monte Carlo simulation concepts (Deutsch 2015)
First, the input variable (Cu) is simulated with SGS to generate 40 equally probable realisations. For this purpose, GSLIB, Geostatistical Software Library (Deutsch & Journel 1998), were used. Various drawpoint layouts can be selected for the transfer function and the NPV for each realisation is calculated. Geovia PCBC (Personal Computer Block Caving) is used here as the transfer function and calculates NPV (USD) for a given realisation; in addition to the realisations, mining parameters such as cost, fragment size, layout type, etc. are required. The transfer function converts the simulated Cu values of every realisation into a response variable; in other words, one realisation is considered as one block model and results in one NPV value. For a given mine layout, the final result is a distribution of 40 NPV values that quantify how optimal this layout is. The optimal layout is obtained by repeating this for different mine layouts and selecting the mine layout with the best distribution of NPV values. The most common criterion to determine the best distribution of NPV values is to select the one with the highest average NPV; it should be noted that this is not the same as optimising the mine layout on the average model of the 40 realisations, rather, the proposed method obtains the best layout over all realisations.
The main contribution of this work is to illustrate a methodology to obtain the optimal drawpoint spacing based on a set of stochastic realisations. Moreover, advantages of the proposed approach over previous techniques are highlighted.
The present study is organised into four main steps:
Step 1: Data analysis, statistics, and variography.
Step 2: Geostatistical modelling with SGS.
Step 3: Setting of mining parameters and the transfer function to calculate NPV with PCBC.
Step 4: Output results are processed to obtain the optimised drawpoint spacing.
Optimal drawpoint spacing within the initial footprint.
Confirm the best level of extraction based on the optimal drawpoint spacing.
Conduct a second optimisation for further refinement.
This methodology is demonstrated in a brief study that provides a concise illustration of the optimisation of the drawpoint layout.
2.1 Data analysis, statistics, and variography The study data is composed of 55 synthetic drillholes that were resampled from a confidential block model of a real block caving mine; the data used is not the original (confidential) data, rather, the geostatistical model generated from the real data is resampled to obtain this semi‐synthetic realistic data. This data considers Cu as the continuous variable of interest and the orebody extents in each drillhole are known. The drilling assays have been composited to 10 m. The location of the 50 drillholes and their composites are shown in Figure 2.
Figure 2 Composites of the drillholes used in this study
An exploratory data analysis of the composites is performed to obtain the global mean and variance of the copper grades. The global declustered mean of Cu is 0.229% with a variance of 0.122. Additional statistical analysis and geostatistical interpretations are performed to group populations before domain definition.
The geological definition was generated with implicit modelling software based on distance functions (Silva & Deutsch 2012). There are two modelling domains, Dom 1 represents the porphyry intrusion and Dom 2 is the country rock (Figure 3). The Cu distribution within the orebody is shown in Figure 5. The data are transformed to normal score values for input to SGS (Figure 4).
Figure 3 One slice of Dom 1 and Dom 2
Determination of optimum drawpoint layout in block caving E Ugarte et al. using sequential Gaussian simulation
Figure 4 Declustered Cu histograms for domain Dom 1. (a) Original data; and, (b) Normal score data
Figure 5 Fitted horizontal Cu variogram for Dom 1, the major direction (dir1) and minor direction (dir2)
Variograms are used to quantify the spatial continuity/variability of grades. This work considers the building and modelling of two types of variograms. These are the indicator variogram model of rock type and the continuous variogram model of Cu. The horizontal experimental and modelled variogram of Cu are shown in Figure 5. These models contain two nested spherical structures, and the major (dir1) and minor (dir2) directions are 90° and 0° respectively.
2.2 Geostatistical modelling First, 40 sequential indicator simulation (SIS) realisations are generated. The SIS realisations are used to indicate ore and waste. Modelling details include:
The model contains 1,210,000 blocks with cell dimensions of 20 × 20 × 15 m.
Data used for input are the declustered and normalised data (Figure 4).
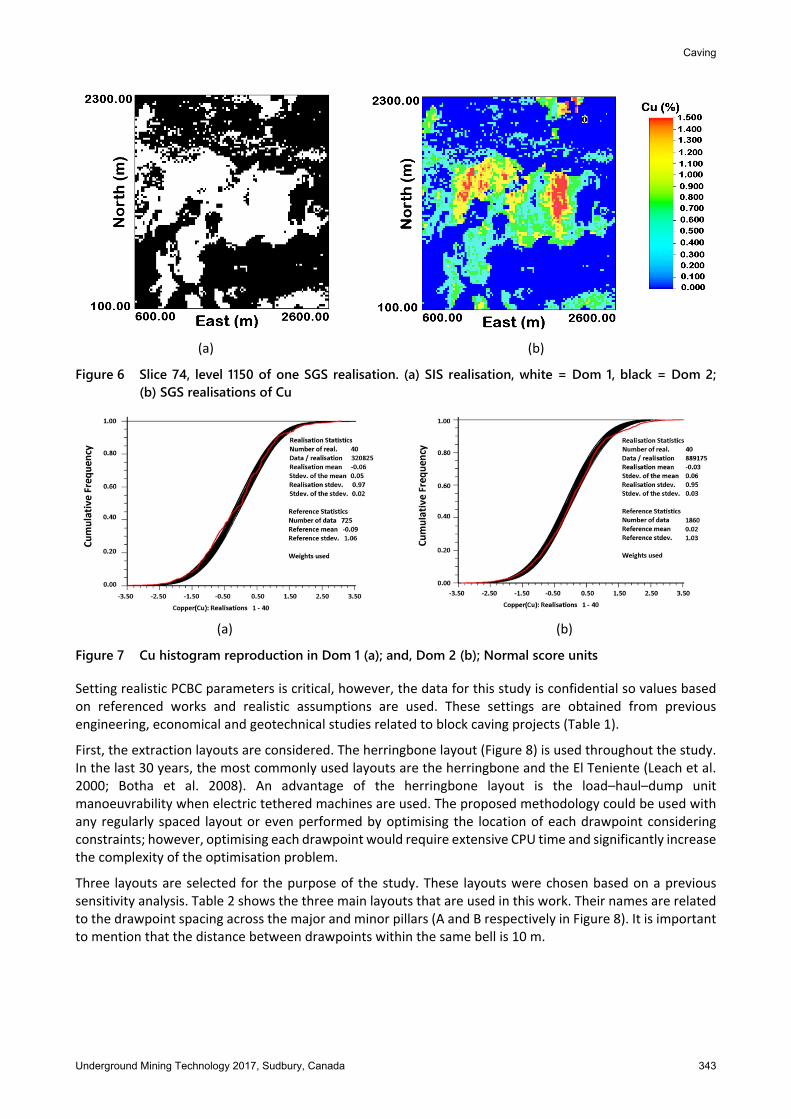
To generate multiple conditional Cu realisations with SGS and SIS the modelled variograms (Figure 5) are required. Figure 6 illustrates one slice of the SGS model.
Figure 7 shows good reproduction of the Cu distributions in the SGS models.
Figure 6 Slice 74, level 1150 of one SGS realisation. (a) SIS realisation, white = Dom 1, black = Dom 2; (b) SGS realisations of Cu
(a) (b)
Figure 7 Cu histogram reproduction in Dom 1 (a); and, Dom 2 (b); Normal score units
Setting realistic PCBC parameters is critical, however, the data for this study is confidential so values based on referenced works and realistic assumptions are used. These settings are obtained from previous engineering, economical and geotechnical studies related to block caving projects (Table 1).
First, the extraction layouts are considered. The herringbone layout (Figure 8) is used throughout the study. In the last 30 years, the most commonly used layouts are the herringbone and the El Teniente (Leach et al. 2000; Botha et al. 2008). An advantage of the herringbone layout is the load–haul–dump unit manoeuvrability when electric tethered machines are used. The proposed methodology could be used with any regularly spaced layout or even performed by optimising the location of each drawpoint considering constraints; however, optimising each drawpoint would require extensive CPU time and significantly increase the complexity of the optimisation problem.
Three layouts are selected for the purpose of the study. These layouts were chosen based on a previous sensitivity analysis. Table 2 shows the three main layouts that are used in this work. Their names are related to the drawpoint spacing across the major and minor pillars (A and B respectively in Figure 8). It is important to mention that the distance between drawpoints within the same bell is 10 m.
Determination of optimum drawpoint layout in block caving E Ugarte et al. using sequential Gaussian simulation
Table 1 Relevant mining parameters and assumptions used within Geovia PCBC (Ahmed et al. 2014; Diering 2000, 2013; Laubscher 1994, 2000)
Parameters and assumptions
Value Unit Description
% of fines 30 % Based on a model of fines
Density 2.5 kg/cm3 Average density for the domains
HIZ 100 m Height for interaction zone
Swell factor 1.2 – Stablished by experience
HOD_MAX 500 m Maximum height of development
HOD_MIN 30 m Minimum height of development
Initial elevation 1,150 m Initial elevation of extraction
Radius of draw cone 5 m Based on fragment sizes
Layout type – – Herringbone
Figure 8 A typical herringbone layout (Chitombo 2010)
Table 2 Three of the drawpoint layouts used to find the optimal NPV
Layout name A (m) B (m)
20 × 10 20 10
20 × 15 20 15
20 × 20 20 20
In addition to the layout, values such as rock density and percent of fines are also required. The average fragment size, where the rock is moderately fractured, is assumed to range from 0.5 to 1 m3. Consequently, the radius of the draw cones is set to 5 m. The initial level of extraction is assumed to be 1,150 m using PCBC’s Footprint Finder, however, this is optimised after the layout of the drawpoints is considered.
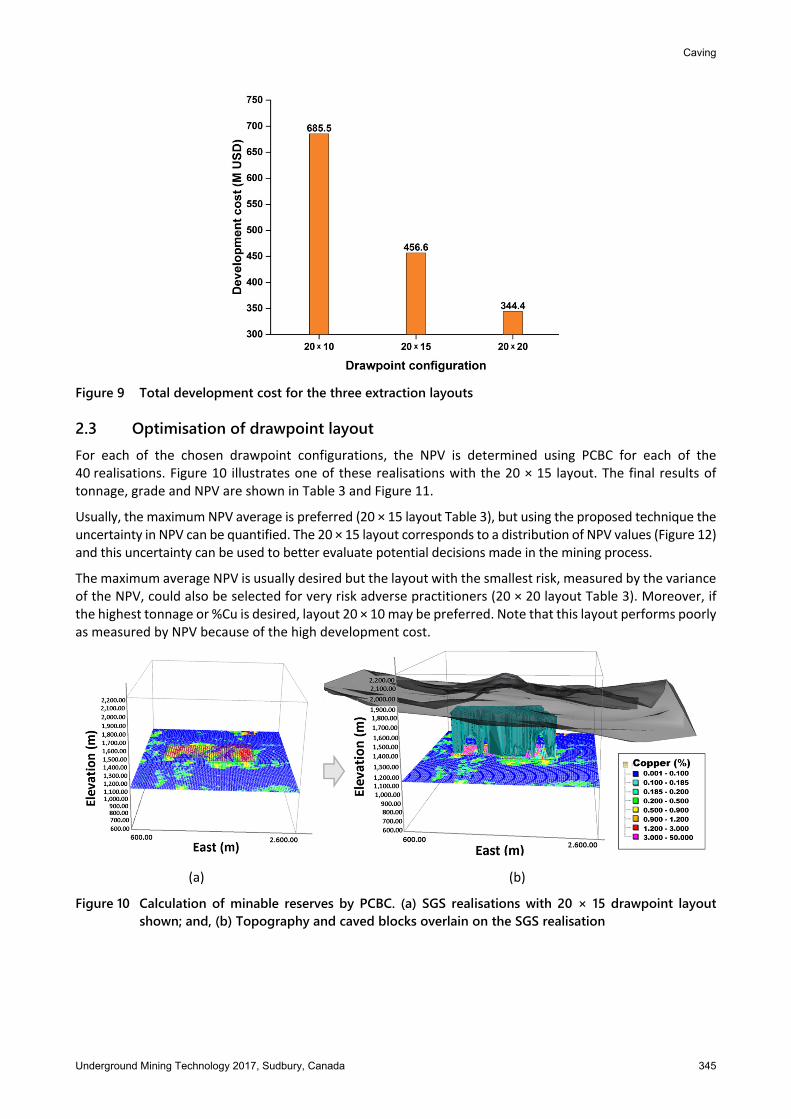
The development cost for each layout configuration is shown in Figure 9. This cost depends on the number of drawpoints in the layout. The number of drawpoints and the distance between them are critical factors that help calibrate the amount of dilution without losing ore production while also minimising development cost. For example, the total development cost increases when the chosen configuration has a large number of drawpoints.
Figure 9 Total development cost for the three extraction layouts
2.3 Optimisation of drawpoint layout For each of the chosen drawpoint configurations, the NPV is determined using PCBC for each of the 40 realisations. Figure 10 illustrates one of these realisations with the 20 × 15 layout. The final results of tonnage, grade and NPV are shown in Table 3 and Figure 11.
Usually, the maximum NPV average is preferred (20 × 15 layout Table 3), but using the proposed technique the uncertainty in NPV can be quantified. The 20 × 15 layout corresponds to a distribution of NPV values (Figure 12) and this uncertainty can be used to better evaluate potential decisions made in the mining process.
The maximum average NPV is usually desired but the layout with the smallest risk, measured by the variance of the NPV, could also be selected for very risk adverse practitioners (20 × 20 layout Table 3). Moreover, if the highest tonnage or %Cu is desired, layout 20 × 10 may be preferred. Note that this layout performs poorly as measured by NPV because of the high development cost.
(a) (b)
Figure 10 Calculation of minable reserves by PCBC. (a) SGS realisations with 20 × 15 drawpoint layout shown; and, (b) Topography and caved blocks overlain on the SGS realisation
Determination of optimum drawpoint layout in block caving E Ugarte et al. using sequential Gaussian simulation
Table 3 Summary of tonnage, grade and net value for 40 realisations
Configuration Minimum Maximum Average
Tonnage (Mtonne)
20 × 10 234 315 285
20 × 15 220 267 249
20 × 20 184 221 207
Grade (%Cu)
20 × 10 0.68 0.78 0.72
20 × 15 0.60 0.69 0.65
20 × 20 0.55 0.65 0.61
NPV (M USD)
20 × 10 919 1,998 1,516
20 × 15 1,530 2,384 2,046
20 × 20 1,581 2,256 1,989
Figure 11 Grey thin curves represent the responses (NPV) of 40 stochastic realisations. Thick blue line represents the average result. Note values are extrapolated between each of the three tested layouts
Figure 12 Distribution of net values for the 20 × 15 layout. The mean is USD 2,046 M
As mentioned previously, the total development cost depends on the number of drawpoints. When drawpoints are closer, development is expensive and dilution may increase, but tonnage recovered is also high. Increasing drawpoint spacing can reduce profit due to ore lost. Figure 13 shows that the 20 × 15 layout increases profit, reaching an average NPV of USD 2,046 M.
The optimal layout could be further refined by assessing additional layouts between 20 × 20 and 20 × 10, such as 20 × 17.5 or 20 × 12.5. This type of binary search can be repeated until the user is satisfied with the level of precision in the optimisation.
Figure 13 Production tonnage and profit for different configurations
2.4 Optimisation of the extraction level Once the optimum layout is known, the extraction level can be optimised. Four levels: 1,030, 1,090, 1,150, and 1,180 m were selected and the NPV of each of the 40 realisations is determined using a 20 × 15 layout. The calculation of NPV with PCBC at the four proposed levels of extraction shows that the maximum average NPV is achieved at the 1,150 m level (Figure 14). As with the layout optimisation, further refinement could be made by testing the 1,065 m and 1,120 m level.
Determination of optimum drawpoint layout in block caving E Ugarte et al. using sequential Gaussian simulation
Figure 14 Grey thin curves represent the responses (NPV) of 40 stochastic realisations. Thick blue line represents the average result. Note values are extrapolated between each of the four tested layouts
Additional optimisation steps could be performed iteratively. In this study, the layout is optimised followed by the extraction level. With the new extraction level, the optimal layout could be revaluated using the same procedure described in Section 2.4. With this new optimal layout, the optimal extraction level could be revaluated as in Section 2.5. This could be repeated until the practitioner is satisfied with the result, successive iterations would eventually converge on the optimal value for the mine and the user must define their level of tolerance (usually based on the block size). It is important to mention that further parameter analysis will be conducted to measure the influence of dilution, fragmentation, and rock quality for improving this approach.
3 Conclusion This paper provides an approach for using a set of stochastic realisations to solve a practical engineering concern in block caving. The proposed methodology optimises drawpoint spacing over multiple geostatistical realisations rather than simply using geostatistical realisations in a post‐processing framework to assess a layout based on a kriged model.
Acknowledgement The authors thank the Centre for Computational Geostatistics (CCG) and the Mining Optimisation Laboratory (MOL) of the University of Alberta.
References Ahmed, H, Scoble, M & Dunbar, S 2014, ‘A comparison between offset herringbone and El Teniente underground cave mining
extraction layouts using a discrete event simulation technique’, International Journal of Mining Reclamation and Environment, vol. 30, no. 2, pp. 1–21.
Botha, J, Watson, S, Arkadius, T & Samosir, E 2008, ‘Simulation applications at PT Freeport Indonesia’s DOZ/ESZ block cave mine’, Proceedings of the 5th International Conference and Exhibition on Mass Mining, Luleå, pp. 237–246.
Castro, R, Vargas, R, & Huerta, F 2012, ‘Determination of drawpoint spacing in panel caving: a case study at El Teniente mine’, The Journal of the Southern African Institute of Mining and Metallurgy, vol. 112, no. 10, pp. 871–876.
Chitombo, GP 2010, ‘Cave mining: 16 years after Laubscher's 1994 paper ‘Cave mining–state of the art’’, Mining Technology, vol. 119, no. 3, pp. 132–141.
Deutsch, CV & Journel, AG 1998, GSLIB: Geostatistical Software Library and User's Guide, 2nd edn, Oxford University Press, New York. Deutsch, CV 2015, ‘All realisations all the time’, Proceedings of the CCG 17th Annual Meeting, University of Alberta, Edmonton, paper
2015‐101. Diering, T 2000, ‘PC‐BC: A block cave design and draw control system’, in G Chitombo (ed.), Proceedings of MassMin 2000, The
Australasian Institute of Mining and Metallurgy, Melbourne, pp. 469–484. Diering, T 2013, Reserve Estimation Using GEOVIA PCBC, Dassault Systemes Geovia Inc., Vancouver. Laubscher, DH 1994, ‘Cave mining‐the state of the art’, Journal of the South African Institute of Mining and Metallurgy, vol. 94, no. 10,
pp. 279–293. Laubscher, DH 2000, Block Caving Manual, prepared for the International Caving Study, Julius Kruttschnitt Mineral Research Centre
and Itasca Consulting Group, Inc., Brisbane. Leach, A, Naidoo, K & Bartlett, P 2000, ‘Considerations for design of production level drawpoint layouts for a deep block cave’,
in G Chitombo (ed.), Proceedings of MassMin 2000, The Australasian Institute of Mining and Metallurgy, Melbourne, pp. 356–366.
Silva, DA & Deutsch, CV 2012, ‘Modeling multiple rock types with distance functions: methodology and software’, Proceedings of the Centre for Computational Geostatistics 14th Annual Meeting, University of Alberta, Edmonton, paper 2012‐307.
Determination of optimum drawpoint layout in block caving E Ugarte et al. using sequential Gaussian simulation