1 E-waste Report Determination of regulated elements in seven types of discarded consumer electronic products Hazardous Material Laboratory California Department of Toxic Substances Control January 2004
Transcript
1
E-waste Report
Determination of regulated elements in seven types of discarded consumer electronic products
Hazardous Material Laboratory California Department of Toxic Substances Control
January 2004
2
Table of Contents
Table of Contents ......................................................................................................................... 2 Executive Summary ..................................................................................................................... 3 Introduction.................................................................................................................................... 4 Materials and Methods ................................................................................................................ 4
Appendix ASOP-733S. Sample Preparation of Electronic Waste (E-waste) Samples for the Analysis of Semi-volatiles and Metals
Appendix B Table QC-I. QC and MS/MSD for Total Extractable Concentrations Table QC-II. QC and MS/MSD for TCLP Table QC-III QC and MS/MSD for WET
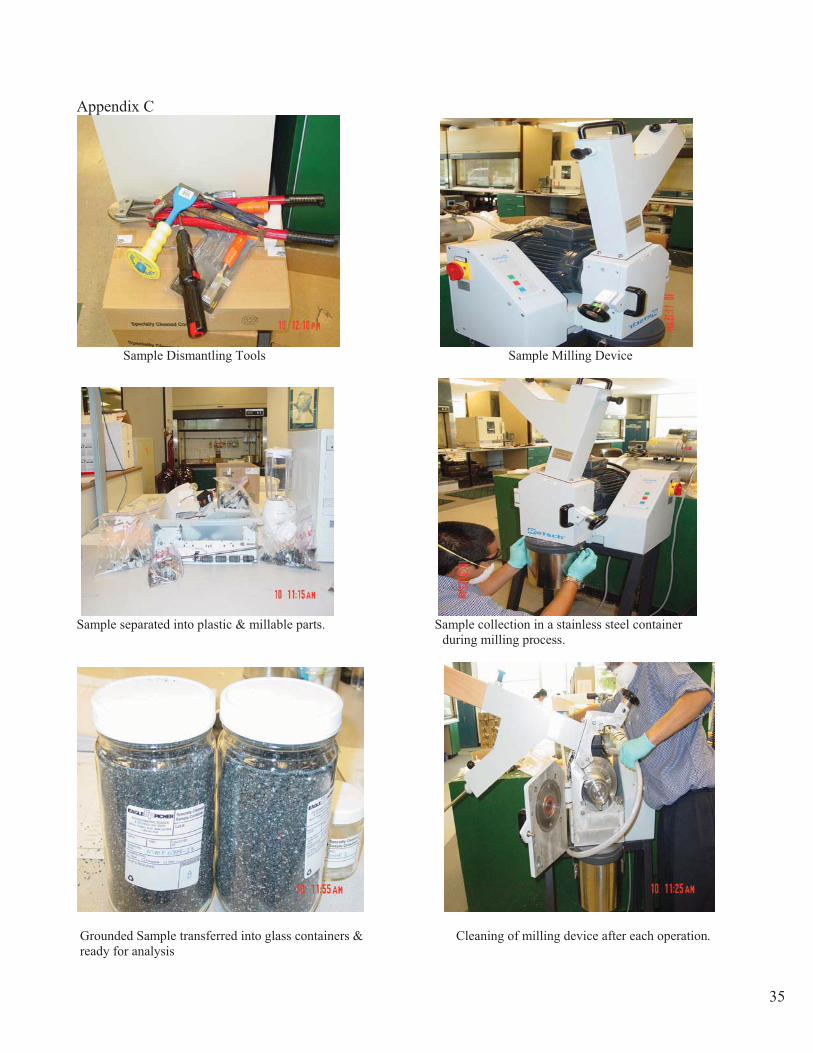
Appendix C Photographs
3
Executive SummaryAt the request of the DTSC Regulatory Program and Development Division (RPDD), Hazardous Waste Management Program, the Hazardous Materials Laboratory (HML) arranged for the testing of selected waste electronic devices (e-waste) to determine the total and extractable concentrations of regulated elements for comparison with hazardous waste criteria. Seven electronic product types (microwave ovens, VCRs, printers, CPUs, cell phones, telephones, and radios) were identified and, from each product type, four devices of various brands and models were collected by RPDD and submitted for analysis.
A protocol was developed to address the particular challenges of the e-waste samples. Devices were dismantled individually, and components classified into millable parts (plastic casings and printed circuit boards without capacitors or batteries), and non-millable parts (metal frames, rods, capacitors, batteries and other metal parts). The weights of the millable and non-millable components were recorded. All millable components were ground to pass a 2mm sieve and mixed well. Representative sub-samples were digested using EPA Method 3050, or extracted using the Toxicity Characteristic Leaching Procedure (TCLP), or extracted using the California Waste Extraction Test (WET). Results were extrapolated to the entire device based on relative weights and with the assumption that non-millable components did not contain any regulated elements.
Results indicate that all the product types tested clearly exceeded at least one hazardous waste criterion. Lead was the most common element exceeding its limits.
4
IntroductionAt the request of the Regulatory Program and Development Division (RPDD), Hazardous Waste Management Program, the Hazardous Materials Laboratory (HML) arranged for the testing of electronic devices to determine the total and soluble concentrations of regulated elements for comparison with hazardous waste criteria in Title 22, Chapter 11, Article 3. Specific testing performed on the electronic devices were the Toxicity Characteristic Leaching Procedure (TCLP); California Waste Extraction Test (WET), and EPA Method 3050 followed by elemental testing. The results of these analytical tests were compared to hazardous waste regulatory thresholds for each analytical test: the Toxicity Characteristic regulatory level, the Soluble Threshold Limit Concentrations and Total Threshold Limit Concentrations, respectively.
Chemical analysis of e-wastes presents challenges because of the physical nature of these devices (size, composition), and the potential heterogeneity within devices and between devices. A protocol was prepared to measure this heterogeneity, by testing four devices of seven different product types, plus testing selected devices in triplicate to measure within-sample heterogeneity.
Materials and Methods Seven product types were identified for this project and, from each product type, four devices of different brands and models were collected by RPDD and submitted for analysis. The twenty eight devices are listed in Table 1. These devices were delivered by RPDD to Sequoia Analytical Laboratories in Morgan Hill, CA where work was performed under contract # 02-T2409 under the oversight of DTSC.
Sample Preparation: The Standard Operating Procedure (HML SOP#733-S) developed for this project is shown in Appendix A. In summary, the 28 devices were dismantled individually, and components classified into two major types: 1) Millable (plastic components, plastic casings, printed circuit boards-without any
batteries or capacitors), and2) Non millable metal components (metal frames, rods, batteries, capacitors and other
metal parts.). All millable components were cut into small pieces and ground using a heavy duty mill (Retsch, Model #SM-2000) to achieve the desired particle size and passed through a 2mm mesh sieve. The laboratory used a 2 mm sieve for all analyses (total extractable concentrations, WET and TCLP) instead of the 1mm, 2mm and 9.5mm sieves specified in the respective test procedures. The deviation was necessary because of the limited mass of some samples. Another deviation from the SOP was the use of plastic chips instead of wood chips to clean the milling apparatus and serve as blanks to determine cross contamination. HML accepted this deviation because plastic chips were similar to the samples, and worked better in the grinder. Milled samples were thoroughly mixed to achieve homogeneity before removing aliquots for testing.
5
Sample Digestion for Elemental Testing: A one gram (1 g) representative sub-sample of the thoroughly mixed sample was digested using EPA Method 3050B, with repeated additions of nitric acid, hydrochloric acid and hydrogen peroxide till the digestion was complete.
Extraction Procedures: Sub-samples were taken from the milled samples and were extracted using the TCLP and the WET to determine the leachability potential of regulated elements.
TCLP: An aliquot of the sample was extracted as described in EPA Method 1311. Samples were extracted with an amount of extraction fluid equal to 20 times the weight of the sample. The extraction fluid employed is a function of alkalinity of the sample.Extraction fluid #1, consisting of a mixture of acetic acid and sodium hydroxide at pH 4.93 +/- 0.05, was used, since the final pH of the samples after the addition of 1N HCl was <2.0. The extraction vessel containing the sample and the extraction fluid was agitated on a rotary shaker at 30 +/- 2 rpm for 18 +/- 2 hours at ambient temperature. The material in the extraction vessel was filtered through a glass fiber filter (0.45 micron) and the liquid extract was preserved with nitric acid to 5% by volume until ready for digestion and analysis.
WET: Sample aliquots were extracted with a citrate buffer solution (10 times the weight of the sample) at pH 5.0 for 48 hours in a mechanical shaker under anaerobic conditions. Mixtures were centrifuged, filtered through Whatman filter paper #42 and then passed through 0.45 micron membrane filter. The extracts were preserved by acidifying with nitric acid to 5% by volume before digestion and analysis.
Analytical Procedure: The above prepared samples were digested with nitric acid, hydrochloric acid, and hydrogen peroxide, as specified in EPA Method 3050B. The digestates were analyzed by Inductively Coupled Plasma-Atomic Emission Spectrometry (ICP –AES, Thermo Jarrell Ash, Model 61E), using EPA method 6010B. According to this method, digested samples were filtered through 0.45 micron membrane filters, nebulized and the resulting aerosol transported into the plasma torch. Emission spectra were produced by radio frequency, dispersed by the grating material and the intensities of the emission lines were measured by photosensitive devices.
Quality Control: A unique quality assurance program was adopted to ensure the reliability of the data. Before milling the samples, plastic chips that had been washed with nitric acid were run through the milling apparatus. These blanks were analyzed to demonstrate that the milling operation was free of cross-contamination.
A sample batch was defined as a group of 10 samples, or fewer, processed together with appropriate QC samples. With each batch of samples one method blank, one laboratory control sample (LCS) prepared in DI water, one matrix spike (MS) and one matrix spike duplicate (MSD) sample were analyzed. Between batches, plastic chips
6
were processed to confirm absence of cross-contamination. One sample of each product type, with the exception of the CPU, was extracted and analyzed in triplicate for total elements to examine the homogeneity and the precision of the data.
Results
Data Management The elemental concentrations measured in the milled portions of the devices were converted to concentrations in the entire device by using the relative weights (Table 1), with the assumption that the unmilled portion of each device did not contain any of the regulated elements.
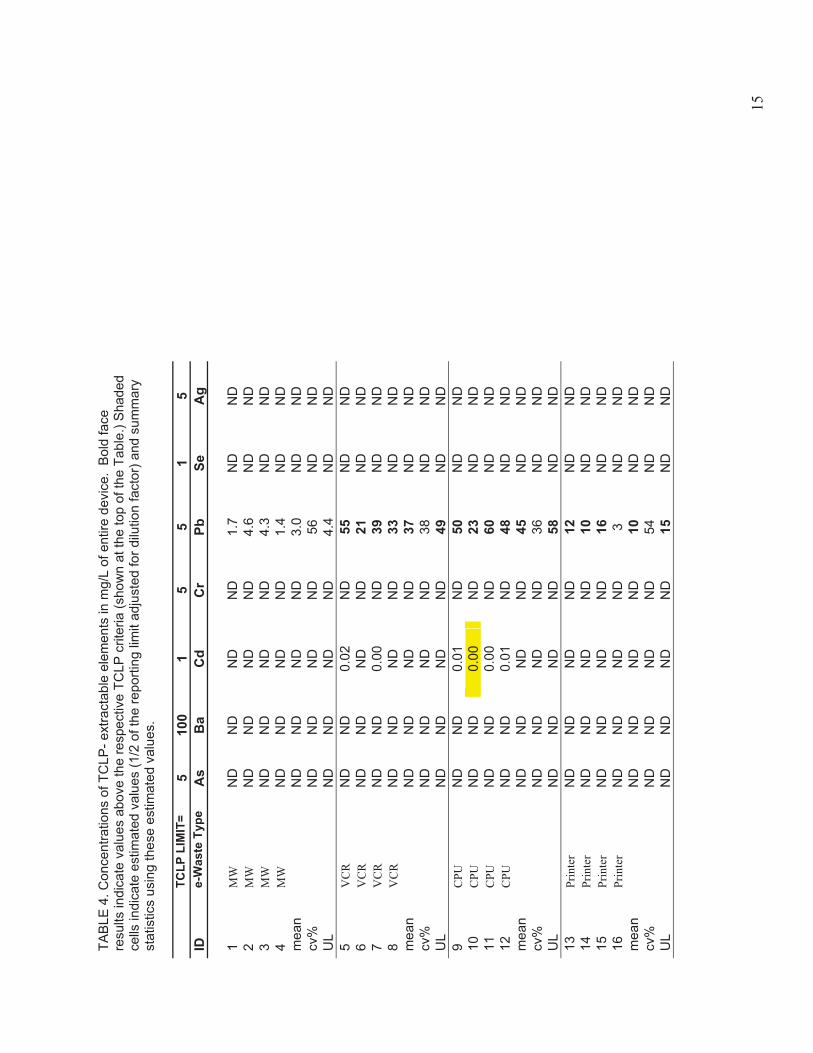
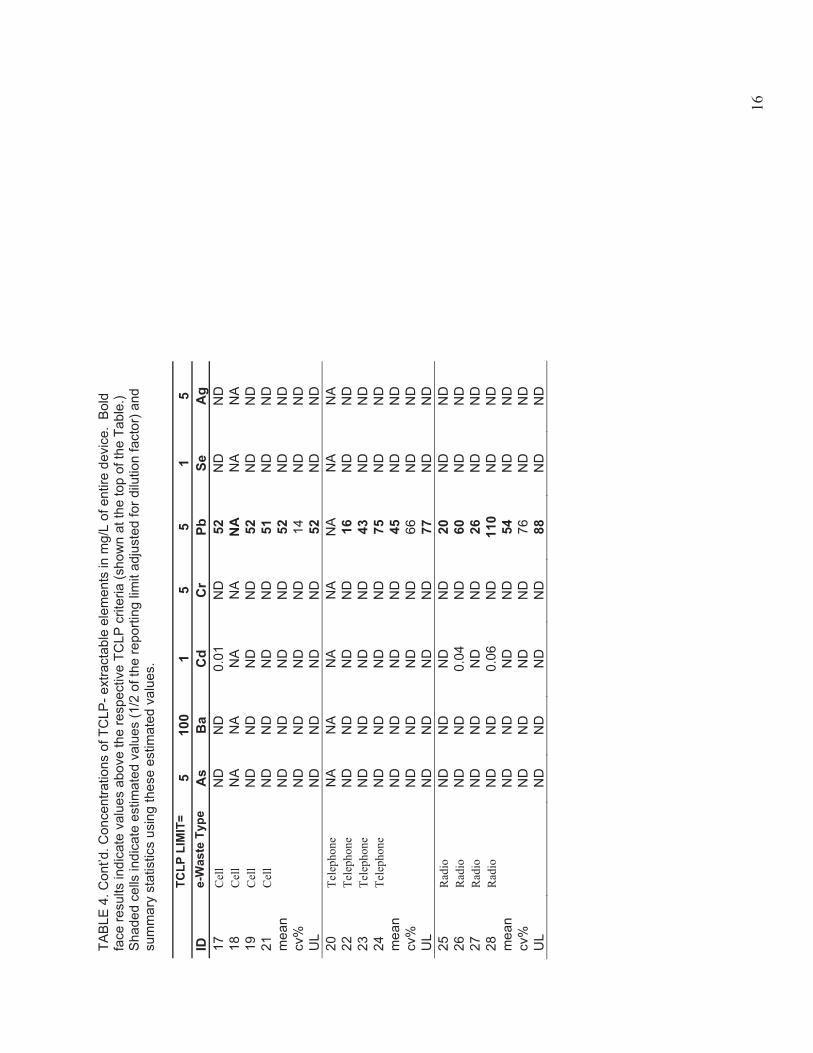
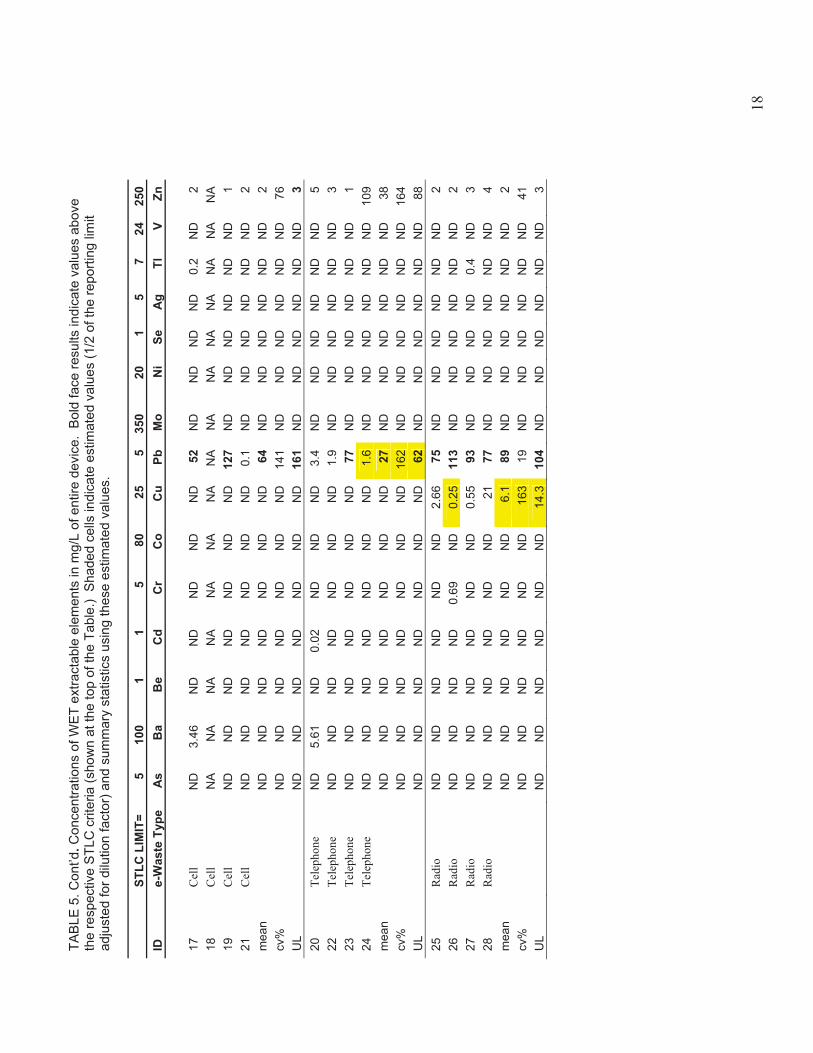
Analytical results are shown in Tables 2-5. All 28 samples were analyzed for EPA Method 3050 concentrations, TCLP-extractable elements and WET-extractable elements, with the exception of sample #18 (cell phone) which was not extracted using the TCLP, and sample #20 (telephone) which was not analyzed for either WET- or TCLP-extractable elements because of insufficient weight. These results are shown as not analyzed, “NA” in the respective tables. Data marked “NA” were not used in calculations, and summary statistics were performed on the remainder of the set, i.e., on three rather than four devices. Data below the reporting limit are shown as not detected, “ND”. Reporting limits varied with dilution factors. Nevertheless, they were always significantly lower than the respective hazardous waste criteria. When only one value for a particular element among the four samples (or three, in the case of replicate analysis) was “ND”, that value was replaced by one-half of its respective reporting limit (adjusted for any dilution factor). These estimated values and the summary statistics that use such values are highlighted with a gray background in Tables 2-5. When more than one value among the four samples (or three, in the case of replicate analysis) was “ND”, no adjustments were made and no summary statistics were performed for that particular element. In this case, whereas individual values are reported, the data are not used in determining summary statistics.
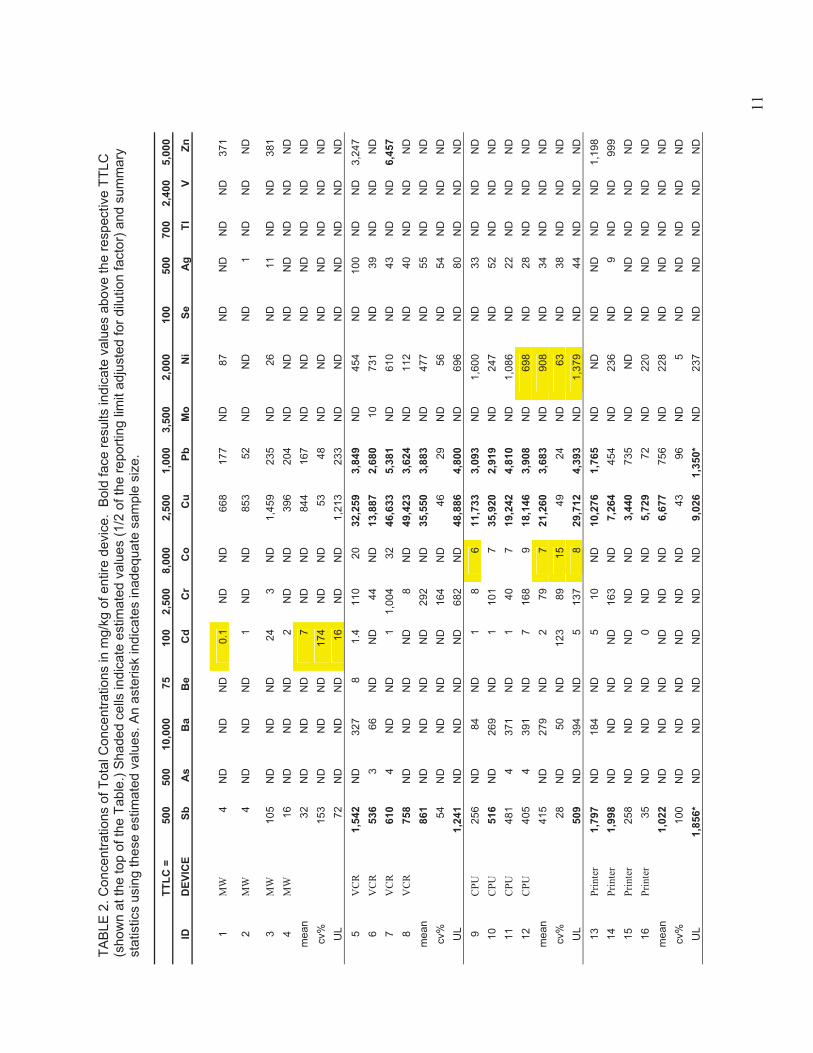
Tables 2-5 show results for individual samples plus the arithmetic average (mean) of all samples in the product type, coefficient of variation (CV %) and the upper confidence level (UL) for the mean (1-sided, 90th percentile). Entries in bold face (individual result, mean or UL) indicate results exceeding the respective regulatory thresholds (shown on the first row). The coefficient of variation in Table 2 expresses the variability observed among the four samples of each product type. CVs in Table 3 reflect the within-sample variation.
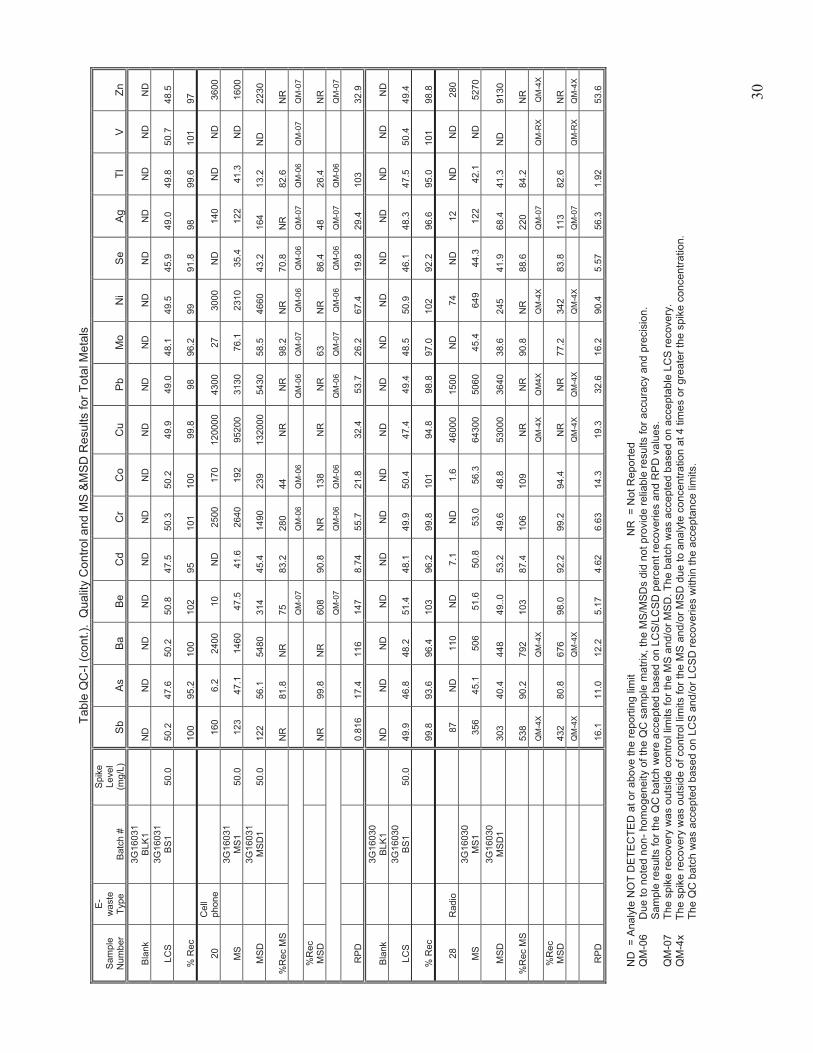
Quality Control Results: Quality Control (QC) results for Total Extractable Concentrations are shown in Appendix B (Table QC-I). Samples were digested and analyzed separately in 9 batches. Samples # 5, 19, 20 and 28 were used as Matrix Spikes and Matrix Spike Duplicates (MS/MSD). Samples were spiked with all the elements at 50 mg/kg concentrations along with the Laboratory Control Samples (LCSs) spiked at the same level (50 mg/L) in de-ionized water. Method blanks and reagent blanks were analyzed in between the actual samples
7
and the QC samples, to assess any carryover from high level background concentrations. None of the elements were detectable in the plastic chip blanks, indicating that the milling system was free of cross contamination. In all the batches, recovery of LCS ranged from 84% to 103%. However, recoveries in MS/MSD varied from element to element because some of the elements such as Pb, Cu, Zn, Sb, Co and Ni were present at very high concentrations compared to the amount spiked. Nevertheless, overall recoveries ranged from 77.6% to 109 %.
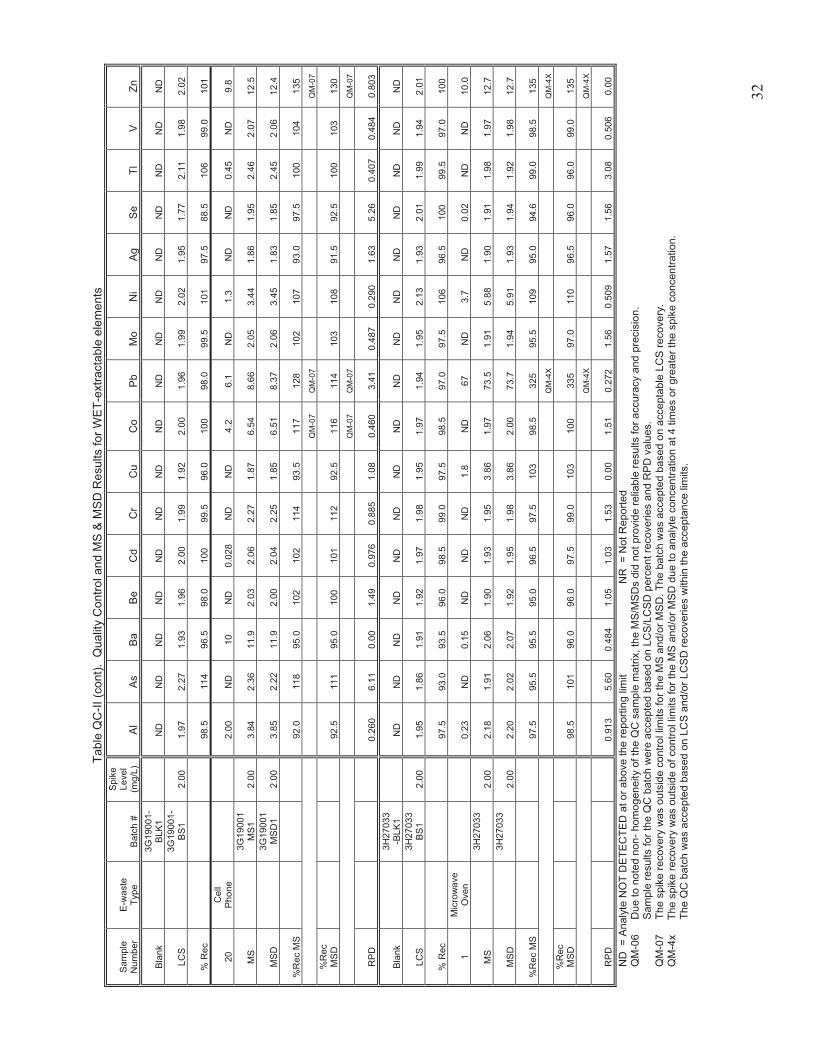
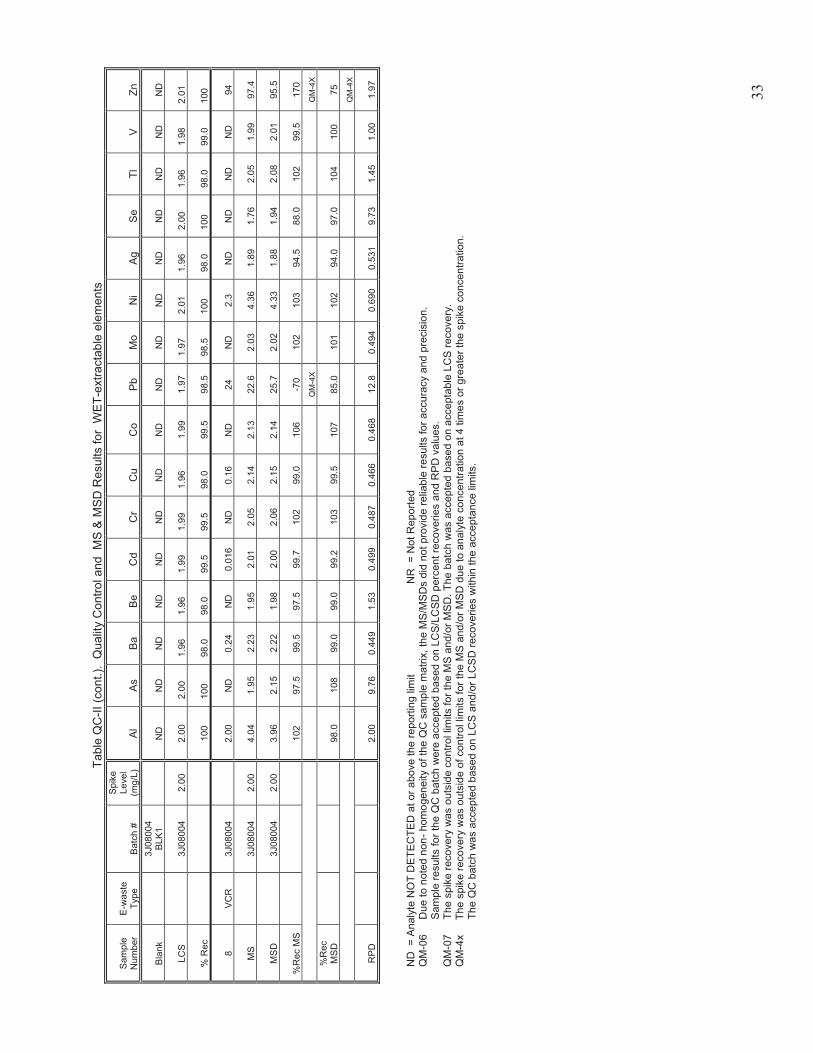
For WET-extractable elements, samples were analyzed in four (4) batches with method blanks and LCSs. MS/MSDs were run on samples # 1, 7, 8,10, 20 (Appendix B, Table QC-II). These, and an equal number of LCSs, were spiked with all the elements at a concentration of 2mg/L. LCS recoveries varied from 88.5% to 114% and all method blanks were below detection. MS and MSD were recovered within the range of 82% to 118%. Recoveries of Pb, Co and Zn, however, were not reported in some batches due to high background concentrations in comparison to the spike concentrations.
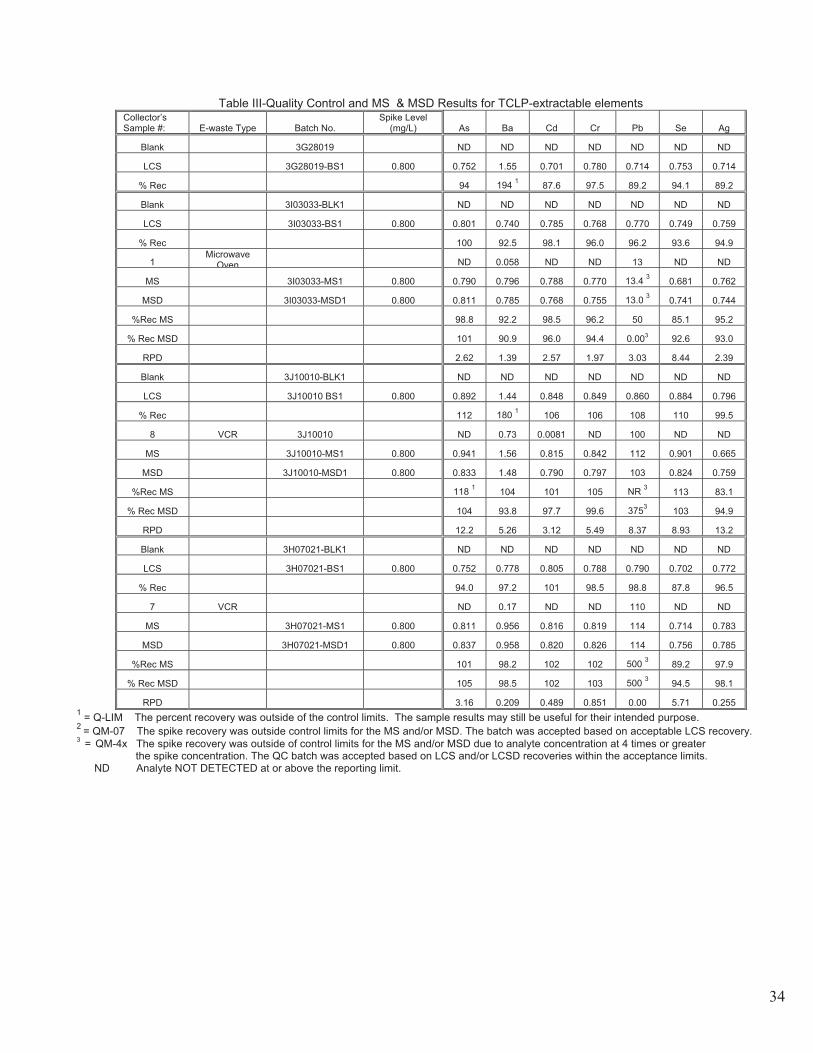
TCLP analysis was batched into five sets of samples with method blanks and LCS (Appendix B, Table QC-III). These batches included other samples (soils from a separate project) in addition to the e-wastes and, therefore, relevant MS/MSDs were performed on samples #1, 7 and 8 only. Samples and LCS were spiked at 0.8 mg/L with seven regulated elements only. None of the elements was detected in method blanks, and LCS recoveries ranged from 88% to 112% except for Ba, which showed around 200% recovery. MS and MSD recoveries varied from 85% to 113%, with the exception of Pb and Ba which were not reported due to very wide limits, attributable to the high concentrations in the samples.
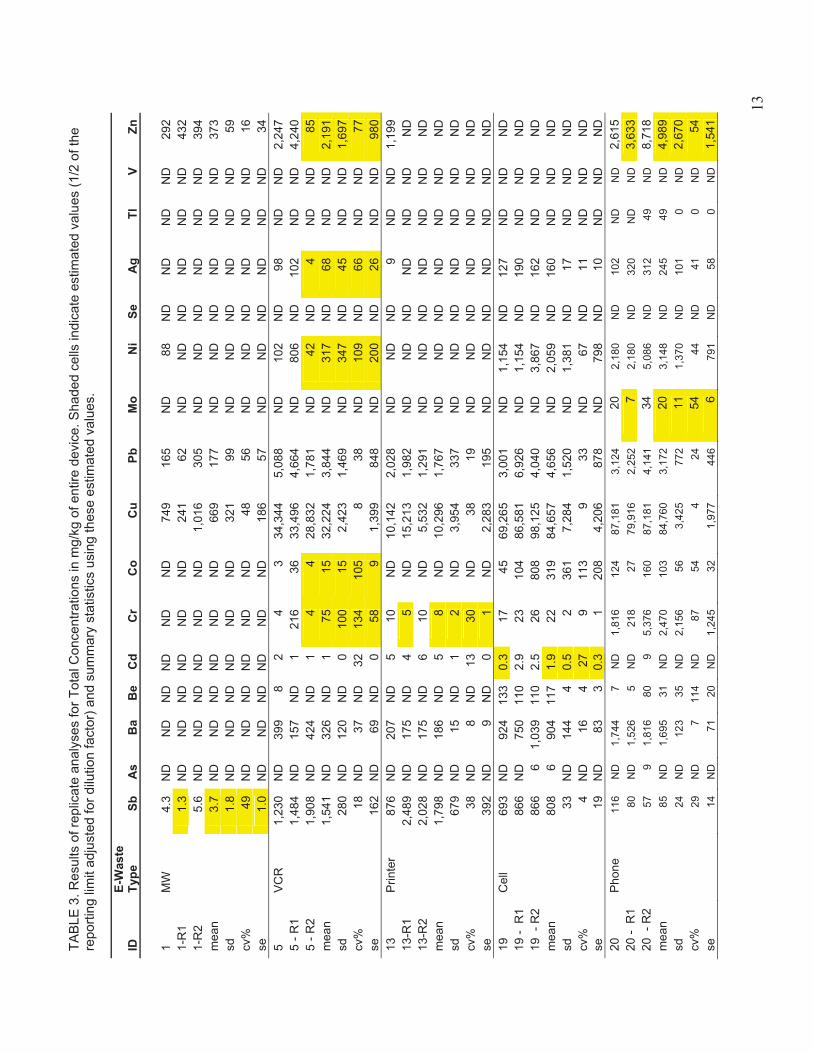
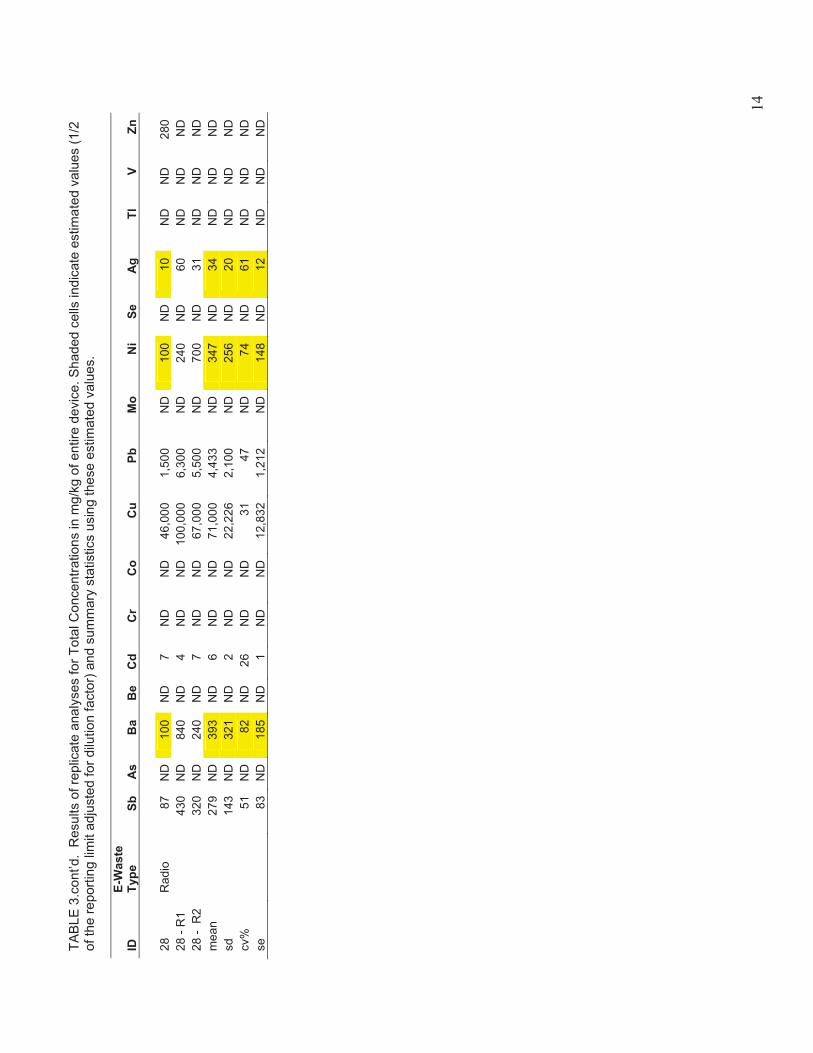
To assess the homogeneity of the samples subjected to analysis, six devices (# 1, 5, 13, 19, 20 and 28) were analyzed in triplicate. Table 3 shows the individual results, their mean, standard deviation and coefficient of variation of these triplicate analyses. CVs ranged from 4% (Cu in telephones, and Sb in cell phones) to 134% (Cr in VCR). The standard error of the mean (se) is shown in Table 3 and is plotted in Figures 1-3.
Total Concentrations Table 2 shows the results for total concentrations in mg/Kg (extrapolated to the entire device using the relative weights of millable and non-millable portions) for all samples.TTLCs are shown in the top row. It is clear that only a few elements (Sb, Cu and Pb) were consistently measured in all samples. Cell phones had the most measurable elements, with many elements above the respective TTLC. Figures 1-3 show measurements for Pb, Cu and Sb in each product type. The dark solid bar represents the mean concentration of the four devices within each product type and the error bar represents the 90% UL. The TTLC drawn in these figures allows a visual comparison of the 90% UL to the respective TTLC. Figures 1-3 also show the results of the triplicate analyses for the same elements. The light solid bar represents the mean concentration of the three replicates of each device. The error bar in this case is the standard error of the mean, expressing the observed variability.
8
TCLPTCLP results (mg/L extrapolated to the entire device) are shown in Table 4. Only Pb was measured consistently across devices. Figure 4 shows the mean Pb concentrations, the 90% UL and the TCLP limit. All product types, except for the Microwaves, appear to fail the TCLP for Pb.
WETTable 5 shows WET-extractable results in mg/L (extrapolated to the entire device). Cu, Pb and Zn were measurable in many devices. All product types except for the CPU exceeded the STLC for Pb. Figures 5 and 6 show results for Pb and Zn, respectively.
Table 6 summarizes the product types that exceed the TTLCs, TC Limits, or STLCs. It is clear that all product types exceeded at least one of the regulatory thresholds. All product types exceed the TCLP limit for Pb and, with the exception of CPUs, all product types exceed the STLC for Pb. Cell phones have the most exceedences and microwaves the fewest: Cell phones exceed both the STLC and TCLP limits for Pb, and they also exceed the TTLC for Pb, Sb, Cu, Ni and Cr. Microwaves only exceed the STLC for Pb.
DiscussionHML assessed the homogeneity of samples processed through the grinder by conducting triplicate analyses for Total Metals on six of the seven product types (one device from each product type, except for the CPU). As can be seen in Table 3, relative coefficient of variation (%CV) varied across devices and elements. The lowest %CVs were obtained for Cu (4% to 48%), Sb (4% to 51%) and Pb (19% to 56%) measured in all six devices. As these were the metals consistently measured above the respective criteria in most devices, it is reassuring to see that samples were reasonably homogeneous and that our conclusions apply.
Lead was the only element where both the TCLP-extractable and the WET-extractable concentrations were consistently measured in most devices. The summary in Table 6 shows that the 90% UL of results for each device exceed at least one hazardous waste criterion. Elements marked with an asterisk indicate that, whereas the 90%UL exceeded the respective regulatory limit, the number of samples tested (n=4) was inadequate, given the observed variation, the difference between the mean value and the regulatory limit, and assuming a normal distribution. For these types of devices, additional samples are needed to evaluate these particular elements. Specifically, with the observed variation, 24 samples are needed to confidently determine whether the TTLC is exceeded for Pb in printers. On the other hand, 11 samples are needed to determine whether the TTLC is exceeded for Sb in printers. Similarly, 18 samples are needed to determine whether the TTLC is exceeded for Cr and over 300 samples are needed for Ni in cell phones. Nine samples are required for Ni in telephones and 11 samples are required for Sb in radios. All other determinations had adequate sample size. Even if the elements that require additional measurements are disregarded, all product types exceed at least one hazardous waste criterion.
9
As discussed in this report, there are some other considerations for waste classification.First, there is the issue of sample preparation. The contract laboratory milled all samples to pass a 2 mm sieve, although the TCLP specifies a 9.5 mm sieve, and the preparation for Total Concentrations testing specifies a 1 mm sieve. This deviation from the prescribed particle size could have a significant effect on the TCLP results; however, the TCLP only specifies that the waste is milled to pass a 9.5 mm sieve and does not preclude milling to a smaller size. Since the correct sieve size was used for the WET, there is more confidence in the results showing that microwave ovens significantly exceed the STLC. For other devices, the particle size does not appear to have any significant effect on whether the regulatory thresholds are exceeded, as all results clearly exceed hazardous waste regulatory thresholds.
In summary, all the devices tested, clearly exceeded at least one hazardous waste criterion (RCRA on non-RCRA). These results confirm our observations in the DTSC pilot study on E-wastes.
Conclusions
� All product types clearly exceeded at least one hazardous waste criterion.� Lead was the most common element exceeding its limit.� Cell phones exceeded the most regulatory thresholds compared to the other product
types tested. � With the exception of microwave ovens, all product types tested exceeded the TTLC
and TCLP regulatory thresholds. � With the exception of CPUs, all product types tested exceeded at least one STLC.
10
TAB
LE 1
. Li
st o
f 28
e-w
aste
dev
ices
(typ
e, m
anuf
actu
rer,
mod
el, s
eria
l num
ber)
and
wei
ghts
of c
ompo
nent
s.
ID
Prod
uct T
ype
Man
ufac
ture
r M
odel
No.
Se
rial N
o.
Wt.
of N
on-
Met
al p
arts
(Kg)
W
t. of
Met
al
parts
(Kg)
To
tal
Wt.
of
devi
ce (K
g)
1 M
icro
wav
e O
ven
GE
Dua
l Wav
e II
JE
1465
001
DV
9109
8Z
1.91
3 13
.2
15.1
2
Mic
row
ave
Ove
n M
ontg
omer
y W
ard
1.5
KSA
822
3A
1497
89
0.56
5 33
.2
33.7
6 3
Mic
row
ave
Ove
n Sh
arp
Car
ouse
l II
R4A
83A
14
8866
1.
297
14.7
16
4
Mic
row
ave
Ove
n JC
Pen
ny M
icro
wav
e 86
3553
570
7110
1269
1.
259
19.7
21
5
VC
R
SV20
00 4
Hea
d SV
X14
2AT2
1 74
3329
458
1.18
1.
6 2.
78
6 V
CR
X
R10
00 4
- Hea
d SV
G45
1 S3
0760
2727
1.
223
3.8
5.02
7
VC
R
JVC
H
R-D
225U
11
9L12
87
3.35
4 6.
0 9.
35
8 V
CR
JV
C
HR
-D22
5U
9991
724
3.34
1 6.
8 10
.14
9 C
PU
AT&
T PC
63
00
1545
09
1.47
2 12
.3
13.7
7 10
C
PU
Pack
ard
Bel
l Mul
timed
ia
940-
3X3A
N
3680
2136
9 2.
545
7.8
10.0
5 11
C
PU
Cor
data
PC
400
PC
-400
-25
2BSA
5532
1.
773
11.1
12
.87
12
CPU
C
orda
ta P
C 4
00
PC-4
00-2
5 2B
SA65
94
2.02
4 12
.5
14.5
2 13
Pr
inte
r St
ar M
icro
nom
ics
J241
40
3-40
08E+
11
1.70
5 2.
0 3.
7 14
Pr
inte
r Ep
son
Styl
us c
olor
500
P8
80A
3B
R14
8270
0 1.
822
4.2
6.02
15
Pr
inte
r La
xmar
k Z5
1 40
98-0
01
7100
0788
81
2.88
5 0.
8 3.
69
16
Prin
ter
HP
Des
k Je
t 22
76A
28
03A
2299
9 1.
647
1.8
3.45
17
C
ell P
hone
M
otor
ola
5214
0AA
93
5VW
FS76
0.
178
0.3
0.47
8 18
C
ell P
hone
M
otor
ola
i100
0 pl
us
H26
UA
H6R
R7A
N
831T
BC
D72
M00
5048
1851
3100
0.
102
0.02
6 0.
128
19
Cel
l Pho
ne
Mot
orol
a
7420
2NTT
OA
A
55G
YO
6215
0.
314
0.23
0.
544
21
Cel
l Pho
ne
Mot
orol
a i1
000
plus
H
26U
AH
6RR
7AN
83
1TB
CD
75H
0504
8188
8410
0 0.
115
0.09
0.
205
20
Tele
phon
e Sh
arp
cord
less
pho
ne/ A
ns sy
s FT
-541
0 50
4094
71
0.43
3 0.
163
0.59
6 22
Te
leph
one
Sony
Hig
h Po
wer
900
mhz
SP
P-S9
001
8251
587
0.16
3 0.
372
0.53
5 23
Te
leph
one
ATT
13
07
9320
2M
0.65
7 0.
456
1.11
3 24
Te
leph
one
Bel
l/Sou
th
1188
11
111
0.22
0.
062
0.28
2 25
R
adio
Pa
naso
nic
RC
-606
3 --
----
----
--
0.36
7 0.
268
0.63
5 26
R
adio
R
ealis
tic
12-1
50
3038
0043
596
0.66
8 0.
4 1.
068
27
Rad
io
Mag
navo
x A
J301
0/17
K
T029
6072
0 20
05
0.34
8 0.
175
0.52
3 28
R
adio
G
ener
al E
lect
ric
7-46
30D
--
----
----
----
0.
732
0 0.
732
11
TAB
LE 2
. Con
cent
ratio
ns o
f Tot
al C
once
ntra
tions
in m
g/kg
of e
ntire
dev
ice.
Bol
d fa
ce re
sults
indi
cate
val
ues
abov
e th
e re
spec
tive
TTLC
(s
how
n at
the
top
of th
e Ta
ble.
) Sha
ded
cells
indi
cate
est
imat
ed v
alue
s (1
/2 o
f the
repo
rting
lim
it ad
just
ed fo
r dilu
tion
fact
or) a
nd s
umm
ary
stat
istic
s us
ing
thes
e es
timat
ed v
alue
s. A
n as
teris
k in
dica
tes
inad
equa
te s
ampl
e si
ze.
TT
LC =
50
0 50
0 10
,000
75
10
0 2,
500
8,00
0 2,
500
1,00
0 3,
500
2,00
0 10
0 50
0 70
0 2,
400
5,00
0
ID
DEV
ICE
Sb
As
Ba
Be
Cd
Cr
Co
Cu
Pb
Mo
Ni
Se
Ag
Tl
V Zn
1M
W4
ND
N
D
ND
0.
1 N
D
ND
66
8 17
7 N
D
87
ND
N
D
ND
N
D
371
2M
W4
ND
N
D
ND
1
ND
N
D
853
52
ND
N
D
ND
1
ND
N
D
ND
3M
W10
5N
DN
D
ND
24
3
ND
1,
459
235
ND
26
N
D
11
ND
N
D
381
4M
W16
N
D
ND
N
D
2 N
D
ND
39
6 20
4 N
D
ND
N
D
ND
N
D
ND
N
D
mea
n32
N
D
ND
N
D
7 N
D
ND
84
4 16
7 N
D
ND
N
D
ND
N
D
ND
N
D
cv%
15
3 N
D
ND
N
D
174
ND
N
D
53
48
ND
N
D
ND
N
D
ND
N
D
ND
U
L72
N
D
ND
N
D
16
ND
N
D
1,21
3 23
3 N
D
ND
N
D
ND
N
D
ND
N
D
5V
CR
1,54
2N
D
327
8 1.
4 11
0 20
32
,259
3,
849
ND
45
4 N
D
100
ND
N
D
3,24
7 6
VC
R53
63
66
ND
N
D
44
ND
13
,887
2,
680
10
731
ND
39
N
D
ND
N
D
7V
CR
610
4 N
D
ND
1
1,00
4 32
46
,633
5,
381
ND
61
0 N
D
43
ND
N
D
6,45
78
VC
R75
8N
D
ND
N
D
ND
8
ND
49
,423
3,
624
ND
11
2 N
D
40
ND
N
D
ND
m
ean
861
ND
N
D
ND
N
D
292
ND
35
,550
3,
883
ND
47
7 N
D
55
ND
N
D
ND
cv
%
54
ND
N
D
ND
N
D
164
ND
46
29
N
D
56
ND
54
N
D
ND
N
D
UL
1,24
1N
D
ND
N
D
ND
68
2 N
D
48,8
86
4,80
0 N
D
696
ND
80
N
D
ND
N
D
9C
PU25
6 N
D
84
ND
1
8 6
11,7
33
3,09
3 N
D
1,60
0 N
D
33
ND
N
D
ND
10
CPU
516
ND
26
9 N
D
1 10
1 7
35,9
20
2,91
9 N
D
247
ND
52
N
D
ND
N
D
11C
PU48
1 4
371
ND
1
40
7 19
,242
4,
810
ND
1,
086
ND
22
N
D
ND
N
D
12C
PU40
5 4
391
ND
7
168
9 18
,146
3,
908
ND
698
ND
28
N
D
ND
N
D
mea
n41
5 N
D
279
ND
2
79
721
,260
3,
683
ND
908
ND
34
N
D
ND
N
D
cv%
28
N
D
50
ND
12
3 89
15
49
24
N
D
63
ND
38
N
D
ND
N
D
UL
509
ND
39
4 N
D
5 13
7 8
29,7
12
4,39
3 N
D1,
379
ND
44
N
D
ND
N
D
13Pr
inte
r1,
797
ND
18
4 N
D
5 10
N
D
10,2
76
1,76
5 N
D
ND
N
D
ND
N
D
ND
1,
198
14Pr
inte
r1,
998
ND
N
D
ND
N
D
163
ND
7,
264
454
ND
23
6 N
D
9 N
D
ND
99
9 15
Prin
ter
258
ND
N
D
ND
N
D
ND
N
D
3,44
073
5 N
D
ND
N
D
ND
N
D
ND
N
D
16Pr
inte
r35
N
D
ND
N
D
0 N
D
ND
5,
729
72
ND
22
0 N
D
ND
N
D
ND
N
D
mea
n1,
022
ND
N
D
ND
N
D
ND
N
D
6,67
775
6 N
D
228
ND
N
D
ND
N
D
ND
cv
%
100
ND
N
D
ND
N
D
ND
N
D
43
96
ND
5
ND
N
D
ND
N
D
ND
U
L1,
856*
ND
N
D
ND
N
D
ND
N
D
9,02
6 1,
350*
N
D
237
ND
N
D
ND
N
D
ND
12
TAB
LE 2
. Con
t’d.
Con
cent
ratio
n of
Tot
al C
once
ntra
tions
in m
g/kg
of e
ntire
dev
ice.
Bol
d fa
ce re
sults
indi
cate
val
ues
abov
e th
e re
spec
tive
TTLC
(sho
wn
at th
e to
p of
the
Tabl
e.)
Sha
ded
cells
indi
cate
est
imat
ed v
alue
s (1
/2 o
f the
repo
rting
lim
it ad
just
ed fo
r dilu
tion
fact
or) a
nd
sum
mar
y st
atis
tics
usin
g th
ese
estim
ated
val
ues.
An
aste
risk
indi
cate
s in
adeq
uate
sam
ple
size
.
TT
LC =
50
0 50
0 10
,000
75
10
0 2,
500
8,00
0 2,
500
1,00
0 3,
500
2,00
0 10
0 50
0 70
0 2,
400
5,00
0 ID
D
EVIC
E Sb
A
s B
a B
e C
d C
r C
o C
u Pb
M
o N
i Se
A
g Tl
V
Zn
17
Cel
l18
6 N
D
1,86
213
0N
D18
618
689
,372
5,
958
ND
1,86
2 N
D
186
ND
N
D
ND
18
Cel
l71
N
D
606
ND
2
5,49
845
35,0
63
1,51
4 11
22,
630
ND
77
N
D
ND
N
D
19C
ell
808
6 90
4 11
73
22
319
8,46
6 4,
656
ND
2,05
9N
D
160
ND
N
D
ND
21
C
ell
168
ND
67
3 N
D
ND
13
5 22
17
,390
5,
049
ND
95
4 N
D
398
ND
N
D
ND
m
ean
308
ND
1,
061
ND
N
D
1,47
014
538
,856
4,
667
ND
1,
946
ND
23
5 N
D
ND
N
D
cv%
10
9 N
D
57
ND
N
D
184
97
97
45
ND
37
N
D
67
ND
N
D
ND
U
L58
4 N
D
1,48
7 N
D
ND
3,
666*
256
67,2
695,
877
ND
2,44
6*
ND
31
7 N
D
ND
N
D
20Te
leph
one
84
18
1,69
3 31
9
2,47
0 10
3 84
,762
3,17
5 27
3,
146
ND
18
6 49
N
D
5,66
722
Tele
phon
e 14
N
D
85
ND
0.
2 N
D
ND
2,
437
67
ND
30
N
D
30
ND
N
D
ND
23Te
leph
one
401
ND
59
N
D
7 N
D
ND
30
,695
2,
420
ND
1,
358
ND
18
N
D
ND
2,
597
24Te
leph
one
94
ND
26
5 N
D
8 N
D
ND
31
,206
3,
043
ND
39
8 N
D
8 N
D
ND
N
D
mea
n14
8 N
D
526
ND
6
ND
N
D
37,2
75
2,17
6 N
D1,
233
ND
78
N
D
ND
N
D
cv%
11
6 N
D
149
ND
66
N
D
ND
92
66
N
D
113
ND
15
1 N
D
ND
N
D
UL
290
ND
1,
167
ND
9
ND
N
D
65,4
44
3,35
9 N
D2,
373*
ND
170
ND
N
D
ND
25R
adio
150
ND
18
5 N
D
1 N
D
ND
75
,134
19
,650
N
D
ND
N
D
127
ND
N
D
ND
26
Rad
io75
1N
D
188
ND
3
21
24
112,
584
20,0
15
ND
N
D
ND
13
8 N
D
ND
N
D
27R
adio
279
ND
67
N
D
2 N
D
ND
86
,501
4,
325
ND
N
D
ND
43
N
D
ND
N
D
28R
adio
279
ND
54
0 N
D
6 N
D
ND
71
,000
4,
433
ND
31
3 N
D
16
ND
N
D
280
mea
n36
5 N
D
245
ND
3
ND
N
D
86,3
05
12,1
06
ND
31
3 N
D
81
ND
N
D
280
cv%
72
N
D
84
ND
68
N
D
ND
22
74
N
D
ND
N
D
75
ND
N
D
ND
U
L58
1*N
D41
2 N
D
5 N
D
ND
10
1,62
4 16
,510
N
D
ND
N
D
131
ND
N
D
ND
13
TAB
LE 3
. Res
ults
of r
eplic
ate
anal
yses
for T
otal
Con
cent
ratio
ns in
mg/
kg o
f ent
ire d
evic
e. S
hade
d ce
lls in
dica
te e
stim
ated
val
ues
(1/2
of t
he
repo
rting
lim
it ad
just
ed fo
r dilu
tion
fact
or) a
nd s
umm
ary
stat
istic
s us
ing
thes
e es
timat
ed v
alue
s.
IDE-
Was
te
Type
Sb
A
s B
a B
e C
d C
r C
o C
u Pb
M
o N
i Se
A
g Tl
V
Zn
1 M
W
4.3
ND
N
D
ND
N
D
ND
N
D
749
165
ND
88
N
D
ND
N
D
ND
29
2 1-
R1
1.
3 N
D
ND
N
D
ND
N
D
ND
24
1 62
N
D
ND
N
D
ND
N
D
ND
43
2 1-
R2
5.
6 N
D
ND
N
D
ND
N
D
ND
1,
016
305
ND
N
D
ND
N
D
ND
N
D
394
mea
n3.
7 N
D
ND
N
D
ND
N
D
ND
66
9 17
7 N
D
ND
N
D
ND
N
D
ND
37
3 sd
1.8
ND
N
D
ND
N
D
ND
N
D
321
99
ND
N
D
ND
N
D
ND
N
D
59
cv%
49
ND
N
D
ND
N
D
ND
N
D
48
56
ND
N
D
ND
N
D
ND
N
D
16
se
1.
0 N
D
ND
N
D
ND
N
D
ND
18
6 57
N
D
ND
N
D
ND
N
D
ND
34
5
VCR
1,
230
ND
39
9 8
2 4
3 34
,344
5,
088
ND
10
2 N
D
98
ND
N
D
2,24
7 5
- R1
1,
484
ND
15
7 N
D
1 21
6 36
33
,496
4,
664
ND
80
6 N
D
102
ND
N
D
4,24
0 5
- R2
1,
908
ND
42
4 N
D
1 4
4 28
,832
1,
781
ND
42
N
D
4 N
D
ND
85
mea
n
1,54
1 N
D
326
ND
1
7515
32
,224
3,
844
ND
31
7 N
D
68
ND
N
D
2,19
1sd
280
ND
12
0 N
D
0 10
015
2,
423
1,46
9 N
D
347
ND
45
N
D
ND
1,
697
cv%
18
ND
37
N
D
32
134
105
8 38
N
D
109
ND
66
N
D
ND
77
se
16
2 N
D
69
ND
0
589
1,39
9 84
8 N
D
200
ND
26
N
D
ND
98
013
Pr
inte
r 87
6 N
D
207
ND
5
10
ND
10
,142
2,
028
ND
N
D
ND
9
ND
N
D
1,19
9 13
-R1
2,
489
ND
17
5 N
D
4 5
ND
15
,213
1,
982
ND
N
D
ND
N
D
ND
N
D
ND
13
-R2
2,
028
ND
17
5 N
D
6 10
N
D
5,53
2 1,
291
ND
N
D
ND
N
D
ND
N
D
ND
m
ean
1,
798
ND
18
6 N
D
5 8
ND
10
,296
1,
767
ND
N
D
ND
N
D
ND
N
D
ND
sd
679
ND
15
N
D
1 2
ND
3,
954
337
ND
N
D
ND
N
D
ND
N
D
ND
cv
%
38
N
D
8 N
D
13
30
ND
38
19
N
D
ND
N
D
ND
N
D
ND
N
D
se
39
2 N
D
9 N
D
0 1
ND
2,
283
195
ND
N
D
ND
N
D
ND
N
D
ND
19
C
ell
693
ND
92
4 13
3 0.
3 17
45
69
,265
3,
001
ND
1,
154
ND
12
7 N
D
ND
N
D
19 -
R1
86
6 N
D
750
110
2.9
23
104
86,5
81
6,92
6 N
D
1,15
4 N
D
190
ND
N
D
ND
19
- R
2
866
6 1,
039
110
2.5
26
808
98,1
25
4,04
0 N
D
3,86
7 N
D
162
ND
N
D
ND
m
ean
80
8 6
904
117
1.9
22
319
84,6
57
4,65
6 N
D
2,05
9 N
D
160
ND
N
D
ND
sd
33
ND
14
4 4
0.5
2 36
1 7,
284
1,52
0 N
D
1,38
1 N
D
17
ND
N
D
ND
cv
%
4
ND
16
4
27
9 11
3 9
33
ND
67
N
D
11
ND
N
D
ND
se
19
ND
83
3
0.3
1 20
8 4,
206
878
ND
79
8 N
D
10
ND
N
D
ND
20
Ph
one
116
ND
1,
744
7 N
D
1,81
6 12
4 87
,181
3,
124
202,
180
ND
10
2 N
D
ND
2,
615
20 -
R1
80
N
D
1,52
6 5
ND
21
8 27
79
,916
2,
252
72,
180
ND
32
0 N
D
ND
3,
633
20 -
R2
57
9
1,81
6 80
9
5,37
6 16
0 87
,181
4,
141
345,
086
ND
31
2 49
N
D
8,71
8m
ean
85
ND
1,
695
31
ND
2,
470
103
84,7
60
3,17
2 20
3,14
8 N
D
245
49
ND
4,
989
sd
24
N
D
123
35
ND
2,
156
56
3,42
5 77
2 11
1,37
0 N
D
101
0 N
D
2,67
0cv
%
29
N
D
7 11
4 N
D
87
54
4 24
54
44
ND
41
0
ND
54
se
14
N
D
71
20
ND
1,
245
32
1,97
7 44
6 6
791
ND
58
0
ND
1,
541
14
TAB
LE 3
.con
t’d.
Res
ults
of r
eplic
ate
anal
yses
for T
otal
Con
cent
ratio
ns in
mg/
kg o
f ent
ire d
evic
e. S
hade
d ce
lls in
dica
te e
stim
ated
val
ues
(1/2
of
the
repo
rting
lim
it ad
just
ed fo
r dilu
tion
fact
or) a
nd s
umm
ary
stat
istic
s us
ing
thes
e es
timat
ed v
alue
s.
IDE-
Was
te
Type
Sb
A
s B
a B
e C
d C
r C
o C
u Pb
M
o N
i Se
A
g Tl
V
Zn
28
Rad
io
87
ND
10
0 N
D
7 N
D
ND
46
,000
1,
500
ND
10
0 N
D
10
ND
N
D
280
28 -
R1
43
0 N
D
840
ND
4
ND
N
D
100,
000
6,30
0 N
D
240
ND
60
N
D
ND
N
D
28 -
R2
32
0 N
D
240
ND
7
ND
N
D
67,0
00
5,50
0 N
D
700
ND
31
N
D
ND
N
D
mea
n
279
ND
39
3 N
D
6 N
D
ND
71
,000
4,
433
ND
34
7 N
D
34
ND
N
D
ND
sd
143
ND
32
1 N
D
2 N
D
ND
22
,226
2,
100
ND
25
6 N
D
20
ND
N
D
ND
cv
%
51
N
D
82
ND
26
N
D
ND
31
47
N
D
74
ND
61
N
D
ND
N
D
se
83
N
D
185
ND
1
ND
N
D
12,8
32
1,21
2 N
D
148
ND
12
N
D
ND
N
D
15
TAB
LE 4
. Con
cent
ratio
ns o
f TC
LP- e
xtra
ctab
le e
lem
ents
in m
g/L
of e
ntire
dev
ice.
Bol
d fa
ce
resu
lts in
dica
te v
alue
s ab
ove
the
resp
ectiv
e TC
LP c
riter
ia (s
how
n at
the
top
of th
e Ta
ble.
) Sha
ded
cells
indi
cate
est
imat
ed v
alue
s (1
/2 o
f the
repo
rting
lim
it ad
just
ed fo
r dilu
tion
fact
or) a
nd s
umm
ary
stat
istic
s us
ing
thes
e es
timat
ed v
alue
s.
TCLP
LIM
IT=
5 10
0 1
5 5
1 5
IDe-
Was
te T
ype
As
Ba
Cd
Cr
Pb
Se
Ag
1M
WN
D
ND
N
D
ND
1.
7 N
D
ND
2
MW
ND
N
D
ND
N
D
4.6
ND
N
D
3M
WN
D
ND
N
D
ND
4.
3 N
D
ND
4
MW
ND
N
D
ND
N
D
1.4
ND
N
D
mea
nN
D
ND
N
D
ND
3.
0 N
D
ND
cv
%
ND
N
D
ND
N
D
56
ND
N
D
UL
ND
N
D
ND
N
D
4.4
ND
N
D
5V
CR
ND
N
D
0.02
N
D
55N
D
ND
6
VC
RN
D
ND
N
D
ND
21
ND
N
D
7V
CR
ND
N
D
0.00
N
D
39N
D
ND
8
VC
RN
D
ND
N
D
ND
33
ND
N
D
mea
nN
D
ND
N
D
ND
37
ND
N
D
cv%
N
D
ND
N
D
ND
38
N
D
ND
U
LN
D
ND
N
D
ND
49
ND
N
D
9C
PUN
D
ND
0.
01
ND
50
ND
N
D
10C
PUN
D
ND
0.
00
ND
23
ND
N
D
11C
PUN
D
ND
0.
00
ND
60
ND
N
D
12C
PUN
D
ND
0.
01
ND
48
ND
N
D
mea
nN
D
ND
N
D
ND
45
ND
N
D
cv%
N
D
ND
N
D
ND
36
N
D
ND
U
LN
D
ND
N
D
ND
58
ND
N
D
13Pr
inte
rN
D
ND
N
D
ND
12
ND
N
D
14Pr
inte
rN
D
ND
N
D
ND
10
ND
N
D
15Pr
inte
rN
D
ND
N
D
ND
16
ND
N
D
16Pr
inte
rN
D
ND
N
D
ND
3
ND
N
D
mea
nN
D
ND
N
D
ND
10
ND
N
D
cv%
N
D
ND
N
D
ND
54
N
D
ND
U
LN
D
ND
N
D
ND
15
ND
N
D
16
TAB
LE 4
. Con
t’d. C
once
ntra
tions
of T
CLP
- ext
ract
able
ele
men
ts in
mg/
L of
ent
ire d
evic
e. B
old
face
resu
lts in
dica
te v
alue
s ab
ove
the
resp
ectiv
e TC
LP c
riter
ia (s
how
n at
the
top
of th
e Ta
ble.
) S
hade
d ce
lls in
dica
te e
stim
ated
val
ues
(1/2
of t
he re
porti
ng li
mit
adju
sted
for d
ilutio
n fa
ctor
) and
su
mm
ary
stat
istic
s us
ing
thes
e es
timat
ed v
alue
s.
TCLP
LIM
IT=
5 10
0 1
5 5
1 5
IDe-
Was
te T
ype
As
Ba
Cd
Cr
Pb
Se
Ag
17C
ell
ND
N
D
0.01
N
D
52N
D
ND
18
Cel
lN
A
NA
N
A
NA
N
AN
A
NA
19
Cel
lN
D
ND
N
D
ND
52
ND
N
D
21C
ell
ND
N
D
ND
N
D
51N
D
ND
m
ean
ND
N
D
ND
N
D
52N
D
ND
cv
%
ND
N
D
ND
N
D
14
ND
N
D
UL
ND
N
D
ND
N
D
52N
D
ND
20
Tele
phon
eN
A
NA
N
A
NA
N
A
NA
N
A
22Te
leph
one
ND
N
D
ND
N
D
16N
D
ND
23
Tele
phon
eN
D
ND
N
D
ND
43
ND
N
D
24Te
leph
one
ND
N
D
ND
N
D
75N
D
ND
m
ean
ND
N
D
ND
N
D
45N
D
ND
cv
%
ND
N
D
ND
N
D
66
ND
N
D
UL
ND
N
D
ND
N
D
77N
D
ND
25
Rad
ioN
D
ND
N
D
ND
20
ND
N
D
26R
adio
ND
N
D
0.04
N
D
60N
D
ND
27
Rad
ioN
D
ND
N
D
ND
26
ND
N
D
28R
adio
ND
N
D
0.06
N
D
110
ND
N
D
mea
nN
D
ND
N
D
ND
54
ND
N
D
cv%
N
D
ND
N
D
ND
76
N
D
ND
U
LN
D
ND
N
D
ND
88
ND
N
D
17
TAB
LE 5
.Con
cent
ratio
ns o
f WE
T-ex
tract
able
ele
men
ts in
mg/
L of
ent
ire d
evic
e. B
old
face
resu
lts in
dica
te v
alue
s ab
ove
the
resp
ectiv
e S
TLC
crit
eria
(sho
wn
at th
e to
p of
the
Tabl
e.) S
hade
d ce
lls in
dica
te e
stim
ated
val
ues
(1/2
of t
he re
porti
ng li
mit
adju
sted
for d
ilutio
n fa
ctor
) and
sum
mar
y st
atis
tics
usin
g th
ese
estim
ated
val
ues .
STLC
LIM
IT=
5 10
0 1
1 5
80
25
5 35
0 20
1
5 7
24
250
ID
e-W
aste
type
A
s B
a B
e C
d C
r C
o C
u Pb
M
o N
i Se
A
g Tl
V
Zn
1
MW
ND
N
D
ND
N
D
ND
N
D
0.2
8.5
ND
N
D
ND
N
D
ND
N
D
1.3
2M
WN
D
ND
N
D
ND
N
D
ND
0.
0 4.
8N
D
ND
N
D
ND
N
D
ND
1.
2 3
MW
ND
N
D
ND
N
D
ND
N
D
0.2
13N
D
ND
N
D
ND
N
D
ND
0.
2 4
MW
ND
N
D
ND
N
D
ND
N
D
0.2
5.1
ND
N
D
ND
N
D
ND
N
D
0.0
mea
nN
D
ND
N
D
ND
N
D
ND
0.
1 7.
9N
D
ND
N
D
ND
N
D
ND
0.
7cv
%N
D
ND
N
D
ND
N
D
ND
63
48
N
D
ND
N
D
ND
N
D
ND
96
UL
ND
N
D
ND
N
D
ND
N
D
0.2
11N
D
ND
N
D
ND
N
D
ND
1.
25
VC
RN
D
ND
N
D
0.07
N
D
ND
N
D
20N
D
ND
N
D
ND
N
D
ND
21
6
VC
RN
D
ND
N
D
ND
N
D
ND
N
D
16N
D
ND
N
D
ND
N
D
ND
1
7V
CR
ND
N
D
ND
N
D
ND
N
D
ND
18
ND
N
D
ND
N
D
ND
N
D
1 8
VC
RN
D
ND
N
D
ND
N
D
ND
N
D
8N
D
ND
N
D
ND
N
D
ND
31
m
ean
ND
N
D
ND
N
D
ND
N
D
ND
14
ND
N
D
ND
N
D
ND
N
D
11
cv%
ND
N
D
ND
N
D
ND
N
D
ND
38
N
D
ND
N
D
ND
N
D
ND
15
6 U
LN
D
ND
N
D
ND
N
D
ND
N
D
18N
D
ND
N
D
ND
N
D
ND
25
9
CPU
ND
1.
5 N
D
0.04
N
D
ND
N
D
ND
N
D
ND
N
D
ND
N
D
ND
1
10C
PUN
D0.
9 N
D
ND
N
D
ND
N
D
2 N
D
ND
N
D
ND
N
D
ND
2
11C
PUN
D
2.2
ND
N
D
ND
N
D
ND
N
D
ND
N
D
ND
N
D
ND
N
D
1 12
CPU
ND
2.
1 N
D
ND
N
D
ND
N
D
ND
N
D
ND
N
D
ND
N
D
ND
1
mea
nN
D1.
7 N
D
ND
N
D
ND
N
D
ND
N
D
ND
N
D
ND
N
D
ND
1
cv%
ND
36.0
N
D
ND
N
D
ND
N
D
ND
N
D
ND
N
D
ND
N
D
ND
36
U
LN
D
2.2
ND
N
D
ND
N
D
ND
N
D
ND
N
D
ND
N
D
ND
N
D
1 13
Prin
ter
ND
N
D
ND
N
D
ND
N
D
0.18
97N
D
3.9
ND
N
D
ND
N
D
1.7
14Pr
inte
rN
D
ND
N
D
ND
N
D
ND
3.
63
51N
D
ND
N
D
ND
N
D
ND
1.
3 15
Prin
ter
ND
N
D
ND
N
D
ND
N
D
20.3
3 40
ND
N
D
ND
N
D
ND
N
D
0.9
16Pr
inte
rN
D
ND
N
D
ND
N
D
ND
5.
25
21N
D
17.2
N
D
ND
N
D
ND
0.
4 m
ean
ND
N
D
ND
N
D
ND
N
D
7.35
52N
D
ND
N
D
ND
N
D
ND
1.
1 cv
%N
D
ND
N
D
ND
N
D
ND
12
1.2
62
ND
N
D
ND
N
D
ND
N
D
50
UL
ND
N
D
ND
N
D
ND
N
D
14.6
479
ND
ND
ND
ND
ND
ND
2
18
TAB
LE 5
. Con
t’d.C
once
ntra
tions
of W
ET e
xtra
ctab
le e
lem
ents
in m
g/L
of e
ntire
dev
ice.
Bol
d fa
ce re
sults
indi
cate
val
ues
abov
e th
e re
spec
tive
STL
C c
riter
ia (s
how
n at
the
top
of th
e Ta
ble.
) S
hade
d ce
lls in
dica
te e
stim
ated
val
ues
(1/2
of t
he re
porti
ng li
mit
adju
sted
for d
ilutio
n fa
ctor
) and
sum
mar
y st
atis
tics
usin
g th
ese
estim
ated
val
ues.
ST
LC L
IMIT
= 5
100
1 1
5 80
25
5
350
20
1 5
7 24
25
0 ID
e-
Was
te T
ype
As
Ba
Be
Cd
Cr
Co
Cu
Pb
Mo
Ni
Se
Ag
Tl
V Zn
17C
ell
ND
3.
46
ND
N
D
ND
N
D
ND
52
ND
N
D
ND
N
D
0.2
ND
2
18C
ell
NA
N
A
NA
N
A
NA
N
A
NA
N
A
NA
N
A
NA
N
A
NA
N
A
NA
19
Cel
lN
D
ND
N
D
ND
N
D
ND
N
D
127
ND
N
D
ND
N
D
ND
N
D
1 21
Cel
lN
D
ND
N
D
ND
N
D
ND
N
D
0.1
ND
N
D
ND
N
D
ND
N
D
2 m
ean
ND
N
D
ND
N
D
ND
N
D
ND
64
ND
N
D
ND
N
D
ND
N
D
2 cv
%N
D
ND
N
D
ND
N
D
ND
N
D
141
ND
N
D
ND
N
D
ND
N
D
76
UL
ND
N
D
ND
N
D
ND
N
D
ND
16
1N
D
ND
N
D
ND
N
D
ND
3
20Te
leph
one
ND
5.
61
ND
0.
02
ND
N
D
ND
3.
4 N
D
ND
N
D
ND
N
D
ND
5
22Te
leph
one
ND
N
D
ND
N
D
ND
N
D
ND
1.
9 N
D
ND
N
D
ND
N
D
ND
3
23Te
leph
one
ND
N
D
ND
N
D
ND
N
D
ND
77
ND
N
D
ND
N
D
ND
N
D
1 24
Tele
phon
eN
D
ND
N
D
ND
N
D
ND
N
D
1.6
ND
N
D
ND
N
D
ND
N
D
109
mea
nN
D
ND
N
D
ND
N
D
ND
N
D
27N
D
ND
N
D
ND
N
D
ND
38
cv
%N
D
ND
N
D
ND
N
D
ND
N
D
162
ND
N
D
ND
N
D
ND
N
D
164
UL
ND
N
D
ND
N
D
ND
N
D
ND
62
ND
N
D
ND
N
D
ND
N
D
88
25R
adio
ND
N
D
ND
N
D
ND
N
D
2.66
75
ND
N
D
ND
N
D
ND
N
D
2 26
Rad
ioN
D
ND
N
D
ND
0.
69
ND
0.
2511
3N
D
ND
N
D
ND
N
D
ND
2
27R
adio
ND
N
D
ND
N
D
ND
N
D
0.55
93
ND
N
D
ND
N
D
0.4
ND
3
28R
adio
ND
N
D
ND
N
D
ND
N
D
21
77N
D
ND
N
D
ND
N
D
ND
4
mea
nN
D
ND
N
D
ND
N
D
ND
6.
189
ND
N
D
ND
N
D
ND
N
D
2 cv
%N
D
ND
N
D
ND
N
D
ND
16
3 19
N
D
ND
N
D
ND
N
D
ND
41
U
LN
D
ND
N
D
ND
N
D
ND
14
.310
4N
D
ND
N
D
ND
N
D
ND
3
19
TABLE 6. eWaste products exceeding hazardous waste criteria. Decision is based on the 90% Upper Confidence Level. When the sample size (n=4) was inadequate to compare to the hazardous waste criterion (assuming a normal distribution), the respective element is marked by an asterisk.
SOP-733S. Sample Preparation of Electronic Waste (E-waste) Samples for the Analysis of Semi-volatiles and Metals
24
Sample Preparation of Electronic Waste (E-waste) Samples for Analysis of Semi-volatiles and Metals
1. Scope and Application
1.1 This procedure is applicable to prepare electronic waste (E-waste) samples requiring analysis for semi-volatile organics and inorganic substances. When waste characterization for regulated substances is requested, pre-preparation procedures derived from Title 22, �66261.24 (a) (1) [the TCLP] and/or 66261.24 (a) (2) [persistent and bio-accumulative toxic substances] are applied as required.
1.2 This procedure is used to prepare samples from various E-wastes such as; cellular phones, video cassette recorders, domestic microwave ovens, computers, printers, and telephone/answering machines, etc. The purpose behind this approach is as follows:
1.2.1 Shredding and milling of E-waste samples to pass through a No. 10 (2mm) sieves designed to simulate the scenario of landfill materials being crushed/ground/weathered, to finer materials and thereby increasing their tendency to release toxic substances into the environment. Every effort must be made to reduce the particle size to pass through a 9.5 mm, 2 mm(No. 10) and 1 mm(No. 18) sieves sequentially, to meet the TCLP, WET an Total semi volatile analysis requirements. Due to the nature of E-waste matrices these particle sizes may not be achieved, and then every effort must be made to reduce the particle size close to the above requirements.
1.2.2 By shredding and milling the E-waste samples to pass through a No. 10 and No. 18 sieve, the sample homogeneity increases and should result in increased precision of the analyses.
1.2.3 Employing one uniform pre-preparation procedure provides a consistent and simplified approach to preparing all kinds of E-waste samples.
1.3 This SOP describes the procedure to prepare samples prior to any extraction or digestion procedure that may be required before subsequent analyses.
1.4 This procedure is recommended for use by laboratory assistants or technicians working under the close supervision of chemists experienced in the sample preparation requirements for semi-volatile organic and inorganic analyses.
2.0 Summary
2.1 The total weight of each type of E-waste sample submitted is weighed and recorded (waste samples of the same type can be grouped together as one sample). The E-waste samples are dismantled and components are classified as plastic, circuit board, or metal. Weight of each component, e.g., circuit board (with capacitors, transistors, battery), plastic and metal should be recorded and stored in separate containers before particle size reduction.
2.2 Each component of E-waste sample is representatively sampled, shredded, milled to pass through a No. 10 (or No.5) sieve, mixed for homogeneity, and then sampled for the requisite extraction or digestion procedures.
2.3 Particle size reduction is achieved by milling and grinding to the required mesh size. An appropriate shredder and mill or grinder is used for this process.
2.4 Interferences from carry over from one waste to another must be minimized by cleaning the equipment with dry wood chips and pressurized air. All containers must be clean and free of organic and inorganic substances. Small milling or grinding units may be cleaned as described in HML SOP 704-S.
3.0 Safety
3.1 Sample preparation should be performed in a well ventilated high ceiling room.
3.2 Nitrile gloves may be worn for hand protection, but must not come in contact with the sample, or the interior of the sample containers, to avoid contamination.
3.3 Use safety glasses or goggles when shredding and milling or grinding the samples.
3.4 The operator must wear a dust mask and coveralls if necessary during the process.
3.5 The working area (counters, equipment, tools, etc.) should be kept clean at all times.
3.6 Operating instructions must be followed while using the shredder and/or grinder.
4.0 Apparatus and Materials
4.1 Hand tools for dismantling e.g. special screw drivers for electronic products, electric drill/saw, cutters and pliers, etc.
26
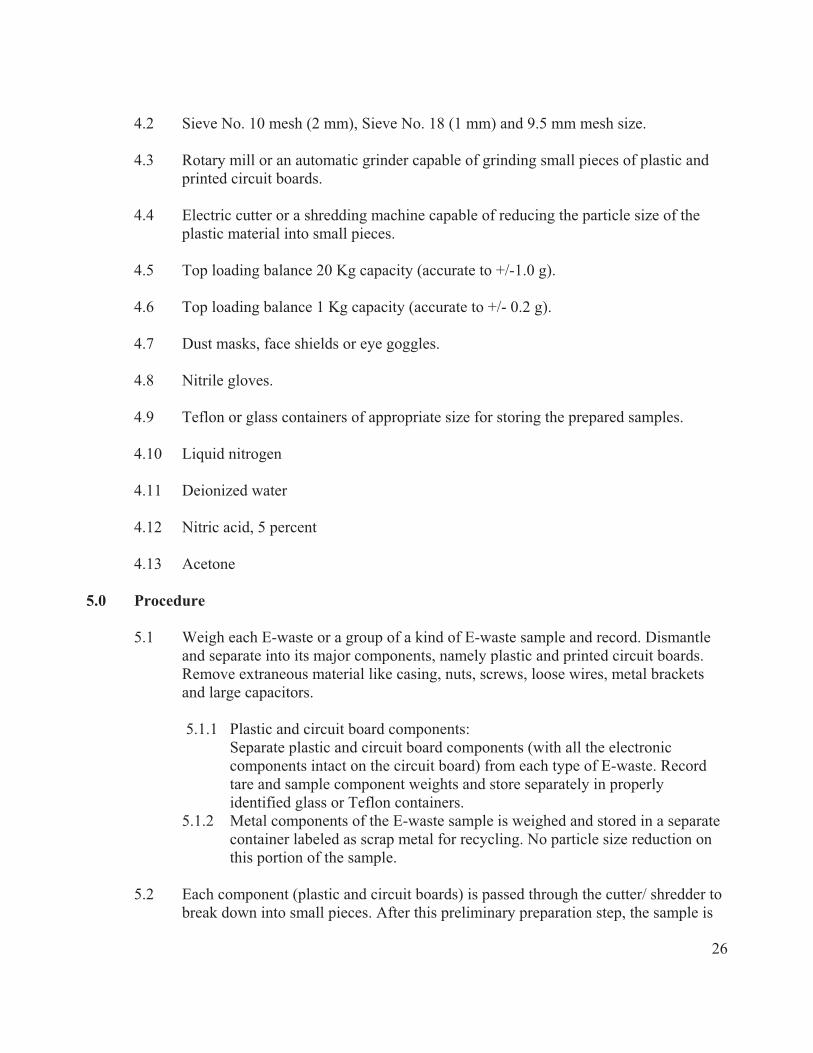
4.2 Sieve No. 10 mesh (2 mm), Sieve No. 18 (1 mm) and 9.5 mm mesh size.
4.3 Rotary mill or an automatic grinder capable of grinding small pieces of plastic and printed circuit boards.
4.4 Electric cutter or a shredding machine capable of reducing the particle size of the plastic material into small pieces.
4.5 Top loading balance 20 Kg capacity (accurate to +/-1.0 g).
4.6 Top loading balance 1 Kg capacity (accurate to +/- 0.2 g).
4.7 Dust masks, face shields or eye goggles.
4.8 Nitrile gloves.
4.9 Teflon or glass containers of appropriate size for storing the prepared samples.
4.10 Liquid nitrogen
4.11 Deionized water
4.12 Nitric acid, 5 percent
4.13 Acetone
5.0 Procedure
5.1 Weigh each E-waste or a group of a kind of E-waste sample and record. Dismantle and separate into its major components, namely plastic and printed circuit boards. Remove extraneous material like casing, nuts, screws, loose wires, metal brackets and large capacitors.
5.1.1 Plastic and circuit board components: Separate plastic and circuit board components (with all the electronic
components intact on the circuit board) from each type of E-waste. Record tare and sample component weights and store separately in properly identified glass or Teflon containers.
5.1.2 Metal components of the E-waste sample is weighed and stored in a separate container labeled as scrap metal for recycling. No particle size reduction on this portion of the sample.
5.2 Each component (plastic and circuit boards) is passed through the cutter/ shredder to break down into small pieces. After this preliminary preparation step, the sample is
27
ground in a mill or grinder to a fine particle size.
5.3 Clean the equipments after processing each component. Pass dried wood chips through the shredder/cutter and mill/grinder. Inspect equipments for left over wood chips, then blast through the equipments with pressurized air to ensure they are completely free of sample particles or wood chips. Wear masks and goggles.
5.4 The entire sample is sieved through the 9.5 mm, 2 mm, and 1 mm sieves sequentially to meet the TCLP, WET and Total semivolatile analysis. Record the weight of each fraction and store in a glass container properly labeled at 40 C.
5.5 Repeat the cleaning process as in step 5.3 after all the samples have been processed.
6 Alternative Procedure For E-waste Sample Preparation: In case the above procedure is not possible to reduce the particle size of the samples, the following alternative approach may be applied.
6.1 Weigh and record the total weight of each sample or a like kind group of E-waste samples. Dismantle each sample and separate into its major components like plastic, printed circuit board and scrap metal containing metal casing, nut, screws, large capacitors, metal brackets and wires. Record all the weights separately and store in separate glass or Teflon containers properly labeled.
6.1.1 Metal part of the E-waste samples is weighed and stored in a labeled plastic container. This part of the waste is for recycling only; no particle size reduction will be performed.
6.2 Only printed circuit boards ( with all the electronic components intact) and plastic part of the sample were cut into smaller pieces by using all mechanical means like the electric drill and/or diamond saw, cutters, pliers and hammers. Sometimes plastic is hard to cut but breaking with hammer and a cutter may work out.
6.3 Small cut pieces of each waste sample were collected at random from the pile of broken pieces and were frozen separately in liquid nitrogen for 2 hours to facilitate further breaking and crushing.
6.4 The frozen pieces were crushed into smaller size by using the cutters, hammers, pestle mortal and a hydraulic press if necessary to achieve the finer particle size that should pass through 9.5 mm sieve. Record the final weight of the sample prepared by this procedure and store in a glass or Teflon container at 4oC.
6.5 Clean all the equipment by rinsing with DI water, 5 percent nitric acid, DI water and acetone in series and air dry before using for the next sample.
6.6 Sieved portions of the sample should be used to perform the organic and inorganic
28
analysis.
7 Quality Control
Although most of these QC requirements are defined in analytical procedures, some additional requirements have been introduced to check the efficiency, precision and accuracy of all the procedures. A sample batch is defined as a group of 10 samples or fewer, that is processed together and is comprised of samples of similar matrix.
7.1 With a batch of each matrix type (plastic and circuit boards) of E-waste, one method blank should be included, containing all the reagents and processed with the sample batch.
7.2 In a batch of each matrix type of E-waste, one sample must be prepared in sufficient quantity by using one of the above particle size reduction methods. Divide this sample into three portions.
7.3 One portion of the sample (7.2) should be analyzed as unspiked to check the background contamination (plastic or circuit board). The other two portions should be used for matrix spike and matrix spike duplicate.
7.4 A method standard is run containing all the elements/compounds of interest with each batch of samples. Standards from the same vendor must be used as that used for matrix spike and matrix spike duplicate. Spiking standards must be acquired from the vendor other than the calibrating standards.
7.5 In a batch, one sample (different than one used for MS, MSD) should be run in triplicate for each matrix the precision and homogeneity of the sample preparation method. (Additional QC).
8.0 References
8.1 Title 22. California Code of Regulations, Article 3. �66261
8.2 HML - SOP 704S: Operation and cleaning of automated milling equipment.
9.0 Acknowledgement
This SOP was developed and written by the staff of Hazardous Materials Laboratory, California Department of Toxic Substances Control. For more information please call Jarnail Garcha at (510) 540-3468.
29
A
ppen
dix
- B
Tabl
e Q
C-I
Qua
lity
Con
trol a
nd M
S &
MS
D R
esul
ts fo
r Tot
al M
etal
s
Sam
ple
Num
ber
E-
was
te
Type
B
atch
#
Spi
ke
Leve
l (m
g/L)
Sb
As
Ba
Be
Cd
Cr
Co
Cu
Pb
Mo
Ni
Se
Ag
Tl
V
Zn
Bla
nk
3G
1800
8BL
K5
N
D
ND
ND
ND
ND
ND
ND
ND
ND
ND
ND
ND
ND
ND
ND
ND
LCS
3G18
008B
S1
50.0
50.6
48
.4
49.1
52
.0
48.2
49
.7
49.8
49
.2
49.2
49
.4
51.0
47
.2
47.8
48
.1
50
49.0
% R
ec
10
1 96
.8
98.2
10
4 96
.4
99.4
99
.6
98.4
98
.4
98.8
10
2 94
.4
95.6
96
.2
100
98
5 V
CR
2900
N
D
940
20
4.8
9.1
7.6
8100
0 12
000
2.9
240
ND
23
0 N
D
ND
53
00
MS
3G
1800
8M
S1
50.0
39
30
38.8
15
10
51.8
50
.7
56.0
55
.8
1200
00
9460
34
.4
330
36.1
88
.8
36.5
N
D
7790
MSD
3G18
008
MS
D1
50.0
34
40
39.3
32
3 53
.0
48.9
13
8 53
.8
8380
0 84
60
37.5
42
4 33
.5
165
42.9
N
D
3020
%
Rec
MS
3G18
008
N
R
77.6
N
R
63.6
91
.8
93.8
96
.4
NR
N
R
63.0
18
0 72
.2
NR
73
NR
QM
-4X
Q
M-4
X Q
M-0
7
QM
-4X
QM
-4X
QM
-07
QM
-4X
QM
-07
QM
-07
QM
-07
QM
-07
QM
-07
%R
ecM
SD
3G18
008
N
R
79.6
N
R
66
88.2
25
8 92
.4
NR
N
R
69.2
36
8 67
N
R
85.8
NR
Q
M-4
X
QM
-4X
QM
-07
Q
M-0
7
QM
-4X
QM
-4X
QM
-07
QM
-4X
QM
-07
QM
-07
Q
M-0
7 Q
M-4
X
RP
D
13
.3
1.28
13
0 2.
29
3.61
84
.5
3.65
35
.5
11.2
8.
62
24.9
7.
47
60.0
16
.1
88
.3
Bla
nk
3H
0602
1BL
K1
N
D
ND
ND
ND
ND
ND
ND
ND
ND
ND
ND
ND
ND
ND
ND
ND
LCS
3H06
021
BS
150
.048
.4
42.0
44
.0
46.3
144
.6
45.5
45
.6
46.9
47
.2
44.3
45
.7
45.0
44
.6
43.7
45
.2
45.6
% R
ec
96
.8
84.0
88
.0
92.6
89
.2
91.0
91
.2
93.8
94
.4
88.6
91
.4
90.0
89
.2
87.4
90
.4
91.2
19C
ell
Pho
ne12
00
5.2
1600
23
0 1.
7 30
78
12
0000
52
00
13
2000
N
D
220
ND
N
D
2600
MS
3H
0602
1M
S1
50.0
13
00
33.3
19
50
620
44.7
85
.1
166
1380
00
3570
17
.1
1790
39
.8
123
35.7
N
D
ND
MSD
3H06
021
MS
D1
50.0
94
4 18
.5
791
47.0
43
.5
64.7
54
4 95
400
2540
5.
45
776
32.7
12
4 35
.1
ND
N
D
%R
ecM
S
20
0 56
.2
700
780
86.0
11
0 17
6 N
R
NR
8.
20
NR
79
.6
NR
71
.4
N
R
Q
M-4
X Q
M-0
7 Q
M-0
7 Q
M-0
6
Q
M-0
7 Q
M-4
X Q
M-4
X Q
M-0
7 Q
M-4
X
QM
-07
QM
-07
QM
-07
QM
-07
%R
ecM
SD
N
R
26.6
N
R
NR
83
.6
69.4
93
2 N
R
NR
N
R
NR
65
.4
NR
70
.4
N
R
Q
M-4
X Q
M-0
7 Q
M-4
X Q
M-0
6
QM
-07
QM
-4X
QM
-4X
QM
-4X
QM
-07
QM
-4X
QM
-07
QM
-07
QM
-07
QM
-07
QM
-07
RP
D
31
.7
57.1
84
.6
172
2.72
27
.2
106
36.5
33
.7
103
79.0
19
.6
0.81
0 1.
69
ND
= A
naly
te N
OT
DE
TEC
TED
at o
r abo
ve th
e re
porti
ng li
mit
N
R =
Not
Rep
orte
dQ
M-0
6
Due
to n
oted
non
- hom
ogen
eity
of t
he Q
C s
ampl
e m
atrix
, the
MS
/MS
Ds
did
not p
rovi
de re
liabl
e re
sults
for a
ccur
acy
and
prec
isio
n.
S
ampl
e re
sults
for t
he Q
C b
atch
wer
e ac
cept
ed b
ased
on
LCS
/LC
SD
per
cent
reco
verie
s an
d R
PD
val
ues.
Q
M-0
7
The
spi
ke re
cove
ry w
as o
utsi
de c
ontro
l lim
its fo
r the
MS
and
/or M
SD
. The
bat
ch w
as a
ccep
ted
base
d on
acc
epta
ble
LCS
reco
very
. Q
M-4
x
The
spi
ke re
cove
ry w
as o
utsi
de o
f con
trol l
imits
for t
he M
S a
nd/o
r MS
D d
ue to
ana
lyte
con
cent
ratio
n at
4 ti
mes
or g
reat
er th
e sp
ike
conc
entra
tion.
The
QC
bat
ch w
as a
ccep
ted
base
d on
LC
S a
nd/o
r LC
SD
reco
verie
s w
ithin
the
acce
ptan
ce li
mits
.
30
Tabl
e Q
C-I
(con
t.).
Qua
lity
Con
trol a
nd M
S &
MS
D R
esul
ts fo
r Tot
al M
etal
s
Sam
ple
Num
ber
E-
was
te
Type
B
atch
#
Spi
ke
Leve
l (m
g/L)
Sb
As
Ba
Be
Cd
Cr
Co
Cu
Pb
Mo
Ni
Se
Ag
Tl
V
Zn
Bla
nk
3G
1603
1B
LK1
N
D
ND
ND
ND
ND
ND
ND
ND
ND
ND
ND
ND
ND
ND
ND
ND
LCS
3G16
031
BS
1 50
.0
50.2
47
.6
50.2
50
.8
47.5
50
.3
50.2
49
.9
49.0
48
.1
49.5
45
.9
49.0
49
.8
50.7
48
.5
% R
ec
10
0 95
.2
100
102
95
101
100
99.8
98
96
.2
99
91.8
98
99
.6
101
97
20C
ell
phon
e
16
0 6.
2 24
00
10
ND
25
00
170
1200
00
4300
27
30
00
ND
14
0 N
D
ND
36
00
MS
3G
1603
1M
S1
50.0
12
3 47
.1
1460
47
.5
41.6
26
40
192
9520
0 31
30
76.1
23
10
35.4
12
2 41
.3
ND
16
00
MSD
3G16
031
MS
D1
50.0
12
2 56
.1
5480
31
4 45
.4
1490
23
9 13
2000
54
30
58.5
46
60
43.2
16
4 13
.2
ND
22
30
%R
ec M
S
N
R
81.8
N
R
75
83.2
28
0 44
N
R
NR
98
.2
NR
70
.8
NR
82
.6
N
R
QM
-07
Q
M-0
6 Q
M-0
6
QM
-06
QM
-07
QM
-06
QM
-06
QM
-07
QM
-06
QM
-07
QM
-07
%R
ecM
SD
N
R
99.8
N
R
608
90.8
N
R
138
NR
N
R
63
NR
86
.4
48
26.4
NR
Q
M-0
7
QM
-06
QM
-06
Q
M-0
6 Q
M-0
7 Q
M-0
6 Q
M-0
6 Q
M-0
7 Q
M-0
6
QM
-07
RP
D
0.
816
17.4
11
6 14
7 8.
74
55.7
21
.8
32.4
53
.7
26.2
67
.4
19.8
29
.4
103
32
.9
Bla
nk
3G
1603
0B
LK1
N
D
ND
ND
ND
ND
ND
ND
ND
ND
ND
ND
ND
ND
ND
ND
ND
LCS
3G16
030
BS
1 50
.0
49.9
46
.8
48.2
51
.4
48.1
49
.9
50.4
47
.4
49.4
48
.5
50.9
46
.1
48.3
47
.5
50.4
49
.4
% R
ec
99
.8
93.6
96
.4
103
96.2
99
.8
101
94.8
98
.8
97.0
10
2 92
.2
96.6
95
.0
101
98.8
28
Rad
io
87
ND
11
0 N
D
7.1
ND
1.
6 46
000
1500
N
D
74
ND
12
N
D
ND
28
0
MS
3G
1603
0M
S1
35
6 45
.1
506
51.6
50
.8
53.0
56
.3
6430
0 50
60
45.4
64
9 44
.3
122
42.1
N
D
5270
MSD
3G16
030
MS
D1
30
3 40
.4
448
49..0
53
.2
49.6
48
.8
5300
0 36
40
38.6
24
5 41
.9
68.4
41
.3
ND
91
30
%R
ec M
S
53
8 90
.2
792
103
87.4
10
6 10
9 N
R
NR
90
.8
NR
88
.6
220
84.2
NR
Q
M-4
X
QM
-4X
QM
-4X
QM
4X
Q
M-4
X
QM
-07
Q
M-R
X Q
M-4
X %
Rec
MS
D
43
2 80
.8
676
98.0
92
.2
99.2
94
.4
NR
N
R
77.2
34
2 83
.8
113
82.6
NR
Q
M-4
X
QM
-4X
QM
-4X
QM
-4X
Q
M-4
X
QM
-07
Q
M-R
X Q
M-4
X
RP
D
16
.1
11.0
12
.2
5.17
4.
62
6.63
14
.3
19.3
32
.6
16.2
90
.4
5.57
56
.3
1.92
53.6
ND
= A
naly
te N
OT
DE
TEC
TED
at o
r abo
ve th
e re
porti
ng li
mit
NR
= N
ot R
epor
ted
QM
-06
D
ue to
not
ed n
on- h
omog
enei
ty o
f the
QC
sam
ple
mat
rix, t
he M
S/M
SD
s di
d no
t pro
vide
relia
ble
resu
lts fo
r acc
urac
y an
d pr
ecis
ion.
Sam
ple
resu
lts fo
r the
QC
bat
ch w
ere
acce
pted
bas
ed o
n LC
S/L
CS
D p
erce
nt re
cove
ries
and
RP
D v
alue
s.
QM
-07
T
he s
pike
reco
very
was
out
side
con
trol l
imits
for t
he M
S a
nd/o
r MS
D. T
he b
atch
was
acc
epte
d ba
sed
on a
ccep
tabl
e LC
S re
cove
ry.
QM
-4x
T
he s
pike
reco
very
was
out
side
of c
ontro
l lim
its fo
r the
MS
and
/or M
SD
due
to a
naly
te c
once
ntra
tion
at 4
tim
es o
r gre
ater
the
spik
e co
ncen
tratio
n.
T
he Q
C b
atch
was
acc
epte
d ba
sed
on L
CS
and
/or L
CS
D re
cove
ries
with
in th
e ac
cept
ance
lim
its.
31
Tabl
e Q
C-II
Qua
lity
Con
trol
and
MS
& M
SD
Res
ults
for
WET
-ext
ract
able
ele
men
ts
Sam
ple
Num
ber
E-
was
te
Type
B
atch
#
Spi
ke
Leve
l (m
g/L)
Al
As
Ba
Be
Cd
Cr
Cu
Co
Pb
Mo
Ni
Ag
Se
Tl
V
Zn
Blan
k
3H07
013
BLK1
ND
N
D
ND
N
D
ND
N
D
ND
N
D
ND
N
D
ND
N
D
ND
N
D
ND
N
D
LCS
3H07
013-
BS
1 2.
00
1.94
2.
06
1.90
1.
88
1.89
1.
92
1.89
1.
93
2.00
1.
93
1.95
1.
92
1.80
1.
94
1.92
1.
94
% R
ec
97
.0
103
95
94
94.5
96
94
.5
96.5
10
0 96
.5
97.5
96
90
97
96
97
7 VC
R
1.5
0.23
0.
31
ND
N
D
ND
N
D
0.35
50
N
D
2.9
ND
N
D
0.39
N
D
3.7
MS
3H07
013-
MS
1 2.
00
11.8
2.
05
11.1
1.
93
1.94
1.
98
1.94
1.
99
0.99
4 1.
96
1.99
1.
93
1.81
1.
93
1.97
1.
99
MSD
3H07
013-
MD
S1
2.00
11
.8
2.11
11
.1
1.94
1.
95
1.98
1.
95
1.99
1.
01
2.00
2.
00
1.94
1.
82
1.96
1.
98
2.00
%R
ec M
S
51
5 91
.0
540
96.5
97
99
97
82
.0
NR
98
.0
NR
96
.5
90.5
77
98
.5
NR
QM
-07
Q
M-0
7
QM
-07
Q
M-0
7
Q
M-0
7
QM
-07
%R
ecM
SD
515
94.0
54
0 97
.0
97.5
99
.0
97.5
82
.0
NR
10
0 N
R
97.0
91
.0
78.5
99
N
R
Q
M-0
7
QM
-07
Q
M-0
7
QM
-07
QM
-07
Q
M-0
7
RP
D
0.
00
2.88
00
.00
0.51
7 0.
514
0.00
0.
514
0.00
1.
60
2.02
0.
501
0.51
7 0.
551
1.54
0.
506
0.50
1
Blan
k
3G29
009B
LK1
N
D
ND
N
D
ND
N
D
ND
N
D
ND
N
D
ND
N
D
ND
N
D
ND
N
D
ND
LCS
3G29
009
BS
1 2.
00
2.02
1.
89
1.97
1.
94
1.99
1.
98
1.93
2.
00
1.95
1.
99
2.02
1.
96
1.80
2.
03
1.98
2.
01
% R
ec
10
1 94
.5
98.5
97
.0
99.5
99
.0
96.5
10
0 97
.5
99.5
10
1 98
.0
90.0
10
2 99
.0
100
10
CPU
1.
8 N
D
2.9
ND
0.
049
ND
N
D
0.40
6.
8 N
D
1.6
ND
N
D
ND
N
D
6.7
MS
3G29
009-
MS
1 2.
00
3.73
1.
91
4.74
1.
94
2.04
2.
03
1.97
2.
40
9.12
2.
00
3.57
1.
89
1.79
2.
07
1.99
8.
55
MSD
3G29
009-
MS
D1
2.00
3.
76
2.00
4.
72
1.94
2.
05
2.05
1.
96
2.39
8.
56
2.00
3.
58
1.89
1.
83
2.15
1.
99
8.56
%R
ec M
S
96
.5
95.5
92
.0
97.0
99
.6
102
98.5
10
0 11
6 10
0 98
.5
94.5
89
.5
104
99.5
92
.5
%R
ecM
SD
98.0
10
0 91
.0
97.0
10
0 10
2 98
.0
99.5
88
.0
100
99.0
94
.5
91.5
10
8 99
.5
93.0
RP
D
0.
801
4.60
0.
423
0.00
0.
489
0.98
0 0.
509
0.41
8 6.
33
0.00
0.
280
0.00
2.
21
3.79
0.
00
0.11
7
ND
= A
naly
te N
OT
DE
TEC
TED
at o
r abo
ve th
e re
porti
ng li
mit
N
R =
Not
Rep
orte
dQ
M-0
6
Due
to n
oted
non
- hom
ogen
eity
of t
he Q
C s
ampl
e m
atrix
, the
MS
/MS
Ds
did
not p
rovi
de re
liabl
e re
sults
for a
ccur
acy
and
prec
isio
n.
S
ampl
e re
sults
for t
he Q
C b
atch
wer
e ac
cept
ed b
ased
on
LCS
/LC
SD
per
cent
reco
verie
s an
d R
PD
val
ues.
Q
M-0
7
The
spi
ke re
cove
ry w
as o
utsi
de c
ontro
l lim
its fo
r the
MS
and
/or M
SD
. The
bat
ch w
as a
ccep
ted
base
d on
acc
epta
ble
LCS
reco
very
. Q
M-4
x
The
spi
ke re
cove
ry w
as o
utsi
de o
f con
trol l
imits
for t
he M
S a
nd/o
r MS
D d
ue to
ana
lyte
con
cent
ratio
n at
4 ti
mes
or g
reat
er th
e sp
ike
conc
entra
tion.
The
QC
bat
ch w
as a
ccep
ted
base
d on
LC
S a
nd/o
r LC
SD
reco
verie
s w
ithin
the
acce
ptan
ce li
mits
.
32
Tabl
e Q
C-II
(con
t). Q
ualit
y C
ontro
l and
MS
& M
SD
Res
ults
for W
ET-e
xtra
ctab
le e
lem
ents
Sam
ple
Num
ber
E-w
aste
Ty
pe
Bat
ch #
Spi
ke
Leve
l (m
g/L)
Al
As
Ba
Be
Cd
Cr
Cu
Co
Pb
Mo
Ni
Ag
Se
Tl
V
Zn
Bla
nk
3G
1900
1-BL
K1
N
D
ND
N
D
ND
N
D
ND
N
D
ND
N
D
ND
N
D
ND
N
D
ND
N
D
ND
LCS
3G19
001-
BS
1 2.
00
1.97
2.
27
1.93
1.
96
2.00
1.
99
1.92
2.
00
1.96
1.
99
2.02
1.
95
1.77
2.
11
1.98
2.
02
% R
ec
98
.5
114
96.5
98
.0
100
99.5
96
.0
100
98.0
99
.5
101
97.5
88
.5
106
99.0
10
1
20C
ell
Phon
e
2.
00
ND
10
N
D
0.02
8 N
D
ND
4.
2 6.
1 N
D
1.3
ND
N
D
0.45
N
D
9.8
MS
3G
1900
1 M
S1
2.00
3.
84
2.36
11
.9
2.03
2.
06
2.27
1.
87
6.54
8.
66
2.05
3.
44
1.86
1.
95
2.46
2.
07
12.5
MSD
3G19
001
MS
D1
2.00
3.
85
2.22
11
.9
2.00
2.
04
2.25
1.
85
6.51
8.
37
2.06
3.
45
1.83
1.
85
2.45
2.
06
12.4
%R
ec M
S
92
.0
118
95.0
10
2 10
2 11
4 93
.5
117
128
102
107
93.0
97
.5
100
104
135
QM
-07
QM
-07
QM
-07
%R
ecM
SD
92.5
11
1 95
.0
100
101
112
92.5
11
6 11
4 10
3 10
8 91
.5
92.5
10
0 10
3 13
0
Q
M-0
7 Q
M-0
7
Q
M-0
7
RP
D
0.
260
6.11
0.
00
1.49
0.
976
0.88
5 1.
08
0.46
0 3.
41
0.48
7 0.
290
1.63
5.
26
0.40
7 0.
484
0.80
3
Bla
nk
3H
2703
3-B
LK1
N
D
ND
N
D
ND
N
D
ND
N
D
ND
N
D
ND
N
D
ND
N
D
ND
N
D
ND
LCS
3H27
033
BS
1 2.
00
1.95
1.
86
1.91
1.
92
1.97
1.
98
1.95
1.
97
1.94
1.
95
2.13
1.
93
2.01
1.
99
1.94
2.
01
% R
ec
97
.5
93.0
93
.5
96.0
98
.5
99.0
97
.5
98.5
97
.0
97.5
10
6 96
.5
100
99.5
97
.0
100
1M
icro
wav
e O
ven
0.23
N
D
0.15
N
D
ND
N
D
1.8
ND
67
N
D
3.7
ND
0.
02
ND
N
D
10.0
MS
3H
2703
3
2.00
2.
18
1.91
2.
06
1.90
1.
93
1.95
3.
86
1.97
73
.5
1.91
5.
88
1.90
1.
91
1.98
1.
97
12.7
MSD
3H27
033
2.
00
2.20
2.
02
2.07
1.
92
1.95
1.
98
3.86
2.
00
73.7
1.
94
5.91
1.
93
1.94
1.
92
1.98
12
.7
%R
ec M
S
97
.5
95.5
95
.5
95.0
96
.5
97.5
10
3 98
.5
325
95.5
10
9 95
.0
94.6
99
.0
98.5
13
5
QM
-4X
QM
-4X
%R
ecM
SD
98.5
10
1 96
.0
96.0
97
.5
99.0
10
3 10
0 33
5 97
.0
110
96.5
96
.0
96.0
99
.0
135
Q
M-4
X
Q
M-4
X
RP
D
0.
913
5.60
0.
484
1.05
1.
03
1.53
0.
00
1.51
0.
272
1.56
0.
509
1.57
1.
56
3.08
0.
506
0.
00
ND
= A
naly
te N
OT
DE
TEC
TED
at o
r abo
ve th
e re
porti
ng li
mit
N
R =
Not
Rep
orte
dQ
M-0
6
Due
to n
oted
non
- hom
ogen
eity
of t
he Q
C s
ampl
e m
atrix
, the
MS
/MS
Ds
did
not p
rovi
de re
liabl
e re
sults
for a
ccur
acy
and
prec
isio
n.
S
ampl
e re
sults
for t
he Q
C b
atch
wer
e ac
cept
ed b
ased
on
LCS
/LC
SD
per
cent
reco
verie
s an
d R
PD
val
ues.
Q
M-0
7
The
spi
ke re
cove
ry w
as o
utsi
de c
ontro
l lim
its fo
r the
MS
and
/or M
SD
. The
bat
ch w
as a
ccep
ted
base
d on
acc
epta
ble
LCS
reco
very
. Q
M-4
x
The
spi
ke re
cove
ry w
as o
utsi
de o
f con
trol l
imits
for t
he M
S a
nd/o
r MS
D d
ue to
ana
lyte
con
cent
ratio
n at
4 ti
mes
or g
reat
er th
e sp
ike
conc
entra
tion.
The
QC
bat
ch w
as a
ccep
ted
base
d on
LC
S a
nd/o
r LC
SD
reco
verie
s w
ithin
the
acce
ptan
ce li
mits
.
33
Tabl
e Q
C-II
(con
t.).
Qua
lity
Con
trol a
nd M
S &
MS
D R
esul
ts fo
r W
ET-e
xtra
ctab
le e
lem
ents
Sam
ple
Num
ber
E-w
aste
Ty
pe
Bat
ch #
Spi
ke
Leve
l (m
g/L)
Al
As
Ba
Be
Cd
Cr
Cu
Co
Pb
Mo
Ni
Ag
Se
Tl
V
Zn
Bla
nk
3J
0800
4
BLK1
ND
N
D
ND
N
D
ND
N
D
ND
N
D
ND
N
D
ND
N
D
ND
N
D
ND
N
D
LCS
3J08
004
2.00
2.
00
2.00
1.
96
1.96
1.
99
1.99
1.
96
1.99
1.
97
1.97
2.
01
1.96
2.
00
1.96
1.
98
2.01
% R
ec
10
0 10
0 98
.0
98.0
99
.5
99.5
98
.0
99.5
98
.5
98.5
10
0 98
.0
100
98.0
99
.0
100
8 VC
R
3J08
004
2.
00
ND
0.
24
ND
0.
016
ND
0.
16
ND
24
N
D
2.3
ND
N
D
ND
N
D
94
MS
3J08
004
2.00
4.
04
1.95
2.
23
1.95
2.
01
2.05
2.
14
2.13
22
.6
2.03
4.
36
1.89
1.
76
2.05
1.
99
97.4
MS
D
3J
0800
4 2.
00
3.96
2.
15
2.22
1.
98
2.00
2.
06
2.15
2.
14
25.7
2.
02
4.33
1.
88
1.94
2.
08
2.01
95
.5
%R
ec M
S
10
2 97
.5
99.5
97
.5
99.7
10
2 99
.0
106
-70
102
103
94.5
88
.0
102
99.5
17
0
QM
-4X
QM
-4X
%R
ecM
SD
98.0
10
8 99
.0
99.0
99
.2
103
99.5
10
7 85
.0
101
102
94.0
97
.0
104
100
75
QM
-4X
RP
D
2.
00
9.76
0.
449
1.53
0.
499
0.48
7 0.
466
0.46
8 12
.8
0.49
4 0.
690
0.53
1 9.
73
1.45
1.
00
1.97
ND
= A
naly
te N
OT
DE
TEC
TED
at o
r abo
ve th
e re
porti
ng li
mit
N
R =
Not
Rep
orte
dQ
M-0
6
Due
to n
oted
non
- hom
ogen
eity
of t
he Q
C s
ampl
e m
atrix
, the
MS
/MS
Ds
did
not p
rovi
de re
liabl
e re
sults
for a
ccur
acy
and
prec
isio
n.
S
ampl
e re
sults
for t
he Q
C b
atch
wer
e ac
cept
ed b
ased
on
LCS
/LC
SD
per
cent
reco
verie
s an
d R
PD
val
ues.
Q
M-0
7
The
spi
ke re
cove
ry w
as o
utsi
de c
ontro
l lim
its fo
r the
MS
and
/or M
SD
. The
bat
ch w
as a
ccep
ted
base
d on
acc
epta
ble
LCS
reco
very
. Q
M-4
x
The
spi
ke re
cove
ry w
as o
utsi
de o
f con
trol l
imits
for t
he M
S a
nd/o
r MS
D d
ue to
ana
lyte
con
cent
ratio
n at
4 ti
mes
or g
reat
er th
e sp
ike
conc
entra
tion.
The
QC
bat
ch w
as a
ccep
ted
base
d on
LC
S a
nd/o
r LC
SD
reco
verie
s w
ithin
the
acce
ptan
ce li
mits
.
34
Table III-Quality Control and MS & MSD Results for TCLP-extractable elements Collector’sSample #: E-waste Type Batch No.
RPD 3.16 0.209 0.489 0.851 0.00 5.71 0.255 1 = Q-LIM The percent recovery was outside of the control limits. The sample results may still be useful for their intended purpose. 2 = QM-07 The spike recovery was outside control limits for the MS and/or MSD. The batch was accepted based on acceptable LCS recovery. 3 = QM-4x The spike recovery was outside of control limits for the MS and/or MSD due to analyte concentration at 4 times or greater the spike concentration. The QC batch was accepted based on LCS and/or LCSD recoveries within the acceptance limits. ND Analyte NOT DETECTED at or above the reporting limit.
35
Appendix C
Sample Dismantling Tools Sample Milling Device
Sample separated into plastic & millable parts. Sample collection in a stainless steel container during milling process.
Grounded Sample transferred into glass containers & Cleaning of milling device after each operation. ready for analysis