Determination of seventeen major and trace elements in new float glass standards for use in forensic comparisons using laser ablation inductively coupled plasma mass spectrometry☆
Jose Almirall a,*, Anuradha Akmeemana a, Katelyn Lambert a, Ping Jiang a, Ela Bakowska b, Ruthmara Corzo c, Claudia Martinez Lopez d, Edward “Chip” Pollock e, Katrin Prasch f, Tatiana Trejos d, Peter Weis f, Wim Wiarda g, Huifang Xie h, Peter Zoon g
a Department of Chemistry and Biochemistry, Center for Advanced Research in Forensic Science, Florida International University, Miami, FL 33199, USA b Corning, RDC, SP-FR-6, Corning, NY 14830, USA c National Institute of Standards and Technology, Materials Measurement Science Division, Gaithersburg, MD 20899, USA d Department of Forensic and Investigative Science, West Virginia University, 1600 University Avenue, Morgantown, WV 26506, USA e Sacramento County DA’s Office, Laboratory of Forensic Services, 4800 Broadway, Suite 200, Sacramento, CA 95820, USA f Bundeskriminalamt (BKA), Forensic Science Institute, KT 42, 65173 Wiesbaden, Germany g Netherlands Forensic Institute, Division of Chemical and Physical Traces, Microtraces & Materials Group, Laan van Ypenburg 6, 2497GB, The Hague, Netherlands h Health Sciences Authority, Forensic Chemistry and Physics Laboratory, 11 Outram Road, 169078, Singapore
A R T I C L E I N F O
Keywords: LA-ICP-MS Glass calibration standards Forensic analysis and comparisons
A B S T R A C T
Consensus concentration values for seventeen (17) major and trace elements typically present in soda-lime glass manufactured using the “float” process and used in the quantitative analysis and forensic comparison of glass samples were determined using laser ablation (LA) micro sampling coupled to inductively coupled plasma mass spectrometry (ICP-MS). This is the first reporting of the chemical characterization of a new set of float glass intended for use as matrix-matched calibration standards in the forensic analysis and comparison of glass by LA- ICP-MS using a standard test method (ASTM E2927-16e1). Three Corning Float Glass Standards (CFGS) were manufactured at low, medium, and high concentrations of 32 elements typically encountered in float glass samples as found in forensic casework. This work describes an international collaboration among seven (7) laboratories to evaluate the homogeneity of the three glass materials and reports the consensus concentrations values of 17 elements at three concentration levels. Eight (8) sets of independent results from LA-ICP-MS analysis using the standard test method of analysis and one set of micro-X-ray Fluorescence Spectrometry (μXRF) data (using method ASTM E2926-17) resulted in typically <3% relative standard deviation (RSD) within each lab and < 5% RSDs among all labs participating in the study for the concentration ranges using sampling spots between 50 μm - 100 μm in diameter. These results suggest that the new calibration standards are homogeneous for most elements at the small sampling volumes (~ 90 μm deep by ~80 μm in diameter) reported and show excellent agreement among the different participating labs. Consensus concentration values are determined using a pre-viously reported calibration standard (FGS 2) and checked with a NIST 1831 SRM®. A collaboration with Na-tional Institute of Standards and Technology (NIST) scientists to certify these glasses as SRMs, including the certification of the quantitative analysis of the minor and trace element content, for future distribution by NIST is ongoing.
☆ This article is published in a special honor issue dedicated to Richard E. Russo to commemorate his 70th. birthday, for his achievements in the fields of laser- material interaction, plasma modeling and evolution, surface analysis with lasers, and for his vision of what is needed and critical in future theoretical, instrumental and methodological development.
Spectrochimica Acta Part B: Atomic Spectroscopy 179 (2021) 106119
2
1. Introduction
The Russo group at Lawrence Berkeley National Laboratory (LBNL) has been one of the most prolific promoters of the fundamental under-standing of laser-material interactions including the development of strategies for quantitative analysis of solid matrices using laser ablation inductively coupled plasma mass spectrometry (LA-ICP-MS) [1–12]. The Günther group at the Swiss Federal Institute of Technology (ETH Zürich) has equally advanced the basic understanding of laser ablation processes within the analytical sciences [13–18] including the application of LA- ICP-MS for quantitative analysis of different matrices. Mank and Mason [19] conducted an assessment of ablation depth versus analytical spot size that contributed to a better understanding of this important parameter during the ablation process followed by other fundamental studies by other researchers [20–22]. A European-led effort to develop a standard method for the forensic analysis of soda-lime glass made by the float process for forensic comparisons included many of the lessons learned from the fundamental work described above, including: the importance of the correct choice of the laser fluence, the use of Helium as a carrier gas instead of Argon, the use of short wavelength lasers and short (ns-fs) pulses, the importance of particle size distributions on the transport to and vaporization and ionization within the inductively coupled plasma (ICP), the preference of drilling a single spot rather than a line raster to avoid large particle sizes, the need of limiting the depth as related to the spot diameter, and finally, the importance of using matrix- matched calibration standards that are similar to typical soda-lime glass both in composition (assuming a ~ 72% SiO2 matrix concentration) and in optical absorption properties. The Natural Isotopes and Trace Ele-ments in Criminalistics and Environmental Forensics (NITECRIME) network engaged several laboratories in a series of interlaboratory ex-ercises over 5 years and published a standard method based on the optimization of the analytical parameters for LA-ICP-MS of glass [23]. Additional work in the standardization of glass analysis using LA-ICP- MS resulted in corroborating reports and further promoted the utility of this technique in forensic analysis and comparisons of glass [24–29], culminating in the publication of an ASTM test method of analysis [30].
Soda-lime glass is used in the manufacture of vehicle windows, architectural windows, store display cases, containers, and smart-phones, which use a variation in formulation known as “gorilla” glass. The relatively fragile nature of glass lends itself to breaking during vi-olent interactions such as vehicle accidents and therefore becomes po-tential evidence in many different types of crime scenes ranging from hit-and-run accidents to breaking-and-entering events. Trace amounts
of glass fragments can transfer from the broken object(s) to people, and to other objects, or to a location, therefore providing evidence of an activity during the breaking event. It has also been widely reported that glass evidence recovered from crime scenes can provide useful infor-mation to aid an investigation that leads to identifying a suspect and can also provide strong associations between the suspect and a crime event. A standard test method (ASTM E2927-16e1) describes a consensus- based approach to sampling, sample preparation, quantitative analysis by LA-ICP-MS, comparison, and interpretation of the resulting elemental data that is derived from fundamental studies and from several coop-erative studies [23–29]. The quantitative analysis and forensic com-parison method recommended in ASTM E2927-16e1 is based on previously reported work by the NITECRIME network in Europe [23]. A series of four interlaboratory tests conducted by several laboratories resulted in the development of a quantitative analysis method using NIST SRM® 610, NIST SRM® 612, NIST SRM® 1831, NIST SRM® 621 and other glass standards to evaluate the performance of the partici-pating laboratories [23]. The main lessons learned from these studies included the need for the use of matrix-matched standards as well as the need to prescribe both laser parameters and ICP-MS parameters. This effort also resulted in the recommendation for the use of a new series of glasses (BKA-Schott FGS series) containing ~72% SiO2 for monitoring 29Si as an internal standard and containing analyte elements of interest in approximately similar concentrations as float glass samples, for external calibration. The results reported from the NITECRIME effort were reproduced in a different series of interlaboratory studies in the USA [29] and by groups in The Netherlands [25] and in Germany [27].
This method is now considered the “gold standard” for the quanti-tative analysis and comparison of small (as small as ≈ 150 μm length) soda-lime glass fragments that transfer from a glass breaking event to a person, or to a crime scene, or to another object.
Micro-X-ray Fluorescence Spectrometry (μXRF) is another sensitive tool that is commonly used for the comparison of glass in forensic casework. While laser ablation has a constant sampling volume for each element (ablation depth ≈ 80 μm – 150 μm, depending on the laser analysis parameters), the sampling volume for μXRF varies widely and depends on the element’s X-ray energy and the sample matrix. Low atomic number elements (e.g., Na) have effective penetration depths of a few μm in glass, while high atomic number elements (e.g., Zr) have effective penetration depths of a few mm in glass [31]. Thus, for μXRF analysis, some elements have a much smaller sampling volume and some elements have a much larger sampling volume compared to LA- ICP-MS. This is an important consideration since larger sampling
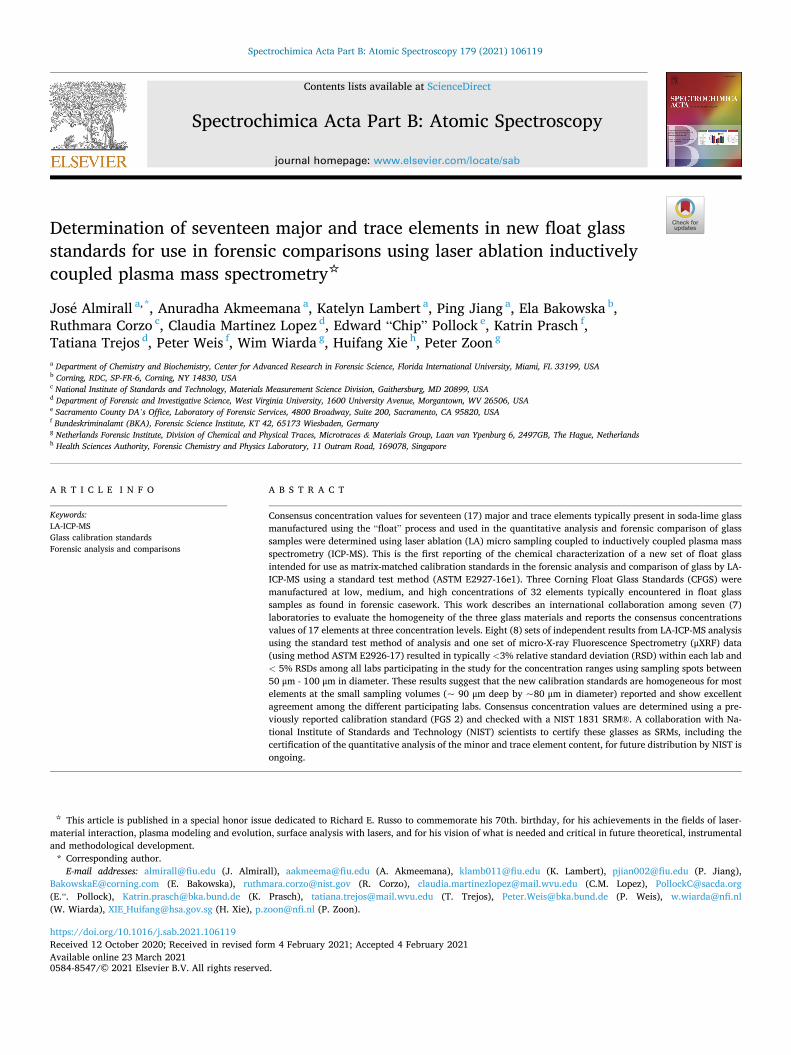
Fig. 1. (Left) Box-and-whisker plot for the log10 concentration (μg⋅g− 1) range for 420 vehicle samples collected and analyzed at FIU. (Right) Box-and-whisker plot for the range of 385 BKA casework samples.
J. Almirall et al.
Spectrochimica Acta Part B: Atomic Spectroscopy 179 (2021) 106119
3
volumes generally result in improved precision. A standard test method (ASTM E2926-17) provides recommendations on the sampling, analysis by μXRF, and comparison of the elemental data using a semi- quantitative approach (element ratios) [32]. Quantitative XRF analysis using the fundamental parameters method or a multivariate calibration approach has been reported for geological materials [33,34]. However, accurate quantitative analysis depends on the sample characteristics (ideally a homogeneous, infinitely thick sample with a flat and prefer-ably polished surface) and on the calibration standards used; although the fundamental parameters method is a standardless approach, improved quantitative results can be achieved by using calibration standards. Because of the challenges in obtaining accurate quantitative μXRF results, μXRF is included in this study solely as an additional means of evaluating the homogeneity of the three CFGS glasses. XRF is reported as a technique used to characterize the homogeneity of NIST SRM® 1830 and 1831 in their respective Certificates of Analysis [40,41]. It should be noted that the three new Corning Float Glass Standards (CFGS) can potentially be useful to improve and validate quantitative results using μXRF.
While soda-lime glass matrix-matched standards have been devel-oped by a joint BKA-Schott effort for calibration purposes [23], these FGS 1 and FGS 2 series of glasses are not certified materials and are available only upon request to the BKA in Germany. The aim of the current effort is to develop similar concentration matrix-matched glass standards to the BKA-Schott FGS series of glasses (FGS 1 and FGS 2) that
are sufficiently homogeneous for use in micro sampling methods such as LA-ICP-MS, and potentially μXRF, and to collaborate with NIST scien-tists to certify these glasses as standard reference materials for future distribution to the wider scientific community.
2. Experimental section
2.1. Production of new glass standards
Three new glasses (CFGS1, CFGS2 and CFGS3) were produced by Corning Research and Development Corporation in 2020 as part of an FIU-Corning joint research activity. In total, 32 selected elements were added as carbonates or oxides to the soda-lime glass matrix and fused/ melted at high temperature using platinum cups at three (3) different target concentrations representing low, medium and high concentration ranges for each of the 32 selected elements. Seventeen elements (shown in Fig. 1 and listed in Table 3) were analyzed for this study and an additional 15 elements (B, Na, Sb, Ni, Cu, Co, Mo, Y, W, Sn, Si, Cr, V, Zn, Ga) were added to the melt but not analyzed for this study. The melt was then refined and homogenized by stirring and re-melted to improve the homogeneity of the melt. Nine different canes (aka rods) with no visible or detectable inclusions were obtained. The target concentrations of the elements in three standards were informed by the expected range in concentrations for soda-lime glass samples expected to be encountered in forensic casework. Fig. 1 illustrates the distribution of two different databases of glass collected from the elemental analysis of vehicle windows at Florida International University (FIU) in the USA (n = 420) and from a much larger variety of glass sources derived from casework submitted to the Bundeskriminalamt (BKA) in Germany (n = 385).
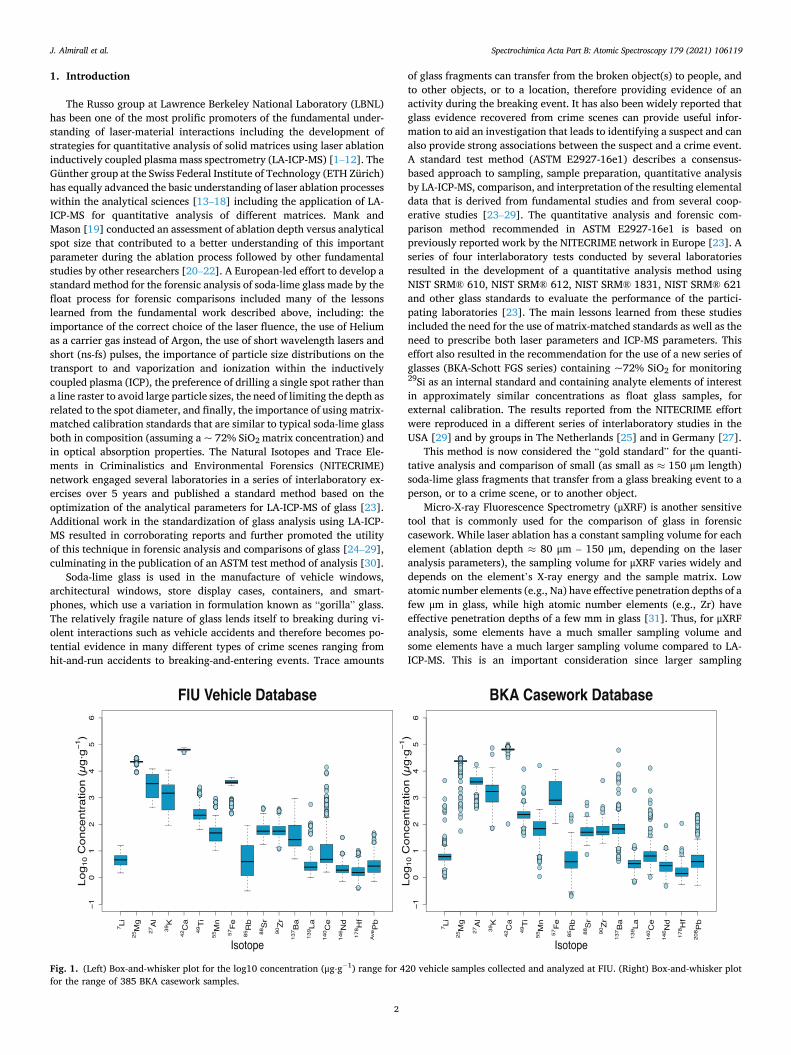
Sub samples from three rods (#1, #5 and #9) for each of the CFGS glasses were collected in triplicate for initial analysis by LA-ICP-MS and by μXRF (Fig. 2 shows the set of CFGS2 and CFGS3 glass sub-samples). The target concentrations of the analytes in CFGS1 and in CFGS2 were designed to closely match the previously used BKA-Schott FGS 1 and FGS 2 series of calibration standards [23] so that any databases created using the FGS 2 as a calibration standard would potentially be compatible with databases created with the new CFGS2 standard. Additional details of the manufacture of the glass are proprietary and not included in this manuscript.
The concentrations of the selected elements in the three new matrix- matched glass standards CFGS1 (low concentration), CFGS2 (medium concentration) and CFGS3 (high concentration) were determined using the ASTM E2927-16e1 test method by 8 independent data acquisitions at 7 different laboratories. The measurement of several isotopes of the target elements (other than Pb) is not important for the forensic analysis and comparison of glass and not recommended.
Fig. 2. Sub-samples from CFGS2 (left) rods #1, #5 and #9 and CFGS3 (right) rods #3, #6 and #11 with each sub-sample measuring 4.5 cm in diameter and 1.0 cm in thickness.
Table 1 Instrumental parameters used for the elemental analysis of glass fragments using LA-ICP-MS and ASTM E2927-16e1.
Lab ID A B C D E F G H
ICPMS instrument Agilent Tech 7900
Agilent Tech. 7700
Agilent Tech. 7700
Thermo iCAP- Q
Thermo iCAP Q Agilent Tech. 7800
Perkin Elmer Nexion 350×
Agilent Tech. 7700
RF power (W) 1540 1550 1350 1450 1500 1550 1600 1550 Ar gas flow (Lmin− 1) 0.75 1.0 0.40 1.0 0.70 0.90 1.0 1.0 LA instrument ESI NWR213 New Wave
Spectrochimica Acta Part B: Atomic Spectroscopy 179 (2021) 106119
5
2.2. Experimental parameters
Table 1 lists the instrumental parameters used for both the LA sam-pling and for the ICP-MS data acquisition in use by all the participating laboratories. The analytical parameters described in ASTM “Standard Test Method for Determination of Trace Elements in Soda-Lime Glass Sam-ples Using Laser Ablation Inductively Coupled Plasma Mass Spectrometry for Forensic Comparisons” [30] were followed closely but some flexibility in adjusting parameters is permitted by the method. A particular manu-facturer of either the LA or the ICP-MS instrumentation is not prescribed, however. Glass samples are recommended to be washed, pre-ablated, or both but do not necessarily need to be embedded in a media prior to ablation. Well-characterized standards such as the NIST SRM® 612 or, preferably, the BKA FGS 2 glass (both with a ~ 72% SiO2 matrix con-centration) are used as a single-point calibration standard. After a ≈ 20 s blank is collected, the signal from the ablation of a single laser spot is collected for sufficient time (≈ 60 s) with the first 20 s of the ablation signal ignored to improve signal stability. The signal acquired from 29Si is used in normalization of all other signals and to account for ablation yield. The area of the transient signal resulting from the ablation for
each isotope analyte is integrated and compared to the area of the same isotopes of the FGS 2 (or similar glass calibration standard) to convert counts per second (cps) to concentration. A suitable reference material (e.g., NIST SRM® 1831 glass) is used as a calibration check to compare the previously determined (consensus) values for the reference material to the measured values. Some important parameters recommended include the use of a matrix-matched standard and the selection of a range of ablation spot size (≈ 50 μm - 100 μm) with a corresponding ablation depth range between ≈ 80 μm - 150 μm deep. Sufficient fluence is used to reach the photochemical regime and a minimum number of replicates for each of the calibration standards, check standards, and glass samples to be compared are prescribed within the method. As stated in the ASTM method, if this method is used for other than soda- lime glass, the concentration of the normalization standard shall be determined prior to quantification.
As stated within the ASTM E2927-16 method, the laser beam is focused at the surface of the sample and a single spot ablation mode is used at the spot size and depth ranges recommended above with a laser ablation repetition rate of 10 Hz. A minimum of three replicates on each sample is measured and, a minimum of three fragments are measured
Table 3 Consensus concentrations in μg⋅g− 1 for the seventeen elements analyzed in the new CFGS series of glass standards (mean ± one standard deviation and relative standard deviation (as % RSD) for n = 369 replicate measurements) with 45–54 replicates analyzed by 8 different analysts at 7 different labs.
One lab conducted 54 replicate measurements and the other 7 labs conducted 44–45 replicate measurements (three separate samples from each of the three rods (Rod #1, #5 and #9) were each measured with 5 replicates). Table 4 lists the consensus concentration values (and related uncertainties) for the 17 elements in the CFGS series of glass standards reporting the laboratory grand mean ± one standard deviation and relative standard deviation (as % RSD) for n = 8 laboratories.
Table 4 Consensus concentrations in μg⋅g− 1 for the seventeen elements in the CFGS series of glass standards (grand mean ± one standard deviation and relative standard deviation (as % RSD) for N = 8 laboratories) with 45–54 replicates analyzed by 8 different analysts at 7 different labs.
Spectrochimica Acta Part B: Atomic Spectroscopy 179 (2021) 106119
6
when enough sample is available such as when a known source is characterized. A minimum of three (3) replicates from three different samples of the known source are collected in order to characterize any heterogeneities within the known source.
Micro XRF analyses were conducted on a Bruker M4 Tornado, equipped with a Rh X-ray tube with an incident angle of ≈ 50◦ and a beryllium window with a 100 μm thickness, poly-capillary optics with a 20 μm spot size, and two Silicon Drift Detectors (SDD), each with a detection area of 60 mm2 and a beryllium window with a 13 μm thickness. The following parameters were used for analysis: 50 kV accelerating voltage, 300 μA filament current (deadtime ≈ 7%), 600 s live acquisition time, and 130 k counts per second (kcps) pulse throughput (resolution ≈ 143 eV FWHM Mn Kα). Prior to analysis, the detector energy calibration was completed using Zr. Additionally, NIST SRM® 1831 was analyzed daily to ensure a limit of detection ≤75 μg⋅g− 1
for Ti and Sr, as recommended in ASTM E2926.
3. Results and discussion
3.1. Consensus concentration values for CFGS1, CFGS2 and CFGS3
Table 2 lists the individual results for each of the participating labs for the analysis of the CFGS2 glass sample, when using FGS 2 as a calibration standard. Table 3 provides the consensus concentration
values (and related uncertainties) for the 17 elements analyzed in CFGS1, CFGS2 and CFGS3 reporting the mean and standard deviations (SD) and relative standard deviations (reported as % RSD) for 8 inde-pendent analyses at 7 different laboratories (n = 369 replicate measurements).
3.2. Homogeneity study
One-way Analysis of Variance (ANOVA) followed by Tukey’s Hon-estly Significant Difference (HSD) was used to determine any significant differences between the rods for the reported concentrations of each of the 17 elements. The reported concentrations from the 8 independent sets of data collected from the participating laboratories were used as input for the ANOVA. Although the overall variance within a lab (Table 2) and between the labs (Tables 3 and 4) are low (typically <5% RSD), suggesting that the three glass rods (1,5 and 9) are very homo-geneous, the more sensitive ANOVA results in significant differences
Fig. 3. Distribution of the 42Ca concentration (μg⋅g− 1) values from all of the measurements (n = 369) reported in the eight sets of data for the CFGS2 glass using FGS2 as a calibration standard.
Table 5 RSD (%) for n μXRF measurements collected on CFGS1, CFGS2, CFGS3, and NIST SRM1831. The RSD is reported for elements above the LOD (SNR > 3). Bracketed values indicate SNR < 10.
Element CFGS1 (n = 81)
CFGS2 (n = 54)
CFGS3 (n = 54)
NIST SRM 1831 (n = 48)
Na 1.14 1.05 1.94 0.71 Mg 1.06 1.00 1.94 0.69 Al 23.71 0.88 1.77 1.06 K 3.96 0.72 0.59 0.88 Ca 0.46 0.70 0.50 0.40 Ti 2.04 1.00 0.63 1.55 Mn 2.25 1.38 0.68 7.07 Fe 1.73 1.34 0.71 0.88 Zn 5.37 3.73 3.01 4.68 Rb 7.18 2.35 1.20 [13.14] Sr 0.84 1.86 0.81 2.28 Zr 1.40 2.29 1.00 3.56 Ba <LOD 4.04 1.74 < LOD Pb <LOD [6.49] 3.90 < LOD
Table 6 NIST SRM 1831 reported* (and consensus data*) compared to mean NIST 1831 values determined using FGS 2 and CFGS2 as calibration standards (n = 15–27).
* Sources of Li, La and Nd reported values are historical data from a single lab over one year period (N = 42 days over a period of a year) [30], Mg, Al, K, Ca, Fe and Ti values are certified by NIST (NIST 1831 SRM Certificate), and the remaining elements (Mn, Rb, Sr, Zr, Ba, Ce, Hf and Pb) are reported in ASTM Test Method E2330 (values obtained by acid digestion ICP-MS during an inter-laboratory study).
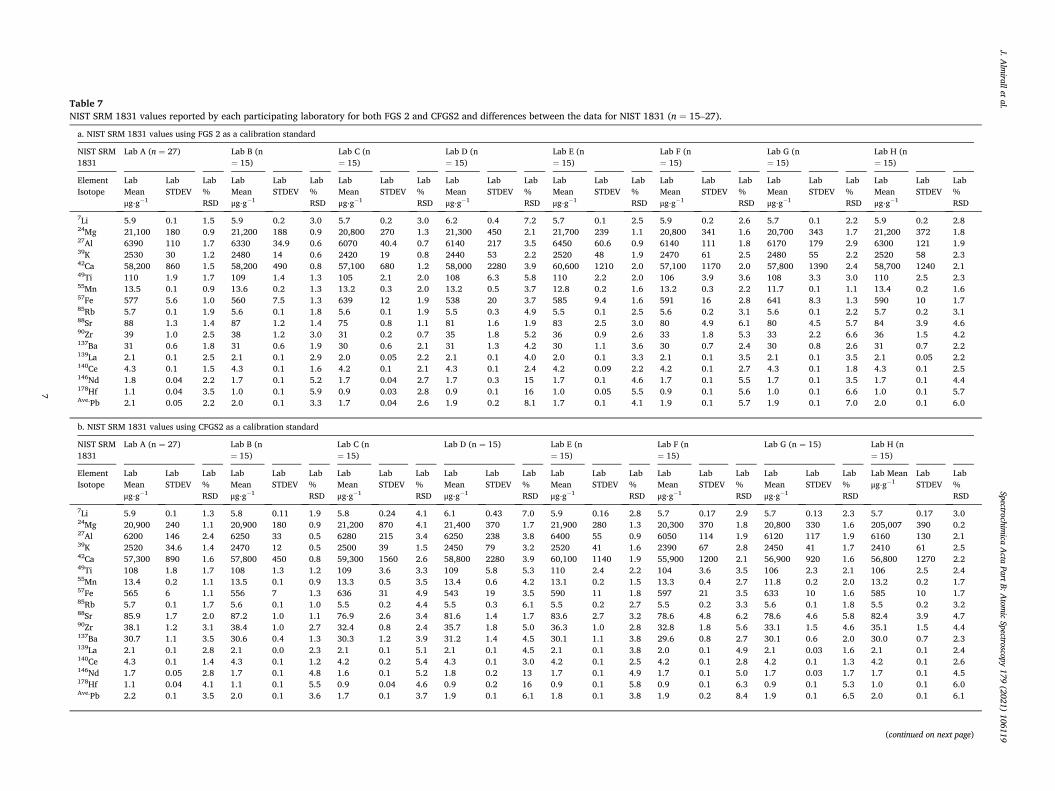
Table 7 NIST SRM 1831 values reported by each participating laboratory for both FGS 2 and CFGS2 and differences between the data for NIST 1831 (n = 15–27).
a. NIST SRM 1831 values using FGS 2 as a calibration standard
Spectrochimica Acta Part B: Atomic Spectroscopy 179 (2021) 106119
8
(95% confidence) between the middle rods and the last rods for CFGS1 and for CFGS3 for some of the elements using the ANOVA followed by Tukey’s HSD. CFGS2 produces very homogeneous results, according to ANOVA followed by Tukey’s HSD with only Ca resulting in a significant difference between the middle rod (#5) and the last rod (#9) and all other analytes in CFGS2 resulting in no significant differences between all three rods. Fig. 3 illustrates the distribution of all of the measure-ments (n = 369) for the Ca values reported in the eight sets of data for CFGS2 when calibrated with FGS2. The CFGS1 and CFGS3 results show more pronounced differences for additional elements but only between the last two rods compared. These results may limit which rods may be selected for grouping as calibration standards for distribution in the future, but analysis of additional data is needed to make this determination.
The homogeneity of CFGS1, CFGS2, and CFGS3 was also evaluated, and compared to NIST SRM® 1831, using μXRF. Elements were considered above the limit of detection (LOD) if the signal-to-noise (SNR) ratio was greater than 3 and above the limit of quantitation (LOQ) if the SNR was greater than 10. SNR calculations were completed following the recommendations given by Ernst et al. in [35]. Nine replicate measurements were collected on each of 9 fragments (3 frag-ments each from rod 1, 5, and 9) for CFGS1 (n = 81), and 6 replicate measurements were collected on each of 9 fragments for CFGS2 and CFGS3 (n = 54). For NIST SRM® 1831, 3 replicate measurements were collected on each of 16 days of analysis, for a total of 48 replicate measurements. Quantitative analysis was accomplished using the Bruker M4 software, which applies the fundamental parameters method but are not reported here because of the challenges in obtaining accurate quantitative results using μXRF. Instead, RSDs are reported to provide a measure of homogeneity within each CFGS glass (and between the rods of the same CFGS glass). Table 5 lists the RSDs for the three CFGS glasses and for NIST SRM® 1831. The RSDs are below 3% for most elements, which are comparable to the benchmark of the well-characterized NIST SRM 1831, indicating excellent homogeneity for the new CFGS glasses. Elements with slightly higher RSDs (5% - 10%) had relatively low SNRs (≈ 25) compared to elements with RSDs below 5% (SNR > 50). Aluminum in CFGS1 was the only element that resulted in a high RSD (>20%). This is partly due to the difficulty of deconvoluting the Al peak from the neighboring large Si peak when the concentration of Al is relatively low (≤ 1500 μg⋅g− 1). At the higher concentrations (> 5000 μg⋅g− 1) present in CFGS2, CFGS3, and NIST SRM 1831, the Al RSD is below 2%.
3.3. Continuity study comparing FGS 2 and CFGS2 as calibration standards
In order to establish elemental analysis databases of glass samples that are comparable over time within the same lab and also to share between labs, the continuity in reporting concentration results is necessary. The NIST SRM® 1831 has been incorporated as a calibration check during every analytical run and is used to establish continuity between the use of FGS 2 and CFGS2 as calibrants for the method [30]. The NIST SRM® 1831 values generated by all the participating labora-tories using FGS 2 and CFGS2 (itself calibrated using FGS 2 glass) were used to determine any differences between the FGS 2-calibrated values and the CFGS2-calibrated values. Table 6 lists the NIST SRM® 1831 previously reported values (when available) compared to lab mean NIST SRM® 1831 values determined using FGS 2 and CFGS2 as calibration standards (n = 6–27). Table 7 lists the NIST SRM 1831 values reported by each participating laboratory for both FGS 2 and CFGS2 and also shows any differences between the FGS 2-calibrated and CFGS2- calibrated data for NIST SRM® 1831. All of the participating labora-tories report relative differences (as reported by %) below 5% and most laboratories report differences below 2% for most analytes.
Tabl
e 7
(con
tinue
d)
c. R
elat
ive
diffe
renc
es (
repo
rted
as
rela
tive
%)
betw
een
the
use
of F
GS
2 an
d CF
GS2
as
calib
ratio
n st
anda
rds
Lab
A (
n =
27)
Lab
B (n
=15
) La
b C
(n =
15)
Lab
D (
n =
15)
Lab
E (n
=15
) La
b F
(n =
15)
Lab
G (
n =
15)
Lab
H (
n =
15)
Elem
ent I
soto
pe
Rela
tive
Diff
eren
ce %
Re
lativ
e D
iffer
ence
%
Rela
tive
Diff
eren
ce %
Re
lativ
e D
iffer
ence
%
Rela
tive
Diff
eren
ce %
Re
lativ
e D
iffer
ence
%
Rela
tive
Diff
eren
ce %
Re
lativ
e D
iffer
ence
%
7 Li
0.1
−0.
9 1.
5 −
1.2
3.2
−1.
8 0.
5 −
3.6
24M
g −
1.0
−1.
3 1.
9 0.
7 0.
9 −
2.3
0.4
−3.
3 27
Al
−3.
0 −
1.4
3.3
1.8
−0.
7 −
1.5
−0.
8 −
2.8
39K
−0.
3 −
0.6
3.2
0.3
0.1
−3.
5 −
0.9
−4.
6 42
Ca
−1.
1 −
0.6
3.8
1.5
−0.
7 −
2.1
−1.
6 −
3.4
49Ti
−
1.7
−0.
9 3.
9 1.
1 −
0.6
−2.
1 −
1.5
−3.
2 55
Mn
−0.
9 −
0.5
1.2
1.2
2.1
0.8
0.1
−1.
1 57
Fe
−2.
1 −
0.8
−0.
6 0.
8 0.
9 1.
0 −
1.2
−0.
9 85
Rb
0.6
0.3
−1.
2 −
0.1
0.6
−2.
3 −
0.6
−3.
3 88
Sr
−2.
6 0.
3 1.
9 1.
3 0.
3 −
1.8
−1.
6 −
2.2
90Zr
−
2.6
−0.
1 3.
3 2.
6 −
0.3
−1.
0 1.
1 −
1.7
137 Ba
0.
3 −
0.2
1.3
0.4
0.6
−1.
4 −
0.9
−2.
8 13
9 La
−1.
8 0.
1 1.
5 2.
5 0.
6 −
0.5
−1.
9 −
1.9
140 Ce
−
0.4
−0.
1 −
0.8
1.0
2.3
−0.
6 −
0.7
−2.
5 14
6 Nd
−2.
2 1.
9 −
2.3
0.8
2.3
−1.
9 −
2.2
−1.
9 17
8 Hf
−2.
2 0.
4 −
1.9
2.5
−1.
5 −
2.2
−2.
6 −
0.6
Ave
. Pb
3.2
−0.
8 −
0.5
1.7
5.4
−2.
3 −
0.2
0.3
J. Almirall et al.
Spectrochimica Acta Part B: Atomic Spectroscopy 179 (2021) 106119
9
4. Conclusion
Good data agreement among the 8 independent sets of measure-ments results from following the prescribed analytical parameters within the ASTM standard test method, regardless of the laser manu-facturer, laser wavelength used, or the ICP-MS instrument manufacturer used in the data acquisition. The consistency in the quantitative analysis of the trace elements in float glass samples (assuming ~72% SiO2 matrix concentration) also allows for the development of LA-ICP-MS databases over time in the same laboratory and potentially for sharing databases between different laboratories. The development of the CFGS glasses may also be suitable to improve and validate the quantitative analysis of glass using μXRF in the future. The development of databases is important because, while the use of the LA-ICP-MS ASTM method results in excellent analytical figures of merit and allows for the comparison between a glass fragment collected at a crime scene and glass collected from a known source for association questions, it is also important to qualify the significance of finding glass with that particular elemental profile within the population of glass in circulation that could serve as a potential source(s), other than the source in question for a particular case. In order to answer this question, databases that include many different sources of glass are needed to determine the “random match probability” (or a reasonable estimate, as best that can be achieved) as evidenced by the frequency of a given glass composition profile that is encountered in a given laboratory. The interpretation of the analytical results of the ASTM method currently involves a binary decision of either finding a difference in all of the elements of the compared items and arriving at the conclusion that “...the questioned fragment did not originate from the same source of broken glass,” or not finding a dif-ference in their elemental profile, resulting in a conclusion that the “possibility that the fragments originated from the same source of glass may not be eliminated”. Recent studies [36–39] describe an alternative approach to the interpretation of glass comparisons by calculating a source likelihood ratio (LR) for the multivariate comparisons of the el-ements in glass, providing an expanded range of “significance” state-ments over the binary decision of “exclude” or “fail to exclude” and now allowing for a numerical assessment of the strength of the evidence comparison. This provides a numerical LR value for the multi-element comparison that results in low LRs (equivalent to exclusion) or high LRs (equivalent to high confidence of an association) and values in be-tween these upper and lower bounds. In addition, studies show that “ambiguous” LR values (values not supporting either proposition) are explained by small but noticeable systematic deviations in the data acquisition over time, heterogeneity of the glass samples in question, or chemical relatedness between samples from different sources (e.g., the glass samples originated from different glass objects, but the glass was manufactured in the same plant within a relatively small time span) [38,39]. Relevant glass databases containing background information related to the elemental composition of glass are needed for these LR calculations and matrix-matched calibration standards that are certified and widely available are, in turn, needed to create the databases. The LA-ICP-MS and μXRF results for the CFGS series of glasses suggest that these new glasses are sufficiently homogeneous for micro sampling. In addition, the reported consensus values for the CFGS2 glass, the most similar in concentration ranges to soda-lime glass made by the float process expected to be submitted to the forensic laboratory, may be used as a calibration standard to replace or complement the FGS 2 calibration standard currently in wide use. Finally, in addition to the 17 elements reported here, another 15 elements (B, Na, Sb, Ni, Cu, Co, Mo, Y, W, Sn, Si, Cr, V, Zn, Ga) were included in the formulations of the CFGS series at different concentration levels for each of the CFGS glasses. These addi-tional 15 elements were not measured for this study but may be used in calibration strategies in the future.
Declaration of Competing Interest
The other co-authors hereby declare no conflict of interest with this manuscript.
Acknowledgements
This research was supported by Award No. 2018-DU-BX-0194 from the National Institute of Justice, Office of Justice Programs, U.S. Department of Justice to Florida International University. The opinions, findings, and conclusions or recommendations expressed in this manu-script are those of the authors and do not necessarily reflect those of the National Institute of Justice or the U.S. Department of Justice. Certain commercial equipment, instruments, or materials are identified in this manuscript in order to specify the experimental procedures adequately. Such identification is not intended to imply recommendation or endorsement by any of the authors and their respective organizations, nor is it intended to imply that the materials or equipment identified are necessarily the best available for the purpose. Ms. Oriana Ovide assisted CLM at WVU in collecting data.
References
[1] O.V. Borisov, X.L. Mao, R.E. Russo, Effects of crater development on fractionation and signal intensity during laser ablation inductively coupled plasma mass spectrometry, Spectrochim. Acta B 55 (11) (2010) 1693–1704, https://doi.org/ 10.1016/S0584-8547(00)00272-X.
[2] O. Borisov, C. Bannochie, R. Russo, Laser ablation inductively coupled plasma mass spectrometry of pressed pellet surrogates for Pu materials disposition, Appl. Spectrosc. 55 (2001) 1304–1311.
[3] J.H. Yoo, O.V. Borisov, X. Mao, R.E. Russo, Existence of phase explosion during laser ablation and its effects on inductively coupled plasma-mass spectroscopy, Anal. Chem. 73 (2001) 2288–2293.
[4] F. Poitrasson, X. Mao, S.S. Mao, R. Freydier, R.E. Russo, Comparison of ultraviolet femtosecond and nanosecond laser ablation inductively coupled plasma mass spectrometry analysis in glass, monazite, and zircon, Anal. Chem. 75 (2003) 6184–6190.
[5] H. Liu, O.V. Borisov, X. Mao, S. Shuttleworth, R.E. Russo, Pb/U fractionation during Nd:YAG 213 nm and 266 nm laser ablation sampling with inductively coupled plasma mass spectrometry, Appl. Spectrosc. 54 (2000) 1435–1442.
[6] H. Liu, X. Mao, R.E. Russo, Representative sampling using single-pulse laser ablation with inductively coupled plasma mass spectrometry, J. Anal. At. Spectrom. 16 (2001) 1115–1120.
[8] J. Gonzalez, X.L. Mao, J. Roy, S.S. Mao, R.E. Russo, Comparison of 193, 213 and 266 nm laser ablation ICP-MS, J. Anal. At. Spectrom. 17 (2002) 1108–1113.
[9] Q. Lu, S.S. Mao, X. Mao, R.E. Russo, A thermal model of phase explosion for high- power laser ablation, in: Proceedings of Society of Photo-optical Instrumentation Engineers 4760, SPIE, 2002, pp. S.959–964.
[10] R.E. Russo, X. Mao, S.S. Mao, The physics of laser ablation in microchemical analysis, Anal. Chem. 74 (3) (2002) 71A–77A.
[11] J. Gonzalez, C. Liu, X. Mao, R.E. Russo, UV-femtosecond laser ablation-ICP-MS for analysis of alloy samples, J. Anal. At. Spectrom. 19 (2004) 1165–1168.
[12] C. Liu, X.L. Mao, S.S. Mao, X. Zeng, R. Greif, R.E. Russo, Nanosecond and femtosecond laser ablation of Brass: particulate and ICPMS measurements, Anal. Chem. 76 (2004) 379–383.
[13] I. Horn, D. Günther, The influence of ablation carrier gasses Ar, he and ne on the particle size distribution and transport efficiencies of laser ablation-induced aerosols: implications for LA–ICP–MS, Appl. Surf. Sci. 207 (2003) 144–157.
[14] M. Guillong, D. Günther, Effect of particle size distribution on ICP-induced elemental fractionation in laser ablation-inductively coupled plasma-mass spectrometry, J. Anal. At. Spectrom. 17 (2002) 831–837.
[15] M. Guillong, I. Horn, D. Günther, A comparison of 266 nm, 213 nm and 193 nm produced from a single solid state Nd:YAG laser for laser ablation ICP-MS, J. Anal. At. Spectrom. 18 (2003) 1224–1230.
[16] H.R. Kuhn, M. Guillong, D. Günther, Size-related vaporisation and ionisation of laser-induced glass particles in the inductively coupled plasma, Anal. Bioanal. Chem. 378 (2004) 1069–1074.
[17] H.R. Kuhn, D. Günther, Laser ablation-ICP-MS: particle size dependent elemental composition studies on filter-collected and online measured aerosols from glass, J. Anal. At. Spectrom. 19 (2004) 1158–1164.
[18] P. Weis, H.P. Beck, D. Günther, Characterizing ablation and aerosol generation during elemental fractionation on absorption modified lithium tetraborate glasses using LA-ICP-MS, Anal. Bioanal. Chem. 381 (2005) 212–224.
[19] A.J.G. Mank, P.R.D. Mason, A critical assessment of laser ablation ICP-MS as an analytical tool for depth analysis in silica-based glass samples, J. Anal. At. Spectrom. 14 (1999) 1143–1153.
Spectrochimica Acta Part B: Atomic Spectroscopy 179 (2021) 106119
10
[20] T. Trejos, S. Montero, J.R. Almirall, Analysis and comparison of glass fragments by laser ablation inductively coupled plasma mass spectrometry (LA-ICP-MS) and ICP- MS, Anal. Bioanal. Chem. 376 (2003) 1255–1264.
[21] T. Trejos, J.R. Almirall, Sampling strategies for the analysis of glass fragments by LA-ICP-MS: part I. Micro-homogeneity study of glass and its application to the interpretation of forensic evidence, Talanta. 67 (2005) 388–395.
[22] T. Trejos, J.R. Almirall, Sampling strategies for the analysis of glass fragments by LA-ICP-MS: part II: sample size and sample shape considerations, Talanta. 67 (2005) 396–401.
[23] C. Latkoczy, S. Becker, M. Dücking, D. Günther, J.A. Hoogewerff, J.R. Almirall, J. Buscaglia, A. Dobney, R.D. Koons, S. Montero, G.J.Q. van der Peijl, W.R. S. Stoecklein, T. Trejos, J.R. Watling, V.S. Zdanowicz, Development and evaluation of a standard method for the quantitative determination of elements in float glass samples by LA-ICP-MS, J. Forensic Sci. 50 (2005) 1–15.
[24] K. Smith, T. Trejos, R.J. Watling, J. Almirall, A guide for the quantitative elemental analysis of glass using laser ablation inductively coupled plasma mass spectrometry, Spectrosc. 27 (3) (2006) 69.
[25] S. Berends-Montero, W. Wiarda, P. de Joode, G. van der Peijl, Forensic analysis of float glass using laser ablation inductively coupled plasma mass spectrometry (LA- ICP-MS): validation of a method, J. Anal. At. Spectrom. 21 (2006) 1185–1193.
[26] B.E. Naes, S. Umpierrez, S. Ryland, C. Barnett, J.R. Almirall, A comparison of laser ablation inductively coupled plasma mass spectrometry, micro X-ray fluorescence spectroscopy, and laser induced breakdown spectroscopy for the discrimination of automotive glass, Spectrochim. Acta Part B: Spectrosc. 63 (2008) 1145–1150.
[27] P. Weis, M. Dücking, P. Watzke, S. Menges, S. Becker, Establishing a match criterion in forensic comparison analysis of float glass using laser ablation inductively coupled plasma mass spectrometry, J. Anal. At. Spectrom. 26 (2011) 1273–1284.
[28] T. Trejos, R. Koons, P. Weis, S. Becker, T. Berman, C. Dalpe, M. Dücking, J. Buscaglia, T. Eckert-Lumsdon, T. Ernst, C. Hanlon, A. Heydon, K. Mooney, R. Nelson, K. Olsson, E. Schenk, C. Palenik, E.C. Pollock, D. Rudell, S. Ryland, A. Tarifa, M. Valadez, A. van Es, V. Zdanowicz, J. Almirall, Forensic analysis of glass by μ-XRF, SN-ICP-MS, LA-ICP-MS and LA-ICP-OES: evaluation of the performance of different criteria for comparing elemental composition, J. Anal. At. Spectrom. 28 (2013) 1270–1282.
[29] T. Trejos, R. Koons, S. Becker, T. Berman, J. Buscaglia, M. Dücking, T. Eckert- Lumsdon, T. Ernst, C. Hanlon, A. Heydon, K. Mooney, R. Nelson, K. Olsson, C. Palenik, E. Pollock, D. Rudell, S. Ryland, A. Tarifa, M. Valadez, P. Weis, J. R. Almirall, Cross-validation and evaluation of the performance of methods for the
elemental analysis of forensic glass by μ-XRF, ICP-MS, and LA-ICP-MS, Anal. Bioanal. Chem. 405 (2013) 5393–5409.
[30] E2927-16e1 In Standard Test Method for the Determination of Trace Elements in Soda-Lime Glass Samples Using Laser Ablation Inductively Coupled Plasma Mass Spectrometry for Forensic Comparisons, ASTM International, 2016.
[31] M. Haschke, Laboratory Micro-X-Ray Fluorescence Spectroscopy: Instrumentation and Applications, Springer, New York, 2014.
[32] E2926-17 In Standard Test Method for the Forensic Comparison of Glass Using Micro X-ray Fluorescence (μXRF) Spectrometry, ASTM International, 2017.
[33] S. Akbulut, Validation of classical quantitative fundamental parameters method using multivariate calibration procedures for trace element analysis in ED-XRF, J. Anal. At. Spectrom. 28 (2014) 853–860.
[34] R. Rosseau, How to apply the fundamental parameters method to the quantitative X-ray fluorescence analysis of geological materials, J. Geosci. Geomat. 1 (2013) 1–7.
[35] T. Ernst, T. Berman, J. Buscaglia, T. Eckert-Lumsdon, C. Hanlon, K. Olsson, C. Palenik, S. Ryland, T. Trejos, M. Valdez, J. Almirall, Signal-to-noise ratios in forensic glass analysis by micro X-ray fluorescence spectrometry, XRay Spectrom. 43 (2014) 13–21.
[36] R. Corzo, T. Hoffman, P. Weis, J. Franco-Pedroso, D. Ramos, J.R. Almirall, The use of LA-ICP-MS databases to estimate likelihood ratios for the forensic analysis of glass evidence, Talanta. 186 (15) (2018) 655–661.
[37] T. Hoffman, R. Corzo, P. Weis, E. Pollock, A. v Es, W. Wiarda, A. Stryjnike, H. Dorne, A. Heydon, E. Hoise, S. Le Franc, X. Huifang, B. Pena, T. Scholz, J. Gonzalez, J.R. Almirall, An Interlaboratory evaluation of LA-ICP-MS analysis of glass and the use of a database for the interpretation of glass evidence, J. For. Chem. 11 (2018) 65–76.
[38] A. Akmeemana, P. Weis, R. Corzo, D. Ramos, P. Zoon, T. Trejos, T. Ernst, E. Pollock, E. Bakowska, C. Neumann, J.R. Almirall, Interpretation of chemical data from glass analysis for forensic purposes, J. Chemom. 35 (2020), e3267.
[39] A. Gupta, R. Corzo, A. Akmeemana, K. Lambert, K. Jimenez, J.M. Curran, J. R. Almirall, Dimensionality reduction of multielement glass evidence to calculate likelihood ratios, J. Chemom. 35 (2021), https://doi.org/10.1002/cem.3298.
[40] SRM, Soda-Lime Float Glass, National Institute of Standards and Technology OR National Bureau of Standards; U.S. Department of Commerce, Gaithersburg, MD, 1830 (12 July 2017).
[41] SRM, Soda-Lime Sheet Glass, National Institute of Standards and Technology OR National Bureau of standards; U.S. Department of Commerce, Gaithersburg, MD, 1831 (12 July 2017).