DETERMINATION OF SOLUTE DESCRIPTORS FOR ILLICIT DRUGS USING GAS CHROMATOGRAPHIC RETENTION DATA AND ABRAHAM SOLVATION MODEL Yannick K. Mitheo, B.S Thesis Prepared for the Degree of MASTER OF SCIENCE UNIVERSITY OF NORTH TEXAS August 2015 Committee members: Teresa D. Golden, Major professor William E. Acree, Jr., Committee Member and Chair of the Department of Chemistry Sushama A. Dandekar, Committee member Mark Wardell, Dean of The Robert B. Toulouse School of graduate studies
Transcript
DETERMINATION OF SOLUTE DESCRIPTORS FOR ILLICIT DRUGS USING GAS
CHROMATOGRAPHIC RETENTION DATA AND ABRAHAM SOLVATION MODEL
Yannick K. Mitheo, B.S
Thesis Prepared for the Degree of
MASTER OF SCIENCE
UNIVERSITY OF NORTH TEXAS
August 2015
Committee members: Teresa D. Golden, Major professor
William E. Acree, Jr., Committee Member and Chair of the Department of Chemistry Sushama A. Dandekar, Committee member
Mark Wardell, Dean of The Robert B. Toulouse School of graduate studies
Mitheo, Yannick K. Determination of solute descriptors for illicit drugs using gas
chromatographic retention data and Abraham solvation model. Master of Science (Analytical
(S=2.224, A= 0.000, B= 2.136) and ketamine (S= 1.005, A= 0.000, B= 1.126). The solute
property of Abraham solvation model is represented as a logarithm of retention time, thus the
logarithm of experimental and calculated retention times is compared.
ii
Copyright 2015
by
Yannick K. Mitheo
iii
ACKNOWLEDGEMENTS
I am very thankful and glad to have Dr. Teresa D. Golden as my mentor and advisor.
There are no better or proper words to express my deep, sincere gratitude and respect for my
research advisor than saying thank you. She has encouraged, supported and provided me with
every need possible in order to do my research. I am happy and humble for the opportunity she
offered me to work with her and the rest of the group to pursuit my future and become a better
learner. My sincere thank goes also to my committee members, Dr. William Acree and Dr.
Shushama Dandekar. Dr. Acree did provide some of the sample used for my thesis; with his
expertise, I was able to understand the chemistry behind this project.
I would like to thank Syeda Sabrina for training me on how to use the gas chromatograph
and Michel Stovall for her encouragement on how to be an independent person. I would like to
thank Dr. Golden research group members, Michael Kahl, Dylan Harbour, Casey Thurber, Ryan
Daugherty, Dr. Jeerapang Tientong, Dr. Heidi Conrad, Viviane Huynh, Teresa Allen, Stephen
Sanders, Ting Zhou, and Johnathan Bishop for the great time we spent together and for their
support. I appreciate the support and help from Benjamin Starr, Dylan Harbour and Timothy
Stephens who helped me throughout the whole process. I also wanted to thank the department of
chemistry at the University of North Texas for their financial assistance that motivated me to
work hard.
I want to take this opportunity to thank my family, my parents, my cousins, nieces,
nephews, uncles and closest friends for their encouragements, support, love and prayers through
the ups and downs. I want to thank my wife Dr. Chantal Tshikaya and her family for their
support, motivation and love.
iv
TABLE OF CONTENTS
Page
ACKNOWLEDGEMENTS ........................................................................................................... iii LIST OF TABLES ......................................................................................................................... vi LIST OF FIGURES ..................................................................................................................... viii CHAPTER 1 DESCRIBING ABRAHAM SOLVATION PARAMETER MODEL AND GAS CHROMATOGRAPHY ................................................................................................................. 1
1.2.3 A: Solute’s Hydrogen Bond Acidity and B: Solute Hydrogen Bond Basicity ................................................................................................................... 6
2.5 Training Sets ......................................................................................................... 35 CHAPTER 3 RESULT AND DISCUSSION ............................................................................... 36
3.1 Result from Each Column Used ........................................................................... 36
Table 1.5. Summary of common gas chromatography detector ................................................... 18
Table 2.1. Summary of all 6 columns stationary phase used in this experiment. ......................... 22
Table 2.2. Summary of method development ............................................................................... 23
Table 2.3 .Structure of Compounds and their boiling point ......................................................... 23
Table 2.4. Chemical and physical properties of drugs to be studied ............................................ 32
Table 3.1. Retention time (min) for column ZB Wax plus max temperature 250 °C (polyethylene glycol) column .............................................................................................................................. 36
Table 3.2. Retention time (min) for ZB –35 (35% Phenyl 65% dimethyl polysiloxane) columns....................................................................................................................................................... 38
Table 3.3. Retention time for TR 1 MS (100% dimethyl polysiloxane) column.......................... 41
Table 3.4. Retention time for TR 5(5 % phenyl methyl polysiloxane) column ............................ 43
Table 3.5. Retention time for TG 5- MS (5% diphenyl 95% dimethyl polysiloxane) column ..... 45
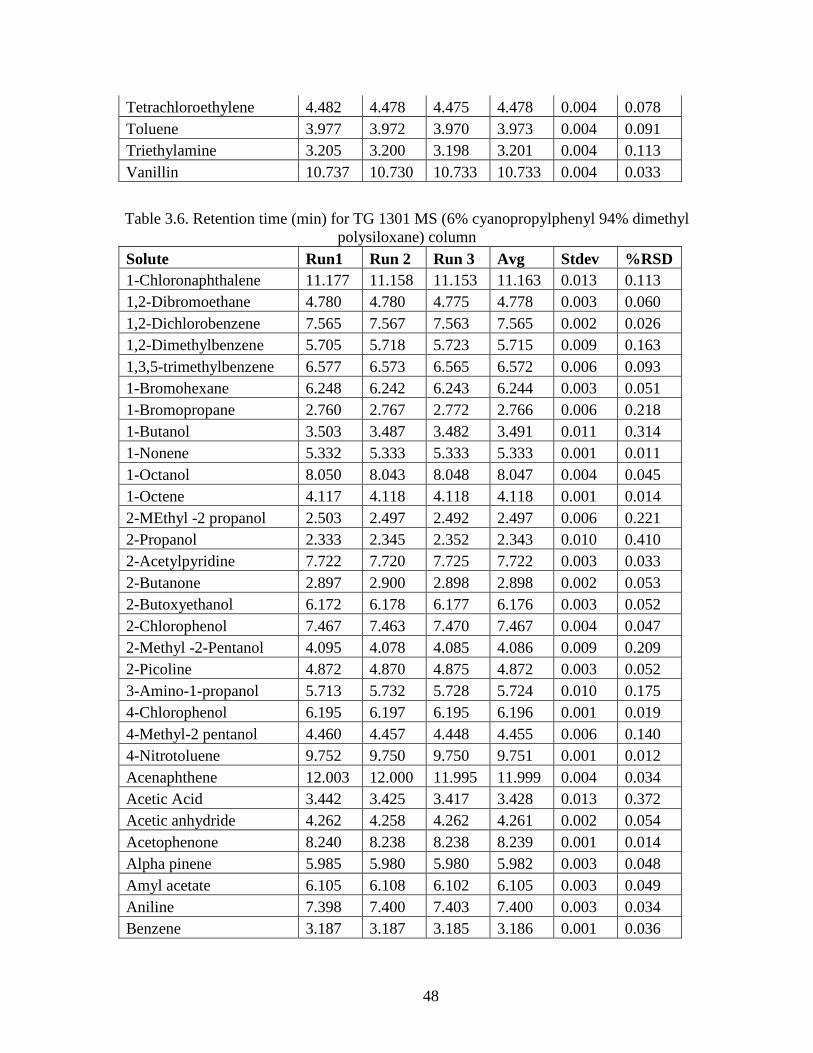
Table 3.6. Retention time (min) for TG 1301 MS (6% cyanopropylphenyl 94% dimethyl polysiloxane) column .................................................................................................................... 48
Table 3.7. Experimental gas-to-liquid partition coefficient data (E, S, A, B, and L) from the literature [50, 52-53]. .................................................................................................................... 50
Table 3.8. Experimental LogtR and LogtR calculated for column ZB wax plus ........................... 55
Table 3.9. Experimental LogtR and LogtR calculated for column ZB 35 ..................................... 56
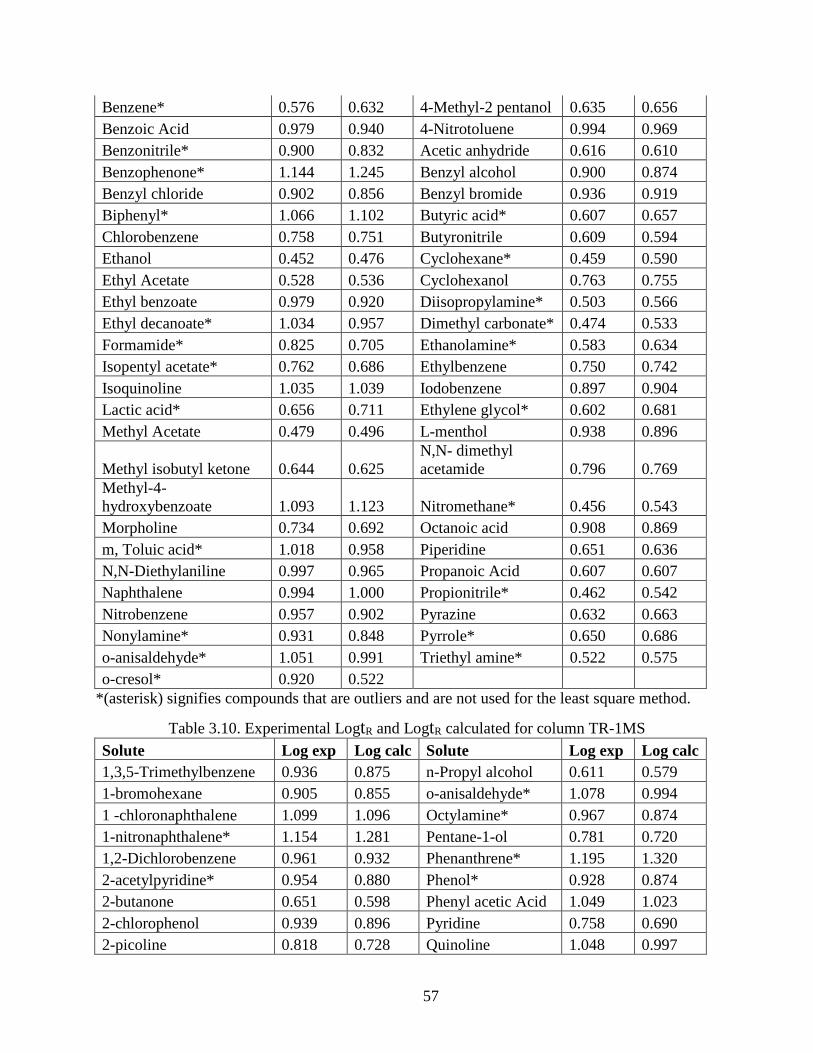
Table 3.10. Experimental LogtR and LogtR calculated for column TR-1MS ............................... 57
Table 3.11. Experimental LogtR and LogtR calculated for column TR-5 ..................................... 59
Table 3.12. Experimental LogtR and LogtR calculated for column TG-5MS ............................... 60
vii
Table 3.13. Experimental LogtR and LogtR calculated for column TG-1301MS ......................... 61
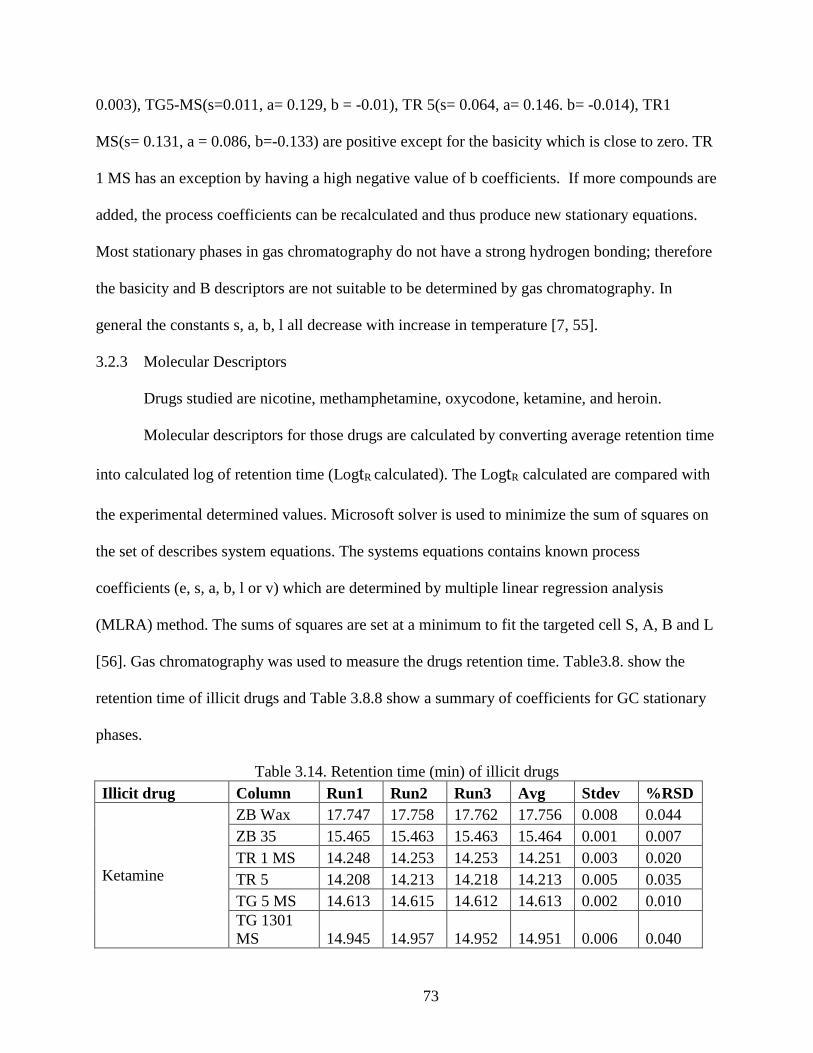
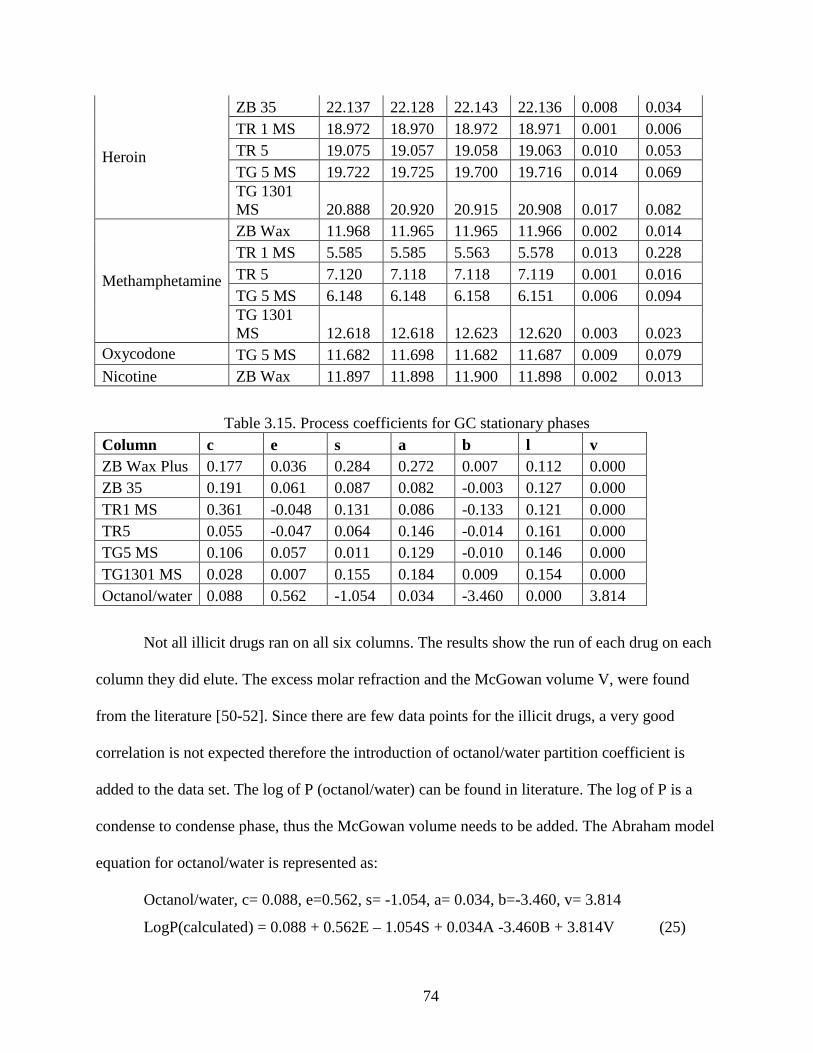
Table 3.14. Retention time (min) of illicit drugs .......................................................................... 73
Table 3.15. Process coefficients for GC stationary phases ........................................................... 74
Table 3.16. Observed and calculated retention data for nicotine .................................................. 75
Table 3.17. Predicted solute descriptors for nicotine .................................................................... 75
Table 3.18. Observed and calculated retention data for oxycodone ............................................. 76
Table 3.19. Predicted solute descriptors for oxycodone ............................................................... 76
Table 3.20. Observed and calculated retention data for methamphetamine ................................. 77
Table 3.21. Predicted solute descriptors for methamphetamine ................................................... 77
Table 3.22. Observed and calculated retention data for heroin .................................................... 79
Table 3.23. Predicted solute descriptors for heroin ...................................................................... 79
Table 3.24. Observed and calculated retention data for ketamine ................................................ 80
Table 3.25. Predicted solute descriptors for Ketamine ................................................................. 81
Table 3.26Summary of predicted solute descriptors for nicotine, oxycodone, methamphetamine, heroin and ketamine ...................................................................................................................... 81
Figure 1.2. Schematic diagram of the components of a typical gas chromatograph. Adapted from http://en.wikipedia.org/wiki/gas_chromatography ....................................................................... 11
Figure 1.3. Picture of GC column oven and column from our la.b .............................................. 13
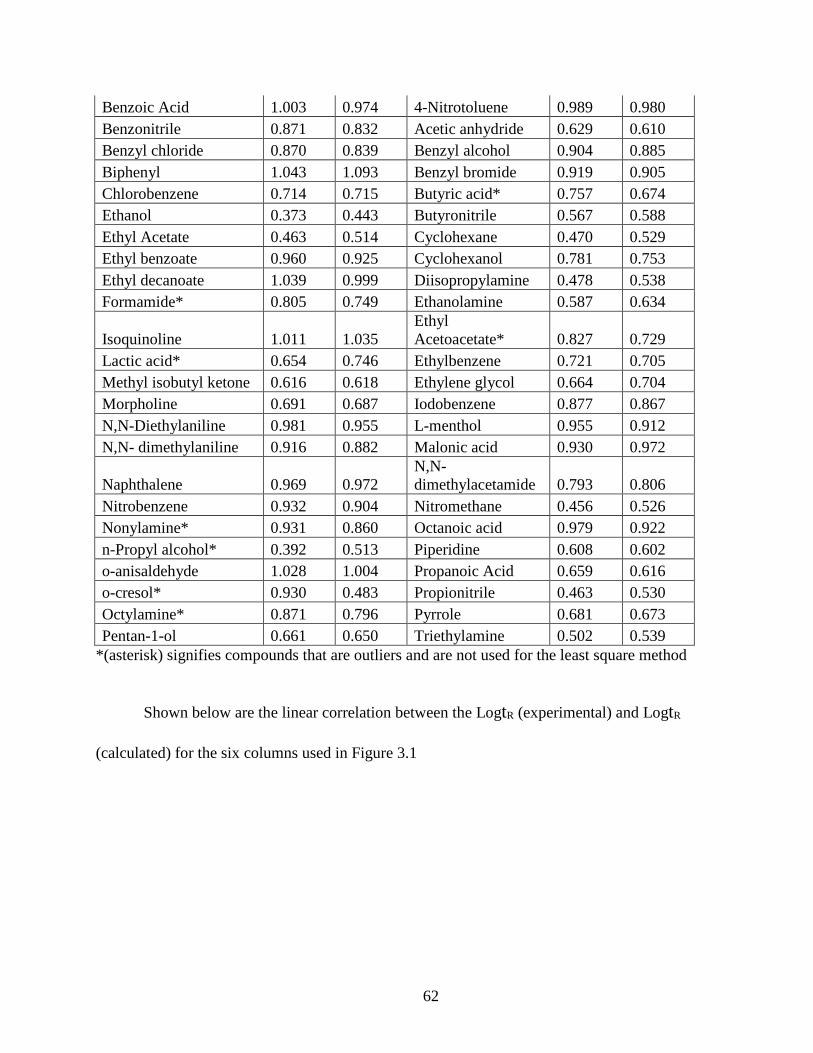
Figure 3.1. Correlation of LogtR (calculated) and LogtR (experimentally) observed for the six columns. ........................................................................................................................................ 65
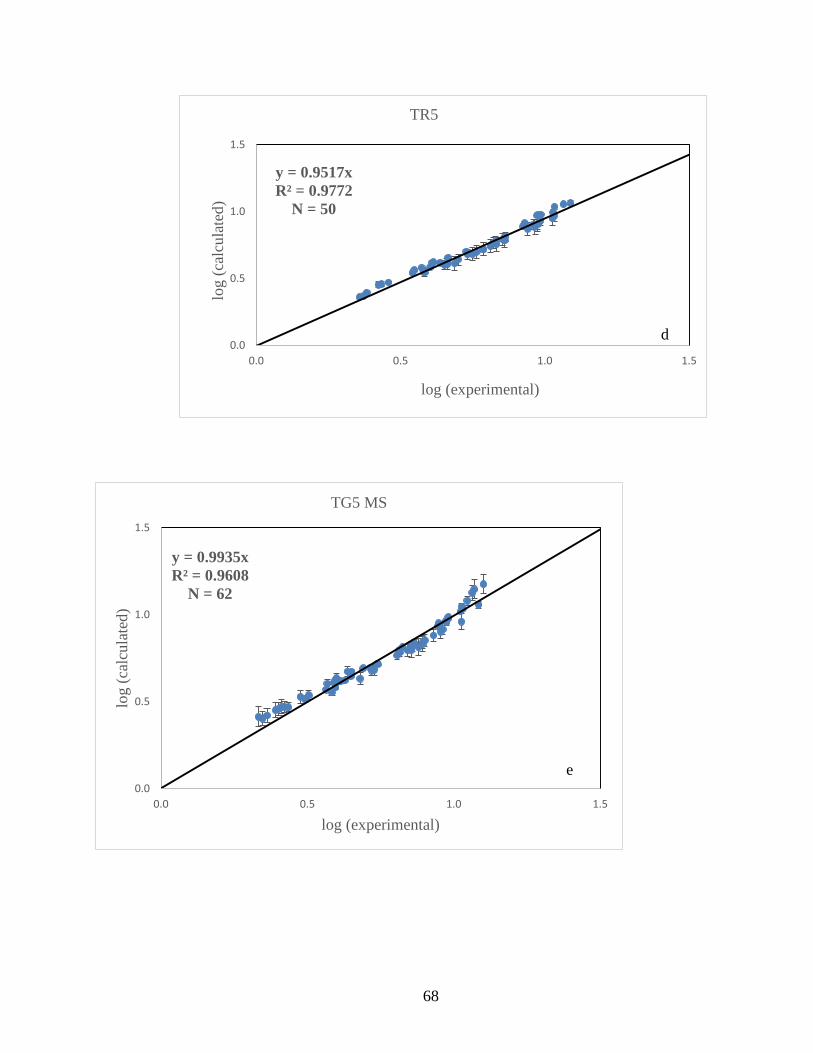
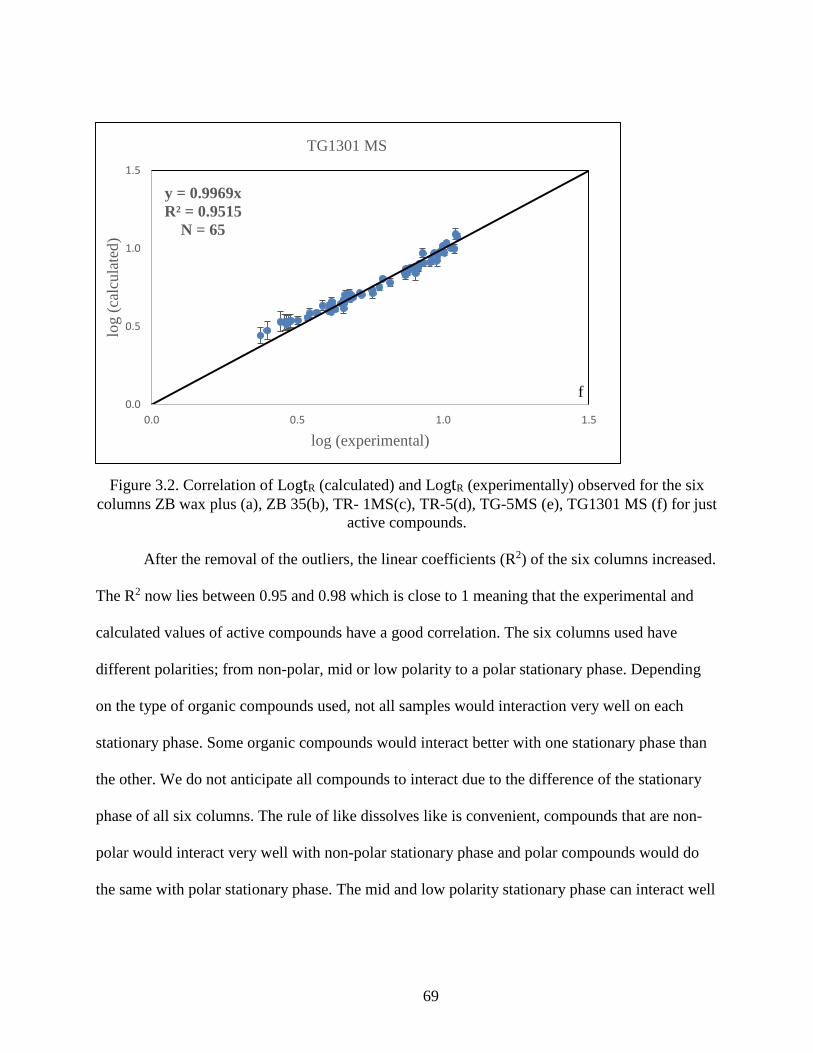
Figure 3.2. Correlation of LogtR (calculated) and LogtR (experimentally) observed for the six columns ZB wax plus (a), ZB 35(b), TR- 1MS(c), TR-5(d), TG-5MS (e), TG1301 MS (f) for just active compounds.......................................................................................................................... 69
Figure 3.3. Structure of nicotine ................................................................................................... 76
Figure 3.4. Structure of oxycodone............................................................................................... 77
Figure 3.5. Structure of methamphetamine................................................................................... 79
Figure 3.6. Structure of heroin (left) and morphine(right) ............................................................ 80
Figure 3.7. Structure of ketamine ................................................................................................. 81
1
CHAPTER 1
DESCRIBING ABRAHAM SOLVATION PARAMETER MODEL AND GAS
CHROMATOGRAPHY
1.1 Introduction
Drug permeability across membranes is predicted by partition coefficients between an
aqueous or a gas phase and lipid phase. To better predict the effect of various functional groups
on partitioning, similar drug like molecules need to be studied.
The Abraham solvation model is used to predict the adsorption, distribution, metabolism,
elimination and toxicity (ADMET) properties of the drug molecules. It is a good approach for
studying and predicting biological activities and partition co-efficient. The introduction of early
ADME is important because it decreased the proportion of compounds failing in clinical trials.
The main goal of preclinical ADME is to remove weak drug candidates in the early stages of
drug development and allow the resources to be used on potential drug candidates.
Drug candidate’s ADMET (Adsorption, distribution, metabolism, elimination and
toxicity) properties of drugs discovery can be predicted computationally or experimentally. Only
20% of developed drug candidates proceed to clinical trial stage testing, and among those
compounds that enter clinical development less than 10% receive government approval. Drugs
failures occur because of poor bioavailability, poor solubility, toxicity concerns, drug-drug
interactions, degradation and poor shelf –life stability, and unfavorable pharmacokinetic
properties [1-3].
In general, most newly discovered drugs have higher molecular weights and have more
complicated molecular structures than previously discovered drugs; this explain the reasons why
most drug candidates fail in the early development stage. Drug permeability across membranes is
2
predicted by partition coefficients between an aqueous or a gas phase and lipid phase [4]. To
better predict the effect of various functional groups on partitioning, similar drug like molecules
need to be studied. Gas chromatography method is ideal for studying a large set of compounds.
Gas chromatography is one of the techniques to consider for studying the distribution of
drug compounds between different organic phases. The retention times obtained from the GC are
used to model biological activities that involve the transfer of a drug molecule from gas phase to
the biological phase. From the retention time; the solute descriptor are calculated, then the
solutes descriptors are correlated to the biological routes [5].
In order for drug to penetrate the central nervous system (CNS); it must cross through
blood brain barrier (BBB). The Abraham solvation model is used to predict the ADMET
properties of the drug molecules.
The Abraham solvation model is two linear free energy relationships (LFER) where one
equation described transfer process of the drug between two condenses phases.
SP = c+eE +sS +aA+ bB+vV
(1)
and the second describe gas to condense phase transfer
SP = c+eE +sS+ aA +bB +lL (2)
The solute property (SP) is the dependent variable. The SP represents the properties of a
series of analytes in a fixed phase. The independent known solutes descriptors (E, S, A, B, L, V)
are solute properties, they reflect the ability of the solute-solvent interaction. The process
coefficients or regression coefficients c, e, s, a, b, l, v describe the solvation properties which can
be obtained through multiple linear regression analysis (MLRA) [6]. ). c is a regression constant,
a and b are measure of solvent’s base properties and acid properties; e is the measure of solvent
dispersion interaction; s is the ability of the solvent phase to go through dipole –dipole induce
interaction with solute; l and v measure of size needed to form solvent cavity and dispersion
3
forces for a gas. The E is the excess molar refraction [( cm3mol-1/10]; S is solute
dipolarity/polarizability. The A and B are the effective hydrogen bond acidity and hydrogen
bond basicity, The V is the McGowan characteristic volume [(cm3mol-1)/100]. V can always be
calculated from the solute molecular formula, or known atomic size and number of chemical
bonds in the molecule. L is the logarithm of the solute gas phase dimensionless Ostwald partition
coefficient into hexadecane at 298 K. The V and L descriptors both measure size and are viewed
as measure of the solvent cavity term that will accommodate the dissolved solute.
There are more than 4000 organic, organometallic and inorganic solute descriptors
available or published. A large list of solute descriptors is available in one of the published
review articles [7], and in several other published papers [8-9]. Solute descriptors can be
obtained through regression analysis using different types of experimental data, gas to-solvent
partitions, solubility data and chromatographic retention data. The A, B and S descriptors need to
be determined experimentally. Once the retention time of any solute is obtained, it can be used to
calculate the natural log of retention time to solve equations (1) or (2). The process coefficients
can then be determined through multiple linear regression analysis of experimental logarithm of
retention time depending on the column used [10-12].
The use of molecular descriptors in the Abraham solvation model become very helpful to
understand which barriers the drug can cross and also the descriptors provide some information
about the molecule’s acidity, basicity and polarity. The Abraham solvation model can be applied
to both chemical and biological process (e.g. blood brain partition [13], human and rat intestinal
absorption [14], solubility [15-16]). The Abraham solvation model gives us some indication of
the solute properties in terms of the molecular solute descriptors. The literature search shows that
either the gas chromatography or high pressure liquid chromatography can be used for separation
4
of compounds depending on the goal of the project. For partitioning of a solute between two
condense phases, a high pressure liquid gas chromatography is preferred while for partitioning of
a solute from a gas to a condensed phase gas chromatography is needed. From the retention data,
the gas-liquid partition coefficient and other thermodynamic properties of mixing can be easily
created. Using the thermodynamic properties and appropriate models allows understanding of the
intermolecular interactions responsible for the solvation in the stationary phase [17-19]. Now, the
solvation parameter model makes a valuable tool for obtaining quantitative structure- property
relationship for biomedical, chemical and environmental processes. The model correlates a free
energy related property of a system to a six free energy descriptors describing the molecular
properties. The main goal is to create a suitable quantitative structure property relationship
(QSPR) to enable the prediction of further system properties for compounds lacking
experimental values. In QSPR studied, two approaches are used; the first is based on theoretical
descriptors. All needed parameters for prediction can be calculated simply from the three
dimensional representation of the molecular structure of each of the solutes of the mixtures, as
well as mixtures of chemically diverse compounds [20-21]. The disadvantage of the approach is
that the particular descriptors may be challenging to understand and the model may lack
chemical meaning. The second approach on review papers is based on descriptors determined
using the experimental technique such as gas chromatography. Abraham and co- workers have
published several papers and reviews showing the correlation of different models system for the
prediction of solute descriptors and the interpretation of data using chromatography technique for
separation of mixture[ 22-25]. Taft and Kamlet have established in the 1980, the simple concept
of linear solvation energy relationships (LERs). They have shown for several chemical systems
that some property which linearly correlated to a either a free energy of reaction, or a free energy
5
of transfer, or a activation energy can be correlated with several molecular property of the
solvents or solutes involved[26-30]. Chromatographic retention and logarithmic partition
coefficients ( LogKL) are linear free energy parameters, thus one can correlate these data with the
molecular properties of the solutes using the LSER model [31-34]
In the experiment, we are developing an Abraham solvation model correlation equation
that can predict and provide molecular descriptors for illicit drugs. More than one hundred
known compounds have been collected from published literature with known descriptors [35-
38]. Out of the five descriptors in equation (1) and (2), E and L or V descriptors can be found in
the literature for a known target drug compound. To calculate the other three descriptors(S, A,
B), equations (1) and (2) can be assigned the log of retention time (LogtR) with the calculated
process coefficients, thus the unknown descriptors can be predicted. Before obtaining the process
coefficients, the retention time of different compounds are needed from the gas chromatography
experiment. The prediction values of target drug compound can be achieved through multiple
linear regression analysis. The advantage of using the Abraham solvation model resides in the
newly developed column equation. Once retention times of unknown illicit drugs or compounds
are determined, it is a matter of plugging them in the developed stationary equation to get the
molecular descriptors. In order to use the Abraham model to predict the ADMET properties, one
must have a prior knowledge of the desired compound’s solute descriptors.
1.2 Abraham Solvation Parameter Model
1.2.1 E: Excess Molar refractivity
Solute molar refractivity, E, is the difference between the molar refractivity and the
alkane molar refractivity with the same McGowan volume V. E expresses the ability of the
polarizable electrons in the molecule to be involved in the solute-solvent interaction.
6
E = MRx (observed) – MRx (alkane of same Vx) [39]
(3)
Where E unit is in cm3mol-1/10. E can be calculated from the molecular structure of the
compound. The McGowan volume in the molar refraction, MRx can be calculated as
MRx = V*[(η2-1)/ (η2+2)]
(4)
Where V in equation 4 is the McGowan volume (unit is (cm3/mol)/10), and η is the pure
liquid solute refractive index at 25° C.
1.2.2 S: Dipolarity/Polarizability
S is the solute dipolarity or polarizability. It represents the tendency of a solute to
participate in dipole-dipole and induce dipole-dipole interactions. The S represents or reflects the
interactions that involve both induced and stable polarity of a solute. A large mass of data from
gas liquid chromatography (GLC) can determine the polarity.
1.2.3 A: Solute’s Hydrogen Bond Acidity and B: Solute Hydrogen Bond Basicity
A is the solute effective or summation hydrogen-bond acidity. This descriptor was
originally obtained from hydrogen complexation constants for mono –acid. Now, it’s obtained by
chromatographic or partition measurements. B is the effective or summation hydrogen-bond
basicity. For mono-bases, this descriptor was obtained from hydrogen complexation constants,
now poly bases can be found by partition measurements [40]. Both solute hydrogen bond
acidity and basicity descriptors describe the hydrogen donor and acceptor solute ability. The
Hydrogen bond acidity and basicity were developed by Abraham model solvation using the
equilibrium constant for the 1:1 reaction in carbon tetrachloride, CCl4 at 298 K. When carbon
tetrachloride, acid and base are present in a solution at low concentration, both will undergo
8
1.2.4 V: McGowan Volume
The McGowan volume is calculated from the atom and the numbers of bonds in the
solute molecule in partition system with two condense phases. All type of bonds is treated
equally in the solute, whether it is a single bond, double or triple bond. The number of bond can
be solve by this equation
B = N-1+ R (7)
Here B is the total number of bonds, N is the total number of atoms and R is the total
number of ring structures. V is related to the size of the molecule as well as the size of the
solvent cavity. The McGowan volume can be calculated as follow
V = [∑atom contributions – (6.56*B)]/100 (8)
1.2.5 L: Ostwald Solubility
The L is defined as gas-to-hexadecane partition coefficient at 25◦ C. The Ostwald
solubility can be measured experimentally from solute’s retention volume by gas liquid
chromatography. It does include the cavity effect and the London dispersion effect of process.
The process can be follow as
Solute (gas phase) ⇌ solute (hexadecane). (9)
1.2.6 Process Coefficients
The process coefficients shown on equation (1) and equation (2) reflect particular solute
–solvent interactions that correspond to chemical properties of the solvent phase. Process
coefficient e, is the measure of solvent dispersion interactions. It describes how the solvent or
phase interacts with the solute through π and n-electron pairs. We anticipate e to be positive, but
an electronegative atom in phase might change it to negative. s is the ability of the solvent phase
to go through dipole –dipole induce interactions with a solute. When s is positive, the molecule
polarity increase and it will prefer the condense phase. The a process coefficient reflects the
7
acid-base interactions. An illustration of hydrogen-bond complexation reactions is shown in
Figure 1.1[41]
Figure 1.1. Hydrogen-bond complexation reaction. Adapted from ref. 41
H-A is the acidic solute, the reference base solvent is CCl4 and the hydrogen bond
complex created is A-H-Cl-CCl3 . The solute descriptor A is created by applying the following
equation.
A = (LogKAH + 1.1) (5)
4.636 Log KA
H is the average hydrogen bond acidity for solutes in CCl4, 1.1 is the scale factor
that enable the A descriptor to go through the origin and 4.636 is the empirical factor that
maintains the acidity scale within a suitable range.
For the hydrogen bond basicity, the equation is represented by
B = (LogKBH + 1.1) (6)
4.636
LogKBH is the average hydrogen bond basicity for solute in CCl4, 1.1 is the scale factor
that enable the B descriptor to go through the origin and 4.636 is the empirical factor that so that
B= 1.00 for the hydrogen bond base hexamethylphosphortriamide which allows a suitable
working range for the B values. Solute can form more than one hydrogen bond with neighboring
molecules in bulk solvent, making the 1:1 complexation assumption inaccurate for certain
solutes [40].
9
complementary solvent hydrogen bond acidity. The b coefficient will be a measure of the solvent
phase hydrogen bond basicity. The l and v coefficients will include not only an endorgonic
cavity effect, but exergonic solute- solvent effects rising through solute polarizability. The c
coefficient is an independent constant generated by multi regression linear analysis (MLRA).
The c coefficient does contribute to the cavity formation and it is related to the nonpolar
interaction of the retention time [41-43]. This is direct for the gas-to-condensed phase partition
since there is no interaction in the gas phase. Equation (1) refers to difference between the
properties of two phases. Thus the positive values reflect that the solute will favor the condense
phase while the negative values will show a tendency to favor a gas phase. The Abraham
solvation model is a useful model that can predict and illustrate the solute-solvent interaction in a
system. Once the predicting equations are established in the system, one can just insert any new
solute or drug compound values for certain gas-phase to derive the new solute descriptor.
Table 1.1 Summation of the Abraham solvation parameter model. Solute descriptor Process Coefficient c: Linear regression constant E : Excess molar refractivity ( cm3/mol)/100
e: interaction of the solvent or phase with the solute through π and n-electron pairs
S: dipolarity/Polarizability s: ability of the solvent phase to go through dipole-dipole induce interaction with a solute
A: Hydrogen bond acidity a:measure of solvent's base properties B: Hydrogen bond basicity b: measure of solvent's acid properties L:Ostwald solubility l:measure of size needed to form solvent cavity and
dispersion forces for a gas V: McGowan volume(cm3/mol)/10 v: measure of size needed to form solvent cavity and
dispersion forces
10
1.3 Gas Chromatography
1.3.1 Beginning of Gas Chromatography (GC)
The discovery of the actual GC is generally attributed to A.T. James and Archer.J. P
Martin in their 1952 paper. They did report a separation of volatile fatty acids by partition
chromatography with nitrogen gas as a mobile phase and a stationary phase of silicone oil/stearic
acid supported on diatomaceous earth. But the origin of the GC lies in the 1941 publication in
which Martin, with R.L.M Synge, first described liquid phase partition chromatography [59-60].
The term chromatography was used by Mikhail Tswett based on the fact that it separated the
components of solution by color (liquid chromatography). The term Chroma means color,
graphein means writing.
1.3.2 Instrumentation of Gas Chromatography
Gas chromatography is an analytical technique that can be used to separate volatile
organic compounds based on partition or distribution of analyte between two phases in a system.
The two phases are the mobile and stationary phase. The GC contains partitioning between a
solid or liquid stationary phase kept on the column wall or on a solid sorbent and the gaseous
mobile phase. The organic volatile samples are separated due to differences in their partitioning
behavior between the mobile gas phase and the stationary phase in column. Since the partitioning
behavior depends on temperature, the central part of the GC which is the oven contains the
column. The distribution coefficient or partition coefficient measure the tendency of an analyte
to be attracted to the stationary phase
K = Cs/Cm (10)
K is the partition coefficient or distribution coefficient, Cs is the molar concentration of
analyte in the stationary phase, Cm is molar the concentration of analyte in mobile phase. Larger
11
K values lead to larger retention analyte time. K can be controlled by the stationary phase
chemical nature and the column temperature.
1.3.3 Advantage and Disadvantage of Gas Chromatography
The advantage of using gas chromatography is fast analysis, high efficiency which
implies high resolution. Gas chromatography is a non-destructive method, high quantitative
accuracy. GC is good for quantitative analysis of volatile compounds.
The disadvantage of gas chromatography resides in the limitation of sample to be
volatized. It’s not suitable for sample that degraded at high temperature (thermally labile).
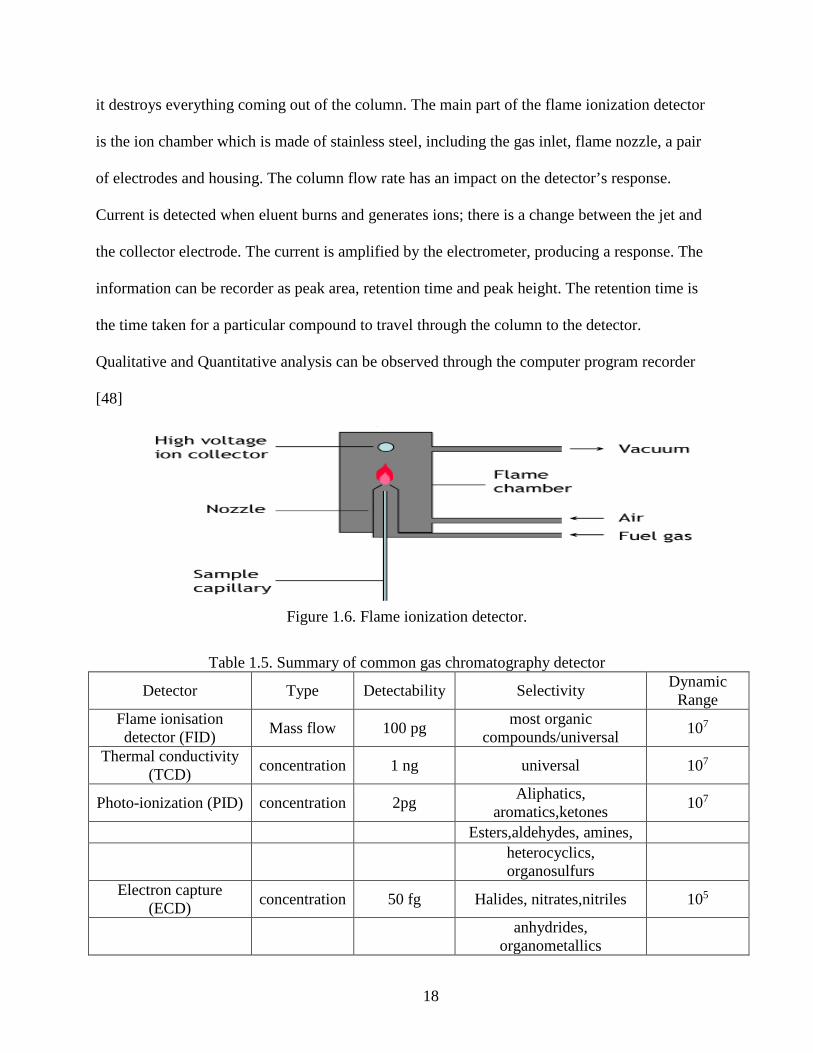
The main components of the gas chromatography are the oven (where the column is and
where separation takes place), the detector, the inlet and other factors need to be considered for
better separation. A schematic representation of the gas chromatography in Figure 1.2a
Figure 1.2. Schematic diagram of the components of a typical gas chromatograph. Adapted from
The resolution of the peak is how well the peak are separated
R = 2(tR2- tR1)/ (W1 + W2) (12)
Where R is the resolution, tR1 and tR2 are the total retention times for component 1 and 2,
W1 and W2 are peak widths for substance 1 and 2 respectively.
There are two types of columns used for the GC, a capillary (mostly used) and the packed
column. Here is a table that distinguished both types of columns.
Table 1.2. GC column packed vs capillary. GC column packed vs capillary Packed columns Capillary columns Usually a glass or stainless steel coil Thin fused-silica filled with a packing coated material 0.5-3 m long typically 1-100m in length 5 mm internal diameter 0.1-1 mm internal diameter 6 mm outside diameter film thickness 0.1-0.5 µm
The factors that affect the column performance are the column diameter, column length,
and the chemical inside the stationary phase [61, 44-45]
Table 1.3. Available recommended stationary phases for different columns. Type of compounds Polarity of compound Preferred stationary phase Alcohols, Ketones, esters, carboxylic acid diols, amine
Polar compounds containing Cl, F, Br, O, P, N, S other than C and H atom
340 °C Pharmaceutical steroids, semi volatile amines
TR 1MS 100% dimethyl polysiloxane
Non polar
360 °C Chlorinated and nitro aromatic compounds
TR 5 5% phenyl methyl
Low polarity
350 °C Alcohols, low pesticides, free fatty acids, aromatic flavors
TG5 MS 5% diphenyl 95% dimethyl polysiloxane
low- polarity
350 °C Semi volatile, phenol, amines
TG 1301MS
6% cyanopropyl phenyl 94% dimethyl polysiloxane
Mid polarity
280 °C Oxygenate residuals, solvent, alcohols, volatile organics
The chemical compounds and the illicit drugs were all dissolved in methanol,
dichloromethane, dimethylsulfoxide (DMSO) or acetonitrile to make solution for injection. Both
liquid and solid concentration is 1 mg/ml. Low boiling point compounds like ethanol, ethyl
acetate, methyl acetate, acetone, and butanone are diluted with dichloromethane or DMSO
because the methanol solvent peak can co-elutes with the peak of interest.
The run starts at initial oven low temperature of 50 degree Celsius, with a hold time of 2
minutes. Then the temperature is raised at the rate of 15◦C per minute with 5 minutes hold time
to the final temperature depending on the maximum temperature of the column inside the oven.
The maximum temperature of the oven on average is 260-330◦C, prep-run timeout is 10.00
minute and equilibrium time is 0.50 minute. The FID detector temperature is 200◦C. The inlet
temperature is 240◦C. The injection volume of sample is 1µl, but can vary depending on the peak
23
area of the sample. The split ration of the analyte can vary too. Methanol is used to wash the
needle for pre and post injection of the sample for three cycles. The needle itself is rinsed with
the sample three times before injection. Each sample was tested three times to reproduce
accurate and precise data. The column is conditioned twice in between each run to make sure
there is no carry over or no interference with the retention time of the desire sample. Below is a
summary of method development.
Table 2.2. Summary of method development Sample concentration 1 mg/ml Injection volume 1.0µl Split ratio 50:1 Split mode Split Column Dimension 30 m x 0.32 mmID x 0.25µm film thickness Carrier flow rate 1.5 ml/min Carrier gas Helium Initial oven temperature 50◦C ( hold for 2 min) Final oven temperature 330◦C ( depending on the column max temp(
hold for 5 min) Injector temperature 240◦C Pre run time 10 min Equilibrium time 0.5 min Ramp 15◦C/min Detector FID Detector temperature 200◦C Solvents Methanol, DCM. DMSO
2.3 Nature of Chemical Compounds
There are several type of compounds selected with a wide range of boiling point and size.
The compounds to be run need to have similar functional group with the drug sample.
Compounds need to be volatile in order to be run in the gas chromatograph.
Below is the list of more than one hundred compounds run in Table 2.2
Table 2.3 .Structure of Compounds and their boiling point
Solute Structure Boiling point(◦C)
24
1- Bromopropane CH3
Br
71
1,2- Dibromoethane Br
Br
131
1,2-Dichlorobenzene
180
1,2-Dimethylbenzene
144
1-Bromohexane
CH3 Br 158
1-Butanol CH3 OH
117.4
1-Chloronaphthalene
263
1-Nitronaphthalene
304
1-Nonene CH2
CH3
146
1-Octanol OH CH3
195
1-Octene CH2
CH3
121
2 Propanol CH3 CH3
OH
82
2-Acetylpyridine
189
2-Butanone
79.6
25
2-Butoxyethanol CH3 O
OH
171
2-Chlorobenzoic acid
285
2-Chlorophenol
175
2-Methyl -2-pentanol
121
2-Methyl-1-propanol
108
2-Methyl-2-propanol
OH
82
2-Naphthol
286
2-Octanol
195
2-Picoline
129
3-Amino-1-propanol
188
3-Nitrobenzoic acid
341
4-Chlorophenol
220
4-Methyl-2 pentanol
132
4-Nitrophenol
279
26
4-Nitrotoluene O2N
CH3
238
Acenaphthene
280
Acetamide
222
Acetanilide
304
Acetic Acid
118
Acetic anhydride
139
Acetone
56.5
Acetophenone CH3
O
202
Alpha pinene
155
Amyl acetate
148
Aniline
186
Aspirin
140
Benzene
80.1
27
Benzoic Acid
249
Benzonitrile
191
Benzophenone
305.4
Benzyl Alcohol OH
205
Benzyl bromide Br
198
Benzyl chloride Cl
179
Biphenyl
255
Bromobenzene Br
156
Butyric acid
163.5
Butyronitrile
N
CH3
117
Caffeine
178
Chloroacetic acid
189
Chlorobenzene Cl
132
28
Cyclohexane
80.7
Cyclohexanol
161
Diiodomethane
181
Diisopropylamine
84
Dimethyl carbonate
90
Ethanol
CH3 OH
78.5
Ethanolamine NH2
OH
170
Ethyl Acetate
77
Ethyl Acetoacetate
180.8
Ethyl benzoate
213
Ethyl decanoate
245
Ethyl benzene CH3
136
Ethylene glycol OH
OH
195
Formamide NH2
O
H 210
29
Formic acid OH
O
H 107.3
Imidazole NH
N 256
Indole NH
254
Iodobenzene I
189
Iso-pentyl acetate
287.6
Isoquinoline
242
L Menthol OHCH3
CH3
CH3
212
Lactic acid
122
Malonic acid
140
Mesitylene
164.7
Methyl Acetate
56.9
Methyl Benzoate
199.6
Methyl isobutyl ketone
115.9
Methyl-4-hydroxybenzoate
298.6
30
Morpholine
129
m-Toluic acid
263
N,N-Diethylaniline
217
N,N-Dimethylacetamide
165
N,N-Dimethylaniline
194
N,N-Dimethylformamide
153
Naphthalene
218
nitrobenzene
210.9
Nitromethane NO2CH3
100
Nonylamine CH3
NH2
201
N,propyl alcohol CH3
OH
97.2
o-anisaldehyde
238
o-cresol
191
Octanoic acid
237
31
Octylamine CH3
NH2
176
Pentan-1-ol CH3
OH
139
Phenanthrene
332
Phenol OH
181.7
Phenylacetic Acid
265.5
Piperazine NH
NH
146
Piperidine NH
106
Propanoic Acid
141
Propionitrile
97
Propylene Carbonate
240
Pyrazine N
N 115
Pyridine N
115.2
Pyrrole NH
129
32
Quinoline
237
Resorcinol
277
Tetrachloroethylene
121.1
Tetrahydrofuran
66
Toluene
CH3
110.6
Triethyl amine
89.7
Vanillin
285
Xanthene O
312
Illicit and prescription drugs to be studies are methamphetamine, oxycodone, nicotine,
heroin and ketamine. The drugs chemical formula and other information are listed below in
Table 2.3
Table 2.4. Chemical and physical properties of drugs to be studied Compound Chemical
Structure Molecular Formula
Molecular Weight (g/mol)
Boiling Point (ºC)
Methamphetamine
C10H15N 149.23 212
33
Oxycodone
C18H21NO4 315.36 501
Ketamine
C13H16ClNO 237.72 262
Heroin(diacetyl morphine)
C21H23NO5 369.41 273
Nicotine
C10H14N2 162.23 247
Chemical compounds in Table 2.2 have some similar functional groups to the drug
compounds in Table 2.3. HPLC grade (Spectrum chemical Mfg.Corp.), analytical grade
dichloromethane (Spectrum chemical Mfg.Corp.), DMSO, ACN are solvents used to dissolved
drug samples and compounds. Once the retention time of each compound is obtained, equation
(2) is used to solve Abraham solvation parameter model with the retention time of each
compound using the experimental gas-to liquid partition coefficients data( E,S,A,B,L,V) from
literature [49-52]. The software utilized to calculate the process coefficients by multiple linear
regression analysis (MLRA) is the statistical package for social science (SPSS). The SPSS is
software for managing data and calculate a wide variety of statistics. With the use of SPSS, the
processes coefficients are obtained, then the log of calculated retention time are found. Multiple
34
linear regression analysis is a technique that correlates two or more independent variable (x) and
a dependent variable(y) to produce equation coefficients. MLRA is used to construct linear free
energy relationships with the Abraham solvation parameter model. The method of MLRA can be
used with Microsoft excel or SPSS. In order to produce a good quality regression for five
variables, one needs to have at least thirty samples.
2.4 Statistical Analysis
The data analyses are examined with the use of SPSS software and Microsoft excel. First,
each compound is run three times, and then the average of the three run is obtained. Next the
standard deviation is calculated. Standard deviation shows how much variation or dispersion
from the average exists. A large standard deviation indicates that data points are spread out over
a large range of values, therefore poor relationships among data. A low standard deviation
indicates that data points tend to be very close to the mean, thus a good relationship among data.
A low standard deviation is preferable because it shows a good relationship among data. After
the standard deviation, the logs of experimental retention times are calculated. Once the
calculated log and experimental log of retention time are acquired, excel or origin program can
be used to graph the experiment log of retention time on x axis versus the calculated log of
retention time on y axis. The correlation coefficient, r reflects the linear relationship between the
two variables. A positive sign (+1) on the correlation coefficient indicates a positive or direct
correlation between two variables. A negative sign (-1) indicates an indirect correlation between
two variables. The correlation coefficient denoted by r2 or R2 is a measure of the strength of the
straight line or linear relationship between two variables.
35
2.5 Training Sets
Since there are five unknowns (E, S, A, B, L or V) to be solved in the Abraham solvation
model, there is a need of at least five equations to be established in order to determine the solute
descriptors of illicit drugs. The known process coefficients (e, s, a, b, l or v) are used through the
system equations to generate the solute descriptors or molecular descriptors. The process
coefficients for each column are calculated with the help of the SPSS software by multiple linear
regression analysis. The overall sums of squares are set at a minimum to fit the aimed cells of S,
A, and B in excel where A and B are set as unconstrained variable with a values of greater than
or equal to zero since acidity and basicity cannot be negative. The S is set as unrestrained
variable. The method used is the Microsoft excel solver that uses the generalized reduced
gradient (GRG2) algorithm for optimizing nonlinear problems. This algorithm was developed by
Leon Lasdon, of the University of Texas at Austin, and Allan Warren, of Cleveland State
University
36
CHAPTER 3
RESULT AND DISCUSSION
3.1 Result from Each Column Used
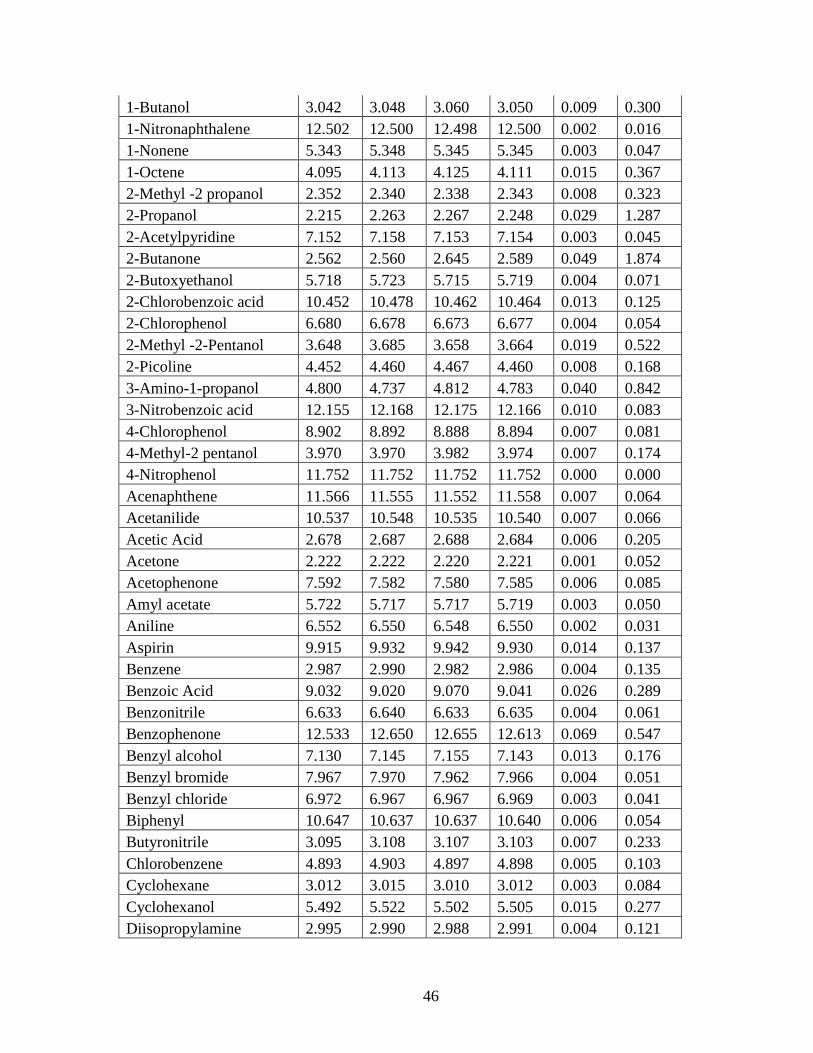
In this experiment, more than one hundred compounds were run. Below is the list of the
three runs, the mean values, the standard deviation and percent relative standard deviation of
each solute on all six columns used. Compounds that are not listed on the table means they did
not elute or their boiling point exceeded the maximum temperature of the column used. Not all
illicit drugs ran on each column. The data for each column are shown in Table 3.1-3.6.
Table 3.1. Retention time (min) for column ZB Wax plus max temperature 250 °C (polyethylene glycol) column
The log of P (eq.25) is combined with the previous six stationary equation (eq.19 to
eq.24) to predict the solute descriptors for illicit drugs.
3.2.3.1 Nicotine
Calculated log of retention time is determine through equation 19 to equation 25 (Table
3.9.1)
Table 3.16. Observed and calculated retention data for nicotine Stationary phase Experimental LogtR Calculated LogtR ZB wax plus 1.075 1.075 Octanol/water 1.170 1.170
The literature solute descriptors for Nicotine are: E= 0.865, S= 0.880, A= 0.000. B=
1.090, L= 5.880, V= 1.371[ref.62]
Table 3.17. Predicted solute descriptors for nicotine Descriptors E S A B L V Values 0.865 0.870 0.000 1.073 5.880 1.371
The solute descriptors in bold are the calculated one. The remaining descriptors obtained
from the literature were kept constant. The standard deviation for the predicted solutes
descriptors for nicotine is 6.23*10-8 log unit. Nicotine did run only on ZB wax plus column; thus
only two stationary equations are represented. The two data set is not enough to conclude. The
calculated A descriptor is 0.000; there is no acidic characteristic in nicotine. Overall nicotine is
considered as a weak base because of the two nitrogen, its B descriptor is 1.073 which displays
basic tendency. Nicotine does also show sign of polarity with the S descriptor of 0.870. Tobacco
is a plant grown for its leaves, which are smoke, chewed for a variety of effects. Nicotine is
contained in tobacco, it’s an addictive substance.
76
N
N
CH3
H
Figure 3.3. Structure of nicotine
3.2.3.2 Oxycodone
Calculated log of retention time is determined through equation 19 to equation 25(Table
3.9.3)
Table 3.18. Observed and calculated retention data for oxycodone Stationary phase Experimental LogtR Calculated LogtR TG 5MS 1.067 1.068 Octanol/water 1.260 1.260
The literature solute descriptors for oxycodone are E= 2.015, S= 2.815, A= 0.286, B=
2.228, V= 2.264
Table 3.19. Predicted solute descriptors for oxycodone Descriptors E S A B L V Values 2.015 2.564 0.286 1.706 5.471 2.264
The solute descriptors in bold are the calculated one. The overall standard deviation for
the predicted solutes descriptors for oxycodone is 8.12*10-7 log unit. The oxycodone did run
only on TG5MS column (5% diphenyl 95% dimethyl polysiloxane). Since there are few data
sets, a good conclusion cannot be made. The oxycodone( Figure 3.4) structure has one hydrogen
that exhibit the acidic characteristic, thus the A descriptor is 0.286. overall the drug is basic
because of the amine group. The nitrogen( strong electronegativity element) also gives the
polarizability characteristic of the drug with S = 2.564, the hydroxide group create a strong base
group with the B value = 1.706. Oxycodone is an opioid, use to treat moderate to severe pain.
77
Figure 3.4. Structure of oxycodone
3.2.3.3 Methamphetamine
Calculated log of retention time is determined through equation 19 to equation 25(Table
3.9.5)
Table 3.20. Observed and calculated retention data for methamphetamine Stationary phase Experimental LogtR Calculated LogtR ZB was plus 1.077 1.130 ZB 35 --- --- TR1MS 0.746 0.798 TR5 0.852 0.854 TG5MS 0.788 0.877 TG1301MS 1.101 0.935 Octanol/water 0.207 0.206
The literature solute descriptors for methamphetamine are Ea= 0.740, Sb= 0.800,
Ac=0.130, Bd= 0.590, Ve= 1.380 a, b, c, d, e(C.West,G. Guenegou, Y. Zhang, L- Morin-Allory,
Insights into chiral recognition mechanisms in supercritical fluid chromatography. II. Factors
contributing to enantiomer separation on tris-(3, 5-dimethylphenylcarbonate) of amylose and
cellulose stationary phases. J. chromatography A 1218(2011) 2018-2057.
Table 3.21. Predicted solute descriptors for methamphetamine Descriptors E S A B L V Values 0.830 0.296 1.570 1.008 3.619 1.380
The values in bold are the calculated solute descriptors. The overall standard deviation
for the predicted solute descriptors for methamphetamine is 0.090 log unit. The A and B
descriptors will depend on the process coefficients a and b and also on the interaction between
78
the solute and the stationary phase. All coefficients reflect differences in the properties of two
phases between which the solute are being transferred. By observing the structure of
methamphetamine (Figure 3.5), there is only one hydrogens that can form hydrogen bond, but
the A descriptors is a little bit high with A= 1.570. The hydrogen bond interaction is highly
dependent on the specific atoms present and on the orientation of the molecule involved in the
interaction. This occurs when a hydrogen atom is covalently bonded to an electronegativity
element such as nitrogen, oxygen, fluorine and at the same time interacting with the lone
electrons on the nearby electronegativity element( or in some case with the π system of aromatic
rings). Also one can expect a higher solute descriptor value of A (hydrogen bond acidic) when
one of the other four solute descriptors (E, S, B, L) is very low. The drug also shows some basic
tendency because of the amine group; with the B descriptor equal 1.008. The nitrogen with the
lone pair also makes the drug a little polar with the S value of 0.296. The A descriptor
characterizes solute hydrogen bond donating ability. If neither phase can donate hydrogen bonds
then the coefficient B will be zero. The Ostwald descriptor L is a combination of solute
properties, one being a general measure of solute size and the second being the ability of a solute
to interact with a solvent phase through dispersion forces. The S descriptor has dipolarity and
polarizability effect within it, so does the L parameter, thus it’s difficult to separate or to
distinguish the exact distribution of polarity, dispersion and induction effects in the coefficient of
these parameters [57, 58]. Methamphetamine improves concentration, energy and alertness while
decreasing appetite and fatigue.
79
Figure 3.5. Structure of methamphetamine
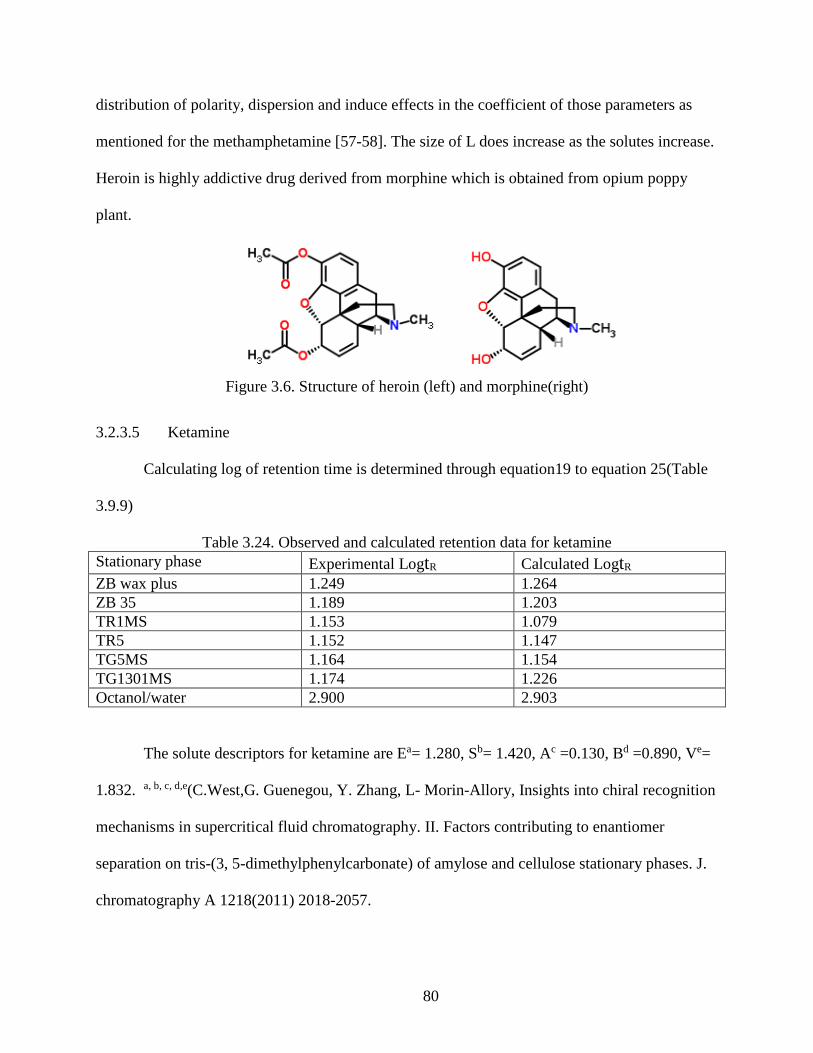
3.2.3.4 Heroin
Calculating log of retention time is determined through equation19 to equation 25(Table
3.9.7)
Table 3.22. Observed and calculated retention data for heroin Stationary phase Experimental LogtR Calculated LogtR ZB wax plus --- --- ZB 35 1.345 1.387 TR1MS 1.278 1.124 TR5 1.280 1.248 TG5MS 1.294 1.244 TG1301MS 1.320 1.486 Octanol/water 1.580 1.586
The literature solute descriptors for heroin are E= 1.530, S= 2.21, A = 0.00, B = 1.92, V
=2.6598
Table 3.23. Predicted solute descriptors for heroin Descriptors E S A B L V Values 1.937 2.224 0.000 2.136 7.021 2.660
The calculated solute descriptors are in bold. The overall standard deviation for the
predicted solutes descriptors for heroin is 0.106 log unit. The structure of heroin (Figure 3.6)
shows that there are no acidic hydrogen, therefore heroin exhibits no acidic characteristic. The A
descriptor is zero, meaning there is no hydrogen bond ability in heroin. The heroin shows some
basicity due to the nitrogen element with the B descriptor value of 2.136. The S descriptor has
dipolarity and polarizability within it, thus the S descriptor value is 2.224. Nitrogen and oxygen
do contribute to the polarizability and dipolarity of heroin. It’s very difficult to discern the exact
80
distribution of polarity, dispersion and induce effects in the coefficient of those parameters as
mentioned for the methamphetamine [57-58]. The size of L does increase as the solutes increase.
Heroin is highly addictive drug derived from morphine which is obtained from opium poppy
plant.
Figure 3.6. Structure of heroin (left) and morphine(right)
3.2.3.5 Ketamine
Calculating log of retention time is determined through equation19 to equation 25(Table
3.9.9)
Table 3.24. Observed and calculated retention data for ketamine Stationary phase Experimental LogtR Calculated LogtR ZB wax plus 1.249 1.264 ZB 35 1.189 1.203 TR1MS 1.153 1.079 TR5 1.152 1.147 TG5MS 1.164 1.154 TG1301MS 1.174 1.226 Octanol/water 2.900 2.903
The solute descriptors for ketamine are Ea= 1.280, Sb= 1.420, Ac =0.130, Bd =0.890, Ve=
1.832. a, b, c, d,e(C.West,G. Guenegou, Y. Zhang, L- Morin-Allory, Insights into chiral recognition
mechanisms in supercritical fluid chromatography. II. Factors contributing to enantiomer
separation on tris-(3, 5-dimethylphenylcarbonate) of amylose and cellulose stationary phases. J.
chromatography A 1218(2011) 2018-2057.
81
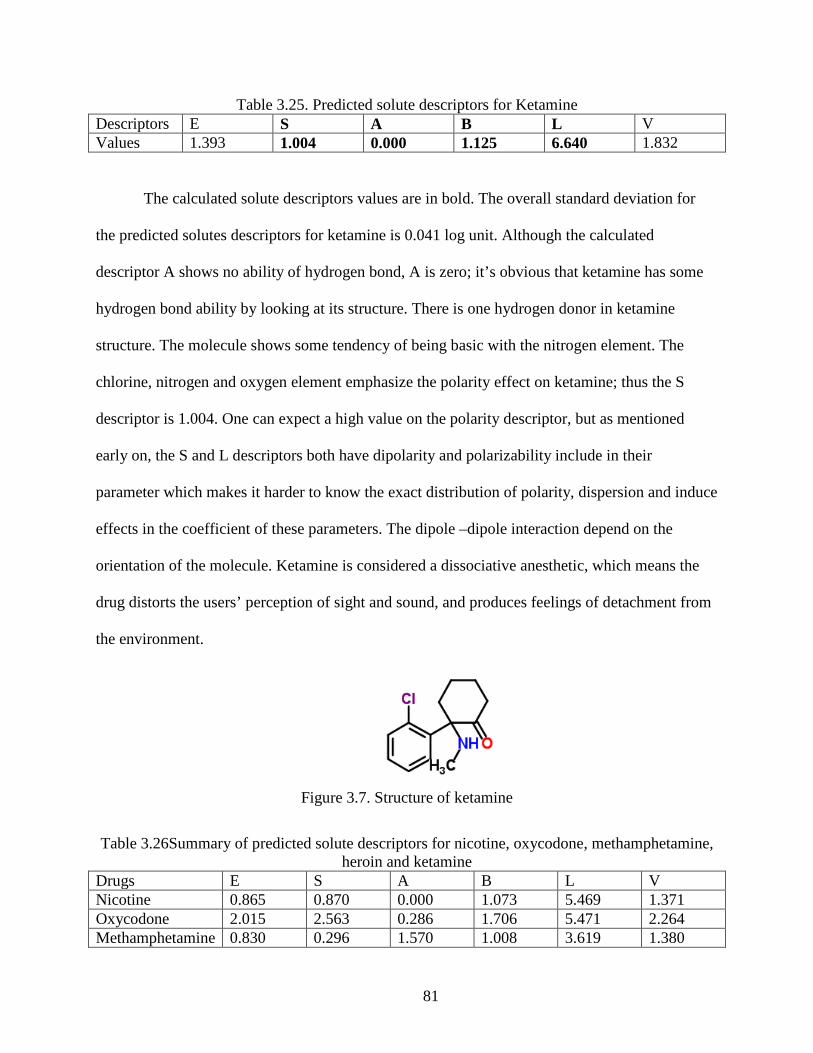
Table 3.25. Predicted solute descriptors for Ketamine Descriptors E S A B L V Values 1.393 1.004 0.000 1.125 6.640 1.832
The calculated solute descriptors values are in bold. The overall standard deviation for
the predicted solutes descriptors for ketamine is 0.041 log unit. Although the calculated
descriptor A shows no ability of hydrogen bond, A is zero; it’s obvious that ketamine has some
hydrogen bond ability by looking at its structure. There is one hydrogen donor in ketamine
structure. The molecule shows some tendency of being basic with the nitrogen element. The
chlorine, nitrogen and oxygen element emphasize the polarity effect on ketamine; thus the S
descriptor is 1.004. One can expect a high value on the polarity descriptor, but as mentioned
early on, the S and L descriptors both have dipolarity and polarizability include in their
parameter which makes it harder to know the exact distribution of polarity, dispersion and induce
effects in the coefficient of these parameters. The dipole –dipole interaction depend on the
orientation of the molecule. Ketamine is considered a dissociative anesthetic, which means the
drug distorts the users’ perception of sight and sound, and produces feelings of detachment from
the environment.
Figure 3.7. Structure of ketamine
Table 3.26Summary of predicted solute descriptors for nicotine, oxycodone, methamphetamine, heroin and ketamine
Drugs E S A B L V Nicotine 0.865 0.870 0.000 1.073 5.469 1.371 Oxycodone 2.015 2.563 0.286 1.706 5.471 2.264 Methamphetamine 0.830 0.296 1.570 1.008 3.619 1.380
The Abraham solvation model is a good approach to predict drugs properties. The
Abraham solvation model parameter can be used to characterize the gas chromatography
stationary phase by providing some important chemical information about the stationary phase.
The Abraham solvation model predicts fairly accurate molecular descriptors. It’s important to
know the drugs properties in order for one to model or study a new drugs. Once the drugs
properties are known from the solute descriptors, we can predict on how drug will interact with
different phase or different system. Then one can understand how the drugs will interact with
some biological barrier. The cost of putting the drugs to the market is very high, by using the
Abraham model solvation equation; one can reduce the time and money that needed to be spent.
The instrument use to acquire the retention time is the gas chromatograph with the flame
ionization detector. Mathematical correlations between the logarithm of retention time of illicit
drugs and the solute descriptors from the Abraham model can be established. Linear free energy
relationship (LFER) of Abraham model predicts retention behavior of most compounds and
drugs by comparing the experimental logarithm of retention data with the calculated logarithm of
retention data. Not all drugs did run on all six columns used in this experiment. Some drugs
have higher boiling point that exceed the maximum temperature of the gas chromatography
column. Some drugs are not volatile enough and can’t be run on GC. The b basicity process
coefficient is not very suitable to found or calculated with the gas chromatography due to the
lack of stationary phase with strong hydrogen bonding ability. In order to improve the accuracy
of the prediction, it’s necessary to have more data point for the drugs. More stationary phase can
also be added to improve the prediction. The HPLC (high pressure liquid chromatography) can
83
also be used to study drugs because of the GC limitation of temperature. This experiment shows
that all linear free energy relationship parameters of solutes may be determined using gas
chromatography or experimental techniques. The solvation model can help facilitate the
prediction of further system properties for compounds lacking experimental values. The
molecular solute descriptors obtained from this experiment have many chemical, biological and
pharmaceutical important properties. The molecular solute descriptors can be used to predict skin
permeability, whether or not the drug can cross the brain blood barrier. The obtained molecular
solute descriptors for the illicit drugs studied in this experiment are important to determine why
such drug can cross the brain easily compared to the other drugs based on the acidity, basicity or
polarity of the drug. The process coefficients are the average value over the range of
temperatures. In this study, we were able to determine the solute descriptors for the illicit drugs
experimentally, not by using software or any computational method.
84
REFERENCES
[1]. William E. Acree, Jr., Laura M. Grubbs and Michael H. Abraham, Prediction of Partition Coefficients and Permeability of Drug Molecules in Biological Systems with Abraham Model Solute Descriptors Derived from Measured Solubilities and Water-to-Organic Solvent Partition Coefficients, Toxicity and drug testing, Prof. Bill Acree (Ed.), ISBN: 978-953-51-0004-1, Intech, 2012.
[2]. C. Keck; S. Kobierski, R. Mauludin, R.H. Muller, Second generation of drug nanocrystals for delivery of poorly soluble drugs: smartCrystal technology, Dosis, 2, 2008, 24, 124-128 .
[3]. A. N. Lukyanov, V. P. Torchilin, Micelles from Derivatives of Water- Soluble Polymers as Delivery systems for Poorly Soluble Drugs, Advanced Drug Delivery Reviews, 2004, 56 (9), 1273-1289.
[4]. E. Lazaro, C. Rafols, M.H.Abraham, M.Roses, Chromatographic estimation of drug disposition properties by means of immobilized artificial membrane and C18 columns, J. Med. Chem., 2006, 49, 4861-4870.
[5] M.H.Abraham, J.M.R. Gola, R. Kumarsingh, J.E. Cometto-muniz, W.S. Cain, Connection between chromatographic data and biological data, Journal of Chromatography B, 2000, 745, 103-115.
[6] Timothy W. Stephens, Matthew Loera, Monica Calderas, Ricardo Diaz, Nicholas Montney, William E. Acree & Michael H. Abraham (2011): Determination of Abraham model solute descriptors for benzoin based on measured solubility ratios, Physics and Chemistry of Liquids, DOI:10.1080/00319104.2011.637628
[7] M.H. Abraham, Chem. Soc. Rev. 23, 73 (1993).
[8] L.M. Sprunger, J. Gibbs, W.E. Acree Jr, and M.H. Abraham, QSAR Comb. Sci. 28, 72 (2009).
[9] L. Sprunger, W.E. Acree Jr, and M.H. Abraham, J. Chem. Inf. Model. 47, 1808 (2007).
[10] Abraham, M. H.; Green, C. E.; Acree, W. E. Jr.; Hernandez C. E.; Roy, L. E., Descriptors for solutes from the solubility of solids: trans-stilbene as an example, J.Chem. Soc., Perkin Trans 2, 1998, 2677-2681.
[11] S. Studzinska., B. Buszewski. Linear Solvation Energy Relationships in the Determination of specific and selectivity Stationary Phases, Chromatographia 2012 75:1235-1246
[12] Paul Van Noort., Estimation of Abraham Solvation equation coefficients for hydrogen bond formation from Abraham solvation parameters for solute acidity and basicity. Elsevier, Chemosphere 90(2013) 344-348
[13] Abraham, M. H., The factors that influence permeation across the blood–brain barrier, Eur. J. Med. Chem., 2004 , 39, 235-240.
85
[14] Zhao, Y. H.; Abraham, M. H.; Hersey A.; Luscombe, C. N., Quantitative relationship between rat intestinal absorption and Abraham descriptors, Eur. J. Med. Chem., 2003 , 38, 939-947.
[15] Jouyban., Sh. Soltanpour., S. Soltani, H.K Chan., W. E. Acree Solubility prediction of drugs in water- cosolvent mixtures using Abraham Solvation parameters. J. Pharm Pharmaceut Sci (www. cspsCanada.org) 10 (3): 263-277, 2007
[16] Abraham, M. H.; Acree, W. E. Jr. Characterisation of the water–isopropyl myristate system, Int. J. Pharm., 2005, 294, 121-128
[17] Mutelet Fabrice, Use of solvation model in gas chromatography chapter 16, 2012
[18] Poole, C.F. Chromatographic and spectroscopic methods for the determination of solvent properties of room temperature ionic liquids. Journal of Chromatography A 2004; 1037 49-82.
[19] Mutelet, F. & Rogalski, M. Experimental determination and prediction of the gas-liquid n-hexadecane partition coefficients J. Chromatogr. A 2001; 923 153-163
[20] Russom, C.L.; Breton, R.L.; Walker, J.D.; Bradury, S.P. An overview of the use of Quantitative structure-activity relationships for ranking and prioritizing large chemical inventories for environmental risk assessments Environ. Toxicol. Chem. 2003; 22 1810-1821
[21] Katritzky, A.R.; Maran, U.; Lobonov, V.S.; Karelson, M. Structurally Diverse Quantitative Structure-Property Relationship Correlations of Technologically Relevant Physical Properties J. Chem. Inf. Comput. Sci. 2000; 40 1-18.
[22] Abraham. H.; Poole, F. Colin; Poole K. Salwa; Classification of stationary phases and other materials by gas chromatography, Journal of Chromatography A, 842(1999) 79-114
[23] Li, Q.; Poole, C. F.; Kiridena, W.; Koziol, W.W. Chromatographic methods for the determination of the logL16 solute descriptor Analyst, 2000; 125 2180-2188.
[24] T.O. Kollie, C.F Poole, Influence of fluorine substitution on the solvation properties of tetraalkylammonium alkanesulfonate phases in gas chromatography, chromatographia vol.33, No 11/12, June 1992
[25]. J Samuel Arey, William H. Green, Jr. Philip M. Gschwend, The electrostatic origin of Abraham’s solute polarity parameter J. Phys.Chem. B 2005, 109, 7564-7573
[26] Kamlet, M.J.; Abboud, J.L. & Taft, R.W. (1977). The solvatochromic comparison method. 6. The π scale of solvent polarities. Journal of the American Chemical Society 1977; 18 (99) 6027-6038.
[27] Kamlet, M.J.; Abboud, J.-L.M.; Abraham, M.H. & Taft, R.W. Linear solvation energy relationships. 23. A comprehensive collection of the solvatochromic parameters, π*, α, and β, and some methods for simplifying the generalized solvatochromic equation. Journal of Organic Chemistry 1983; 17 (48) 2877-2887
86
[28] Kamlet, M.J. & Taft, R.W. Linear Solvation Energy Relationships. Local Empirical Rules or Fundamental Laws of Chemistry? A Reply to the Chemometricians., Acta Chem. Scand., B 1985; 39 611-628
[29] Kamlet, M.J.; Doherty, R.M.; Abraham, M.H.; Marcus, Y. & Taft, R.W. Linear solvation energy relationships. 46. An improved equation for correlation and prediction of Octanol/water partition coefficients of organic nonelectrolytes (Including strong hydrogen bond donor solutes). Journal of Physical Chemistry, (1998); 18 (92) 5244-5255.
[30] Taft, R.W. & Kamlet, M.J. The solvatochromic comparison method. 2. The α-scale of solvent hydrogen-bond donor (HBD) acidities. Journal of the American Chemical Society 1976; 10 (98) 2886-2894
[31] Abraham, M. H & Whiting, G.S. Hydrogen-bonding. Part 22. Characterization of soybean oil and prediction of activity coefficients in soybean oil from inverse gas chromatographic data. J. Am. Oil Chem. Soc., 1992; 69 1236-1238.
[32] Abraham, M.H.; Andonian-Hanftvan, J.; Osei-Owusu, J.P.; Sakellariou, P.; Urieta, J.S.; López, M.C. & Fuchs, R. Hydrogen bonding. Part 25. The solvation properties of methylene iodide. J. Chem. Soc., Perkin Trans. II 1993; 3 299-304.
[33] Park, J.H. & Carr, P.W. Interpretation of normal-phase solvent strength scales based on linear solvation energy relationships using the solvatochromic parameters π*, α and β. J. Chromatogr. 1989; 465 (3) 123-136. [34] Weckwerth, J.D.; Carr, P.W., Vitha, M.F.; Nasehzadeh, A. A comparison of gas-hexadecane and gas-apolane partition coefficients Anal. Chem. 1998, 703712-3716.
[35] Zhang, Y.; Dallas, A. J.; Carr, P. W. Critical comparison of gas hexadecane partition coefficients as measured with packed and open-tubular capillary columns J. Chromatogr. 1993; 638, 43-56.
[36] Li, Q.; Poole, C. F.; Kiridena, W.; Koziol, W.W. Chromatographic methods for the determination of the logL16 solute descriptor Analyst, 2000; 125 2180-2188.
[37] L. Sprunger, A. Protector, W.E. Acree Jr., M.H. Abraham, Characterization of the sorption of gaseous and organic solutes onto polydimethyl siloxane solid-phase microextraction surfaces using the Abraham model, Journal of chromatography A, 2007, 1175, 162-173
[38] Mutelet, F. & Rogalski, M. Experimental determination and prediction of the gas-liquid n-hexadecane partition coefficients J. Chromatogr. A 2001; 923 153-163.
[39] Michael H. Abraham, Garry S. Whiting, Hydrogen Bonding. Part 13.t A New Method for the Characterisation of GLC Stationary Phases-The Laffort Data Set, J. Chem. Soc. Perkin Trans2. 1990 1451-1460
[40] Michael H. Abraham., Application of solvation equations to chemical and biochemical processes, Pure and appl. Chem. Vol.65, N0 12, 1993, pp 2503-2512
87
[41] Laura M. Sprunger Grubbs., Characterization of Novel solvent and Absorbents for chemical separation, May 2011
[42] J.M.Santiuste, J.A. Garcia-Dominguez, Study of the retention interactions of solute and stationary phase in the light of solvation model theory, Analytica Chimica Acta, 2000, 335-346.
[43] William E. Acree, Jr., Laura M. Grubbs and Michael H. Abraham (2011). Selection of Ionic Liquid Solvents for Chemical Separations Based on the Abraham Model, Ionic Liquids: Applications and Perspectives, Prof.Alexander Kokorin (Ed.), ISBN: 978-953-307-248-7
[44] H. M. McNair, J. M. Miller, Basic Gas Chromatography, 1998.
[45] Dr. Aslihan Kerc, GAS CHROMATOGRAPHY, Enve 202 power point presentation.
[46] Dr. Thomas G. Chasteen Split/splitless and on-column gas chromatography injectors notes from Sam Houston State University. http://www.shsu.edu/~chm_tgc/GC/GCinject.html
[47] Agilent J & W GC Column Selection Guide
[48] John V. Hinshaw., The flame Ionization Detector, LCGC North America vol. 23, issue 12 Dec, 2005
[49] Abraham, M. H.; Zissimos, A. M.; and Acree, W. E. Jr., Partition of solutes into wet and dry ethers; an LFER analysis, New J. Chem., 2003 , 27, 1041- 1044.
[50] Abraham, M. H.; Acree, W. E. Jr., The Correlation and Prediction of Butane/Water and Gas/Butane Partition Coefficients, Can. J. Chem., 2005 , 83, 362-365.
[51] Abraham, M. H.; Zhao, Y. H., Characterisation of the water/o-nitrophenyl octyl ether system in terms of the partition of nonelectrolytes and of ions, Phys. Chem. Chem. Phys., 2005 , 7, 2418-2422.
[52] Abraham, M. H.; Martins, F., Human skin permeation and partition: General linear free-energy relationship analyses, J. Pharm. Sci., 2004, 93, 1508-1523.
[53] Sprunger, B.H. Blake-Taylor, A. Wairegi, W.E. Acree Jr., M.H. Abraham, Journal of Chromatography A 1160 (2007) 235-245.
[54] Abraham. H.; Poole, F. Colin; Poole K. Salwa; Classification of stationary phases and other materials by gas chromatography, Journal of Chromatography A, 842(1999) 79-114
[55] T.O. Kollie, C.F Poole, J. chromatogr. 550(1991) 213.
[56] Stovall, D. M.; Givens, C.; Keown, S.; Hoover, K. R.; Rodriguez, E.; Acree, W. E. Jr.; Abraham, M. H., Solubility of crystalline nonelectrolyte solutes in organic solvents: Mathematical correlation of ibuprofen solubilities with the Abraham solvation parameter model, Phys. Chem. Liq., 2005 ,43, 261-268.
[57] M. Vitha, P. W. Carr, The chemical interpretation and practice of linear solvation energy relationships in chromatography, Journal of Chromatography A, 2006, 1126, 143–194.
[58] Abraham, M. H.; Adam Ibrahim, Andreas M. Zissimos, Determination of sets of solute descriptors from chromatographic measurements, Journal of chromatography A, 1037(2004) 29-47.
[59] A.T. James, A.J.P. Martin, Biochem. J. 50 (1952) 679.
[60] A.J.P. Martin, R.L.M. Synge, Biochem. J. 35 (1941) 1358
[61] L. M. S. Grubbs, Characterization of Novel Solvents and Absorbents for Chemical Separations May 2011.
[62] Timothy W. Stephens, Matthew Loera, Amanda N. Quay, Vicky Chou, Connie Shen, Anastasia Wilson, William E. Acree, Jr. and Michael H Abraham, Correlation of solute transfer into toluene and ethylbenzene from water and from gas phase based on the Abraham Model, The open Thermodynamics Journal, 2011,5,104-121